Abstract
Intestinal organoids derived from single cells undergo complex crypt-villus patterning and morphogenesis. However, the nature and coordination of the underlying forces remains poorly characterized. Through light-sheet microscopy and large-scale imaging quantification, we demonstrate that crypt formation coincides with stark lumen volume reduction. We develop a 3D biophysical model to computationally screen different mechanical scenarios of crypt morphogenesis. Combining this with live-imaging data and multiple mechanical perturbations, we show that actomyosin-driven crypt apical contraction and villus basal tension work synergistically with lumen volume reduction to drive crypt morphogenesis, and demonstrate the existence of a critical point in differential tensions above which crypt morphology becomes robust to volume changes. Finally, we identified a sodium/glucose cotransporter specific to differentiated enterocytes that modulates lumen volume reduction via cell swelling in villus region. Altogether, our study uncovers the cellular basis of how cell fate modulates osmotic and actomyosin forces to coordinate robust morphogenesis.
Intestinal crypts, composed of stem cells and Paneth cells, are an essential unit for epithelial homeostasis (1). In both mice and humans, crypts form after the emergence of villi, which include other differentiated cells (2–4). Mouse villus formation is initiated by the mechanical condensation of the mesenchymal cells underneath the epithelium (5), which leads to tissue folding and the establishment of Shh and BMP gradients along the villus-crypt axis (6). The morphogen gradients induce cell differentiation that further promotes the villus morphogenesis (6, 7). While villus morphogenesis has been well studied, less is known about the mechanism of crypt morphogenesis (4, 6, 8, 9). Apical constriction of the intra-villi tissue has been shown to initiate the invagination of the crypts (10, 11), however, the mechanisms of crypt formation and especially the coordination between cell type emergence and tissue morphogenesis remains to be investigated.
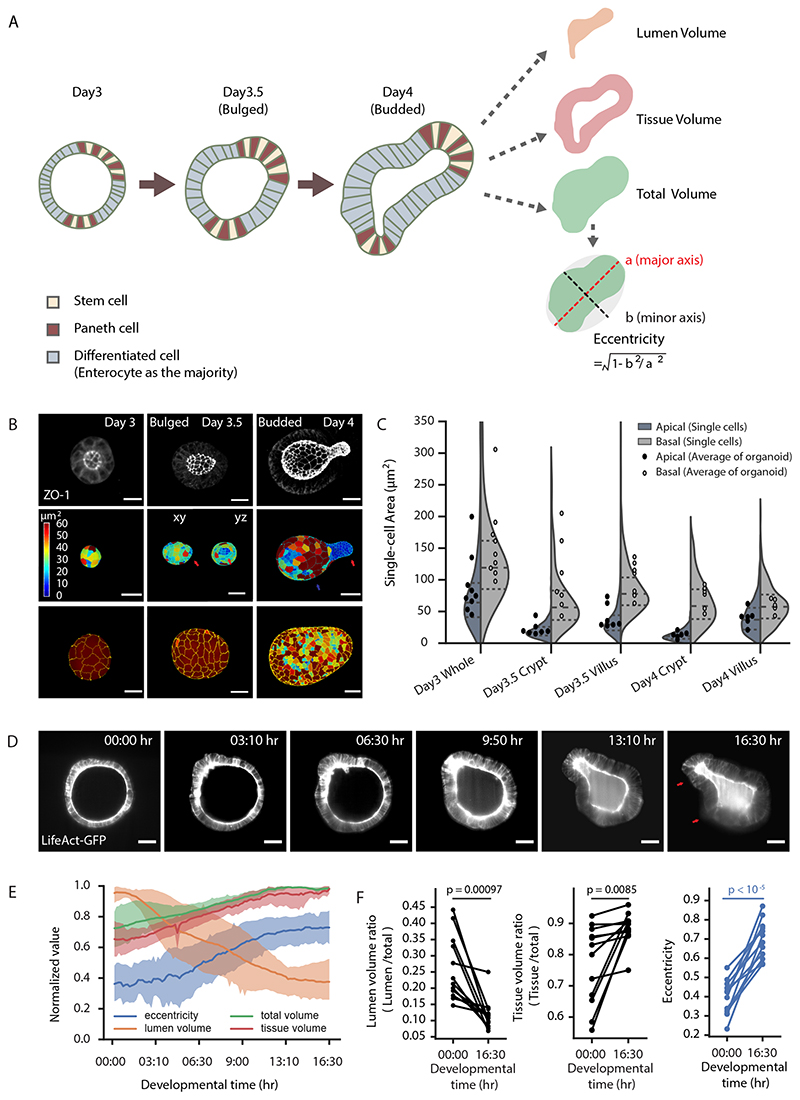
Major challenges in studying intestinal morphogenesis lie in the difficulty of live-imaging and force manipulation, because of the limited accessibility of internal organs. In vitro, mouse intestinal organoids contain functional crypt and villus, which provides an opportunity to overcome these difficulties (12–14). Mouse intestinal organoids develop from single cells via two sequential symmetry breaking events. The first one is at the level of cell-fate, leading to the emergence of the first Paneth cell between the 8 and 32-cell cyst stages under the regulation of Notch and Hippo pathways (15). Paneth cells then induce Lgr-5+ stem cells, after which a small bulge forms around Paneth and stem cells around Day 3 (15, 16). Around Day 4, a crypt buds from the bulge with a narrow neck, and this shape transformation determines the second symmetry breaking event (Fig. 1A). Mouse intestinal organoids share strong similarities with the in vivo tissue including cell type composition, tissue organization and functionalities (14). Interestingly, mouse intestinal organoids are one of the few organoid systems that can recapitulate the shape of the tissue and crypt morphogenesis without in vivo mesenchymal cells (14, 17). Here, we combine 4D multiscale imaging, single-cell RNA sequencing (scRNA-seq), pharmacological and mechanical perturbations with biophysical modelling, to show that cell-fate emergence orchestrates the coordination of mechanical forces via switches in myosin patterns and osmosis. The resulting tissue-scale mechanical responses, which are the differential spontaneous curvature in two regions and the net fluid relocation from lumen to villus cells, determine crypt formation.
Figure 1. Crypt morphogenesis during intestinal organoid development.
A. Cartoon representation of crypt morphogenesis and workflow of image features extraction. B. Segmentation of single-cell apical and basal domains. Representative time-course imaging of ZO-1 staining in Day 3 organoid before bulging (left), Day 3.5 bulged and Day 4 budded organoids in top panels. Segmentation of single-cell apical (middle panels) and basal (bottom panels) domains corresponding to the top panels, Day 3.5 bulged organoid has xy and yz views for apical segmentation. Colour of heatmap indicates size of the domains. C. Violin plot of the size of single-cell apical and basal domains in B (sample number for apical domains, Day 3: 331 cells, Day3.5 crypt: 307 cells, Day 3.5 villus: 739 cells, Day 4 crypt: 550 cells, Day 4 villus: 1005 cells; sample number for basal domains, Day 3: 531 cells, Day3.5 crypt: cells, Day 3.5 villus: 1249 cells, Day 4 crypt: cells, Day4 villus: 1500 cells), and dot plot of the average of the domain size in organoids at Day 3 (n=9 organoids), Day 3.5 (n=7 organoids) and Day 4 (n=6 organoids). P-values in violin plot are calculated from two-tailed t-test, in dot plot are calculated from two-tailed Paired Student’s t-test (see Statistics and reproducibility). Plot lines denote quartile for each group. D. Representative time-lapse imaging of crypt bulging and budding. E. Plot for eccentricity, lumen volume, tissue volume and total volume of organoids in recording in D (n=4 independent recordings). Solid lines represent average values, shadow regions represent standard deviations. F. Quantification of the lumen ratio (Lumen/total), tissue ratio (Tissue/total) and eccentricity before bulging (00:00 hr) and after budding (16:30 hr). P-values are calculated from two-tailed Paired Student’s t-test (n=12 organoids). Red arrows in B and D indicate crypt regions. Scale bars in B and D, 20 μm. Images in B and D are representative of three independent experiments.
Crypt budding follows tissue tensions and lumen shrinkage
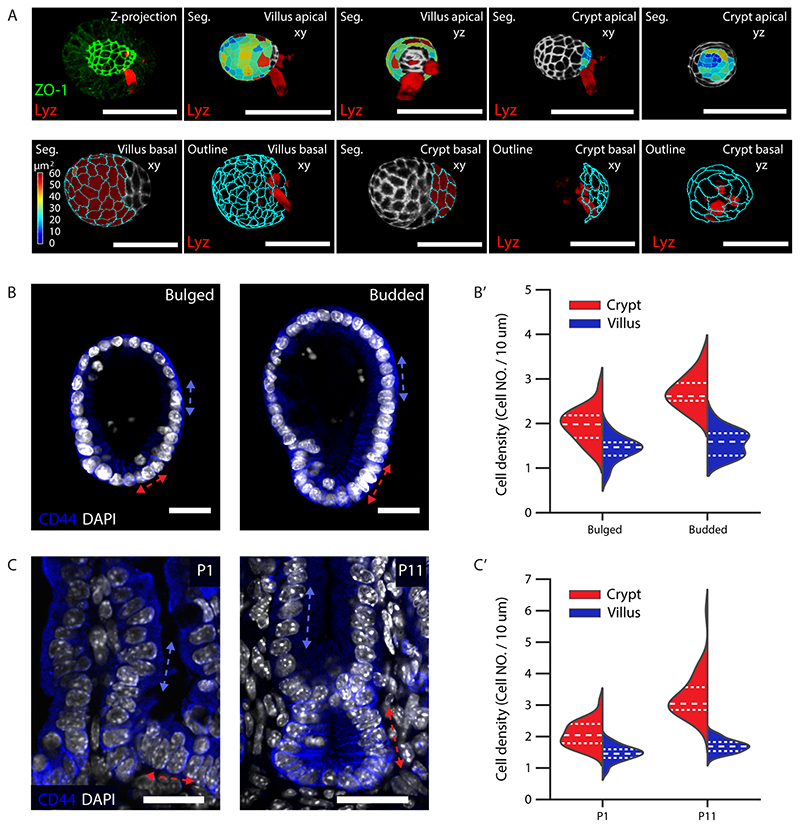
Crypt apical constriction initiates crypt morphogenesis in vivo (11). To investigate the global morphological changes occurring during crypt formation in organoids, we followed their formation with image based time-course experiments at high spatial-temporal resolution at Day 3, 3.5 and 4 (15) (Fig. 1A and B). We quantified the sizes of cell apical and basal membrane domains via segmentation of the tight junction protein ZO-1 (Fig. 1B and Extended Data Fig. 1A). The apical domain of cells in crypts progressively get smaller (both in absolute terms and compared to villi), showing that crypt cells undergo apical constriction, from a “bulged” state (Fig. 1B and C). In coordination with apical constriction, the crypt monolayer compacts, as shown by increased cell density from bulged to budded (Extended Data Fig. 1B–B’), a feature conserved during in vivo crypt morphogenesis (Extended Data Fig. 1C and C’). Interestingly, in the villus monolayer, the basal domain of cells reduced its size from Day 3.5 bulged to Day 4 organoid (Fig. 1B and C), indicating a basal constriction in cells from villus, at a “budded” stage.
To monitor the dynamics of tissue morphological changes during crypt formation, we performed light-sheet time-lapse recording on organoids expressing LifeAct-GFP (live reporter of F-actin) (18). Strikingly, crypt budding also correlated with a dramatic change in lumen volume (Fig. 1D–F and Supplementary Video 1). To systematically quantify the phenotypes over 100 time-points in each sample, we measured both lumen volume and organoid shape (Fig. 1D–F), confirming that a significant lumen shrinkage occurs during crypt budding. However, this is compensated by larger volume increase of the epithelium, while the organoid total volume (lumen + cells) increased slightly during morphogenesis (Fig. 1D–F). This suggests that the shrinkage of the lumen volume could have a mechanical contribution to crypt morphogenesis.
Spontaneous curvature drives crypt morphogenesis
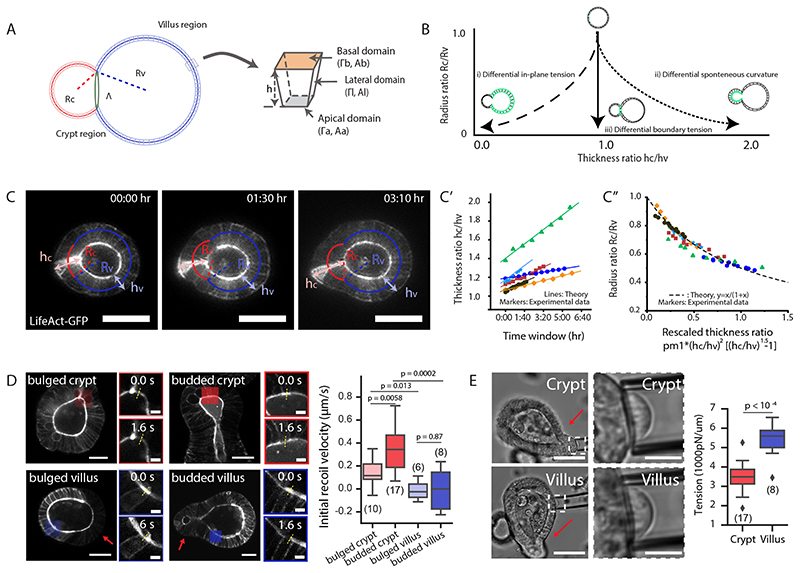
To understand the potential contributions of crypt apical contraction, villus basal constriction or lumen shrinkage to crypt morphogenesis, we turned to a three-dimensional (3D) vertex model (19–22). We modelled organoids as closed monolayers with cells under apical, lateral and basal tensions, enclosing a lumen of fixed volume (Extended Data Fig. 2 and see Supplementary Note (SN)). On timescales of hours/days, we can assume that the evolution is quasi-static, and only examine the equilibrium configuration of organoids in different sizes. Given the above experimental findings, we allow cell basal, lateral and apical tensions to be different in two spatially distinct regions (crypt and villus, Fig. 2A). We then computationally screened parameter-space, to understand how each parameter influences the equilibrium shape, and derived a simplified model which allowed us to predict scaling laws for organoid morphometrics (Fig. 2A). Importantly, we found three classes of mechanisms which could lead to a budded shape (Fig. 2B, Extended Data Fig. 3A–A”, see SN): i) buckling-type instability, where crypts have smaller in-plane contraction α than villus and thus tend to expand, which is constrained by luminal fluid, ii) differential spontaneous curvature γ in crypt vs. villus, leading to crypt bending, iii) contractile boundary of the crypt-villus region, leading to bulging and budding via boundary contraction. We note that the term “spontaneous curvature” is used in analogy with the physics of lipid membranes, as synonymous to “intrinsic” curvature. We found that each class of mechanisms gave rise to qualitatively different predictions on crypt morphometric, e.g., the ratio of epithelial thickness or of curvature in crypts vs. villi (see SN). For instance, in scenario i), morphogenesis occurs via differential expansion of the budded region, leading to lower epithelial thickness in crypt compared to villus, which is similar to observations during lung buds/alveoli formation (23), while in scenario ii), bulging and budding occurs via tissue bending, which increases the epithelial thickness in crypts (Fig. 2B and Extended Data Fig. 3A–A’). The main difference in the three scenarios is therefore the evolution of epithelial thickness ratios (Fig. 2B and Extended Data Fig. 3A–A”).
Figure 2. Region-specific spontaneous curvature drives crypt morphogenesis.
A. Schematic of the morphometric parameters for 3D organoids. R c, radius of curvature in crypt; Rv,radius of curvature in villus; h, height of cell along apical-basal axis represents tissue thickness, h c, crypt thickness, hv, villus thickness (see SN for details). B. Three possible mechanical scenarios that could drive crypt morphogenesis as a function of time (indicated by arrow). Green lines indicate the driving forces. C-C”. Experimental data validate model ii). C, time-lapse recording of representative organoid during bulging. Experiment was repeated more than 3 times independently with similar results. C’, thickness ratio (h c/h v) from six experimental samples with the model fit. C”, different samples collapse on the same theoretical master curve independent of time (R c/R v vs. a function of h c/h v). D. Test of apical tensions in bulged and budded organoids. Left panel, images of organoids visualized by LifeAct-GFP (white) in single sections before laser cutting, zoom-in areas from the coloured regions before (0.0s) and after (1.6s) laser cutting. Yellow dashed lines indicate the position of cutting on apical domains. Right panel, quantification of the initial recoil velocities. Sample numbers: bulged crypt (n=10 independent cuttings), budded crypt (n=17 independent cuttings), bulged crypt (n=6 independent cuttings), budded villus (n=8 independent cuttings). E. Test of basal tension in bulged and budded organoids. Left panel, imaging of micropipette aspiration on the basal side with zoom-in regions indicating in the white dashed rectangles. Right panel, quantification of basal tensions. Sample numbers: crypt (n=17 organoids), villus (n=8 organoids). P-values (D and E) are calculated from two-tailed t-test. Box-plot elements show 25% (Q1, upper bounds), 50% (median, black lines within the boxes) and 75% (Q3, lower bounds) quartiles, and whiskers denote 1.5× the interquartile range (maxima: Q3 + 1.5× (Q3-Q1); minima: Q1-1.5× (Q3-Q1)) with outliers (rhombuses). Scale bars: C (25 μm), D (organoid, 25 μm; zoom-in, 5 μm), E, (organoid, 50 μm; zoom-in, 10 μm). Images in D and E are representative of three independent experiments.
We then analysed the dynamics of bulging and found that only scenario ii), namely the differential spontaneous curvature γ driven crypt bulging, agreed with the experimental data, as we detect the increased thickness ratio (hc/hv) and the decreased radius ratio (Rc/Rv). This confirms that crypt apical constriction and spontaneous curvature are a major driving force for crypt morphogenesis (Fig. 2C–C”, Extended Data Fig. 3B, see SN). Importantly, plotting (R c/R v) as a function of (h c/h v) was predicted to follow a simple decreasing curve, independent of the dynamics of tension evolution (Fig. 2C” and Extended Data Fig. 3C). Comparing this with the data revealed a good agreement with the predicted curve (with a single fitting parameter being the initial lumen volume v 0, see SN), allowing us to validate the spontaneous curvature mechanism. Furthermore, independently measuring organoid and crypt sizes, and assuming a linear increase of crypt apical tension in time allowed a good fit of the individual temporal evolutions of ratios (R c/R v) and (h c/h v) (Fig. 2C–C”, Extended Data Fig. 3C–H and SN). Next, we further tested the model via mechanical measurements, as well as mechanical and pharmacological perturbations.
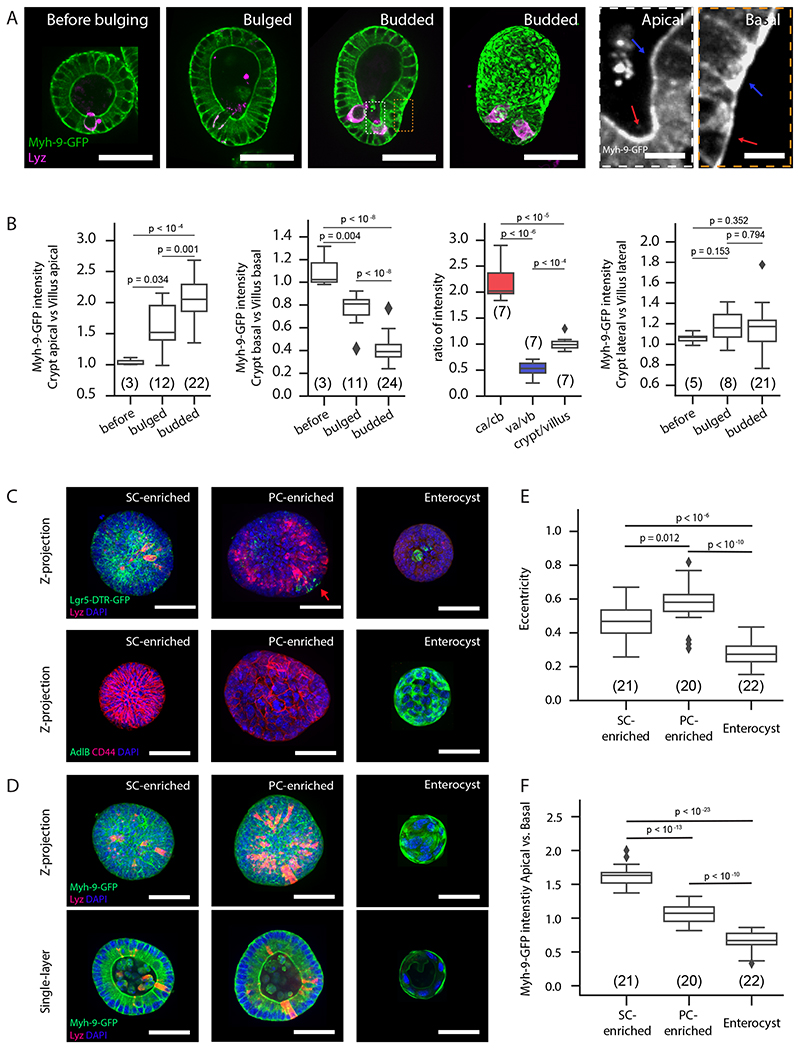
Figure 3. Myosin patterns in stem cells and enterocytes determine region-specific spontaneous curvature.
A. Myh-9-GFP in organoid before bulging, bulged, and budded organoids in the middle section, maximum z-projection in budded organoid, and zoom-in areas from dashed boxes. B. Plots for ratios of Myh-9-GFP intensity in cells. Abbreviations: ca, crypt apical; cb, crypt basal; va, villus apical; vb, villus basal. Arrows: villus (blue), crypt (red). C-F. Stem cell fate is responsible for apically enriched Myh-9 in crypt. C-D. Representative images for organoids treated by CHIR and VPA and enriched with stem cells (SC-enriched), treated by CHIR and DAPT and enriched with Paneth cells (PC-enriched) or enriched with enterocyte (enterocyst). C. Maximum z-projection of Lgr-5-DTR-GFP organoids with Lyz and DAPI staining (upper panels) and wild-type organoids with CD44, AdlB and DAPI staining (lower panels). D. Maximum z-projection (upper panels) and single-layer (lower panels) images of Myh-9-GFP organoids with Lyz and DAPI staining. E. Quantification of eccentricity from Maximum z-projection images in D. F. Quantification of Myh-9-GFP intensity from single-layer images in D. For box plots B, E, F n numbers are stated in brackets and represent organoids selected for multiple single-cell (B) or whole organoid (D) measurements. P-values (B, E and F) are determined by two-tailed t-test. Box-plot elements show 25% (Q1, upper bounds), 50% (median, black lines within the boxes) and 75% (Q3, lower bounds) quartiles, and whiskers denote 1.5× the interquartile range (maxima: Q3 + 1.5× (Q3-Q1); minima: Q1-1.5× (Q3-Q1)) with outliers (rhombuses). Experiments in A and C-E were repeated >3 times independently with similar results. Scale bars: A (organoid, 50μm; zoom-in, 5 μm), C and D (50 um).
Myosin II patterns induce tissue spontaneous curvatures
To quantify apical tensions, we performed laser nanosurgery on the apical domains of bulged and budded organoids (24). The analysis showed higher recoil velocities in crypt apical domains, and thus, apical contraction in crypt is higher than the villus (Fig. 2D and Extended Data Fig. 4A). Interestingly, the crypt apical tension significantly increases from bulged to budded stages. Through micropipette aspiration experiments (25), the basal tension of the villi was higher than in the crypts (Fig. 2E). The combination of high apical contraction and low basal tension in crypt is thus fully consistent with the prediction of the model in which spontaneous curvature drives crypt morphogenesis (see SN).
Based on the actomyosin role in generating active tension (26), we investigated if patterns of F-actin and Myosin correlate with tension and spontaneous curvature that the model predicts. LifeAct-GFP and the phosphorylated Myosin Light chain (pMLC), which binds to Myosin II heavy chain and generate contractile force, are enriched in the villus basolateral domain and the apical domain of both crypt and villus (Extended Data Fig. 4B and C). However, in villus apical domains, F-actin and pMLC do not necessarily contribute to apical contraction, but are likely required for microvilli formation (27). To follow the dynamics of Myosin we generated an organoid line from the Myh-9-GFP mouse (28, 29). We found that Myh-9-GFP gradually increases at the crypt apical side as organoids evolve from spherical to bulged and budded (Extended Data Fig. 4D and Supplementary Video 2). In contrast to Myh-9-GFP patterns, the membrane reporter (mG) gradually increases at villus apical side, indicating that Myh-9-GFP increase is not an artefact due to tissue compaction (Extended Data Fig. 4E) (30). Moreover, in budded organoids, the expression pattern of Myh-9-GFP is high in crypt apical and villus basolateral domains, low in crypt basolateral and villus apical domains (Fig. 3A and B, Extended Data Fig. 4D and Supplementary Video 2). On the other hand, the lateral Myh-9-GFP did not change in region-specific manner (Fig. 3A and B). These Myh-9-GFP patterns are in agreement with region-specific tension changes predicted by the spontaneous curvature mechanism (see SN).
We next tested whether actomyosin is functionally required for crypt morphogenesis. In mouse intestinal organoids, although inhibiting myosin increases organoid survival (31), blocking actomyosin contractility at Day 3 before bulging prevents crypt morphogenesis (Extended Data Fig. 4C) (10). Moreover, inhibiting myosin activity after budding disrupted the crypt morphology (Extended Data Fig. 4F, Supplementary Video 3 and 4), while blocking cell division (via Aphidicolin) did not (Extended Data Fig. 4F, Supplementary Video 3 and 5). This is consistent with actomyosin-driven spontaneous curvature driven crypt morphogenesis, rather than residual stresses from crypt cell proliferation (see SN for details). Nonetheless, since Myosin IIA exhibits a differential pattern in crypt and villus, we validated Myosin IIA involvement in the generation of spontaneous curvature. We constructed mosaic organoids composed of Myh-9+/- heterozygous mutant cells and Myh-9-GFP cells (32) (Extended Data Fig. 4G–G”). In villus, the Myh-9+/- cells adjacent to Myh-9-GFP cells have an expanded basal domain, while the Myh-9-GFP cells contract basally, indicating that Myosin IIA is required for the generation of basal tension which propagates to neighbouring cells (Extended Data Fig. 4G–G”), and contribute to crypt morphogenesis by creating a reverse spontaneous curvature (see SN). Thus, domain-specific patterns of Myosin IIA modulate cell apical and basal tensions in both crypt and villus, which in turn determine tissue spontaneous curvatures.
In villus, enterocytes (which constitute the majority of villus cells) correlate with basal-enriched Myh-9-GFP and basal tension. In crypts, whether Paneth or stem cells provide the dominant contribution to spontaneous curvature is unclear. Thus, we compared apical Myh-9-GFP levels in enterocyst, in organoids enriched in Paneth cells (PC-enriched organoid, treated with CHIR and DAPT), or in organoids enriched in stem cells (SC-enriched organoid, treated with CHIR and VPA) (Fig. 3C–F). Compared to enterocysts (that have more basal Myh-9-GFP, matching villus cells in organoids), the PC-enriched organoids and SC-enriched organoids both have higher apical Myh-9-GFP (Fig. 3D and F). Interestingly, SC-enriched organoids have an even higher apical vs. basal Myh-9-GFP ratio than PC-enriched organoids, arguing that stem cells provide the dominant contribution to spontaneous curvature. In the PC-enriched organoids, few Lgr5+ stem cells remain, and generate higher regional spontaneous curvature, leading to local bulges (Fig. 3C and E). Altogether, these results argue that stem cells in crypt tissue are the dominant factor in creating the actomyosin-based apical constriction necessary for morphogenesis.
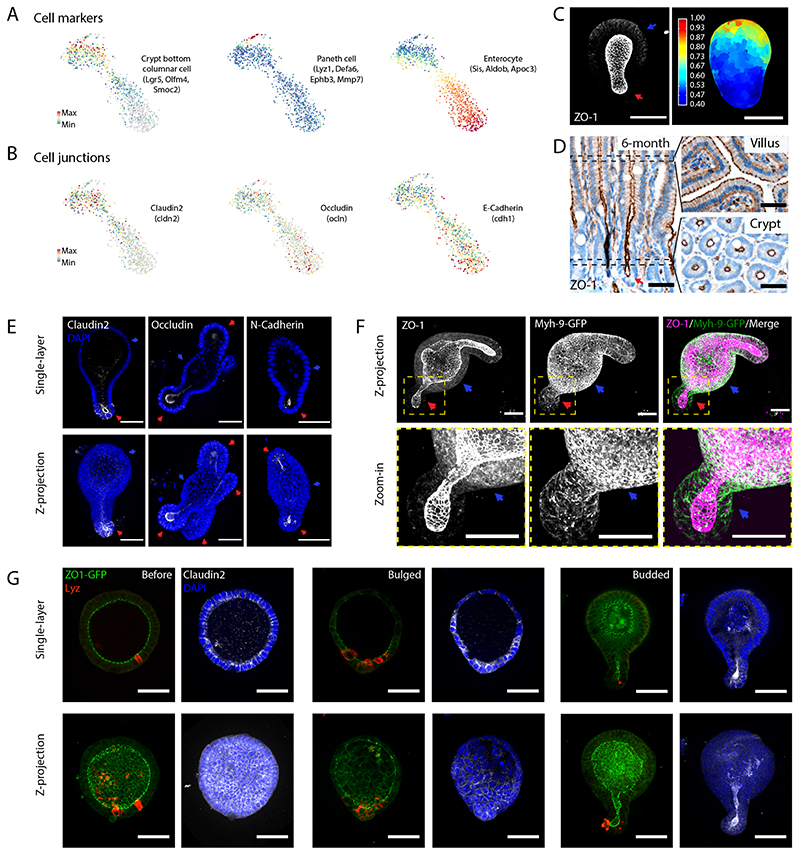
To explore the molecular mechanism that contributes to the emergence of the region-specific actomyosin pattern, we analysed the expression patterns of actomyosin regulators, with scRNA-seq dataset that distinguishes crypt and enterocyte-rich villus regions (Fig. 4A and B), and by immunostaining (Fig. 4C–G) (15). An interesting candidate is the tight junction protein ZO-1 that orchestrate the apical organization of actomyosin in mouse intestine (33). We detected the region-specific expression patterns from both tight junction proteins (ZO-1, Claudin2, Occludin) and adherens junction proteins (N-Cadherin) (Fig. 4E). In crypt morphogenesis, Claudin2 is gradually enriched in the maturing crypt (Fig. 4G), while ZO-1 is expressed at the whole epithelial apical side and overlaps with the basal pool of Myh-9-GFP in villus region (Fig. 4C–G). In in vivo crypt morphogenesis, the restriction of Claudin2 to crypt region has been detected from postnatal stage 11 (P11), at which stage ZO-1 also starts to exhibit villus basolateral localization (Extended Data Fig. 5). The in vitro and in vivo data suggests that region-specific junction proteins in crypts and villi co-ordinately contribute to the differential tissue properties and the patterning of actomyosin that is necessary for crypt budding.
Figure 4. Region-specific localization of cell junctions.
A-B. Single-cell RNA sequencing analysis of budded organoid. TSNE-based visualization of single-cell degree of expression of marker genes for cell types (stem cells/Crypt columnar cells, Paneth cells and enterocytes) (A), and cell junctions (Claudin2, Occludin and E-Cadherin) (B). C. ZO-1 staining in budded organoid in maximum z-projection (left panel), and heatmap visualization of basal signal (right panel). D. ZO-1 staining in 6-month mouse intestine in section along crypt/villus axis, and perpendicular sections of villus and crypt regions along the positions indicated by black dashed rectangles. E. Middle single-layer section and maximum z-projection of the Claudin2, Occludin and N-Cadherin staining with DAPI staining for cell nuclei (blue). F. Co-localization of ZO-1 and Myh-9-GFP in cell basolateral domains in villus region. From left to right: Z-projection (upper panels) and zoom-in region (lower panels) of ZO-1, Myh-9-GFP, and merged ZO-1 and Myh-9-GFP. G. Single-layer section and maximus z-projection of ZO-1 (merged with Lyz) and Claudin2 (merged with DAPI) co-staining in organoid before bulging, bugled and budded organoids. Arrows: red arrows indicate crypt regions; blue arrows indicate the villus regions. Experiments in C-G were repeated more than 3 times independently with similar results. Scale bars, 50 μm.
Lumen volume reduction accelerates crypt budding
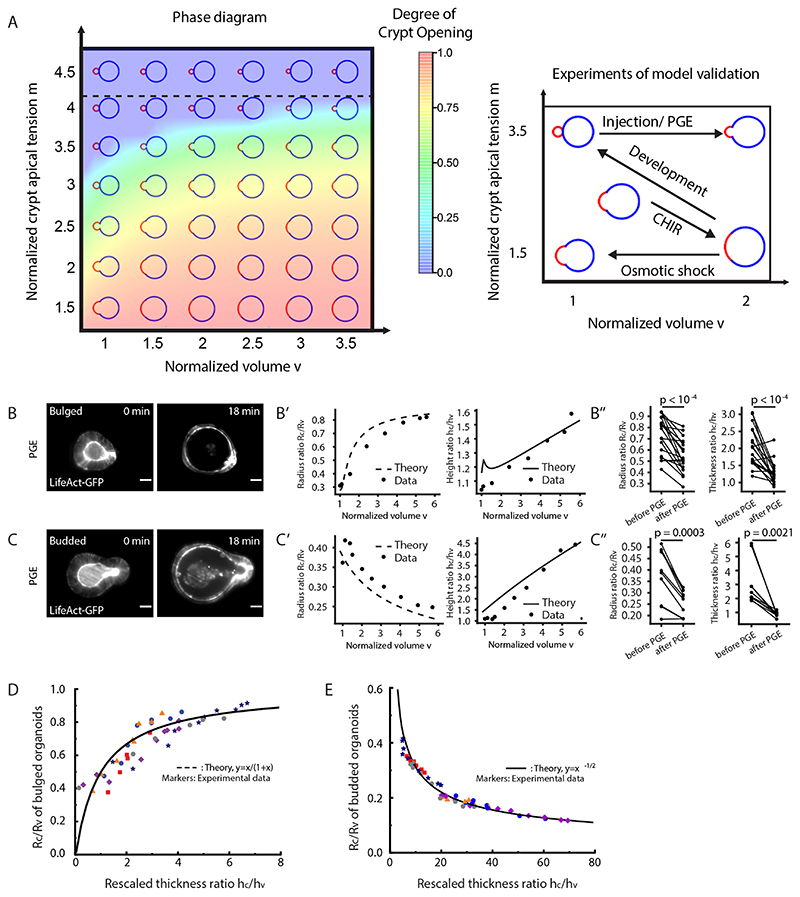
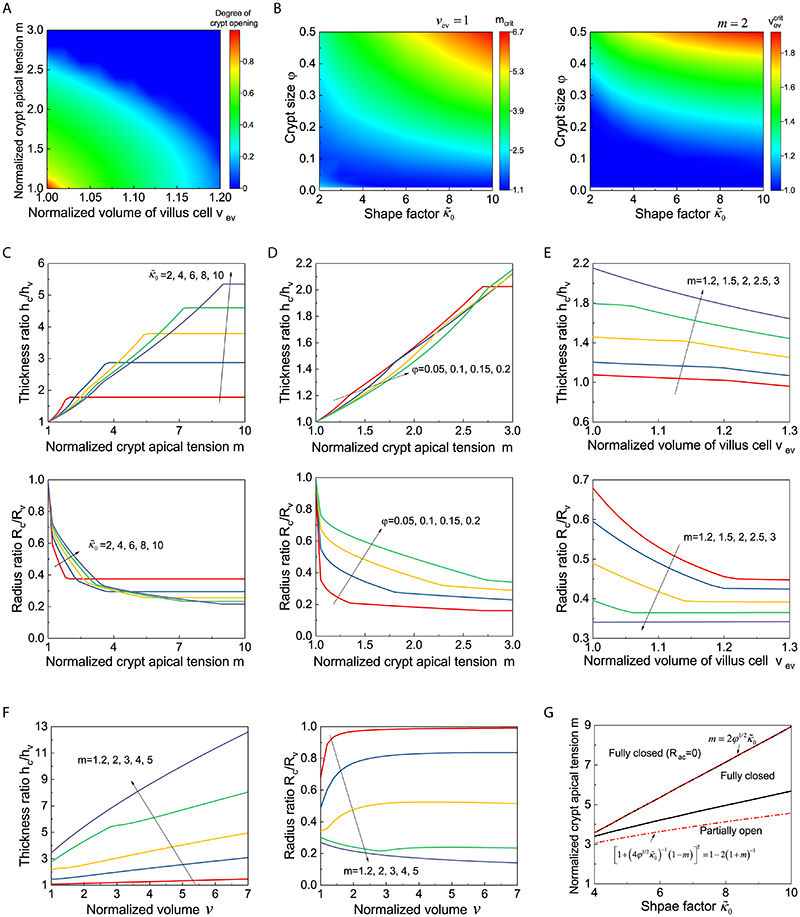
Next, we investigated whether the striking decrease in lumen volume at the onset of crypt budding (Fig. 1D–F) had a functional role for crypt formation. We hypothesized that, in analogy to lipid vesicles with region-specific spontaneous curvature (34), lumen volume reduction could contribute to budding by changing the area/volume ratio of the organoid, thus helping out-of-plane deformations. We computed a phase diagram of organoid morphology as a function of normalized lumen volume and relative crypt apical tension (Fig. 5A, Extended Data Fig. 6 and SN). For constant lumen volume, crypts undergo bulging and then budding for increasing values of crypt apical tension (Extended Data Fig. 2D). For low apical tension, increasing lumen volume above a critical threshold (Fig. 5A) ‘unfolds’ the budded crypt into spherical shapes, as expected in lipid vesicles (34). Unexpectedly, for high values of apical tension, the model predicted that budded shapes cannot be reversed by increasing lumen volume (Fig. 5A). Theoretically, this is because high apical tension increases not only spontaneous curvature in crypts, but also in-plane rigidity (which resists deformation of crypts and results in preferential expansion of villi to bear the lumen-induced deformation). This prediction of a phase transition provides a critical test of the model. Moreover, the fits of bulging evolution (Fig. 2C–C”) predict that bulged organoids are below the transition point (around 40% of the critical apical tension m crit at which crypts remain closed upon large inflation, see SN) in the phase diagram of Fig. 5A, whereas budded crypts should be able to sustain large luminal inflation given their two-fold increase in crypt apical Myosin (Fig. 3A and B) and tension (Fig. 2D and Extended Data Fig. 4A). We thus tested this by experiments manipulating lumen volume (Fig. 5A) as a probe of the material properties of crypt and villus regions.
Figure 5. Lumen volume reduction promotes crypt budding.
A. Theoretical prediction (, φ=0.2) for the relative contribution of the crypt apical tension (m) vs. lumen volume (v) for organoid shape (left panel), and schematic representing the experimental designs for phase diagram validation (right panel). The horizontal dashed line at m = 4.2 indicates the critical value, above which the budded shapes cannot be reversed by increasing lumen volume. B-C”. Fitting for the lumen inflation experiments with the theoretical model. Images show organoid morphology before and after lumen inflation by PGE treatment of bulged (B) and budded (C) organoids with tissue and lumen visualized by LifeAct-GFP (white). Scale bars, 20 μm. Experimental measurements (black dots, data) from the representative samples (epithelial thickness ratio h c/h v and radius ratio R c/R v , B’ for B, bulged organoid, C’ for C, budded organoid) as a function of lumen volume (v) change were fitted from the model (black lines, see SN for details and best-fit values). Budded crypts systematically remained near-unchanged by inflation (decreased radius ratio R c/R v) (B’), while bulged crypts opened up (increased radius ratio R c/R v) (C’). Plots, measurements of epithelial thickness ratio and radius ratio in bulged (B”, n=9 biologically independent samples) and budded (C”, n=10 biologically independent samples) organoids. P-values are calculated from two-tailed Paired Student’s t-test. D-E. All samples from PGE and pipette inflation (bulged: D, budded: E) can be collapsed via fitting of two parameters (see Supplementary Note) on the same theoretical master curve (R c/Rv vs. a function of h c/h v) independent of volume as predicted by the model (black line), showing opposite trends in bulged (D) vs. budded (E). Images in B and C are representative of three independent experiments.
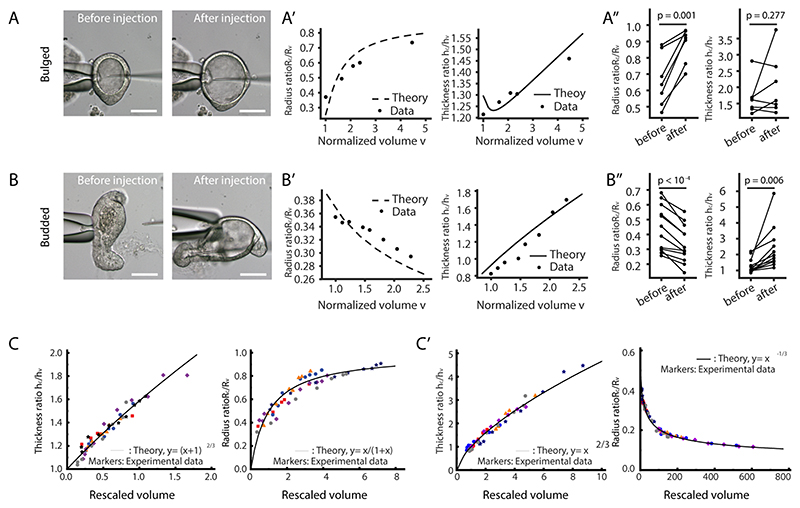
We first inflated the lumen in less than 30 minutes by treating bulged and budded organoids with Prostaglandin E2 (PGE), which induces lumen swelling without altering cell fate in the first 6 hours (35, 36), and measured several morphometric parameters as a function of lumen volume (Fig. 5B–C” and Supplementary Video 6). Crucially, we found that budded crypts could not be opened by PGE treatment (even increasing volume up to 498%, which stretches nearly exclusively the villus region, leading to decreasing radius ratio R c/R v, Fig. 5C–C”). In contrast, volume expansion in bulged crypts lead to a near-spherical shape (increasing radius ratio R c/R v, Fig. 5B–B”), in excellent agreement with the prediction that bulged and budded crypts react distinctly to lumen inflation. To further confirm this, we performed fluid microinjection to rapidly and controllably increase lumen volume, and also confirmed the opposite response of bulged vs. budded organoids (Extended Data Fig. 7A–B” and Supplementary Video 7). This provides a key qualitative test of the spontaneous curvature mechanism that we propose. Other mechanisms, such as budding via crypt cell proliferation or crypt cell expansion (i.e., buckling, which has been examined theoretically in the past (21-22)), would predict a qualitatively different behaviour of crypt opening upon inflation (see SN).
To test this quantitatively, we analytically derived scaling laws to predict how thickness and radius ratios (crypts/villus, resp. h c/h v and R c/R v) should vary as a function of lumen volume, for bulged and budded organoids. To constrain the predictions, we experimentally measured the geometric parameters of the model in pre-inflation organoids (the fraction occupied by crypt cells and the organoid aspect ratio, see SN). Strikingly, upon fitting of two parameters (crypt apical tension m and initial lumen volume v 0, which gave values consistent with the ones fitted from Fig. 2C, see SN), all inflation data could be collapsed onto these predicted scaling laws (Extended Data Fig. 7C and C’), providing good agreement between theory and experiments, including opposite trends of the radius ratio R c/R v as a function of volume in bulged vs. budded crypts (Extended Data Fig. 7C and C’). With the same parameter set, the model also predicted simple scaling relationships between R c/R v and h c/h v , independent of lumen volume (see SN), which again were in excellent agreement with the data (Fig. 5D and E).
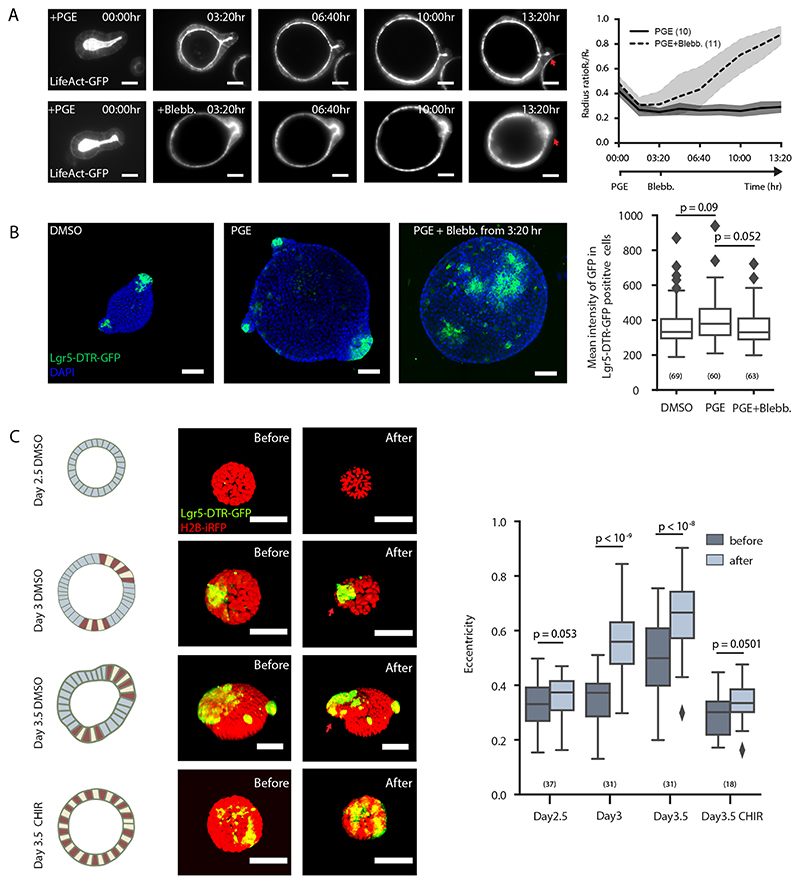
Furthermore, our model predicts that lowering contractility in budded organoids should allow lumen pressure to open up the crypt again as in bulged organoids. We confirmed this by repeating the PGE inflation experiment with blebbistatin, which led to budded crypt opening without perturbing stem cell fate (Fig. 6A and B, Supplementary Video 8). Finally, we decreased lumen volume experimentally, in order to achieve an opposite effect than lumen inflation (Fig. 5A, B and C, Extended Data Fig. 7A and B). Four types of organoids were treated with osmotic shock: i) Day 2.5 organoids without crypt/villus regional difference, ii) Day 3 spherical organoids with established regional difference in crypt and villus, iii) Day 3.5 bulged organoids, and iv) Day 3.5 spherical organoids treated with CHIR that only consist of crypt region (Fig. 6C) (15). Seconds after the osmotic deflation, the Day 3 spherical organoids formed bulges and Day 3.5 bulged organoids formed buds in the crypt regions enriched in Lgr-5+ stem cells, while the Day 2.5 and Day 3.5 CHIR-treated organoids remained spherical and did not display significant bulging (Fig. 6C). This provides direct evidence that the reduction of the lumen volume can efficiently accelerate crypt morphogenesis in organoids where domains of cellular fate (and thus of spontaneous curvature) already exist.
Figure 6. Coordination of lumen volume reduction and region-specific spontaneous curvature promotes crypt morphogenesis.
A. Actomyosin maintains crypt morphology in inflated budded organoid. Images, time-lapse recording of budded LifeAct-GFP organoid treated with PGE to inflate lumen (upper panel) or PGE (whole time) and Blebbistatin at 3:20 hrs (lower panel). Plot, corresponding plot for radius ratio (R c/R v) of the organoids. Lines in the middle represent the average values, shadow regions represent the standard deviations. B. Lgr5-DTR-GFP in inflated organoid with or without spontaneous curvature. Images, representative Lgr5-DTR-GFP organoids cultured in DMSO control, PGE or PGE + Blebbistatin (from 3:20 hr) condition with DAPI staining. Box plot, quantification of Lgr-5-DTR-GFP intensity in three groups from left images. C. Osmotic deflation in organoids with different spontaneous curvatures. Cartoon and images from upper to lower panels: Day2.5 DMSO-treated organoid, Day3 organoid before bulging, Day3.5 bulged organoid, and Day3.5 CHIR-treated organoid without bulging. Colours in the cartoon: red (Paneth cell), yellow (stem cell), blue (cell in villus tissue). Organoid images, fluorescent images of organoid expressing Lgr-5-DTR-GFP and H2B-iRFP before and after osmotic shock. Plot, quantification on eccentricity of organoids before and after osmotic shock. Red arrows in D and F indicate crypt regions. For plots (A-C), n numbers are stated in brackets and represent the number of independent recordings (A) or independent organoids (B and C) selected for measurements. P-values are calculated from two-tailed t-test (B) or two-tailed Paired Student’s t-test (C). Box-plot elements show 25% (Q1, upper bounds), 50% (median, black lines within the boxes) and 75% (Q3, lower bounds) quartiles, and whiskers denote 1.5× the interquartile range (maxima: Q3 + 1.5× (Q3-Q1); minima: Q1-1.5× (Q3-Q1)) with outliers (rhombuses). Experiments in A-C were repeated at least 3 times independently with similar results. Scale bars, 50 μm.
Osmotic changes in enterocytes drives lumen shrinkage
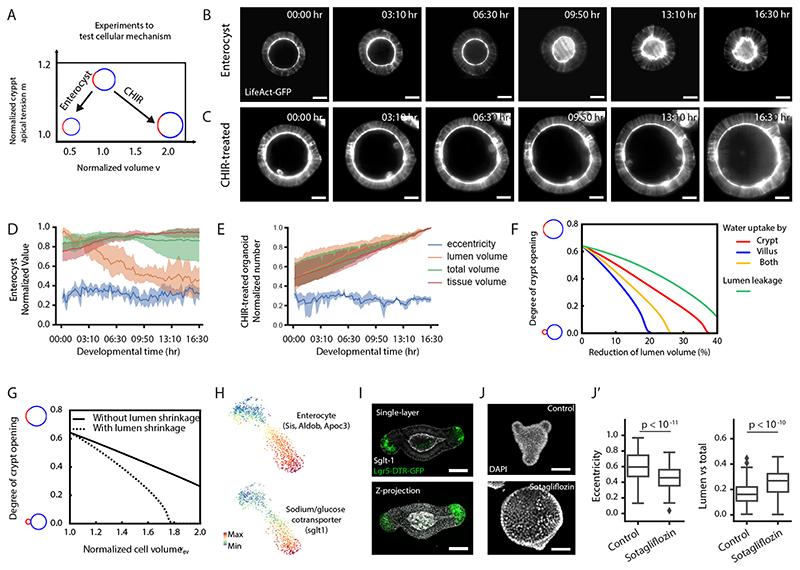
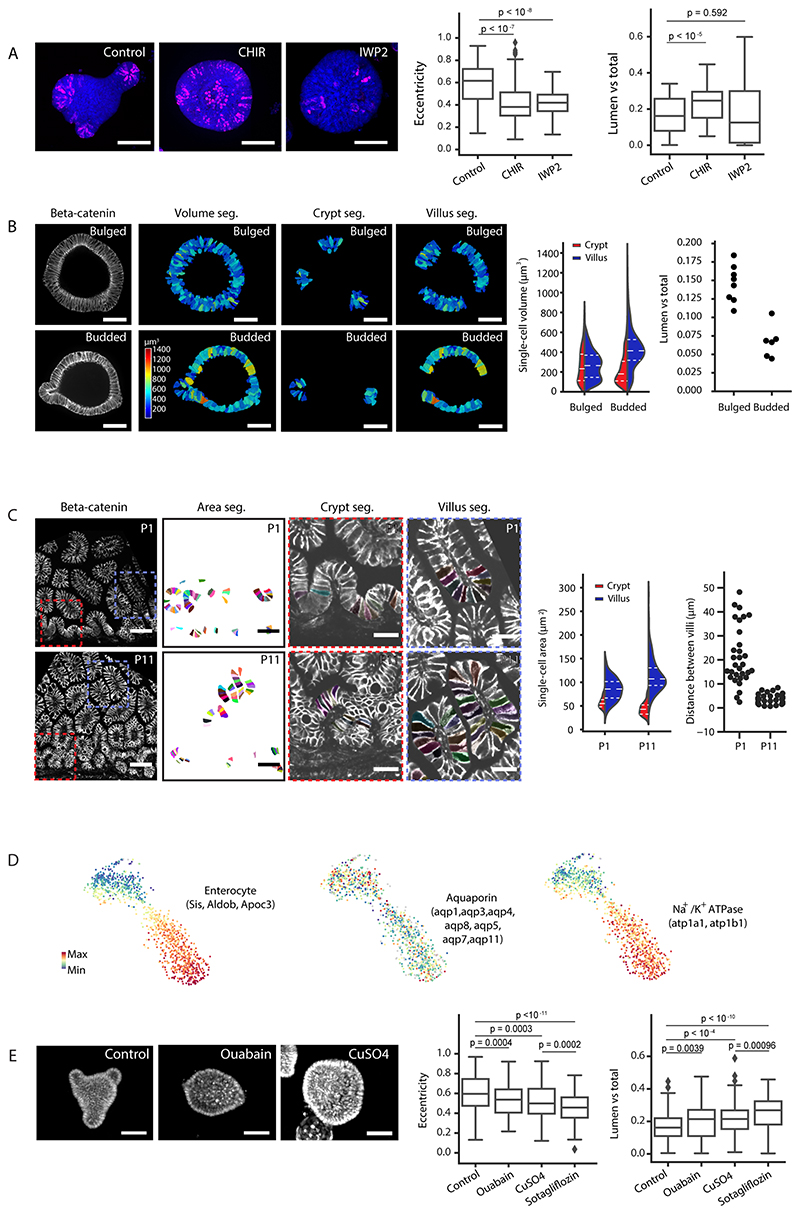
Next, we addressed the mechanisms of volume reduction. Overall organoid volume varies little (Fig. 1D–E), therefore, we hypothesized that lumen volume is redistributed to epithelial cells. To distinguish whether a specific cell type was responsible for the lumen volume reduction, we analysed organoids enriched in different cell types (Fig. 7A). Differentiated enterocysts display a marked reduction in lumen volume (Fig. 7B and D, Extended Data Fig. 8A, Supplementary Video 9 and methods), whereas CHIR-treated organoids, composed mainly of SC and Paneth cells (15), do not (with lumen volume increase, Fig. 7C and E, Extended Data Fig. 8A and Supplementary Video 10). These results suggest that lumen volume reduction is dependent of enterocytes swelling. Indeed, single-cell volumes in the villus region increased during crypt budding, while single-cell volumes in the crypt region did not (Extended Data Fig. 8B). We then refined our biophysical model, to include that lumen volume reduction could be compensated by either i) volume increase of all cells, ii) volume increase of crypt cells, iii) volume increase of villus cells. Strikingly, hypothesis iii) with enterocytes increasing their cell volume is the most efficient to produce budded crypts, as it decreases villus monolayer tension, while increasing crypt cell volume would be detrimental by increasing the bending rigidity of crypts (Fig. 7F and see SN). This strongly suggests that luminal fluid uptake specifically by villus cells is an efficient and robust mechanism to promote crypt budding. We then turned back to the in vivo situation: although the open geometry of the gut tube could make lumen volume changes less drastic, modelling only villus volume increase at constant lumen volume still provided significant forces mediating crypt budding (Fig. 7G). Interestingly, segmenting mouse villus cells in vivo during crypt formation (P1 and P11) revealed a volume increase in villus enterocytes (Extended Data Fig. 8C). This shows that in vivo the coordination of contractility patterns (Extended Data Fig. 1C and C’) and enterocytes volume increase is associated with crypt morphogenesis.
Figure 7. Enterocytes control lumen volume reduction through SGLT-1.
A. Schematic representation of the experimental design applied. B. Light-sheet time-lapse recording of enterocyst, the organoid that is composed of only enterocyte, from Day 3 with tissue and lumen visualized by LifeAct-GFP (white). C. Light-sheet time-lapse recording of organoid treated with 3 μM CHIR, the organoid that is highly enriched with stem cells and Paneth cells, from Day 3 with tissue and lumen visualized by LifeAct-GFP (white). D. Corresponding plots of B on eccentricity, lumen volume, tissue volume and total volume (lumen + tissue) (n=5 independent recordings). E. Corresponding plots of C on eccentricity, lumen volume, tissue volume and total volume (n=3 independent recordings). In D and E, solid lines represent average values, shadow regions represent the standard deviations. F. Model prediction of how increased volume of different regions promotes budding, showing that fluid uptake specifically by villus cells is best for budding. G. Model prediction of increased cell volume in villus region with and without corresponding lumen volume changes, showing that cell volume changes alone can still promote budding (full line). H. TSNE-based visualizations of single-cell RNA sequencing data indicate the expression of sglt. I. Immunostaining of SGLT-1 (white) in budded organoid with crypt regions visualized by Lgr-5-DTR-GFP (green) indicates the enrichment of SGLT-1 in the villus apical domain. J-J’. SGLT-1 is required for lumen volume reduction. J. Representative images of Day 4 organoid from DMSO-treated control and Sotagliflozin-treated sample for SGLT-1 inhibition (from 3 independent experiments). J’, quantification of the eccentricity (left plot) and lumen ratio (lumen volume vs. total volume, right plot) of control (n=155 organoids) and Sotagliflozin treated organoids (n=119 organoids). P-values are calculated from two-tailed t-test. Box-plot elements show 25% (Q1, upper bounds), 50% (median, black lines within the boxes) and 75% (Q3, lower bounds) quartiles, and whiskers denote 1.5× the interquartile range (maxima: Q3 + 1.5× (Q3-Q1); minima: Q1-1.5× (Q3-Q1)) with outliers (rhombuses). Time-lapse recordings in B-C and experiments in I-J were repeated at least 3 times independently with similar results. Scale bars: B, C and J (20 μm), I (50 μm).
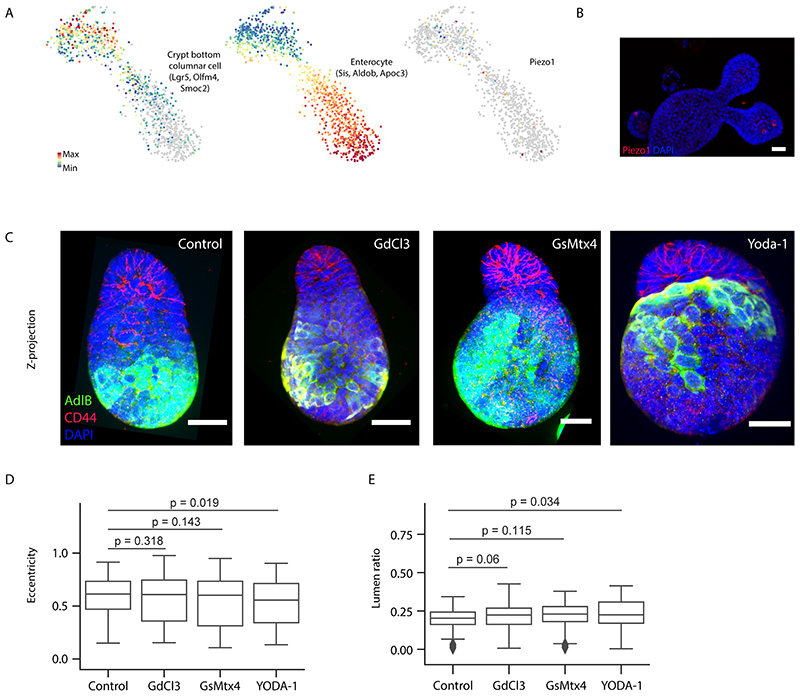
Finally, to test mechanistically how lumen volume reduction is regulated in enterocytes, we analysed membrane transporters that regulates osmotic gradient and transcellular water transfer and selected three groups of candidates based on their expression in scRNA-seq data (Fig. 7H and Extended Data Fig. 8D). Although classical mechanosensitive ion channels such as Piezo1/2 are not specifically expressed or have specific function in this system (Extended Data Fig. 9), we found that the family members of the Sodium/glucose cotransporter (SGLT-1), the water channel Aquaporins (AQPs) and the Na+/K+ ATPases (Atp1a1 and Atp1b1) have enterocyte-specific mRNA expression (Fig. 7H and Extended Data Fig. 8D). Interestingly, at the protein level, only the SGLT-1 is enriched at villus apical domain (Fig. 7I), while AQPs and Na+/K+ ATPase are expressed homogenously throughout the epithelium (37). Inhibition of each of the membrane transporters lead to the failure of lumen volume reduction and organoid budding (Fig. 7J–J’ and Extended Data Fig. 8E). Remarkably, the inhibition of the SGLT-1 (Sotagliflozin) leads to the strongest defects (Fig. 7J–J’ and Extended Data Fig. 8E), supporting the role of SGLT-1 transporter in enterocytes to actively drive lumen volume reduction and villus cell swelling.
Taken together, our findings suggest that membrane transporters, especially SGLT-1 in enterocytes promote lumen volume reduction through the regulation of osmotic gradient and transcellular water transport.
Discussion
Here we demonstrated that apical contraction in crypts and basal tension in the villus generate the region-specific spontaneous curvatures that lead to crypt bulging and budding, and that enterocytes further promote this process by swelling. Apical contraction drives tissue folding of many systems, such as the Drosophila mesoderm invagination, the vertebrate neural tube closure, the morphogenesis of mouse lens placode and gastrulation in various organisms (41–45). Basal tension has recently been revealed as driving force for tissue morphogenesis (20, 46). In our model, the two essential requirements are the presence of differential cellular spontaneous curvatures (crypt vs. villus), and a larger in-plane contraction of crypts compared to villus (see SN). Together, these two features result in a critical value of crypt apical tension, above which crypt shape becomes robust to lumen inflation, which could be relevant to in vivo pathological situations such as diarrhea caused by infections (47, 48).
Interestingly, it has been reported that basal tension in MDCK cells leads to increased spontaneous curvature, which is able to bend the 2D-cultured cell layer (49). The basal tension in the villus region emerges during enterocytes differentiation and is potentially regulated by specific re-localization of ZO-1 to the basolateral domain of the villus. The actomyosin regulator, Rac-1, is required for the basal constriction of hinge cell that guides crypt spacing in vivo (11), and could play a role in longer-term maintenance of crypt shape, which could be probed theoretically by considering boundary forces (SN). Because differential patterns of actomyosin (50) and ZO-1 are also observed in crypts in vivo (Fig. 4D and Extended Data Fig. 5B), our findings can be extended to in vivo gut development. In mouse, the space between villi is strongly reduced during crypt morphogenesis, and villus cells show extensive volume increase during crypt morphogenesis (Extended Data Fig. 8C), suggesting a possible role of osmotic effects also during in vivo morphogenesis. Indeed, from the perspective of our model, lumen reduction in organoids and villus cell swelling both help curvature-driven bending by increasing compressive stresses within the epithelium. Finally, it is interesting that although crypt morphology is conserved from in vivo to in vitro, the shape of the villus domain remains flat in vitro. This is likely due to the fact that in vivo villus morphogenesis occurs prior to crypt morphogenesis, and involves a buckling instability from smooth muscle differentiation which restricts mesenchymal growth (6), features which are absent in organoids. Strikingly however, we found that perturbing ECM remodelling in organoids did not cause defects in crypt morphology (Extended Data Fig. 10), which explains that crypt morphogenesis occurs in organoid without co-culture of mesenchymal cells. Interestingly, in an accompanying paper on 2D intestinal organoid, Perez-Gonzalez et al. also find that apical actomyosin tension is a key driver of crypt folding morphogenesis, and that this apical tension in stem cells increases as a function of time throughout crypt formation. Using 3D traction force measurements and vertex models, the authors thus reach similar conclusions on the role of bending rather than buckling in crypts. Together, these approaches show the power of organoid assays in uncovering the mechano-chemical principles of self-organization and morphogenesis (51).
To conclude, our findings implicate cell differentiation as orchestrating differential mechanical and epithelial osmotic properties, which coordinates organoid morphogenesis, with implications for multiple developmental and cellular processes. Fluid can exert significant morphogenetic forces, as shown in early mouse embryo or lung (23, 52–54), which are rapidly transmitted spatio-temporally. The manipulation of lumen volume in combination with biophysical modelling, is thus a powerful tool and could be broadly applicable to other model systems. The coupling between cell fate, mechanics and osmotic changes that we uncover allows for stable and robust shape transformation. Interestingly, although formed budded crypts are able to sustain extensive fluid inflation, preventing lumen volume reduction prior to morphogenesis results in partially bulged, immature crypts, pointing to additional potential feedbacks between luminal volume and crypt apical tension. Overall, comprehensive understanding of the spatial-temporal coordinated behaviours during development and regeneration requires a link between large-scale tissue mechanics and molecular and cellular functions.
Materials and Methods
Animal work
All animal experiments were approved by the Basel Cantonal Veterinary Authorities and conducted in accordance with the Guide for Care and Use of Laboratory Animals. 15 C57BL/6 outbred mice from three litters and a mother were used to obtain small intestines at the age of P1 (two mice), P2 (two mice), P5 (one mouse), P7 (one mouse), P11(two mice), P12 (one mouse), P13 (one mouse), P14 (one mouse), P15 (one mouse), P16 (one mouse), P17 (one mouse) and 6-month (one female) for time-course immunohistochemistry (animals from P1 to P17 were too young and therefore were not distinguished on genders from external genitalia morphology). Male and female outbred mice from 7 weeks old onwards were used for generating organoid lines of wild type and Lgr5-DTR-EGFP as reported previously (15). One male mouse at 10 weeks was used to generate organoid line of LifeAct-GFP. One male mouse at 10 weeks and one male mouse at 11 weeks were used to generate organoid line of Myh-9+/-. One male mouse at 10 weeks was used to generate organoid line of Myh-9-GFP.
Mouse lines used: C57BL/6 wild type (Charles River Laboratories), Lgr5-DTR-EGFP (Genentech, de Sauvage laboratory), LifeAct-GFP and Myh-9+/- (T. Hiiragi laboratory, EMBL), Myh-9-GFP (Lennon-Duménil laboratory, Institut Curie).
Mice were kept in housing conditions with 12-hour light/12-hour dark cycle, 18-23°C ambient temperature and 40-60% humidity.
Organoid culture
Organoids were generated from isolated crypts of the murine small intestine as previously described (15). Organoids were kept in IntestiCult Organoid Growth Medium (STEMCELL Technologies) with 100μg/ml Penicillin-Streptomycin for amplification and maintenance.
Time course experiments of fixed organoid samples
The method was adapted from descripted before (15). Organoids were collected 5-7 days after passaging and digested with Tryple (Thermo Fisher Scientific) for 20 min at 37 °C. Dissociated cells were passed through a cell strainer with a pore size of 30 μm (Sysmex). Collected cells were mixed with Matrigel (Corning) in a ENR medium to Matrigel ratio of 1:1(15). In each well of a 96 well plate, 5μl droplets with 2500 cells were seeded. After 15 min of solidification at 37 °C, 100 μl of medium was overlaid. From day 0 to day 1, ENR was supplemented with 25% Wnt3a-conditioned medium (Wnt3a-CM), 10 μM Y-27632 (ROCK inhibitor, STEMCELL Technologies) and 3 μM of CHIR99021 (GSK3B inhibitor, STEMCELL Technologies, cat # 72054). From day 1 to 3 ENR was supplemented with 25% Wnt3a-CM and 10 μM Y-27632. From day 3 to 5, only ENR was added to the cells. Wnt3a-CM was produced in-house by Wnt3a L-cells (kind gift from Novartis).
Compound treatments
Compound treatments were tested in dilutions series of various concentrations from 1mM to 5nM. With at least three concentrations that were observed to have related phenotype instead of organoid death, a medium concentration was repeated for quantification.
Single cells derived from LifeAct-GFP organoids were plated in a 96-well plate chamber or Light-sheet chamber and exposed to 7.5 μM (±)-Blebbistatin (Myosin II inhibitor, Abcam cat # AB120425) or 1 μM Cytochalasin D (inhibitor of actin polymerization, Abcam cat # AB143484) or 0.6 μM Aphidicolin (DNA polymerase inhibitor, SIGMA-ALDRICH, cat # A4487) or 0.5 μM Prostaglandin E2 (PGE, kind gift from Novartis) or 5 μM or 10μM DMSO (SIGMA-ALDRICH, cat # D8418) diluted in ENR medium, from 72 hours until fixation at 96 hours (96-well plate), or from 96 hours for 10 hours (Light-sheet chamber, Fig. ), from 96 (or 99:20 hours, PGE+Blebb) hours for 13:20 hours (or 10 hours, PGE+Blebb) (Light-sheet chamber and 96-well plate Fig. 6A), or from 84 or 96 hours for 15 minutes (Light-sheet chamber, PGE inflation, Fig. 5B–C).
Single cells derived from Myh-9-GFP and Lgr-5-DTR-GFP organoids were plated in a 96-well plate chamber and exposed to 3 μM of CHIR99021 (GSK3B inhibitor, STEMCELL Technologies, cat # 72054) and 1 mM valproic acid (VPA, SIGMA-ALDRICH, cat # A00423), or 3 μM of CHIR99021 (GSK3B inhibitor, STEMCELL Technologies, cat # 72054) and 2 μM N-[N-(3,5-difluorophenacetyl)-l-alanyl]-S-phenylglycine t-butyl ester (DAPT, Notch inhibitor, Stemgent, cat # 04-0041), or 5 μM or 10μM DMSO (SIGMA-ALDRICH, cat # D8418) diluted in ENR medium, from 48 hours until fixation at 96 hours (96-well plate).
Single cells derived from organoids C57BL/6 wild type were plated in a 96-well plate and treated with 3 μM CHIR99021 (GSK3B inhibitor, STEMCELL Technologies cat # 72054) or 2 μM IWP-2 (Porcupine Inhibitor, STEMCELL Technologies cat # 72124) or 500 μM Ouabain octahydrate (Na+/K+ ATPase inhibitor, SIGMA-ALDRICH cat # O3125) or 5 μM Sotagliflozin (SGLT1/2 inhibitor, MedChemExpress cat # HZ-15516) or 12.5 μM CuSO4 (Aquaporin inhibitor, SIGMA-ALDRICH cat # C2284), or 50 μM GdCl3(Piezo inhibitor, Sigma-Aldrich, #cat G7532), or 12 μM GsMtx-4 (Piezo inhibitor, Abcam #cat ab141871), or 56.2 μM Yoda-1(Piezo1 activator, Tocris cat# 5586), or 2.6 μM GM6001(MMP inhibitor, R&D Systems cat# 2983/10), or 0.3 μM Marimastat (MMP inhibitor, R&D Systems cat# 2631/1) or 5 μM DMSO in ENR medium, from 72 hours until fixation at 96 hours.
Organoid immunostaining and imaging
The method was adapted from descripted before (15). Primary and secondary antibodies were diluted in blocking buffer and applied as indicated in the TableS1. Cell nuclei were stained with 20 μg/ml DAPI (4’,6-Diamidino-2-Phenylindole, Invitrogen) in PBS for 5 min at room temperature. Cells were stained with 1 μg/ml of Alexa Fluor® 647 carboxylic acid succinimidyl ester (CellTrace, Invitrogen) in carbonate buffer (1.95 ml of 0.5 M NaHCO3, 50 μl of 0.5 M Na2CO3, both from Sigma-Aldrich, in 8 ml of water for 10 ml of buffer).
High-throughput imaging was done with an automated spinning disk microscope from Yokogawa (CellVoyager 7000S), with an enhanced CSU-W1 spinning disk (Microlens-enhanced dual Nipkow disk confocal scanner), a 40x (NA = 0.95) Olympus objective, and a Neo sCMOS camera (Andor, 2,560 × 2,160 pixels). For imaging, an intelligent imaging approach was used in the Yokogawa CV7000 (Search First module of Wako software 1.0) as described before (15). Z-planes spanning a range up to 90 μm and 2 or 3 μm z-steps were acquired.
Confocal imaging of fixed samples was performed using Nikon Ti2-E Eclipse Inverted motorized stand with Yokogawa CSU W1 Dual camera (CAM1 SN: X-11424; CAM2 SN:11736) T2 spinning disk confocal scanning unit, CFI P-Fluor 40x oil/1.4 objective and Visview 4.4.0.9 software. Laser lines used are Toptica iBeam Smart 405/488/639 nm and Cobolt Jive 561 nm. Laser power and digital gain settings were unchanged within a given session to permit direct comparison of expression levels among organoids stained in the same experiment. Image stacks were acquired with slice thickness of 2μm or less.
Time-course image analysis
Organoid segmentation in maximum intensity projections (MIPs) was adapted from before (15). For each acquired confocal z-stack field, MIPs were generated. All MIP fields of a well were stitched together to obtain MIP well overviews for each channel. The high resolution well overviews were used for organoid segmentation and feature extraction. To this end, we apply the segmentation method from Serra, Mayr et al. (2019), which separates organoid instances observed until 72h post-fixation with a watershed algorithm and with a fully convolutional neural network (FCN)-augmented watershed for organoids observed at or after 72h post-fixation. For the organoid segmentation based on DAPI, we substitute the segmentation of Serra, Mayr et al. (2019) by a U-Net-like FCN trained to generate instance embeddings using fixed bandwidth and soft jaccard loss (55). Artifacts of segmentations were identified by setting size-threshold and visual inspection, annotated in Fiji (Version 2.1.0 for all the measurement involved in this study) and removed by a customized python script. From the segmented MIPs, we calculate the 2D eccentricity of each individual organoid using scikit-image’s regionprops method. Using the individual organoid masks from the MIP, we crop Z-stacks from the full 3D images (Yokogawa CV7000) and segment them individually with the same FCN used before (15). The 3D volume is approximated by the sum of voxel volume segmented as foreground. 3D re-construction of organoid in osmotic-shock experiment is preformed using MorphoGraphX software (the only version) (Fig.6C) (56, 57), and rotated to demonstrate the most significant change of crypt before and after osmotic shock. Selected 3D views were recorded for segmentation of the organoid shape and calculation of the 2D eccentricity as preformed before.
Single-cell apical and basal domains and single-cell volume were segmented and quantified in 3D using the MorphoGraphX software (56, 57). For apical and basal domains in Day 3.5 and Day4 organoids, cells in the crypt and villus regions were manually selected based on the crypt morphology and Paneth cell staining (see example in Extended Data Fig. 1A). The end point of crypt was chosen as the cells that were in the regions of bulged or budded curvature and with Lysozyme positive cells.
Cell densities in crypt and villus were calculated as the number of cell nuclei within a selected region divided by the length of the region along crypt-villus axis and multiple 10 (Cell NO. per 10 μm). For each selected region, at least five nuclei were recognized as continued next to each other and counted.
Myh-9-GFP intensity ratios in single cells were measured using FIJI. A square of 1×1μm was drawn on the middle of cell apical or lateral or basal membrane in the image of the middle section of a z-stack. After measuring the mean gray value for the intensity of the signal on the membranes, the square was shifted to another cell. In each crypt or villus region, more than five cells that are away from crypt/villus border were randomly selected for measurements. The mean gray value for membrane signal was then normalized by comparing the ratio of signal within same cell or same organoid (see term of ratios in Fig. 3B). Myh-9-GFP intensity ratios of apical vs. basal in organoids were performed using segmented line selection (Line Width: 5, 0.8125 μm) in FIJI. The entire apical and basal sides from the middle section of organoids were selected for measurement. Samples of each organoid type are selected from three independent experiments with inspection of Lyz co-staining that indicates the successful induction of the organoid type (Fig. 3D and F). GFP mean intensity in Lgr-5-DTR-GFP positive cells were performed using wand tool section in FIJI on sum intensity projection (SIP) of randomly selected organoid z-stacks from each group. (Fig. 3B).
Light-sheet microscopy.
Light-sheet microscopy was conducted by using LS1 Live light sheet microscope system (Viventis) or a similar customized microscope system as described before (15). Sample mounting was performed as described previously (15). For organoids imaging, LifeAct-GFP and Myh-9-GFP organoids were collected and digested with TrypLE (Thermo Fisher Scientific) for 20 min at 37 °C. GFP positive cells were sorted by FACS and collected in medium containing advanced DMEM/F-12 with 15 mM HEPES (STEM CELL Technologies) supplemented with 100 μg/ml Penicillin-Streptomycin, 1×Glutamax (Thermo Fisher Scientific), 1×B27 (Thermo Fisher Scientific), 1xN2 (Thermo Fisher Scientific), 1mM N-acetylcysteine (Sigma), 500ng/ml R-Spondin (kind gift from Novartis), 100 ng/ml Noggin (PeproTech) and 100 ng/ml murine EGF (R&D Systems). 2000 cells were then embedded in 5ul drop of Matrigel/medium in 50/50 ratio. Drops were placed in the imaging chamber and incubated for 20 min before being covered with 1ml of medium. For the first three days, medium was supplemented with 20% Wnt3a-CM and 10 μM Y-27632 (ROCK inhibitor, STEMCELL Technologies). For the first day, in addition, 3μM of CHIR99021 (STEMCELL Technologies) were supplemented. After more than 2 days culture in a cell culture incubator the imaging chamber was transferred to the microscope kept at 37 °C and 5% CO2. Different organoids were selected as starting positions and imaged every 10 min for up to 4 days, or in PGE treatment, every 3 min for up to 30 min. Budded organoids and Enterocysts (the organoids that consist of only enterocytes) are collected from the same medium condition. Enterocysts were recognized by the failure of crypt budding (due to lack of Paneth cells) as previously reported (15). A volume of 150-200μm was acquired with a Z spacing of 2μm between slices. Medium was exchanged manually under the microscopy every half day.
Light sheet data analysis.
For area and volume calculation of light sheet data we proceeded as follow. Initially raw data were cropped around the minimum organoids bounding box in order to reduce storage space. To quantify morphological futures as well as lumen and tissue volume during organoid development, a segmentation of lumen and tissue is generated. To this end, a U-Net-like fully convolutional neural network (FCN) that was trained to predict probability maps for lumen and tissue based on stacks of three XY-planes is applied to the volume in a sliding window fashion along Z. To improve segmentation quality, we specialize one version of this FCN on enterocysts and one on budding organoids by refining the model on the respective part of the dataset (see code availability). Segmentations are manually inspected to ensure appropriate quality. Organoid and tissue volume is approximated by the sum of voxel volume segmented as foreground. From the segmented z-projection of each time frame, the 2D eccentricity is extracted from the segmented regions using scikit-image’s regionprops method. In enterocyst movies, despite in all five samples the eccentricity remains and lumen volume decreases, one sample has strong total volume reduction, which is different with the phenotype of the other four samples (that have total volume remained or slightly increased). This unrepresentative movie is still included for plot in Fig. 7D. The average of the total volumes from five samples remains not changing much, and the average of tissue volumes increases (Fig. 7D).
Using Fiji, we extract the values of morphometric parameters (epithelial thickness and region radius) from movies of intestinal organoids. The epithelial thickness of each region (crypt/villus) is obtained by averaging the data measured in at least two random positions. The radius Rc (or Rv) is defined as the average value of the apical and basal radii. For each region, we first try to find the center of an apical/basal circle (basically by the lateral texture of epithelium), then draw a circle that shares the same center and matches the apical/basal edge. The corresponding radii are extracted from these circles in Fiji measurement function. The length of organoid major axis and neck after budding are measured manually in Fiji and converted to aspect ratio = neck / major axis.
Light-sheet time-lapse recordings of Myh-9-GFP organoid were processed using the Huygens Deconvolution platform (SVI) to increase the signal-to-noise ratio (Extended Data Fig. 4D and Supplementary Video 2).
Immunohistochemistry and data analysis
Jejunums were dissected for fixation in 10% PFA (Electron Microscopy Sciences) in PBS for 24 hours at 4 degree, washed with 70% EtOH, embedded in paraffin, and 3-μm sections prepared and processed for haematoxylin staining and immunohistochemistry. Immunohistochemical staining was performed on formalin-fixed, paraffin-embedded tissue sections using a Ventana BenchMark fully automated stains system with anti-ZO-1 (Thermo Fisher Scientific #33-9100, 1:50), anti-Beta-Catenin (BD transduction laboratories #610154, 1:200) or anti-CD44v6 (BioRad #MCA1967, 1:100). Cell density were measured in the same method as for organoid (see Time-course imaging analysis). Single-cell areas were measured manually by Fiji using Polygon selection tool and visualized by ROI manager and a customized ImageJ Marco script. Area size varies from apical to basal domains in single cell and does not vary much in parallel to lateral domains. Cell areas in the middle-sections that are parallel to lateral domains from the recorded z-stack images are therefore selected for measurements. Distance between villi were measured in method as follows: the curves c i and c o of two closed edges of neighbour villi were annotated using Fiji’s ROI Manager and exported as ROI files. In a second step, the files were imported in Python and a bivariate polynomial p was fitted to each imported curve. p internally stores two univariate polynomials px and py of degree 3 which approximate the x and y coordinates for each point on the curve, respectively. We then divided p in 29 partitions, each holding a start point and an end point, which results in a total of 30 points along the polynomial. Given pi and po, two bivariate polynomials fitting c i and c o, we compute the shortest distance between any point on pi and any point on po using the Nelder-Mead algorithm. We define the obtained global shortest distance as an approximation to represent the space between villi. Regions for all measurements were randomly selected for all group.
Tension Measurements by Laser Nanosurgery
The method was adapted from previous studies (24, 58). In brief, images are captured by a LSM710 scanning confocal microscopy using ZEN Black software (the only version). The microscope is equipped with an incubation chamber to keep the sample at 37°C and to provide 5% of CO2. Organoids were embedded in Matrigel and cultured in ibidi 8-well plates. Random samples were selected for cutting. Cutting of the apical membranes was performed using a wavelength of 850nm with a Chameleon Ultrall Laser. All cuttings were performed on the middle of cell membranes in single cells. The cutting region (yellow dashed lines in Fig. 2D) was set as a rectangle of 0.9 μm x 0.45 μm, and the activation time was calculated by the scan speed of 1.25ms/pixel. Organoids were imaged at 0.32 sec intervals with a Plan-Neofluar 40x/0.9 Imm Korr Ph3 Objective lens before and after cutting. For each cut, we measured the opening distance in every five time frames after cutting as indicated by lines in montage images in Fig. S4A’, the opening distance was applied to calculate average recoil velocity of the first two measured time points (0 to 1.6 sec) as v initial = opening distances /duration of recoil (μm/sec).
Organoid basal tension measurement.
The method was adapted from previous studies (25, 52). In brief, a microforged micropipette coupled to a microfluidic pump (Fluigent, MFCS) was used. To measure the basal tissue tension of organoid, micropipettes with radii 15-20 um (covering 3 to 5 cells) were used to apply stepwise increasing pressures on these basal side until a deformation with the same radius of the micropipette (R p) is reached. At steady state, the basal tension γ of the organoid is calculated based on Young–Laplace’s law: γ = P c/2(1/R p − 1/R c), where P c is the aspiration pressure used to deform the tissue with a local radius of curvature R c. The measurements were performed on an inverted Zeiss Axio Observer microscope equipped with a dry x20/0.8 PL Apo DICII objective. The inner walls of the micropipettes were made non-adhesive with sigmacote (Sigma) to prevent tissue adherence during aspiration. Organoids were collected by Matrigel-removal with three-times cold PBS washing. Organoid morphology did not significantly change for up 6 hours in ENR medium after Matrigel-removal. Random organoids were selected for experiments. In every experiment, the same pipette was used to measure the villi and crypts of the same organoids, and data was pooled from 3 independent experiments.
Organoid microinjection.
Organoids were collected by Matrigel-removal with three-times cold PBS washing. Organoid morphology did not significantly change in ENR medium for up 6 hours after Matrigel-removal. Organoids were placed into a 10 μl droplet of ENR medium, which were covered by mineral oil and placed on the stage of a microscope (Olympus X71). Microinjection of ENR medium to organoid lumen was then performed using the Olympus IX71 microscope equipped with micromanipulators (Eppendorf, NK2) and FemtoJet (Eppendorf).
Single cell RNA-Sequencing analysis.
The single cell RNA-sequencing data has been previously published, and available at the Gene Expression Omnibus (GEO) under accession codes GSE115956 (15). Data analysis and single cell clustering and visualization used methods as described before (15). Implementation of the Rtsne R package (version 3.6.0) used for tSNE projections is available at https://cran.r-project.org/web/packages/tsne/.
Statistics and reproducibility
All statistical analysis was performed using the python library SciPy. Significances for data displaying normal distributions were calculated with two-tailed Student’s t-test, for paired samples in Fig. 1C and F, Fig. 5B” and C”, Fig. 6C, Extended Data Fig. 7A”and B” were calculated with two-tailed Paired Student’s t-test. P-values in Figure1C: i) for apical vs. basal domain size in violin plot pcell < 10-21 (from two-tailed t-test); in dot plot porganoid < 0.05 (from two-tailed Paired Student’s t-test). ii) apical size (from two-tailed t-test): Day 3 (ncell = 331) vs. Day 3.5 crypt (ncell = 307), pcell < 10-44, porganoid = 0.0026; Day 3 vs. Day 4 crypt (ncell = 550), pcell < 10-90, porganoid = 0.0018; Day 3.5 crypt vs. Day 4 crypt, pcell < 10-20, porganoid = 0.0488. iii) for basal size (all from two-tailed t-test): Day 3 (ncell = 531) vs. Day 3.5 villus (ncell = 1249), pcell< 10-58, porganoid = 0.0428; Day 3 vs. Day 4 villus (ncell = 1500), pcell < 10-154, porganoid = 0.0027; Day 3.5 villus vs. Day 4 villus, pcell < 10-76, porganoid = 0.007.All Box-plot elements show 25% (Q1, upper bounds), 50% (median, black lines within the boxes) and 75% (Q3, lower bounds) quartiles, and whiskers denote 1.5× the interquartile range (maxima: Q3 + 1.5× (Q3-Q1); minima: Q1-1.5× (Q3-Q1)) with outliers (rhombuses). Staining and experiments in Fig. 1B and D, Fig. 2C, Fig. 3A, C–D, Fig. 4C–G, Fig. 6A–B, Fig. 7B–C, I and J, Extended Data Fig. 1B–C, Extended Data Fig. 4B–F, Extended Data Fig. 5, Extended Data Fig. 8A–C and E, Extended Data Fig.9 B, C and E, Extended Data Fig. 10 were repeated at least 3 times independently with similar results. No particular statistical method was used to define sample size. In compound time-course experiments, we assumed a minimum of around 50 organoids at Day4 would be sufficient to recognize differences between control and perturbations based upon historical experiments. Sample size was determined based on previous related studies in the field (15).
Extended Data
Extended Data Fig. 1. Cell and tissue quantification.
A, Example of selecting crypt and villus region for quantification of single-cell apical and basal size in bulged organoid. Upper panel, from left to right: Z-projection of ZO-1 and Lyz staining in bulged organoid, selected apical segmentation with Lyz signal in 3D and ZO-1 signal (white) projected in 3D apical side in villus from xy view, in villus from yz view, in crypt from xy view and in crypt from yz view. Lower panel, from left to right: selected basal segmentation with Lyz signal in 3D and ZO-1 signal (white) project in 3D basal side in villus from xy view, outline of villus basal segmentation from xy view, crypt basal segmentation from xy view, outline of crypt basal segmentation from xy view and yz view. Colour of heatmap indicates the size of single-cell apical or basal membranes. B-C’. Tissue compaction along crypt-villus axis in the development of intestinal organoid and in vivo tissue. B. Representative images of bulged and budded organoids with CD44 and DAPI staining. B’. Plot of cell density in crypt (red dashed double arrowhead line) and villus (blue dashed double arrowhead line) tissue as indicated in B. Two-tailed t-test for bulged crypt (n=22) and bulged villus (n=22), p < 10 -5; for budded crypt (n=19) and budded villus (n=19), P < 10 -11. C. Representative images of immunostaining on the section of mouse intestine at the age of P1 and P11. C’. Plot of cell density in crypt (red dashed double arrowhead line) and villus (blue dashed double arrowhead line) regions as indicated in C. Two-tailed t-test for P1 crypt (n=32) and P1 villus (n=31), p < 10 -10; for P11 crypt (n=40) and P11 villus (n=44), P < 10 -23. Experiments and imaging analysis in A, and experiments in B-C were repeated at least three times independently with similar results. Scale bars, 20 μm. Violin plot lines in B’ and C’ denote quartile for each group.
Extended Data Fig. 2. Sensitivity analysis for how model parameters affect crypt morphology.
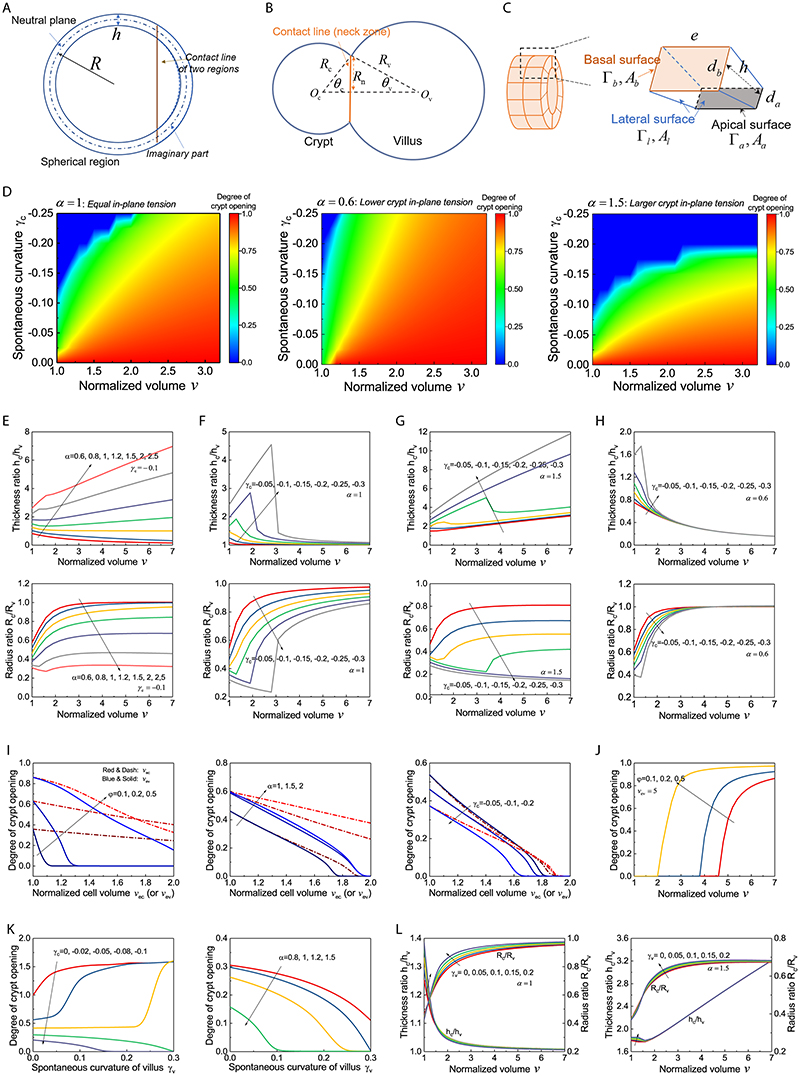
A-C. Schematic of the model and morphometric parameters used (see Supplementary Note). D. Phase diagrams of crypt morphologies with varying volumes v and spontaneous curvature of crypt γc, for different values of in-plane contraction α (left to right: 1, 0.6, and 1.5). E-H. Evolution of thickness ratio h c/h v and radius ratio R c/R v during the inflation of an organoid (crypt size φ=0.2, shape factor ): increasing α (γc = 0.1) (panel E) and γc (α = 1, 1.5, and 0.6) (panels F-H). I. Influence of cell swelling on crypt morphology (degree of crypt opening) with varied crypt size φ (α = 1.5, γc = −0.02), α (γc = −0.1, φ = 0.5), and γc (α = 1, φ = 0.5). J. Morphological evolution during the inflation of an organoid (α = 1.5, γc = −0.02) with swollen villus cells (v ev = 5). K. Influence of spontaneous curvature of villus γv on crypt morphology (φ=0.2) with varied γc (α = 1) and α (γc = −0.08). L. Influence of γv on the evolution of h c/h v and R c/R v during the inflation of an organoid with α is respectively 1 and 1.5 (γc = −0.1, φ = 0.2).
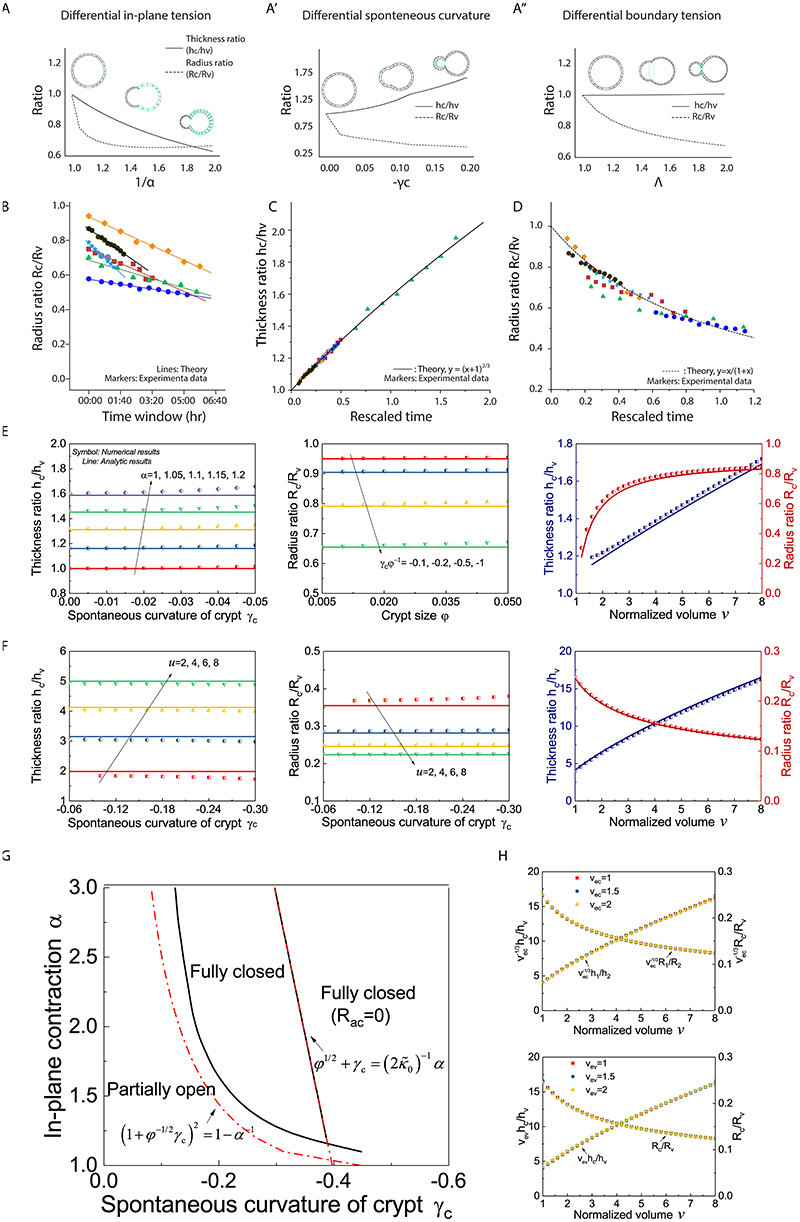
Extended Data Fig. 3. Comparison between numerical solutions of the full model and analytical scaling laws.
A-A” Three possible mechanical scenarios that could drive crypt morphogenesis. Stable organoid configuration is calculated by minimizing the energy F (α,γc,γv,φ,v,λ), which depends on a few key parameters (see SN for details): α, ratio of in-plane contractions in crypt and villus regions; γc, spontaneous curvature crypt region; γv, spontaneous curvature of villus region. φ, relative size of the crypt region; v, normalized lumen volume; λ, potential line tension along the crypt/villus boundary. A. crypt budding driven by smaller crypt in-plane contraction α, leading to thinner crypts (decreased epithelial thickness ratio h c/h v and decreased radius of curvature R c/R v). A’. crypt budding driven by spontaneous curvature αc, leading to thicker crypts (increased h c/h v and decreased R c/R v). A”. organoid budding driven by line boundary tension, leading to constant thickness (constant h c/hvand decreased R c/R v). The width and location of the green lines indicate the strength and distribution of the driving forces in each model. B. Radius ratio (R c/R v) from six experimental samples with the corresponding model fit (see Supplementary Note). C-D. All six samples of bulged organoids can be collapsed via h c/h v vs. time (C) or R c/R v vs. time (D). E-F. Comparison of numerical (symbol) and analytic (line) results to verify that, thickness ratio h c/h v and radius ratio R c/R v respectively depends on in-plane contraction α (with crypt size φ=0.05) and coupled parameter φ−1 γc (with α = 1.15) for a bulged organoid (normalized volume v=5) (panel A), h c/h v and R c/R v depend on parameter u for a budded organoid (φ=0.2) (panel B), and analytic results also fit well with numerical results for the inflation of a bulged organoid (α = 1.15, γc = −0.025, φ = 0.05) or a budded organoid (u=6, φ=0.2). G. Phase diagram of crypt morphologies of an organoid (φ=0.2, ) under infinite volume expansion (v=108) (see Supplementary Note), with varying spontaneous curvature γc and in-plane contraction α. H. Influence of normalized volume of a crypt cell v ec (top) and that of a villus cell v ev (bottom) on h c/h v and R c/R v of a budded organoid (u=6, φ=0.2).
Extended Data Fig. 4. Actomyosin drives and maintains crypt budding.
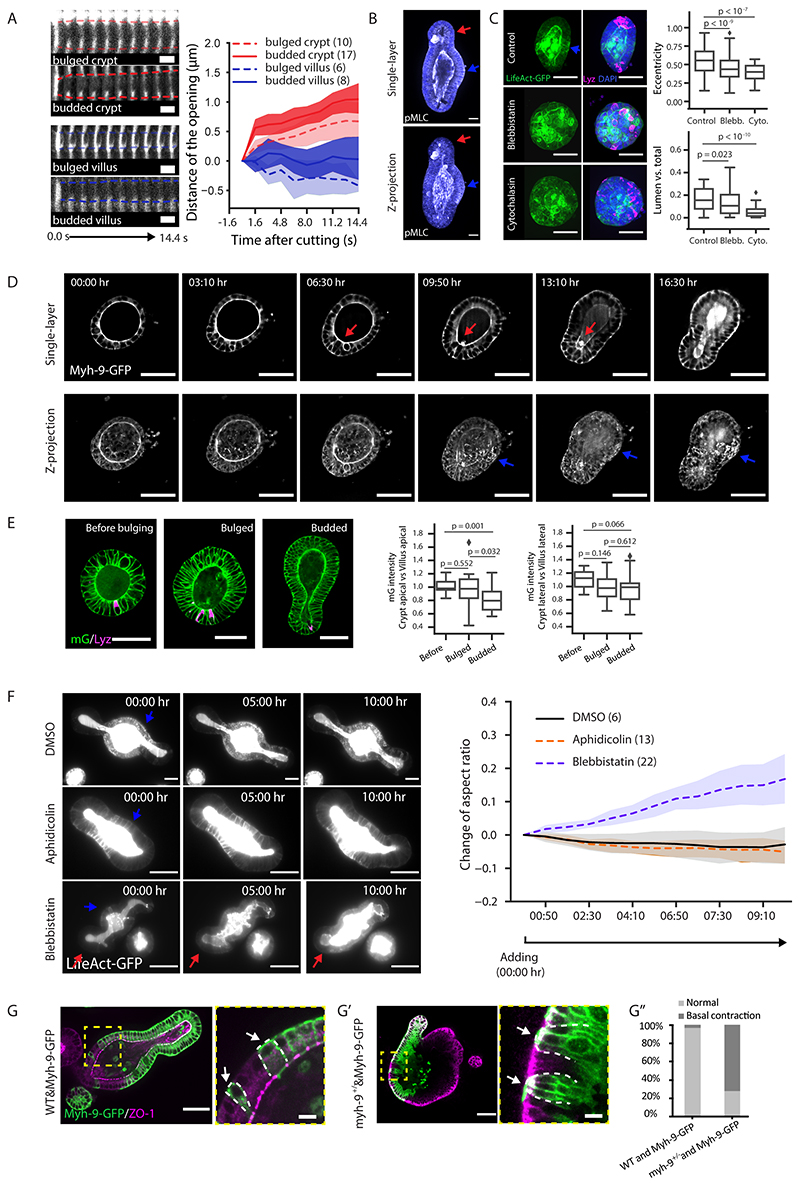
A-A’. Supplementary to Fig. 2D. A. Montage images across the regions of laser cutting and opening with surrounded LifeAct-GFP signal. Dashed lines outline the size of opening. A’. Plot for distance of openings after cutting. B. Staining of phosphorylated Myosin light chain (pMLC) in budded organoid with maximum z-projection (upper panel) and single section (lower panel). C. Day4 LifeAct-GFP organoids in Control (n=96), Blebbistatin (n=188) or Cytocalasin D (n=45) cultures. Left images, maximum z-projection of LifeAct-GFP; right images, merged maximum z-projection of LifeAct-GFP with Lyz and DAPI staining. Plots, quantification of organoid eccentricity and volume ratio (Lumen vs total). D. Representative time-lapse recording of organoid expressing Myh-9-GFP during crypt morphogenesis. Upper images, middle sections. Lower images, maximum z-projections. E. Membrane-targeted GFP (mG) in organoid before bulging (n=12), bulged (n=20) and budded (n=22) organoids in the middle section (images); quantification for ratios of mG intensity in cells (box plots). F. Representative time-lapse recording of budded LifeAct-GFP (white) organoid treated with DMSO control, Blebbistatin or Aphidicolin (left images), and corresponding plot for aspect ratio of the organoids (right plot, numbers of recordings in bracket). Solid lines represent average values, shadow regions standard deviations. G-G’, Merged images for Myh-9-GFP and ZO-1 staining in wild-type/Myh-9-GFP (G, left image) or in myh-9+/-/Myh-9-GFP (G’, left image) mosaic organoid with zoom-in areas (G and G’, right image) from yellow dashed rectangles. White dashed line outlines the morphology of Myh-9-GFP cells. G”, quantification on percentage of basal constriction in Myh-9-GFP cells next to wild-type (n=62) or myh-9+/- (n=79) cells Arrows: red (crypt), blue (villus), white (G and G’, basal domain of Myh-9-GFP cells). P-values are calculated from two-tailed t-test. Box-plot elements show 25% (Q1, upper bounds), 50% (median, black lines within the boxes) and 75% (Q3, lower bounds) quartiles, and whiskers denote 1.5× the interquartile range (maxima: Q3 + 1.5× (Q3-Q1); minima: Q1-1.5× (Q3-Q1)) with outliers (rhombuses). Scale bars: B (20μm), C-D, F, G-G’ left (50μm), G -G’ right zoom-in (10μm). Images in A-G are representative of three independent experiments. Data in G” are pulled from two independent experiments.
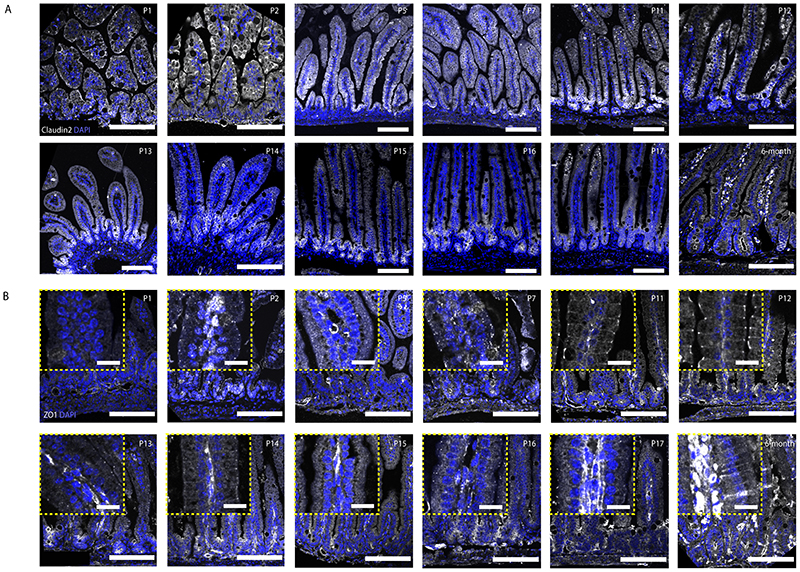
Extended Data Fig. 5. In vivo tissue-specific localization of Claudin2 and ZO-1.
In vivo staining of Claudin2 (A) and ZO-1 (B) in mouse small intestine at P1, P2, P5, P7, P11, P12, P13, P14, P15, P16, P17 and 6-month adult stages. Stainings were repeated at least three times independently with similar results. Yellow dashed rectangles in B indicate zoom-in regions of villi randomly selected from the same field of views in the presented images. Scale bars: A (100 μm), B (100 μm, zoom-in, 20 μm)
Extended Data Fig. 6. Sensitivity analysis of model results as a function of crypt apical tension and osmotic changes.
A. Phase diagram of crypt morphologies (, φ=0.2) as a function of normalized crypt apical tension m and villus cell volume v ev, showing the villus cell swelling favors crypt budding synergistically with crypt apical tension. B. Influence of crypt size φ and shape factor on critical values of m (with v ev=1, i.e. no cell swelling) and v ev (with m=2, i.e. constant crypt apical tension) for organoid budding. C-E. Influence of preferential proliferation of crypt cells, characterized as crypt size φg, on crypt morphology, with normalized organoid volume v=1 (panel C) or 1.2 (panel E). After rescaling volume v, crypt morphologies with preferential crypt growth (solid line) are close to those without preferential growth (dash line) (panel D, see SN for further details). F-H. Dependence of thickness ratio h c/h v and radius ratio R c/R v on normalized crypt apical tension m (v ev=1), with varied (φ=0.2) (panel F) and φ () (panel G), and on villus cell volume v ev (panel H), with varied m (, φ=0.2). I. Evolution of h c/h v and R c/R v during organoid inflation with varied m (, φ=0.2, v ev=1). J. Phase diagram of crypt morphologies upon infinite volume expansion (v=108) (showing three possible phases: fully closed, partially opening, or fully closed with vanishing apical surface), with varying and m (φ=0.2).
Extended Data Fig. 7. The impact of lumen volume on organoid morphology.
A-B”. Fitting for lumen inflation experiments with theoretical model. Images, microinjection of bulged (A) and budded (B) organoids for lumen inflation. Fittings (A’ and B’), fitting experimental measurements with its predictive model based on epithelial thickness ratio (h c/h v), organoid radius ratio (R c/R v) and lumen volume (v) change. Plots (A” and B”), measurements of h c/h v and R c/R v in bulged (A”, n=7 biologically independent organoids) and budded (B”, n=12 biologically independent organoids) organoids. P-values are calculated from two-tailed Paired Student’s t-test. C-C’. Evolution of morphometric parameters in bulged (C) or budded (C’) organoids during volume inflation, induced by PGE treatment (n=3 biologically independent organoids) and microinjection (n=3 biologically independent organoids), can be collapsed via R c/R v vs. v and h c/h v vs. v. Scale bars, 50 μm.
Extended Data Fig. 8. Regulation of lumen volume by enterocytes and the membrane transporters.
A. Representative images of DMSO-treated control (n=96), CHIR-(n=145) and IWP2-(n=78) treated organoids (left panels), and corresponding quantification on eccentricity and lumen ratio (right panels). B. Segmentation (Seg.) of single-cell volume based on β-Catenin signal in bulged and budded organoids (left images), violin plot for the corresponding quantification of single-cell volume (left plot), swarm plot for the lumen ratio of each organoids (right plot). Two-tailed t-test for cells in crypt (n=385) vs. villus (n=218) in bulged organoid (p = 0.311), crypt (n= 551) vs. villus (n=769) in budded organoids (p < 10-71), and bulged villus vs. budded villus (p < 10-75); for lumen ratio bulged (n=8) vs. budded (n=6) (p < 10-4). C. Immunostaining of β-Catenin in the section of mouse intestinal tissue at P1 and P11 stages, segmentation (seg.) of single-cell area, zoom-in crypt (red dashed rectangles) and villus (blue dashed rectangles) areas in β-Catenin staining image overlapping with single-cell segmentations (left images), violin plot for the quantification of single-cell areas (left plot), swarm plot for the quantification of distance between villi (right plot). Two-tailed t-test for cells in P1 crypts (n=54) vs. villi (n=156) (p < 10-14), in P11 crypts (n=82) vs. villi (n=159) (p < 10-14), and cells in P1 villi vs. P11 villi (p < 10-15); for distance between villi, P1 (n=32) vs. P11 (n=30) (p < 10-7). D. TSNE-based visualizations of single-cell RNA sequencing data indicate mRNA expressions of aquaporins, atp1a1 and atp1b1. E. Day4 organoid treated with DMSO control, Ouabain and CuSO4 (left images), quantification on the eccentricity and lumen ratio of control (n=155), Ouabain (n=146), CuSO4 (n=192) and Sotagliflozin (n=119) (right plots). P-values in box plots (A, E) are calculated from two-tailed t-test. Box plot elements show 25% (Q1, upper bounds), 50% (median, black lines within the boxes) and 75% (Q3, lower bounds) quartiles, and whiskers denote 1.5× the interquartile range (maxima: Q3 + 1.5× (Q3-Q1); minima: Q1-1.5× (Q3-Q1)) with outliers (rhombuses). Violin plot lines (B, C) denote quartile for each group. Scale bars: A-B (50 μm), C (left, 50 μm, zoom-in,10 μm), E (20 μm). Images in A, B, C and E are representative of > 3 independent experiments.
Extended Data Fig. 9. Piezo channels do not strongly regulate crypt budding.
A. TSNE-based visualizations of single-cell RNA sequencing data indicate the maker gene expression for crypt (left panel), villus (middle panel) and piezo1 (right panel). B. Piezo1 and DAPI staining in budded organoid. Piezo1 is detected in few single cells. Staining was repeated at least three times independently with similar results. C-E. Inhibition of Piezo1 (GdCl3 and GsMtx4) did not cause any defect in crypt morphogenesis, while activation of Piezo1 (Yoda-1) leads to slight increased lumen volume and reduced eccentricity. Reduced enterocytes (indicated by AdlB signal) are detected in Yoda-1-treated organoids. C. Representative images of Day 4 organoids treated in DMSO-control, GdCl3, GsMtx4 or Yoda-1 condition with AdlB, CD44 and DAPI staining in maximum z-projection. D-E. Corresponding box-plot quantifications of eccentricity (D) and lumen ratio (E) for organoids from C. Experiment (C-E) was repeated three times independently with similar results. Sample numbers: DMSO-control (n = 94 organoids), GdCl3 (n = 143 organoids), GsMtx4 (n = 68 organoids) and Yoda-1 (n = 71 organoids). P-values are calculated from two-tailed t-test. Box-plot elements show 25% (Q1, upper bounds), 50% (median, black lines within the boxes) and 75% (Q3, lower bounds) quartiles, and whiskers denote 1.5× the interquartile range (maxima: Q3 + 1.5× (Q3-Q1); minima: Q1-1.5× (Q3-Q1)) with outliers (rhombuses). Scale bars, 25 μm.
Extended Data Fig. 10. ECM remodelling is nonessential for crypt budding.
A. Representative images of Day 4 organoids treated by DMSO as control, or broad-spectrum inhibitors of matrix metalloproteinases (GM6001 and Marimastat) with Laminin staining for Matrigel and DAPI staining for cell nuclei in maximum z-projection. Experiment was repeated > 3 times independently with similar results. B. Corresponding box-plot quantifications of eccentricity for organoids from A. Experiments were repeated three times independently with similar results. Sample numbers: DMSO-control (n = 265 organoids), GM6001 (n = 102 organoids), and Marimastat (n = 94 organoids). P-values are calculated from two-tailed t-test. Box-plot elements show 25% (Q1, upper bounds), 50% (median, black lines within the boxes) and 75% (Q3, lower bounds) quartiles, and whiskers denote 1.5× the interquartile range (maxima: Q3 + 1.5× (Q3-Q1); minima: Q1-1.5× (Q3-Q1)). Scale bars, 50 μm.
Supplementary Material
Acknowledgements
We acknowledge the Lennon-Duménil laboratory for sharing the mouse line of Myh-9-GFP. We are grateful to the members of the Liberali laboratory and the FMI facilities for their support. We thank E. Tagliavini for IT support, L. Gelman for assistance and training, S. Bichet and A. Bogucki for helping with histology of mouse tissues, H. Kohler for FAC sorting, G. Q. G. de Medeiros for maintenance of light-sheet microscopy, M. G. Stadler for scRNA-seq analysis, G. Gay for discussions on 3D vertex model, the members of the Liberali laboratory, C. P. Heisenberg and C. Tsiairis for reading and feedback on the manuscript. Funding: Q.Y. is supported by the Postdoc fellowship from Peter und Taul Engelhorn Stiftung (PTES). This work received funding from the European Research Council (ERC) under the European Union’s Horizon 2020 research and Innovation Programme Grant Agreement no. 758617 (to P.L.) and Swiss National Foundation (SNF) (POOP3_157531 to P.L.), also from the ERC under the European Union’s Horizon 2020 Research and Innovation Program Grant Agreements 851288 (to E.H) and the Austrian Science Fund (FWF) (P 31639 to E.H.).
Footnotes
Author contributions
P.L. and Q.Y. conceived the project and designed the experiments. Q.Y. performed and analysed the experiments. E.H. proposed the physical theory. S.L.X. designed the physical model, performed the simulations. C.J.C. supported the micropipette aspiration. M.R. and D.V. assisted with the image processing and quantifications. F.M.G. generated organoid lines. C. J. C. and T.H. helped design micropipette aspiration and mosaic experiments. Q.Y. wrote the first version of the manuscript, S.L.X. wrote the first version of supplementary text, P.L., E.H. and Q.Y. supervised the study. P.L. and E.H. helped design the project and finalize the manuscript.
Competing interests
Authors declare no competing interests.
Data availability
Sequencing data that support the findings of this study have been deposited in the Gene Expression Omnibus (GEO) under accession code GSE115956. All other data supporting the findings of this study are available from the corresponding author on reasonable request.
Code availability
Codes generated and analysed during the current study are available on
https://github.com/fmi-basel/glib-nature_cell_biology2021-materials.git.
References
- 1.Spit M, Koo B-K, Maurice MM. Tales from the crypt: intestinal niche signals in tissue renewal, plasticity and cancer. Open Biol. 2018;8:180120. doi: 10.1098/rsob.180120. [DOI] [PMC free article] [PubMed] [Google Scholar]
- 2.Wells JM, Spence JR. How to make an intestine. Development. 2014;141:752–760. doi: 10.1242/dev.097386. [DOI] [PMC free article] [PubMed] [Google Scholar]
- 3.Wang S, Walton KD, Gumucio DL. Signals and forces shaping organogenesis of the small intestine. Curr Top Dev Biol. 2019;132:31–65. doi: 10.1016/bs.ctdb.2018.12.001. [DOI] [PMC free article] [PubMed] [Google Scholar]
- 4.Walton KD, Mishkind D, Riddle MR, Tabin CJ, Gumucio DL. Blueprint for an intestinal villus: Species-specific assembly required. Wiley Interdiscip Rev Dev Biol. 2018;7:e317. doi: 10.1002/wdev.317. [DOI] [PMC free article] [PubMed] [Google Scholar]
- 5.Hughes AJ, et al. Engineered Tissue Folding by Mechanical Compaction of the Mesenchyme. Dev Cell. 2018;44:165–178.:e6. doi: 10.1016/j.devcel.2017.12.004. [DOI] [PMC free article] [PubMed] [Google Scholar]
- 6.Shyer AE, Huycke TR, Lee C, Mahadevan L, Tabin CJ. Bending gradients: how the intestinal stem cell gets its home. Cell. 2015;161:569–580. doi: 10.1016/j.cell.2015.03.041. [DOI] [PMC free article] [PubMed] [Google Scholar]
- 7.Farin HF, et al. Visualization of a short-range Wnt gradient in the intestinal stem-cell niche. Nature. 2016;530:340–343. doi: 10.1038/nature16937. [DOI] [PubMed] [Google Scholar]
- 8.Nerurkar NL, Mahadevan L, Tabin CJ. BMP signaling controls buckling forces to modulate looping morphogenesis of the gut. Proc Natl Acad Sci USA. 2017;114:2277–2282. doi: 10.1073/pnas.1700307114. [DOI] [PMC free article] [PubMed] [Google Scholar]
- 9.Walton KD, et al. Villification in the mouse: Bmp signals control intestinal villus patterning. Development. 2016;143:427–436. doi: 10.1242/dev.130112. [DOI] [PMC free article] [PubMed] [Google Scholar]
- 10.Hartl L, Huelsz-Prince G, van Zon J, Tans SJ. Apical constriction is necessary for crypt formation in small intestinal organoids. Dev Biol. 2019;450:76–81. doi: 10.1016/j.ydbio.2019.03.009. [DOI] [PubMed] [Google Scholar]
- 11.Sumigray KD, Terwilliger M, Lechler T. Morphogenesis and Compartmentalization of the Intestinal Crypt. Dev Cell. 2018;45:183–197.:e5. doi: 10.1016/j.devcel.2018.03.024. [DOI] [PMC free article] [PubMed] [Google Scholar]
- 12.Dahl-Jensen S, Grapin-Botton A. The physics of organoids: a biophysical approach to understanding organogenesis. Development. 2017;144:946–951. doi: 10.1242/dev.143693. [DOI] [PubMed] [Google Scholar]
- 13.Kretzschmar K, Clevers H. Everything has its time: Id2 clocks embryonic specification of Lgr5(+) gut stem cells. EMBO J. 2017;36:837–839. doi: 10.15252/embj.201796482. [DOI] [PMC free article] [PubMed] [Google Scholar]
- 14.Sato T, Clevers H. Growing self-organizing mini-guts from a single intestinal stem cell: mechanism and applications. Science. 2013;340:1190–1194. doi: 10.1126/science.1234852. [DOI] [PubMed] [Google Scholar]
- 15.Serra D, et al. Self-organization and symmetry breaking in intestinal organoid development. Nature. 2019;569:66–72. doi: 10.1038/s41586-019-1146-y. [DOI] [PMC free article] [PubMed] [Google Scholar]
- 16.Sato T, et al. Paneth cells constitute the niche for Lgr5 stem cells in intestinal crypts. Nature. 2011;469:415–418. doi: 10.1038/nature09637. [DOI] [PMC free article] [PubMed] [Google Scholar]
- 17.Sato T, et al. Single Lgr5 stem cells build crypt-villus structures in vitro without a mesenchymal niche. Nature. 2009;459:262–265. doi: 10.1038/nature07935. [DOI] [PubMed] [Google Scholar]
- 18.Riedl J, et al. Lifeact mice for studying F-actin dynamics. Nat Methods. 2010;7:168–169. doi: 10.1038/nmeth0310-168. [DOI] [PubMed] [Google Scholar]
- 19.Okuda S, Inoue Y, physicobiology TABA. 2015, Three-dimensional vertex model for simulating multicellular morphogenesis. Biophys Physicobiol. 2015 doi: 10.2142/biophysico.12.0_13. eCollection. [DOI] [PMC free article] [PubMed] [Google Scholar]
- 20.Messal HA, et al. Tissue curvature and apicobasal mechanical tension imbalance instruct cancer morphogenesis. Nature. 2019;566:126–130. doi: 10.1038/s41586-019-0891-2. [DOI] [PMC free article] [PubMed] [Google Scholar]
- 21.Hannezo E, Prost J, Joanny J-F. Theory of epithelial sheet morphology in three dimensions. PNAS. 2014;111:27–32. doi: 10.1073/pnas.1312076111. [DOI] [PMC free article] [PubMed] [Google Scholar]
- 22.Rozman J, Krajnc M, Ziherl P. Collective Cell Mechanics of Small-Organoid Morphologies. Nature Commun. 2020;11:3805. doi: 10.1038/s41467-020-17535-4. [DOI] [PMC free article] [PubMed] [Google Scholar]
- 23.Li J, et al. The Strength of Mechanical Forces Determines the Differentiation of Alveolar Epithelial Cells. Dev Cell. 2018;44:297–312.:e5. doi: 10.1016/j.devcel.2018.01.008. [DOI] [PubMed] [Google Scholar]
- 24.Fernandez-Gonzalez R, de Simoes SM, Röper J-C, Eaton S, Zallen JA. Myosin II dynamics are regulated by tension in intercalating cells. Dev Cell. 2009;17:736–743. doi: 10.1016/j.devcel.2009.09.003. [DOI] [PMC free article] [PubMed] [Google Scholar]
- 25.Maître J-L, et al. Asymmetric division of contractile domains couples cell positioning and fate specification. Nature. 2016;536:344–348. doi: 10.1038/nature18958. [DOI] [PMC free article] [PubMed] [Google Scholar]
- 26.Munjal A, Lecuit T. Actomyosin networks and tissue morphogenesis. Development. 2014;141:1789–1793. doi: 10.1242/dev.091645. [DOI] [PubMed] [Google Scholar]
- 27.Fath KR, Mamajiwalla SN, Burgess DR. The cytoskeleton in development of epithelial cell polarity. Cell J Sci Suppl. 1993;17:65–73. doi: 10.1242/jcs.1993.supplement_17.10. [DOI] [PubMed] [Google Scholar]
- 28.Zhang Y, et al. Mouse models of MYH9-related disease: mutations in nonmuscle myosin II-A. Blood. 2012;119:238–250. doi: 10.1182/blood-2011-06-358853. [DOI] [PMC free article] [PubMed] [Google Scholar]
- 29.Chabaud M, et al. Cell migration and antigen capture are antagonistic processes coupled by myosin II in dendritic cells. Nature Communications. 2015;6:7526–16. doi: 10.1038/ncomms8526. [DOI] [PMC free article] [PubMed] [Google Scholar]
- 30.Muzumdar MD, Tasic B, Miyamichi K, Li L, Luo L. A global double-fluorescent Cre reporter mouse. genesis. 2007;45:593–605. doi: 10.1002/dvg.20335. [DOI] [PubMed] [Google Scholar]
- 31.Zhao B, et al. The non-muscle-myosin-II heavy chain Myh9 mediates colitis-induced epithelium injury by restricting Lgr5+ stem cells. Nature Communications. 2015;6:7166–12. doi: 10.1038/ncomms8166. [DOI] [PubMed] [Google Scholar]
- 32.Jacobelli J, et al. Confinement-optimized three-dimensional T cell amoeboid motility is modulated via myosin IIA-regulated adhesions. Nat Immunol. 2010;11:953–961. doi: 10.1038/ni.1936. [DOI] [PMC free article] [PubMed] [Google Scholar]
- 33.Odenwald MA, et al. The scaffolding protein ZO-1 coordinates actomyosin and epithelial apical specializations in vitro and in vivo. J Biol Chem. 2018;293:17317–17335. doi: 10.1074/jbc.RA118.003908. [DOI] [PMC free article] [PubMed] [Google Scholar]
- 34.Jülicher F, Lipowsky R. Shape transformations of vesicles with intramembrane domains. Phys Rev E Stat Phys Plasmas Fluids Relat Interdiscip Topics. 1996;53:2670–2683. doi: 10.1103/physreve.53.2670. [DOI] [PubMed] [Google Scholar]
- 35.Miyoshi H, et al. Prostaglandin E2 promotes intestinal repair through an adaptive cellular response of the epithelium. EMBO J. 2017;36:5–24. doi: 10.15252/embj.201694660. [DOI] [PMC free article] [PubMed] [Google Scholar]
- 36.Ricciotti E, Fitz GA. Gerald, Prostaglandins and inflammation. Arterioscler Thromb Vasc Biol. 2011;31:986–1000. doi: 10.1161/ATVBAHA.110.207449. [DOI] [PMC free article] [PubMed] [Google Scholar]
- 37.Grant CN, et al. Human and mouse tissue-engineered small intestine both demonstrate digestive and absorptive function. Am J Physiol Gastrointest Liver Physiol. 2015;308:G664–77. doi: 10.1152/ajpgi.00111.2014. [DOI] [PMC free article] [PubMed] [Google Scholar]
- 38.Bagriantsev SN, Gracheva EO, Gallagher PG. Piezo proteins: regulators of mechanosensation and other cellular processes. J Biol Chem. 2014;289:31673–31681. doi: 10.1074/jbc.R114.612697. [DOI] [PMC free article] [PubMed] [Google Scholar]
- 39.He L, Si G, Huang J, Samuel ADT, Perrimon N. Mechanical regulation of stem-cell differentiation by the stretch-activated Piezo channel. Nature. 2018;555:103–106. doi: 10.1038/nature25744. [DOI] [PMC free article] [PubMed] [Google Scholar]
- 40.Syeda R, et al. Chemical activation of the mechanotransduction channel Piezo1. Elife. 2015;4:1884. doi: 10.7554/eLife.07369. [DOI] [PMC free article] [PubMed] [Google Scholar]
- 41.Pouille P-A, Ahmadi P, Brunet A-C, Farge E. Mechanical signals trigger Myosin II redistribution and mesoderm invagination in Drosophila embryos. Sci Signal. 2009;2:ra16. doi: 10.1126/scisignal.2000098. [DOI] [PubMed] [Google Scholar]
- 42.Nishimura T, Takeichi M. Shroom3-mediated recruitment of Rho kinases to the apical cell junctions regulates epithelial and neuroepithelial planar remodeling. Development. 2008;135:1493–1502. doi: 10.1242/dev.019646. [DOI] [PubMed] [Google Scholar]
- 43.Behrndt M, et al. Forces driving epithelial spreading in zebrafish gastrulation. Science. 2012;338:257–260. doi: 10.1126/science.1224143. [DOI] [PubMed] [Google Scholar]
- 44.Dawes RE.-Hoanget al. folded gastrulation, cell shape change and the control of myosin localization. Development. 2005;132:4165–4178. doi: 10.1242/dev.01938. [DOI] [PubMed] [Google Scholar]
- 45.Chauhan BK, Lou M, Zheng Y, Lang RA. Balanced Rac1 and RhoA activities regulate cell shape and drive invagination morphogenesis in epithelia. Proc Natl Acad Sci USA. 2011;108:18289–18294. doi: 10.1073/pnas.1108993108. [DOI] [PMC free article] [PubMed] [Google Scholar]
- 46.Sui L, et al. Differential lateral and basal tension drive folding of Drosophila wing discs through two distinct mechanisms. Nature Communications. 2018;9:4620–13. doi: 10.1038/s41467-018-06497-3. [DOI] [PMC free article] [PubMed] [Google Scholar]
- 47.Rout WR, Formal SB, Dammin GJ, Giannella RA. Pathophysiology of Salmonella diarrhea in the Rhesus monkey: Intestinal transport, morphological and bacteriological studies. Gastroenterology. 1974;67:59–70. [PubMed] [Google Scholar]
- 48.Boshuizen JA, et al. Changes in small intestinal homeostasis, morphology, and gene expression during rotavirus infection of infant mice. J Virol. 2003;77:13005–13016. doi: 10.1128/JVI.77.24.13005-13016.2003. [DOI] [PMC free article] [PubMed] [Google Scholar]
- 49.Fouchard J, et al. Curling of epithelial monolayers reveals coupling between active bending and tissue tension. bioRxiv. 2019;566:806455. doi: 10.1073/pnas.1917838117. [DOI] [PMC free article] [PubMed] [Google Scholar]
- 50.Krndija D, et al. Active cell migration is critical for steady-state epithelial turnover in the gut. Science. 2019;365:705–710. doi: 10.1126/science.aau3429. [DOI] [PubMed] [Google Scholar]
- 51.Perez-Gonzalez, et al. Mechanical compartmentalization of the intestinal organoid enables crypt folding and collective cell migration. [DOI] [PMC free article] [PubMed]
- 52.Chan CJ, et al. Hydraulic control of mammalian embryo size and cell fate. Nature. 2019;571:112–116. doi: 10.1038/s41586-019-1309-x. [DOI] [PubMed] [Google Scholar]
- 53.Chan CJ, Hiiragi T. Integration of luminal pressure and signalling in tissue self-organization. Development. 2020;147:dev181297. doi: 10.1242/dev.181297. [DOI] [PubMed] [Google Scholar]
- 54.Dumortier JG, et al. Hydraulic fracturing and active coarsening position the lumen of the mouse blastocyst. Science. 2019;365:465–468. doi: 10.1126/science.aaw7709. [DOI] [PubMed] [Google Scholar]
- 55.Szegedy C, Liu W, Jia Y, Sermanet P, Reed S. The IEEE Conference on Computer Vision and Pattern Recognition (CVPR); 2015. [Google Scholar]
- 56.Barbier de Reuille P, et al. MorphoGraphX: A platform for quantifying morphogenesis in 4D. Elife. 2015;4:05864. doi: 10.7554/eLife.05864. [DOI] [PMC free article] [PubMed] [Google Scholar]
- 57.B de Reuille P, Robinson S, Smith RS. Quantifying cell shape and gene expression in the shoot apical meristem using MorphoGraphX. Methods Mol Biol. 2014;1080:121–134. doi: 10.1007/978-1-62703-643-6_10. [DOI] [PubMed] [Google Scholar]
- 58.Yang Q, Roiz D, Mereu L, Daube M, Hajnal A. The Invading Anchor Cell Induces Lateral Membrane Constriction during Vulval Lumen Morphogenesis in C. elegans. Dev Cell. 2017;42:271–285.:e3. doi: 10.1016/j.devcel.2017.07.008. [DOI] [PubMed] [Google Scholar]
Associated Data
This section collects any data citations, data availability statements, or supplementary materials included in this article.
Supplementary Materials
Data Availability Statement
Sequencing data that support the findings of this study have been deposited in the Gene Expression Omnibus (GEO) under accession code GSE115956. All other data supporting the findings of this study are available from the corresponding author on reasonable request.
Codes generated and analysed during the current study are available on
https://github.com/fmi-basel/glib-nature_cell_biology2021-materials.git.


