Abstract
The MYC protein is an oncogenic transcription factor that binds globally to active promoters and promotes transcriptional elongation by RNAPII1,2. Deregulated expression of the paralogous MYCN protein drives the development of neuronal and neuroendocrine tumors and is often associated with a particularly poor prognosis3. Here we show that, like MYC, activation of MYCN in human neuroblastoma cells induces promoter escape of RNAPII. If pause release of RNAPII fails, MYCN recruits the BRCA1 protein to promoter-proximal regions. Recruitment of BRCA1 prevents MYCN-dependent accumulation of stalled RNAPII and enhances transcriptional activation by MYCN. Mechanistically, BRCA1 stabilizes mRNA de-capping complexes and enables MYCN to suppress R-loop formation in promoter-proximal regions. Recruitment of BRCA1 requires the ubiquitin-specific protease, USP11, which binds specifically to MYCN that is de-phosphorylated at Thr58. USP11, BRCA1 and MYCN stabilize each other on chromatin, preventing proteasomal turnover of MYCN. Since BRCA1 is highly expressed in neuronal progenitor cells during early development4 and since MYC is less efficient than MYCN in recruiting BRCA1, our findings argue that a cell lineage-specific stress response enables MYCN-driven tumors to cope with deregulated RNAPII function (176 words).
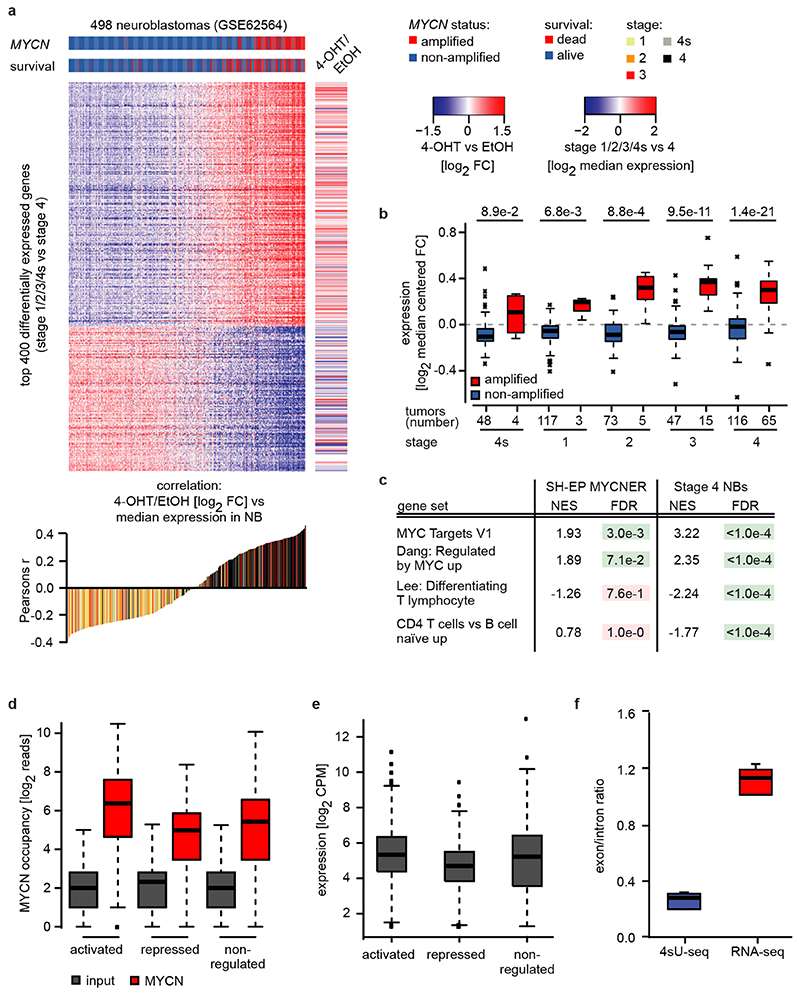
To study MYCN’s transcriptional function, we expressed a MYCNER chimeric protein in SH-EP neuroblastoma cells, which do not express endogenous MYCN (Figure 1a). RNA-sequencing of cells treated with 4-hydroxytamoxifen (4-OHT) revealed that activation of MYCN generated an expression profile that discriminated MYCN-amplified neuroblastoma from non MYCN-amplified tumors independent of tumor stage (Extended Data Figure 1a,b). A strongly increased expression of canonical MYC-activated genes in MYCN-amplified relative to non-amplified tumors of the same stage accounted for the discrimination (Extended Data Figure 1c). MYCN-amplified tumors also displayed a suppression of genes specifically expressed in T-cells, which likely reflects a low number of T-cells in these tumors (Extended Data Figure 1c)5.
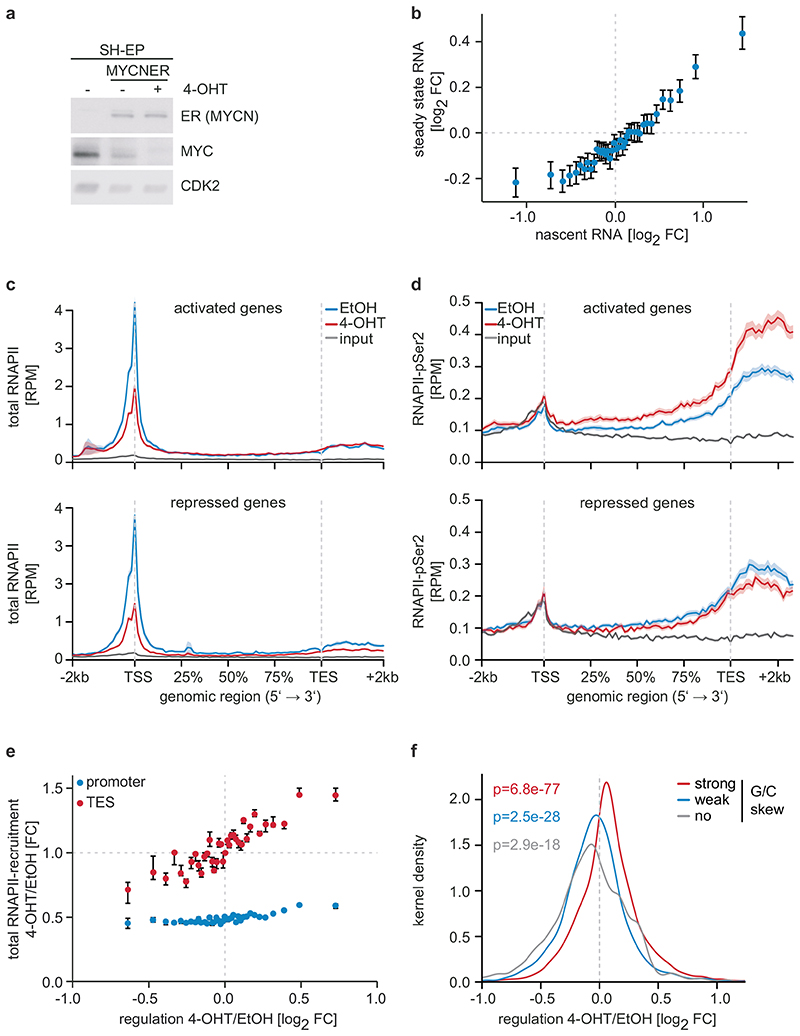
Figure 1. Effects of MYCN on gene expression and RNAPII function.
a: Immunoblot documenting MYC and MYCNER levels in SH-EP cells. Cells were treated with 200 nM 4-OHT or EtOH for 3 h. CDK2 is loading control (n=3; in all legends, n indicates the number of independent biological replicates).
b: Correlation between regulation by MYCN measured by nascent and steady-state RNA levels. 18,213 genes were binned and the mean including the 95 % confidence interval is plotted (n=3).
c: Metagene plots of total RNAPII after 4-OHT treatment (3 h) for the 914 most strongly MYCN-activated (top) and 615 repressed genes (bottom). For each genomic bin, the mean is plotted and the shadow illustrates SEM. RPM: reads per million mapped reads (n=4).
d: Metagene plots (mean+SEM as shadow) of RNAPII-pSer2 for MYCN-activated and -repressed genes (n=4).
e: Correlation of transcriptional changes and RNAPII occupancy at promoters and transcriptional end sites (TES) after MYCNER activation. 11,093 expressed genes were binned based on log2FC. Plots show median with bootstrapped 95 % confidence intervals with 1,000 re-samplings as error bars.
f: Kernel density plot regulation by MYCN of gene with promoters that have different G/C skews (strong:4,003; weak:3,381; no:1,377) (n=3). p-values were calculated with a two-tailed Wilcoxon one-sample signed-rank test with μ=0.
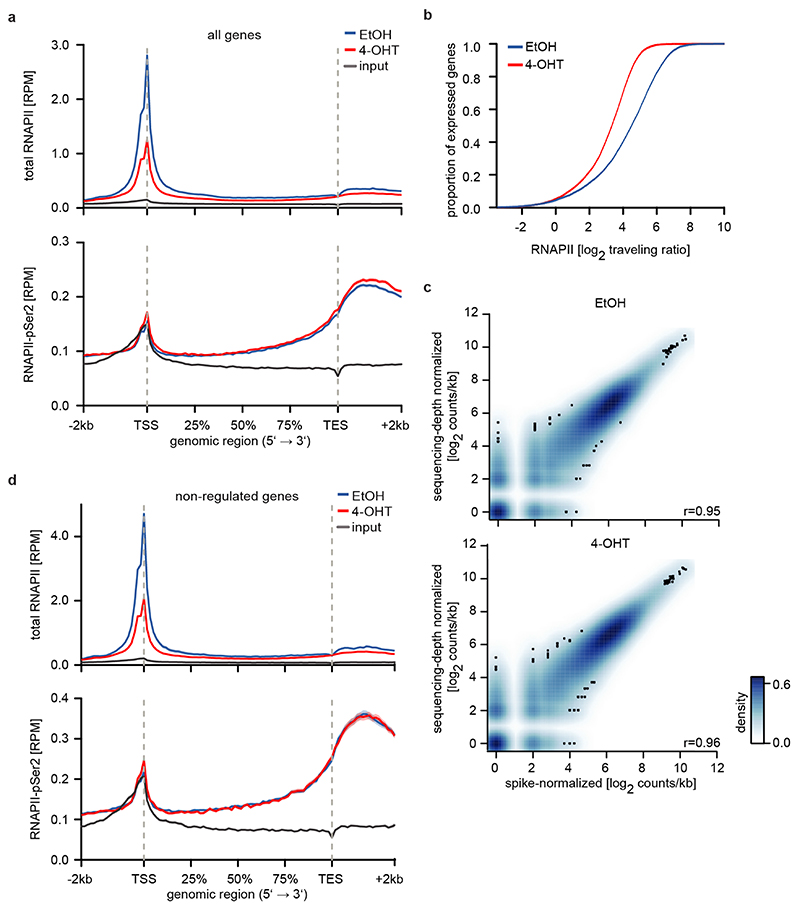
Activation of MYCN led to both activation and repression of genes (Figure 1b). Chromatin-immunoprecipitation coupled with sequencing (ChIP-sequencing) showed that promoters of both activated and repressed genes were bound by MYCN (Extended Data Figure 1d). MYCN-activated genes bound more MYCN and had a higher basal expression than MYCN-repressed genes (Extended Data Figure 1d,e)6–8. Sequencing of 4sU-labelled nascent RNA showed that changes in RNA synthesis paralleled those in steady-state mRNA levels (Figure 1b; Extended Data Figure 1f)6. Activation of MYCN caused a shift in overall RNAPII occupancy at actively expressed genes from the promoter into the gene body that has been observed previously in response to MYC (Figure 1c and Extended Data Figure 2a,b)9. RNAPII occupancy data were identical whether data were read-normalized or normalized using a spike-in control (Extended Data Figure 2c). ChIP-sequencing of RNAPII that is phosphorylated at Ser2 (pSer2) confirmed that activation of MYCN caused an increase in transcriptional elongation when averaged over all genes (Extended Data Figure 2a). Stratifying the alteration in RNAPII occupancy to MYCN activation by the change in mRNA expression showed that the decrease in RNAPII occupancy at the promoter occurred uniformly on activated, repressed and non-regulated genes expressed to a similar level (Figure 1c and Extended Data Figure 2d). In contrast, the MYCN-dependent change in RNAPII and pSer2 occupancy in the body of the gene or at the transcription end site was highly regulated: RNAPII-pSer2 increased strongly on MYCN-activated genes, did not change on non-regulated genes and decreased on MYCN-repressed genes (Figure 1d,e and Extended Data Figure 2d). Over all genes, the amount of elongating RNAPII paralleled the MYCN-dependent change in mRNA levels (Figure 1e). A strong G/C-skew10 correlated closely with a positive regulation by MYCN (Figure 1f).
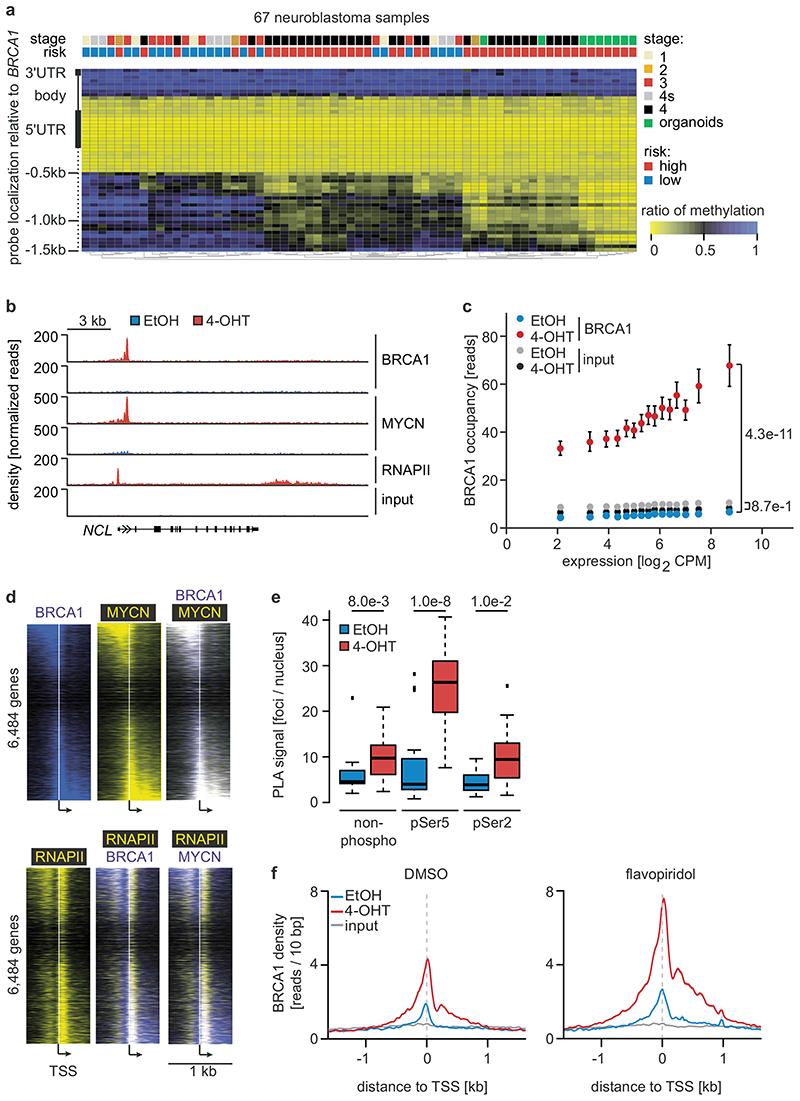
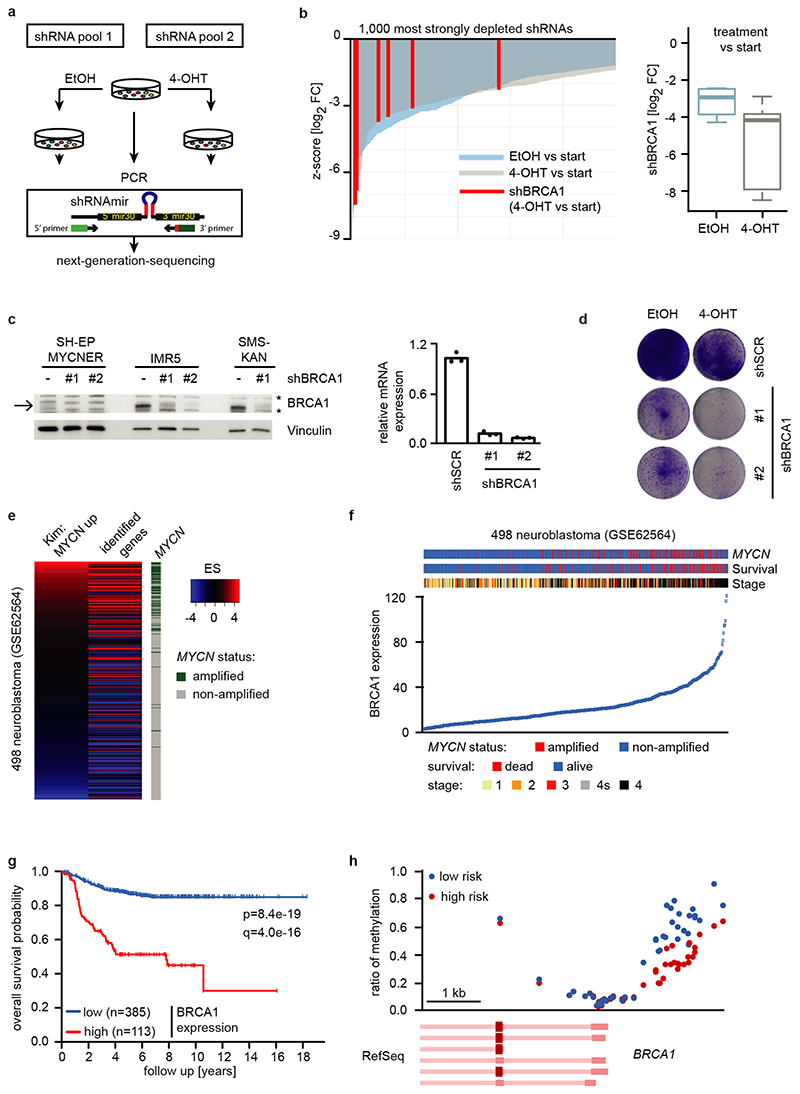
We reasoned that activation of MYCNER would increase the dependence on genes that control transcriptional functions of MYCN and screened for shRNAs that decrease the fitness of MYCNER cells in the presence, but less in the absence of 4-OHT (Extended Data Figure 3a). Out of a total of 12,931 shRNAs, this screen identified 104 shRNAs targeting 99 genes that were more strongly depleted upon growth in the presence of 4-OHT (Supplementary Table 1). Intriguingly, activation of MYCN strongly enhanced the selection against three out of six shRNAs targeting BRCA1 that were present in the screen (Extended Data Figure 3b). Independent shRNAs targeting BRCA1 suppressed colony formation more strongly in the presence of 4-OHT (Extended Data Figure 3c,d). The expression of genes targeted by hits from this screen was enhanced in MYCN-amplified neuroblastomas (Extended Data Figure 3e). Indeed, BRCA1 expression closely correlated with MYCN-amplification (Extended Data Figure 3f) and is a strong indicator of poor prognosis (Extended Data Figure 3g). Available datasets of copy number variation did not show increases for BRCA1 in MYCN-amplified tumors (not shown). In contrast, genome-wide DNA methylation data identified BRCA1 as the most significant differentially methylated gene in high-risk and MYCN-amplified neuroblastoma (Figure 2a). Specifically, the BRCA1 promoter was significantly hypo-methylated in high-risk neuroblastoma, whereas hyper-methylation was observed in low-risk patients (Extended Data Figure 3h), arguing that there is selective pressure for high BRCA1 expression in MYCN-amplified neuroblastoma.
Figure 2. Status of BRCA1 in MYCN-amplified neuroblastoma cells and its MYCN-dependent recruitment to chromatin.
a: BRCA1 genomic region with average methylation status of 67 primary neuroblastomas and organoids.
b: Genome browser tracks of the NCL locus upon 3 h (RNAPII and MYCN) and 5 h (BRCA1) of 4-OHT treatment (n=2).
c: BRCA1 occupancy in promoter-proximal regions. 7,812 expressed genes (log2 CPM>1.28; CPM: counts per million) with a BRCA1 peak in the promoter were binned. The mean (+/- 95 % confidence interval) is shown. p-values for the difference in slopes between -OHT and +OHT were calculated using a linear model and ANCOVA.
d: Position of BRCA1, MYCN and RNAPII on chromatin relative to transcriptional start sites (TSS). The heat map is sorted by the position of the MYCN-binding site.
e: Quantification of proximity ligation assays documenting complex formation of BRCA1 with non-phosphorylated, Ser5- and Ser2-phosphorylated RNAPII upon activation of MYCNER (4 h). p-values were calculated using a two-tailed Wilcoxon rank-sum test (n=3). In the box plot, the central line reflects the median and the borders of the boxes show the interquartile range of the plotted data. The whiskers extend to 1.5x of the interquartile range and outliers are shown as dots.
f: BRCA1 occupancy after treatment with 4-OHT or EtOH (5 h) in DMSO (top) and flavopiridol-treated (bottom) cells with SEM as shadow.
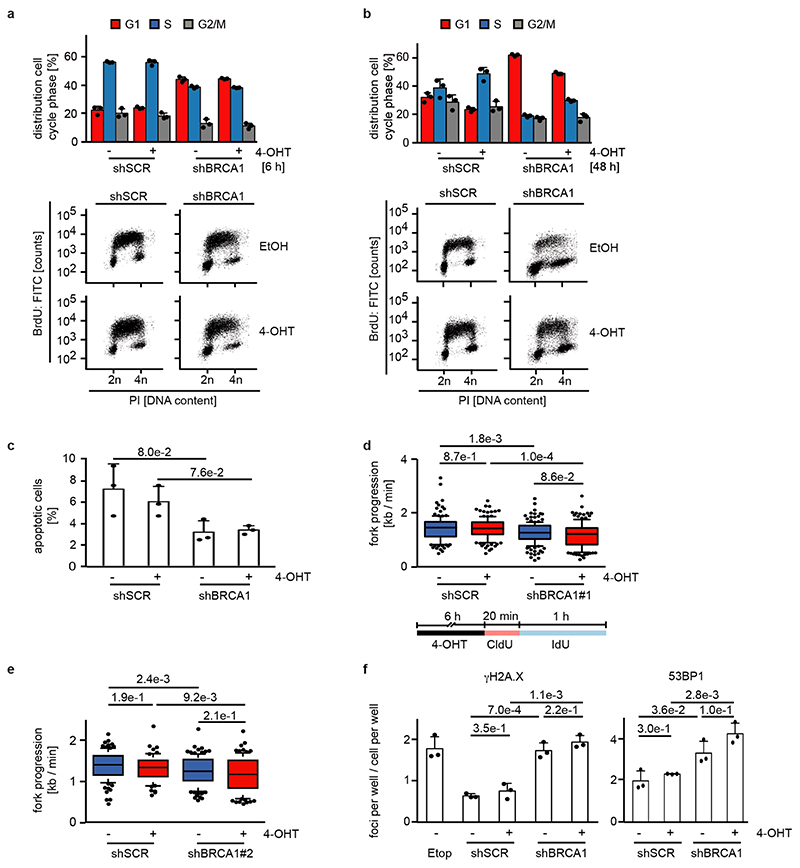
Since BRCA1 stabilizes replication forks and promotes homologous recombination11, we tested whether depletion of BRCA1 interferes with DNA replication or causes double-strand breaks in a MYCN-dependent manner. Depletion of BRCA1 slowed cell cycle progression and led to an increase in cells in the G1-phase of the cell cycle (Extended Data Figure 4a,b). Staining with BrdU showed that BRCA1 depletion reduced the percentage of cells in S-phase and that activation of MYCNER stimulated S-phase entry both in control and in BRCA1-depleted cells (Extended Data Figure 4b). Depletion of BRCA1 did not induce apoptosis before or after MYCNER activation (Extended Data Figure 4c). DNA fiber assays showed that depletion of BRCA1 reduced the average speed of replication fork progression, but activation of MYCNER had no significant effect (Extended Data Figure 4d,e). Depletion of BRCA1 also led to an increase in the number of γH2A.X and 53BP1 foci, indicators of double-strand DNA breaks (Extended Data Figure 4f), while prolonged activation of MYCN (24 h) led to only a small and statistically insignificant increase in foci number. This argued that MYCN-induced perturbance of DNA replication or double-strand breaks are unlikely to be the main reason for the increased dependence on BRCA1.
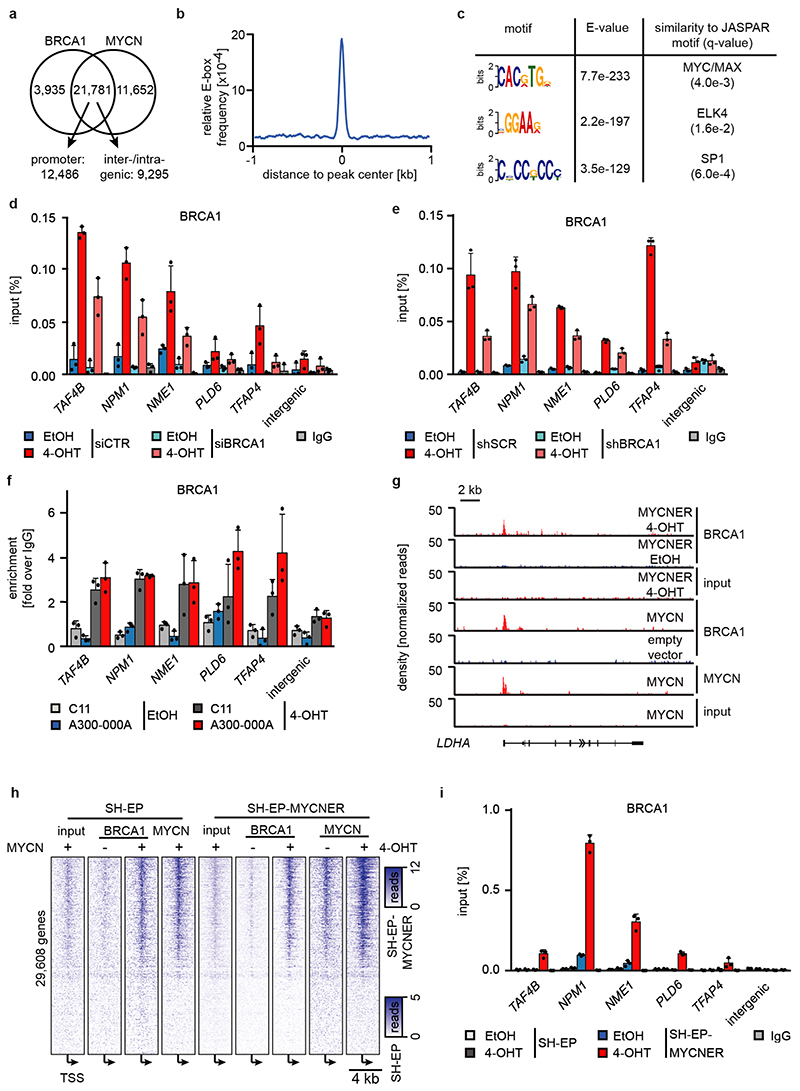
No association of BRCA1 was found within promoter-proximal regions in control cells (Figure 2b). Activation of MYCNER led to a strong increase in BRCA1 association with promoter-proximal regions with the extent of recruitment paralleling expression of the downstream gene (Figure 2b,c). In addition, MYCN recruited BRCA1 to intergenic sites (Extended Data Figure 5a). BRCA1-binding sites closely overlapped with MYCN-binding sites (Figure 2b,d). Consistently, a consensus MYC-binding sequence (E-box) was enriched around BRCA1 binding sites (Extended Data Figure 5b) and a de novo search for DNA binding motifs in BRCA1 binding sites identified this sequence as the most strongly enriched DNA motif upon activation of MYCN (Extended Data Figure 5c). Both siRNA- and shRNA-mediated depletion of BRCA1 reduced the signal observed in ChIP-experiments (Extended Data Figure 5d,e). ChIP-experiments using a second α-BRCA1 antibody also confirmed the validity of the results (Extended Data Figure 5f). Stable constitutive expression of MYCN also recruited BRCA1 to promoter-proximal regions (Extended Data Figure 5g,h). In contrast, addition of 4-OHT to SH-EP cells that do not express MYCNER had no effect on BRCA1 chromatin occupancy (Extended Data Figure 5i).
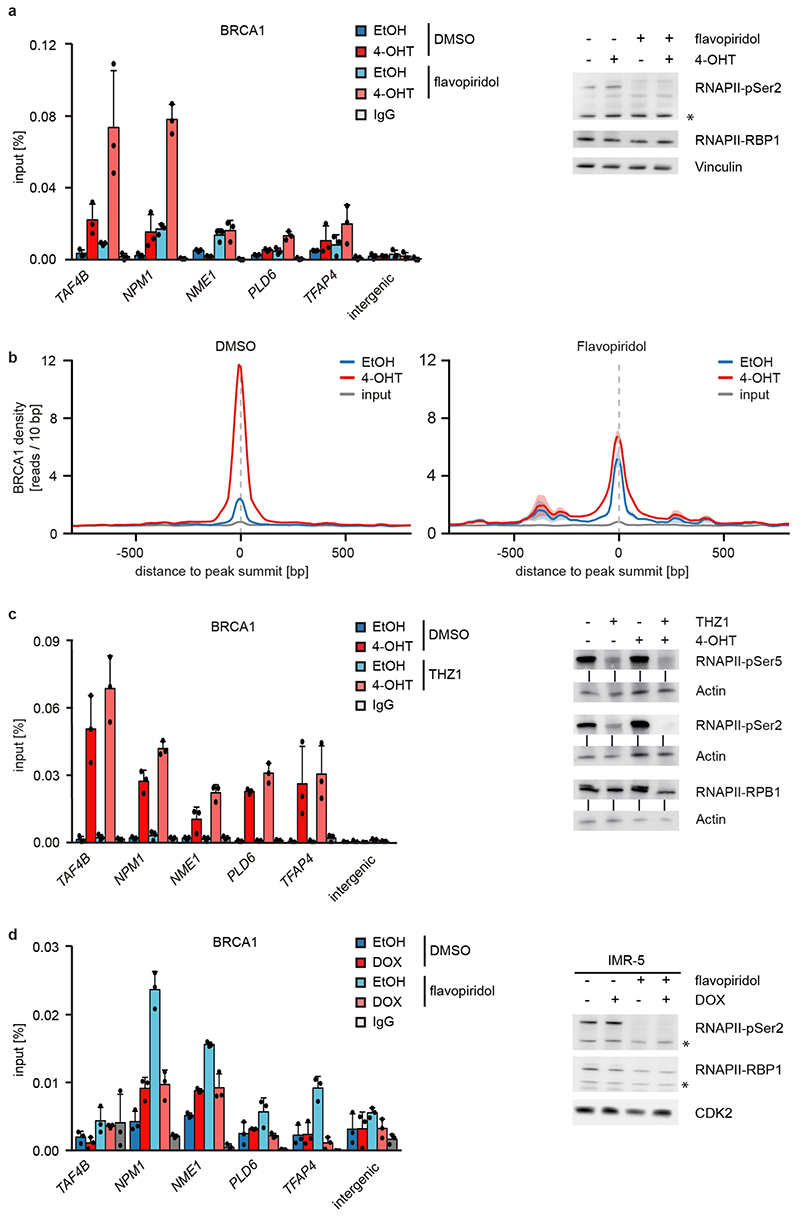
MYCN activation strongly increased the association of BRCA1 with RNAPII that is phosphorylated at Ser5, while the association with non-phosphorylated RNAPII or with RNAPII phosphorylated at Ser2 was only slightly increased (Figure 2e)12. Inhibition of the CDK9 kinase that phosphorylates RNAPII at Ser2, further enhanced recruitment of BRCA1 by MYCN to promoters (Figure 2f and Extended Data Figure 6a), while it decreased recruitment to joint MYCN/BRCA1 sites not localized in promoters, indicating a competition for limited pools of BRCA1 (Extended Data Figure 6b)12. Inhibition of the CDK7 kinase that phosphorylates RNAPII at Ser5, led to only a small increase in recruitment (Extended Data Figure 6c). Inhibition of CDK9 in IMR-5 neuroblastoma cells, which harbor amplified MYCN, enhanced recruitment of BRCA1 in a MYCN-dependent manner (Extended Data Figure 6d). We concluded that stalling of RNA polymerase at the pause site strongly enhances recruitment of BRCA1 by MYCN 13.
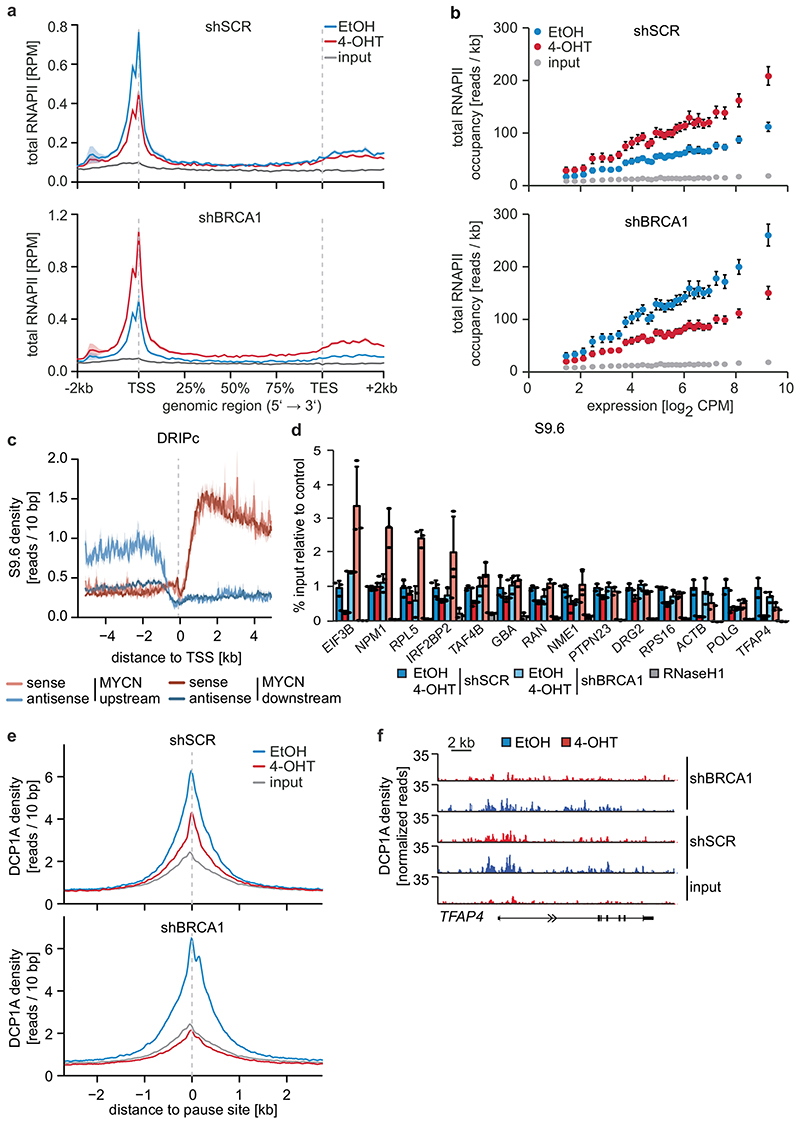
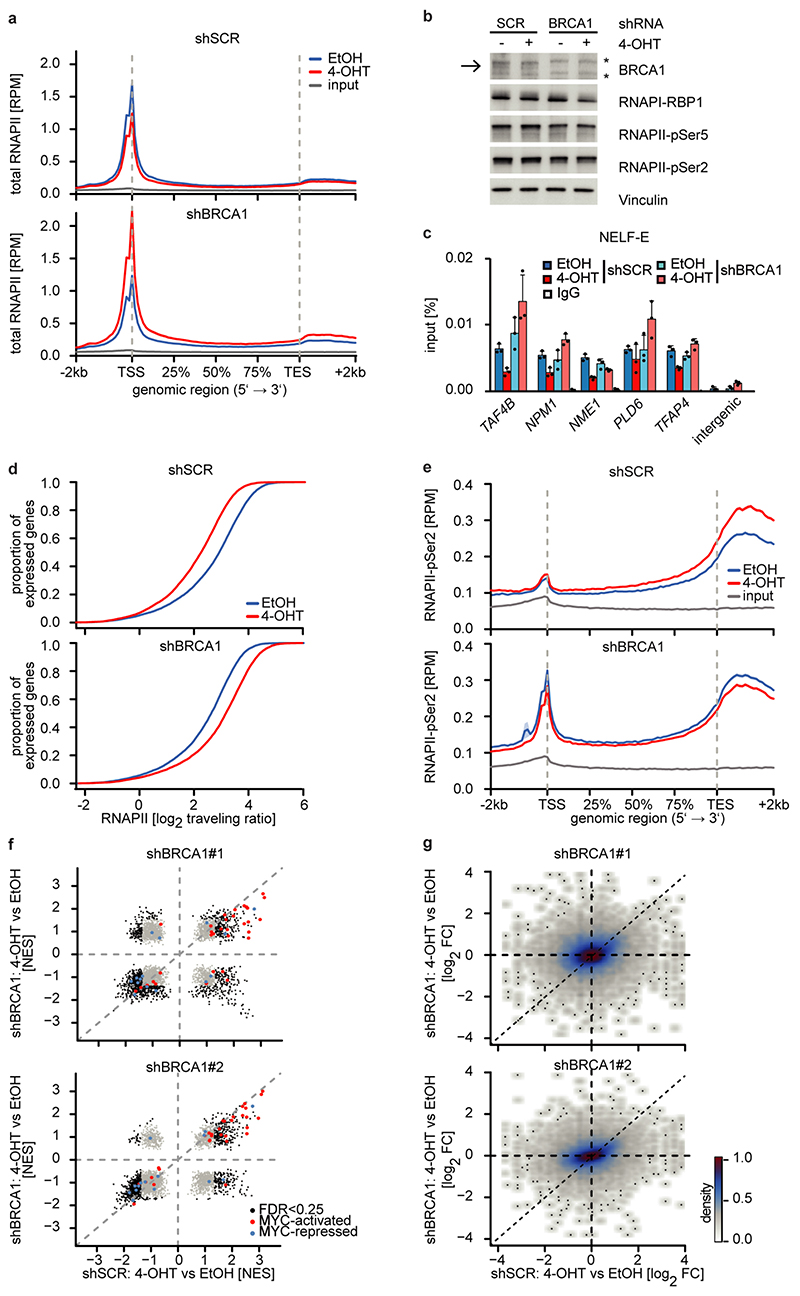
Depletion of BRCA1 altered the response of RNAPII to MYCN activation (Figure 3a and Extended Data Figure 7a). In BRCA1-depleted cells, MYCN activation led to an accumulation of RNAPII at the pause site instead of promoting pause release (Figure 3a and Extended Data Figure 7a). This was not due to BRCA1-dependent changes in phosphorylation of RNAPII (Extended Data Figure 7b). Consistently, activation of MYCN reduced NELF-E promoter occupancy in control cells, but increased it in BRCA1-depleted cells (Extended Data Figure 7c). As consequence, activation of MYCN increased rather than decreased the traveling ratio of RNAPII in BRCA1-depleted cells (Extended Data Figure 7d). A bin plot confirmed that MYCN activation broadly decreased RNAPII association within promoter-proximal regions in control cells but increased the association in BRCA1-depleted cells (Figure 3b). RNAPII-pSer2 showed an increase at the termination site upon stimulation of MYCNER in control cells, but a decrease in BRCA1-depleted cells (Extended Data Figure 7e). Consistent with these observations, depletion of BRCA1 attenuated activation of multiple MYCN target gene sets and overall changes in gene expression in response to activation of MYCN (Extended Data Figure 7f,g).
Figure 3. BRCA1 is required for MYCN-dependent elongation by RNAPII.
a: Metagene plots (mean+SEM as shadow) of total RNAPII after 4-OHT treatment (3 h) in control and BRCA1-depleted cells with shBRCA1#2 for 914 MYCN-activated genes (n=2).
b: Correlation of gene expression (n=3) with RNAPII occupancy at promoters in control and BRCA1-depleted cells with shBRCA1#2. Genes were grouped into 30 bins (300 genes/bin) and the mean for each bin is plotted with 95 % confidence interval.
c: Strand-specific DRIPc-seq data stratified by position of MYCN binding site.
d: DRIP documenting R-loops at the indicated loci upon depletion of BRCA1 and activation of MYCN (4 h). Data are normalized to control (shSCR, EtOH). Shown is the mean of technical triplicates with SD (n=4).
e: Density plot (mean+SEM as shadow) of DCP1A occupancy after 4-OHT treatment (5 h) in control or BRCA1-depleted cells with shBRCA1#2.
f: Genome browser tracks of the TFAP4 locus show chromatin association of DCP1A in cells treated as above.
Since the G/C-skew of promoters correlates closely with their propensity to form R-loops10 and since BRCA1 can suppress R-loop formation at promoter-proximal regions14 and at transcription end sites15, the data suggested that BRCA1 might suppress R-loop formation upon MYCN activation. Available datasets16 showed that 85 % of genes annotated to have promoter-proximal R-loops have joint MYCN/BRCA1 sites in promoter-proximal regions, whereas only 50 % of genes with distal R-loops do (Proximal: 1,328/1,749 promoters; >2kb: 1,987/3,978 genes; p<0,0001). Intriguingly, promoters in which MYCN is localized 5’ of the transcription start site (TSS) often display an R-loop on the antisense strand, whereas this is not observed if the MYCN/BRCA1 site is localized 3’ of the TSS (Figure 3c), suggesting that there is selective pressure for the presence of a MYCN binding site in the immediate vicinity of an R-loop. We chose 22 R-loop containing promoters and validated the presence of an R-loop on 14 of them by DNA-RNA-immunoprecipitation (DRIP) using well-characterized R-loops in the ACTB gene as positive control (Figure 3d and Extended Data Figure 8a,b)15. On 13/14 of these, activation of MYCN suppressed R-loop formation in control cells. In BRCA1-depleted cells, MYCN-dependent R-loop suppression was strongly compromised on all promoters and activation of MYCN enhanced R-loop formation on 8/14 promoters.
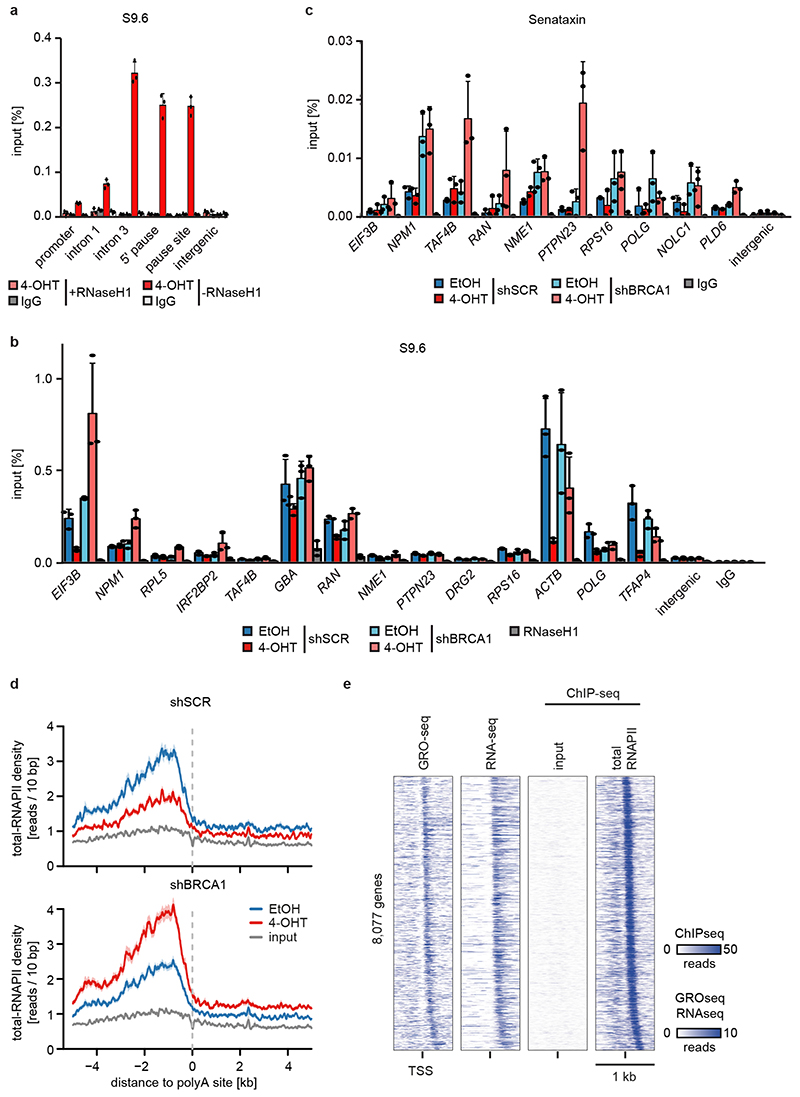
BRCA1 promotes R-loop resolution at transcription end sites by recruiting senataxin, an R-loop specific DNA/RNA helicase15. However, depletion of BRCA1 enhanced senataxin binding to promoter-proximal regions (Extended Data Figure 8c). Two termination pathways can limit promoter-proximal accumulation of RNAPII: mRNA de-capping, which occurs at the pause site17 and promoter-proximal poly-adenylation18. Upon BRCA1 depletion, activation of MYCN promotes RNAPII accumulation at the pause site, upstream of the most 5’-located polyadenylation site (Extended Data Figure 8d). Consistently, GRO-Seq showed a drop in nascent transcription close to the pause site (Extended Data Figure 8e). BRCA1 binds to EDC4, an assembly factor for mRNA de-capping complexes19. ChIP-sequencing of DCP1A, which forms catalytically active de-capping complexes with DCP2 upon EDC4-mediated assembly20, showed that depletion of BRCA1 had no effect on chromatin association of DCP1A in control cells. Activation of MYCN led to a moderate decrease in DCP1A chromatin association in control cells, but to a complete loss of DCP1A from promoter-proximal regions in BRCA1-depleted cells, arguing that recruitment of BRCA1 by MYCN enables mRNA de-capping when RNAPII stalls (Figure 3e,f).
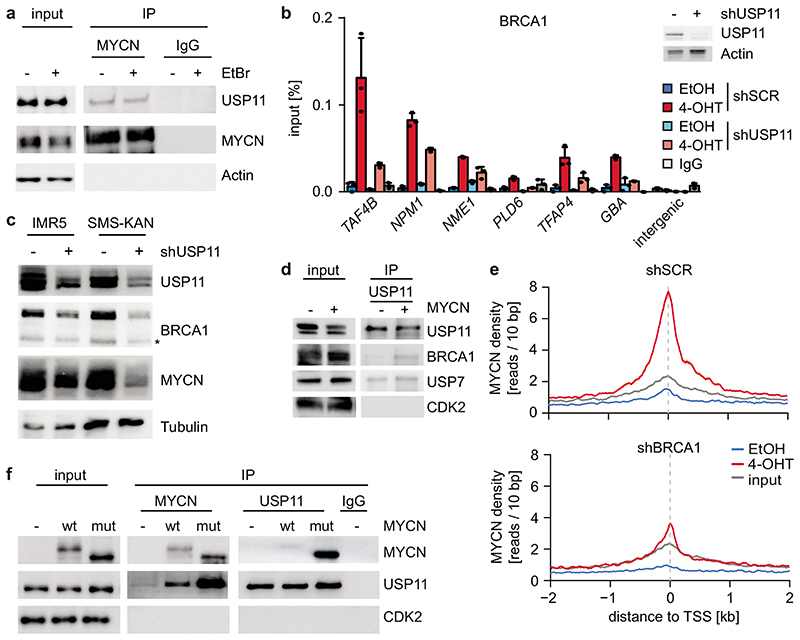
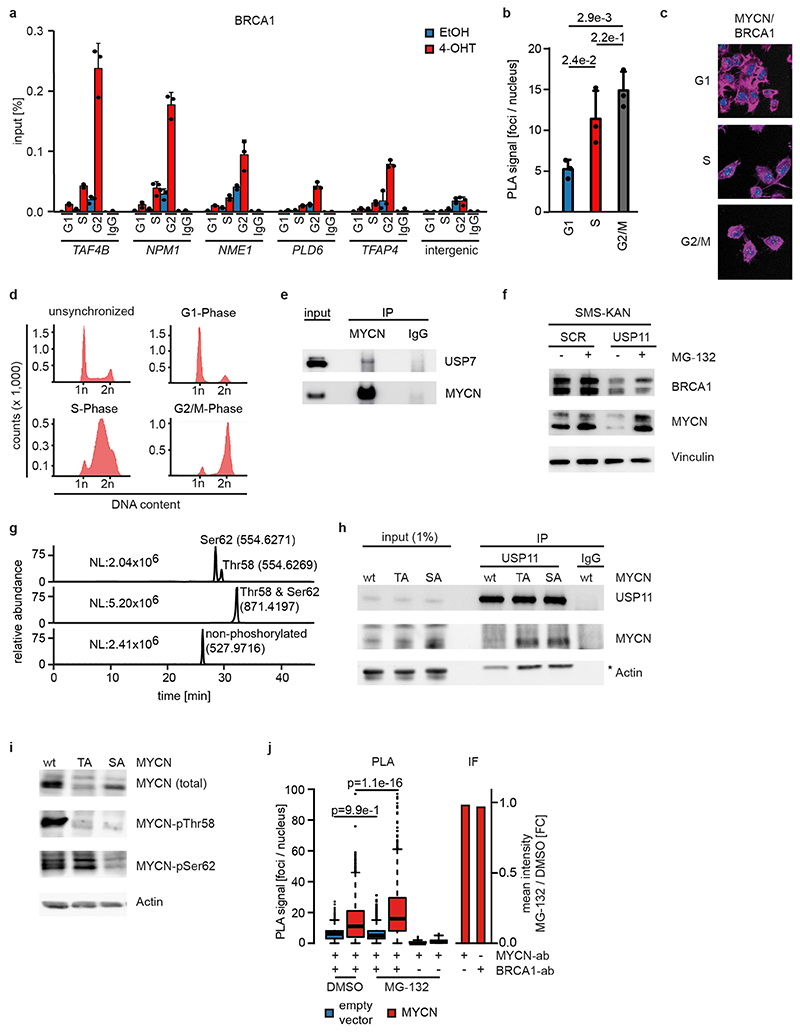
Proteomic analyses did not show an interaction of BRCA1 with MYCN, suggesting that BRCA1 recruitment is indirect21. BRCA1 can be recruited to chromatin by the ubiquitin-specific protease USP11 in a cell cycle-dependent manner22. MYCN recruited BRCA1 to promoter-proximal regions during S- and G2-phase, but not in G1 (Extended Data Figure 9a), and the association of MYCN with BRCA1 followed a similar regulation (Extended Data Figure 9b,c,d). USP11 is present in MYCN complexes (Figure 4a)21. USP11 heterodimerizes with USP723, which also associates with MYCN (Extended Data Figure 9e)24. shRNA-mediated depletion showed that USP11 promotes MYCN-dependent recruitment of BRCA1 (Figure 4b). Indeed, depletion of USP11 strongly reduced expression of both BRCA1 and MYCN (Figure 4c), arguing that USP11 stabilizes MYCN/BRCA1 complexes. Incubation with the proteasome inhibitor, MG-132, reverted the decrease in MYCN levels and partially that in BRCA1 levels in response to USP11 depletion, arguing that the de-ubiquitinating activity of USP11 contributes to stabilization of MYCN and BRCA1 (Extended Data Figure 9f). Conversely, MYCN promoted complex formation of endogenous USP11 with BRCA1 (Figure 4d).
Figure 4. MYCN, USP11 and BRCA1 stabilize each other on chromatin.
a: Immunoblot of α-MYCN immunoprecipitates from MYCN-amplified (IMR32) neuroblastoma cells. Where indicated, EtBr (1 mg/ml) was added to the lysate to disrupt DNA-mediated interactions. The input corresponds to 1 % (n=3).
b: (Left) ChIP of BRCA1 in SH-EP MYCNER cells expressing either shSCR or shUSP11 upon 4-OHT treatment (5 h). Shown is the mean and error bars indicate SD of technical triplicates (n =2). (Right) Immunoblot of cells described above. Actin is loading control (n=2).
c: Immunoblots of indicated proteins after knockdown of USP11 in MYCN-amplified neuroblastoma cells. Asterisk denotes an unspecific band. Tubulin is loading control (n=3).
d: Immunoblots of α-USP11 immunoprecipitates from control cells or cells expressing constitutive MYCN. CDK2 is loading control. The input corresponds to 2 % (n=2).
e: Density plot of MYCN occupancy after 4-OHT treatment (3 h) in control (top) or BRCA1-depleted (bottom) cells with shBRCA1#2 around transcriptional start sites (TSS).
f: Immunoblots of α-USP11 and α-MYCN immunoprecipitates from SH-EP cells stably expressing wildtype (“wt”) MYCN or T58AS62AMYCN (“mut”) as indicated. CDK2 is loading control. The input corresponds to 1 % (n=3).
Consistent with the observation that USP11 stabilizes MYCN, depletion of BRCA1 reduced chromatin association of MYCN (Figure 4e). The data show that USP11, MYCN and BRCA1 form a stable complex in neuroblastoma cells.
Pause-release of RNAPII by MYC requires its proteasomal turnover25, suggesting that turnover of MYCN limits accumulation of the MYCN/BRCA1/USP11 complex. Turnover of MYCN is controlled by phosphorylation of two residues, Ser62 and Thr58, in a highly-conserved domain called MYCBoxI; phosphorylated Thr58 is recognized by the FBXW7 ubiquitin ligase, which targets MYCN for degradation26. Alternatively, Thr58 can be de-phosphorylated by EYA phosphatases, preventing FBXW7-dependent turnover27. Mass spectrometry demonstrated that all four possible phosphorylated forms, including MYCN that is non-phosphorylated or mono-phosphorylated at Ser62, are present in neuroblastoma cells (Extended Data Figure 9g). Binding of USP11 to MYCN was enhanced by a Thr58/Ser62 double alanine substitution (Figure 4f) and by individual substitutions of Ser62 and Thr58 (Extended Data Figure 9h). Since phosphorylation at Ser62 primes phosphorylation at Thr58 by GSK3, the S62A-mutated allele of MYCN shows reduced phosphorylation at Thr58, but not vice versa (Extended Data Figure 9i). The data show that de-phosphorylation of MYCN at Thr58 is critical for binding of USP11; consistently, proteasomal turnover of MYCN limited accumulation of MYCN/BRCA1-complexes (Extended Data Figure 9j).
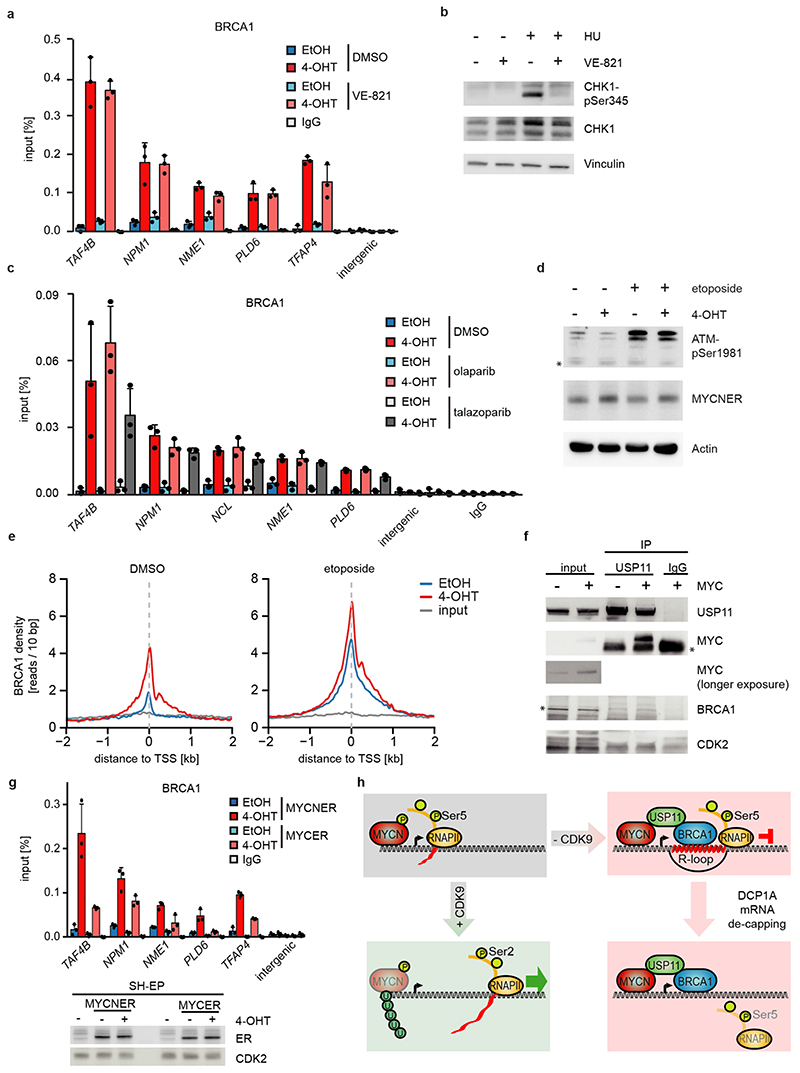
BRCA1 is part of the cellular stress response suggesting that transcription-induced stress contributes to BRCA1 recruitment. Inhibition of ATR using VE-821 had no effect on recruitment of BRCA1, while it suppressed phosphorylation of CHK1 at serine 345 (Extended Data Figure 10a,b). MYCN interacts with poly-ADP-ribose polymerase (PARP1), and PARP1 regulates BRCA1 function in homologous recombination21,28. However, inhibition of PARP1 had no effect on BRCA1 recruitment (Extended Data Figure 10c). Together with the observation that BRCA1 is recruited not only in S-phase, these findings argue that replication/transcription conflicts are not the major cause for BRCA1 recruitment. Transcriptional activation induces torsional stress29. MYCN interacts with TOPO2A and may relieve torsional stress at promoters21. Indeed, inhibition of type II topoisomerases induced BRCA1 accumulation downstream of active promoters and activation of MYCN enhanced the recruitment (Extended Data Figure 10d,e).
MYC was able to bind USP11, but unable to promote association of USP11 with BRCA1 (Extended Data Figure 10f). Consistently, MYCN was more efficient than MYC in recruiting BRCA1 to chromatin (Extended Data Figure 10g). MYC and MYCN differ in their response to transcriptional stress since MYC, unlike MYCN, is able to recruit MIZ1 to buffer excessive transcriptional activation30. We hypothesize that MYC and MYCN engage different mechanisms of coping with deregulated transcription elongation and that MYCN-amplified neuroblastoma tumors are characterized by the ability of MYCN to engage an USP11/BRCA1-dependent pathway that suppresses the accumulation of stalled RNAPII (Extended Data Figure 10h).
Methods
Detailed information about cell lines, antibodies, reagents, commercial kits, primers, siRNAs, shRNA-sequences and used software is reported in Supplementary Table 2.
Cell culture
Neuroblastoma cell lines (IMR-32, IMR-5, SH-EP, SMS-KAN) were verified by STR profiling and grown in RPMI-1640 (Sigma-Aldrich and Thermo Fisher Scientific). HEK293TN, Plat-E, KPC and NIH-3T3 mouse cells were grown in DMEM (Sigma-Aldrich and Thermo Fisher Scientific). Media were supplemented with 10 % fetal calf serum (Biochrom and Sigma-Aldrich) and penicillin/streptomycin (Sigma-Aldrich). All cells were routinely tested for mycoplasma contamination. Where indicated cells were treated with 4-OHT (Sigma-Aldrich), flavopiridol (Sigma-Aldrich), THZ1 (Hycultec) or etoposide (Sigma-Aldrich). For double-thymidine block, cells were treated for 16 h with 2 mM thymidine (Sigma-Aldrich), released for 8 h into normal medium and then blocked again (2 mM, 16 h). For release, cells were washed with PBS before medium was added.
For the clonogenic assay, 1x10^5 SH-EP MYCNER cells previously infected and selected as described below were plated and treated from the following day on with 200 nM 4-OHT and EtOH for six days. Fresh medium with 4-OHT and EtOH was added every second day. Cells were fixed with 3.7 % formaldehyde for 20 min. After aspirating the medium, crystal violet solution (0.1 % crystal violet, 20 % EtOH, ddH2O) was added for overnight staining and cells were washed next day with ddH2O.
Transfection and lentiviral infection
Transfection of siRNA was performed using RNAiMAX reagent according to manufacturer’s protocol. Cells were harvested 72 h after transfection. Transfection of cDNA was performed using PEI (Sigma-Aldrich). Cells were harvested 48 h after transfection. For lentivirus production, HEK293TN cells were transfected using PEI. Lentivirus expressing shRNA targeting BRCA1 was produced by transfection of pGIPZ plasmid together with the packaging plasmid psPAX.2, and the envelope plasmid pMD2.G. Lentivirus expressing shRNA targeting USP11 was produced by transfection of pLKO plasmid. Virus-containing supernatant was harvested 48 h and 72 h after transfection. SH-EP cells were infected with lentiviral supernatants in the presence of 4 μg ml-1 polybrene for 24 h. Cells were selected for two days with puromycin (2 μg ml-1; IMR5 0,5 μg ml-1) and afterwards plated for the experiment.
Immunoblots and immunoprecipitations
Whole-cell extracts were prepared using NP-40 buffer (50 mM Tris (pH 8.0), 150 mM NaCl, 1 % NP-40) with three rounds of freeze/thaw cycles or RIPA buffer (50 mM HEPES, 140 mM NaCl, 1 mM EDTA; 1 % Triton X-100, 0.1 % Sodium Deoxycholate, 0.1 % SDS) containing protease and phosphatase inhibitor cocktails (Sigma-Aldrich). Lysates were cleared by centrifugation, separated on SDS or Bis-Tris gels and transferred to a PVDF membrane (Millipore).
For immunoprecipitation, cells were re-suspended in lysis buffer containing 20 mM HEPES-KOH (pH 7.8), 140 mM KCl, 0.2 mM EDTA, 0.1 % NP-40 supplemented with a cocktail of protease and phosphatase inhibitors. After brief sonication, samples were incubated on ice for 30 min and cleared by centrifugation. Co-immunoprecipitation was carried out in lysis buffer using 2 μg of antibodies and 1-2 mg lysate.
For immunoblots showing multiple proteins with similar molecular weight, one representative loading control is shown. As loading control vinculin, actin, tubulin or CDK2 was used. For gel source data, see Supplementary Figure 1.
Flow cytometry analysis (FACS)
FACS analysis were performed as described previously32. Subconfluent cells were labelled with 20 μM 5-Bromo-2’-deoxyuridine (BrdU, Sigma-Aldrich) for 1 h. Cells were harvested, washed with ice-cold PBS and fixed in 80 % ethanol overnight at -20 °C. Cells were washed with cold PBS and incubated in 2 M HCl/0.5 % Triton X-100 for 30 min at room temperature. Cell pellets were neutralized by incubating with Na2B4O7. The pellet was incubated with Anti-BrdU-FITC antibody (BioLegend) diluted in 100 μl 1 % BSA, 0.5 % Tween-20 in PBS for 30 minutes at room temperature in the dark. After washing with PBS, the cells were re-suspended in PBS with RNase A (24 μg ml-1) and propidium iodide (PI, 54 μM) and incubated for 30 min at 37 °C.
For PI-FACS cells were harvested by trypsinization, washed with cold PBS and fixed in 80 % ethanol overnight at -20 °C. After washing with PBS, the cells were re-suspended in PBS with RNAse A (24 μg ml-1) and PI (54 μM) and incubated for 30 min at 37 °C.
For AnnexinV-PI-FACS, the supernatant of the respective culture was combined with cells harvested by trypsinization and washed with cold PBS. Cell pellet was re-suspended in 100 μl 1x AnnexinV-binding buffer (10 mM HEPES pH 7.4, 140 mM NaCl, 2.5 mM CaCl2) and 2 μl AnnexinV/Pacific Blue dye and incubated for 15 min at room temperature in the dark. Afterwards 400 μl 1x binding buffer and PI (54 μM) was added and the samples were stored cold and dark until analysis.
Subsequent analysis of all FACS experiments was performed on a BD FACSCanto II flow cytometer using BD FACSDIVA™ Software.
DNA-RNA-Immunoprecipitation (DRIP)
DRIP was performed as described in33. Briefly, cells were digested with 0.5 % SDS and proteinase K overnight. DNA was extracted with phenol/chloroform and precipitated with ethanol. DNA was digested using a cocktail of restriction enzymes (Bsrg1, EcoR1, HindIII, SspI, XbaI) overnight at 37 °C. For RNaseH-treated sample DNA was additionally incubated with RNaseH overnight. DNA was purified as described above. S9.6 antibody, which detects RNA/DNA hybrids34, was coupled to A/G-Dynabeads® (Invitrogen). DNA in 1 x binding buffer (10 mM NaPO4 ph7.0, 140 MM NaCl, 0.05 % Triton X-100) was added to the antibody-coupled beads overnight. After extensive washing, DNA was eluted with elution buffer (50 mM Tris-HCl pH 8.0, 10 mM EDTA, 0.5 % SDS) and treated for 2 h at 45 °C with proteinase K. After DNA extraction, locus-specific DRIP signals were assessed by qPCR.
High-throughput sequencing
ChIP and ChIP-sequencing was performed as described previously35. For spike-in experiments (ChIP-Rx) 10 % of fixed NIH-3T3 or KPC mouse cell lines were added before lysis. Cells were treated with 1 % formaldehyde for 10 min at room temperature following 5 min of incubation with glycine. After cell lysis (5 mM PIPES pH 8.8, 5 mM KCl, 0.5 % NP40), nuclei were re-suspended in RIPA buffer (50 mM HEPES pH 7.9, 140 mM NaCl, 1 % Triton-X-100, 0.1 % deoxycholic acid (DOC), 0.1 % SDS, 1 mM EDTA containing protease and phosphatase inhibitor cocktail) and DNA was fragmented to a size <500 bp using a Branson sonifier. Antibodies were bound to Protein A/G-Dynabeads® (Invitrogen) and immunoprecipitated. After extensive washing, chromatin was eluted with 1 % SDS and crosslinking was reverted overnight. Chloroform/phenol extraction was used for DNA purification. After DNA extraction occupancy of different proteins were assessed by qPCR. Shown analysis of qPCR show mean and standard deviation of technical triplicates as well as an overlay of each data point to indicate the distribution of the data.
ChIP-sequencing was performed as described before36. Purified DNA was end-repaired, A-tailed, ligated to Illumina adaptors, size-selected (200 bp) and purified with a gel extraction kit. DNA fragments were amplified by 15-18 cycles of PCR and library size and amount of library was specified with the Biorad Experion™ Automated Electrophoresis system or Fragment Analyzer (Advanced Analytical). The library was subjected to Illumina GAIIx or Illumina NextSeq 500 sequencing according to the manufacturer’s instructions. After base calling with the CASAVA software (GAIIx sequencing) or Illumina’s FASTQ Generation software v1.0.0 (NextSeq 500 sequencing), high quality PF-clusters were selected for further analyses.
RNA-sequencing was performed as described previously25 using an Illumina NextSeq 500. RNA was extracted using RNeasy mini columns (Qiagen) including on-column DNase I digestion. mRNA was isolated using the NEBNext® Poly(A) mRNA Magnetic Isolation Module (NEB) and library preparation was performed with the NEBNext® Ultra™ RNA Library Prep Kit for Illumina following the instruction manual. Libraries were size-selected using Agencourt AMPure XP Beads (Beckman Coulter) followed by amplification with 12 PCR cycles. Library quantification and size determination was performed with the Biorad Experion™ Automated Electrophoresis system or Fragment Analyzer (Advanced Analytical).
For 4sU labelled nascent RNA-sequencing, SH-EP MYCNER cells were cultured at density of 5 million cells per plate 24 h before treatment with 4-OHT. Before harvest of RNA using Qiagen miRNeasy kit, nascent RNA was labelled by adding 200 μM of 4sU (Sigma-Aldrich) in RPMI media to the cells for 15 min under normal culture conditions. After extraction and quantification of total RNA by Nanodrop, equal amount was labelled with biotin (Pierce) in presence of DMF-HPDP buffer. Free biotin removal was carried out by chloroform-isoamyl alcohol extraction after which RNA was re-suspended into nuclease free water. Dynabeads™ MyOne™ Streptavidin T1 beads (Life Technologies) were used for enrichment of biotinylated RNA, which was then eluted by 100 mM DTT and cleaned by RNeasy MinElute cleanup kit. Nascent RNA concentration was then measured using RiboGreen RNA assay kit and equal amount was used for library preparation. Before library preparation, rRNA was depleted using NEB rRNA depletion kit and then all eluted material was used for NEB Ultra Directional kit with 17 PCR cycles. The libraries were then finally sequenced for 75 cycles using Illumina NextSeq 500 system.
Global run-on followed by next-generation sequencing (Gro-Seq) was carried out as previously described with a few modifications37. Briefly, cells were washed two times with cold 1x PBS and harvested in 1x PBS. Cells were re-suspended in 10 ml swelling buffer (10 mM Tris-HCl pH 7.5, 2 mM MgCl2, 3 mM CaCl2) and incubated for 5 min on ice. After centrifugation (400 xg, 10 min) cells were re-suspended in 10 ml swelling buffer containing 10 % glycerol. 10 ml lysis buffer (10 mM Tris-HCl pH 7.5, 2 mM MgCl2, 3 mM CaCl2, 10 % glycerol, 1 % Igepal) was added with gently swirling and incubated for 5 min on ice. The volume of cell suspension was brought to 45 ml with lysis buffer. Resultant nuclei were washed with 10 ml freezing buffer (40 % glycerol, 50 mM Tris-HCl pH 8.0, 5 mM MgCl2, 0.1 mM EDTA). The pellet was resuspended in 100 μl freezing buffer per 1x10⁷ of nuclei.
For run-on reaction, resuspended nuclei were mixed with the same amount of run-on reaction buffer (10 mM Tris-HCl pH 8.0, 5 mM MgCl2, 300 mM KCl, 1 mM DTT, 500 μM ATP, 500 μM GTP, 500 μM Br-UTP, 2 μM CTP, 200 U/ml Superase In, 1 % N-Laurylsarcosine) and incubated 7 min at 30 °C. The reaction was blocked by adding 600 μl Trifast, thoroughly vortexing and incubating for 5 min. RNA was extracted by adding 160 μl chloroform, precipitated with ethanol and resuspended in 20 μl H2O. RNA was next subjected to DNAse treatment (Turbo DNA-free kit, Thermo fisher) for two times according to manufacturer’s protocol. RNA was fragmented using Ambion RNA fragmentation kit and end repaired by T4 PNK (NEB).
Anti-BrdU agarose beads (Santa-Cruz, 50 μl per sample) were twice washed and then blocked for 1 h with blocking buffer (1 x binding buffer, 0.1 % polyvinylpyrrolidone, 0.1 % BSA). Beads were washed twice with binding buffer (0.25 x SSPE, 0.05 % Tween20, 37.5 mM NaCl, 1mM EDTA) and mixed with RNA in 700 μl binding buffer for 1 h on a rotating wheel. After binding, beads were washed twice with binding buffer, twice with low-salt wash buffer (0.2 x SSPE, 0.05 % Tween20, 1 mM EDTA), one time with high-salt wash buffer (0.2 x SSPE, 137.5 mM NaCl, 0.05 % Tween20, 1 mM EDTA) and twice with TE with 0.05 % Tween20. Finally, RNA was eluted four times with 100 μl elution buffer (50 mM Tris pH 7.5, 150 mM NaCl, 0.1 % SDS, 20 mM DTT, 1 mM EDTA) at 37 °C. RNA was purified with Trizol and Chloroform as described above. RNA was decapped using RppH (NEB) with 10 x NEB Thermopol buffer for 1 hour at 37 °C. Reaction was stopped by adding EDTA and incubation at 65 °C for 5 min. Afterwards RNA was extracted as described above. Library preparation was done according to manufacturer’s instructions using NEBNext Multiplex Small RNA Library Prep Kit for Illumina.
shRNA screening
A total of 18,290 shRNAs of the Open-Biosystems (Dharmacon; GE Lifesciences) pGIPZ shRNA library (releases 6.1-6.12) were screened in two pools (consisting of 9,589 and 8,701 individual shRNAs) and each pool in two independent biological replicates. Upon re-annotation using the human transcriptome hg19 (Homo_sapiens.GRCh37.74.cDNA.all.fa), 12,931 shRNAs were found to target 9,601 genes. Of these, 1, 8, 10, 96, 429, 2,098 and 6,959 were targeted with 7, 6, 5, 4, 3, 2 or one individual shRNAs, respectively. Following lentiviral packaging of the plasmids, SH-EP MYCNER cells were transduced with the viral library at a multiplicity of infection of 0.1. Infected cells were selected with puromycin for three days and the screen was started immediately after selection was completed. Cells were harvested prior to the treatment with EtOH or 4-OHT (condition “start”) and after two weeks of treatment with either EtOH (control) or 4-OHT (activation of MYCN). Cell number were counted regularly over the entire course of the screening experiment to verify an equal number of population doublings in both conditions. Every two to three days the cells of both conditions were split and supplied with fresh 4-OHT or EtOH. The number of cells was always kept at a minimum of 1.0x10⁷ cells to guarantee a sufficient minimum representation of all shRNAs. Genomic DNA was isolated using DNAzol (Invitrogen) followed by an ethanol precipitation. shRNA hairpin sequences were recovered from the genomic host cell DNA in an amplification reaction using custom PCR-primers that specifically bind to pGIPZ vector sequences flanking the shRNA sequences. For each condition, 70 identical PCRs of 24 cycles and with 1 μg of genomic DNA each were carried out and corresponding products were pooled and gel-purified. The quantity and size of the purified PCR products was determined using the Experion Automated Electrophoresis System (Bio-Rad). Sample-specific DNA-libraries were subjected to Illumina GAIIx single-read sequencing according to manufacturers instructions. Mapping of the sample-specific reads and initial bioinformatics analyses were done as described below (Bioinformatical analysis and statistics). Using Z-score statistics for the effect strengths, we identified 104 shRNAs targeting 99 genes that were strongly depleted upon growth of SH-EP MYCNER cells in the presence of 4-OHT, but much less depleted in the absence of 4-OHT.
In Situ Proximity Ligation Assay
Proximity Ligation Assay (PLA) was performed using the Duolink® In Situ Kit (Sigma-Aldrich) according to manufacturer’s protocol. For counterstaining Hoechst 33342 (Sigma-Aldrich) and Alexa Fluor®568 Phalloidin (Thermo Fisher Scientific) were used. Pictures were taken with a confocal microscope (Nikon Ti-Eclipse) in a 60x magnification and on Operetta® High-Content Imaging System in a 40x magnification. For quantification, not less than 300 cells were analyzed using ImageJ (Wayne Rasband, NIH). Images from Operetta® were analyzed using Harmony® High Content Imaging and Analysis Software. P-values were calculated using a two-tailed Wilcoxon rank-sum test.
DNA fiber assay
DNA fiber assays to analyze replication fork progression and origin firing were essentially carried out as described previously38. Cells were first incubated with 4-OHT for 6 h and afterwards with 5-chloro-2-deoxyuridine (CldU, 25 μM) for 20 min, followed by 5-iodo-2-deoxyuridine (IdU, 25 μM; both from Sigma-Aldrich) for 1 h. DNA fibers were spread on glass slides. After acid treatment, CldU- and IdU-labeled tracts were detected by 1 h incubation at 20 °C with rat anti-BrdU antibody (dilution 1:400 detects BrdU and CldU; AbD Serotec) and mouse anti-BrdU antibody (1:150, detects BrdU and IdU; Becton Dickinson). Slides were fixed in 4 % paraformaldehyde/PBS and incubated for 2 h at 20 °C with Alexa Fluor 555-conjugated goat anti-rat antibody (dilution 1:150) or Alexa Fluor 488-conjugated goat anti-mouse antibody (dilution 1:150; both from Molecular Probes/Thermofisher). Fiber images were acquired by fluorescence microscopy using the Axio Scope A1 running with the microscope software ZEN (both from Zeiss) for image acquisition and processing. For analysis of fiber images, the imaging software ImageJ was used. Statistical analysis of replication fork progression was performed using the two-tailed, unpaired t-test with additional Welch’s correction in Prism5.0 due to unequal variances between samples.
Immunofluorescence staining
Cells were infected and selected by puromycin treatment as described previously. After selection, cells were plated in a 96-well plate and incubated with EtOH or 4-OHT from the following day on for 24 h (200 nM). The last two hours, etoposide was added as positive control (25 μM). Cells were fixed with 3.7 % paraformaldehyde/PBS. After removing PFA and washing, cells were permeabilized with 0.2 % Triton-X-100/PBS and blocked with 3 % BSA/PBS. Samples were stained with primary antibodies for γH2A.X (1:400) and 53BP1 (1:500) in 3 % BSA/PBS overnight at 4°C and after washing incubated with secondary antibody (1:400) for 1 h at room temperature. Pictures were taken with an Operetta® High-Content Imaging System in a 20x magnification. Images were analysed using Harmony® High Content Imaging and Analysis Software.
Bioinformatical analysis and statistics
Base calling was performed using Illumina’s FASTQ Generation software v1.0.0 and sequencing quality was tested using the FastQC script.
For ChIP-sequencing, reads were mapped to hg19 using Bowtie139 with default parameters and samples were normalized to the number of mapped reads in the smallest sample. Peak calling for BRCA1, MYCN and total RNAPII with MACS1440 was performed with the corresponding input sample as control and with variable settings for duplicates (“--keep-dup”; (“antibody”/”biological condition”/”value”): BRCA1 +/-4-OHT 5; BRCA1 +/-4-OHT,+/-flavopiridol,+/-etoposide 3; MYCN +/-4-OHT 5; DCP1A +/-4-OHT,+/-shBRCA1 1; MYCN pRRL-MYCN: 1; BRCA1 pWZL-MYCN/pWZL-empty 5; total RNAPII EtOH 5) and p-value (“--pvalue”; (“antibody”/”biological condition”/”value”): BRCA1 +/-4-OHT 1e-6; BRCA1 +/-4-OHT,+/-flavopiridol,+/-etoposide 1e-7; MYCN +/-4-OHT 1e-11; DCP1A +/-4-OHT,+/-shBRCA1 1e-6; MYCN pRRL-MYCN 1e-9; BRCA1 pWZL-MYCN/pWZL-empty 1e-9; total-RNAPII EtOH 1e-14). Bedgraph files were generated using the genomecov function from BEDtools41 and the Integrated Genome Browser42 was used to visualize these density files. Annotation of peaks to the next RefSeq gene was done with BEDtools closestBed and a promoter was defined as a region +/- 1 kb relative to the transcriptional start site (TSS). Read density graphs were obtained using the computeMatrix function from DeepTools43 at a resolution of 10 bp. For de novo motif analysis the DREME algorithm implemented in the MEME Suite44 was used with default settings and similarity of identified motifs to known motifs was examined with TOMTOM and three databases (“JASPAR Core vertebrates 2014”, “Jolma 2013”, “Uniprobe mouse”). Relative motif frequencies of E-boxes were counted with an in-house script and curves were smoothed with a moving window of 50 bp. Traveling ratios for RNAPII ChIP-seq were calculated by counting reads with BEDtools “coverage” function (parameter: -F 0.51) around TSS (-30 to +300 bp), within gene bodies (+300 bp to TES) and at transcriptional end sites (“TES”; TES to +1 kb) of Ensembl genes. A pseudocount/kb was added, gene body counts were normalized to the length of the gene and finally, TSS counts were divided by gene body counts. Metagene window plots were generated with NGStools45 of the indicated gene group. MYCN-activated and repressed genes are defined by positive and negative log2 FC respectively of genes with Benjamini-Höchberg q-value (+/-4-OHT) less than 0.05 with an expression filter rejecting genes with less than 2 counts per million.
Classification of genes with strong, weak or no G/C skew was done with skewR33 using the human hg19 genome, all expressed genes and the parameters: -z 60 -s hg19.fa -m model/GC_SKEW_1mil.hmm -g UCSC_Main_on_Human_refGene_hg19_TSS_toTES.bed -b UCSC_hg19_CpGislands.bed. Gene expression changes of SH-EP MYCNER cells after activation of MYCN of the respective class of genes was plotted as kernel density with a bandwidth of 0.05. p-values were calculated with a two-tailed Wilcoxon one-sample signed-rank test with μ=0.
To correlate BRCA1 occupancy in promoter-proximal regions before and after activation of MYCNER with gene expression, 7,812 expressed genes (log2 CPM>1.28, CPM: counts per million) with a BRCA1 peak in the promoter (+/- 1 kb relative to the TSS) were grouped into 15 equally sized bins and the mean of BRCA1 occupancy in a region of +/- 100 bp around the peak summit was plotted including +/- 95 % confidence interval.
For ChIP-Rx-sequencing, reads were mapped independently to the human hg19 and murine mm10 (spike-in) genome and a spike-in normalization factor was calculated by dividing the number of mapped reads of the spike-in of the smallest sample by the number of mapped reads of the spike-in for each sample. For each sample, this factor was multiplied by the number of reads that map to the human genome and all bam files for subsequent analysis were adjusted to this read count. Peak calling of the MYCN-ChIP-Rx sample “+4-OHT/-shBRCA1” was done with MACS14 (keep-dup: 1, p-value: 1e-10) with a separate peak calling for the corresponding input sample using same parameters as the “treat” sample. Overlapping peaks in the input were then subtracted from the MYCN-ChIP-Rx sample resulting in 692 peaks in promoters of RefSeq genes (+/-1 kb relative to TSS). Read density plots around these TSS were then drawn with a resolution of 10 bp using the “computeMatrix” and “plotProfile” function from DeepTools.
For GRO-seq, reads of all biological conditions (+/-4-OHT, +/-shBRCA1) were pooled and the 3’ adapter was trimmed using Cutadapt46 keeping at least 30 bp. Untrimmed and trimmed reads passing the filter were then mapped to hg19 using Tophat247 and Bowtie248 including spliced reads. TSS with a called RNAPII-peak (“EtOH” condition) maximal 250 bp downstream were used as view point for a heat map drawn with “computeMatrix” and “plotHeatmap” from DeepTools at a resolution of 1 bp. The resulting heat map is sorted based on the distance of the TSS to the RNAPII-peak and additionally contains read coverage from mRNA- (sample: “EtOH”) and ChIP-seq (samples: “total RNAPII (N20) EtOH” and corresponding input).
Raw data from DRIPc-sequencing31 were downloaded from GEO (GSE70189, sample GSM1720613), strand-specific mapped to hg19 with Bowtie1 and read density around transcriptional start sites of genes with either up- or downstream MYCN peaks was calculated with DeepTools. Bidirectional genes and genes with multiple annotated TSS were removed before the density matrix was calculated and the mean profile was drawn. To identify the number of BRCA1/MYCN-bound genes with R-loops, coordinates of R-loops from DRIP-seq experiments from NT2 (two replicates), K562, E14 and 3T3 cells were obtained from GEO (GSE70189) and converted to hg19 if necessary. A consensus R-loops data set was generated as defined by (1) overlap by at least 1 bp in all samples, (2) overlap by at least 1 bp in an RNaseA-treated sample and (3) not overlapping with an RNaseH-treated sample. The resulting R-loops were then annotated to the next transcriptional start site, MYCN- and BRCA1-peak and filtered as indicated. p-values were calculated with a permutation test (n=10,000).
Coordinates of polyA-sites were downloaded from UCSC (“UHR”, two replicates)49, extended in both directions by 15 bp and overlapping polyA-sites from both replicates were extracted. For each annotated RefSeq TSS, the first downstream intronic polyA-site in a region of TSS to +5 kb that is not in a window of +/-1 kb around a transcriptional end site was used to analyze RNAPII density.
For mRNA-sequencing, reads were mapped to hg19 using Tophat247 and Bowtie248 and samples were normalized to the number of mapped reads in the smallest sample. Reads per gene were counted using the “summarizeOverlaps” function from the R package “GenomicAlignments” using the “union”-mode and Ensembl genes. Non- and weakly expressed genes were removed (mean count over all samples <1 (shBRCA1 experiment) or <1.28 (MYCNER +/-4-OHT; GSE78957)). Differentially expressed genes were called with edgeR and p-values were adjusted for multiple-testing using the Benjamini-Höchberg procedure. Gene set enrichment analysis (GSEA)50 were done with the “Hallmark”, “C2” and “C7” databases from MSigDB51, 1,000 permutations and default settings. For bin plots, genes were sorted based on the indicated criterion, grouped into equally-sized bins and the mean or median was calculated. p-values for the difference in slopes were calculated using a linear model and ANOVA (analysis of variance). To calculate p-values comparing the median of different groups in box plots a two-tailed Wilcoxon signed-rank test (for paired data) or a two-tailed Wilcoxon rank-sum test (unpaired data) was used.
To correlate MYCN-dependent gene expression changes with gene expression in neuroblastoma tumor samples, normalized expression values from GSE6256452 were downloaded from GEO, row-wise median-centered and the top 400 differentially expressed genes between stage 4 and stage 1/2/3/4s were defined with: (mean[stage4]-mean[stage1,2,3,4s])/(sd[stage4]+sd[stage1,2,3,4s]). For each tumor sample the Pearson’s correlation coefficient between the median-centered expression and the gene expression changes between shSCR 4-OHT vs shSCR EtOH was calculated. Kaplan-Meier survival curves stratified by BRCA1 expression from the same dataset were calculated using the R2: Genomics Analysis and Visualization Platform (http://r2.amc.nl) in “scanning” mode.
Methylation data from human neuroblastoma tumor samples and corresponding meta information were taken from GSE76269 and the R2 platform was used for visualization of the methylation status of probes within the BRCA1 genomic locus. The ratio of methylation is defined as signal (methylated) / signal (methylated+unmethylated).
For 4sU-seq, fastq generation, quality check, read mapping, normalization of mapped reads and differential analysis expression analysis was carried out the same way as mRNA-sequencing, with the difference being that the reads falling in exons were not considered. 18,213 genes were grouped into 39 equally sized bins.
For analyzing the shRNA screen, fastq files were mapped to a custom reference database containing the guide-stem sequences of all screened shRNAs. Mapping was done using Bowtie v0.12.8 not allowing any mismatches. Mapped reads per sample were counted and combined in one count matrix. Average values of size-normalized counts for corresponding conditions from replicate experiments were used to calculate relevant fold changes (FC) to determine enrichment or depletion of individual shRNAs between conditions. A Z-score statistic was applied to all calculated log2FC (indicating the number of standard deviations an effect is above or below the mean of the overall population of shRNAs), in order to compare the results from the two separately screened shRNA pools and to determine cut-off values for a combined hit selection. ShRNAs with Z-scores <(-3) for the change in abundance between the EtOH treated and the 4-OHT treated condition were defined as “synthetic lethal hits” as long as the Z-score for the change in abundance between the starting condition and the EtOH treated control condition was >(-3).
In box plots, the central line reflects the median and the borders of the boxes show the interquartile range of the plotted data. The whiskers extend to 1.5x of the interquartile range and outliers are shown as dots.
Extended Data
Extended Data Figure 1.
a: (Top) Heat map showing 400 most differentially expressed genes between 498 low- and high-grade neuroblastomas (GSE62564). MYCN-amplification status of the tumors and survival of the patients is indicated by the horizontal bars on top and the right panel illustrates gene expression changes after MYCNER-activation (3 h 4-OHT) in SH-EP cells of the same genes. (Bottom) Correlation between relative gene expression in tumors and changes in response to MYCNER-activation.
b: Box plots showing expression of 294 MYCNER-activated genes (SH-EP MYCNER, FDR<0.01 and log2 FC (4-OHT vs EtOH)>0 in 3 biological replicates) in neuroblastomas of the indicated tumor stage with or without MYCN amplification (GSE62564). Number of tumor samples is indicated at the bottom and p-values were calculated using a two-tailed Wilcoxon rank-sum test. In the box plot, the central line reflects the median and the borders of the boxes show the interquartile range of the plotted data. The whiskers extend to 1.5x of the interquartile range and outliers are shown as dots.
c: Expression of selected gene sets from GSE analysis in SH-EP cells after MYCNER-activation (3 h 4-OHT, n=3) and in 65 MYCN-amplified versus 116 non-amplified stage 4 neuroblastomas (GSE62564). p-values were calculated using a Kolmogorov-Smirnov test with 1,000 permutations and corrected for multiple testing using Benjamin-Höchberg procedure (FDR)50.
d: Box plot illustrating MYCN-binding in promoters (-30 to +300 bp relative to TSS) of 914 MYCN-activated and 615 repressed genes (n=3). As control, a randomly selected group of 1,000 non-regulated expressed genes was chosen. p-values were calculated with a two-tailed Wilcoxon test. For description of the box plot, see legend to Extended Data Figure 1b.
e: Box plot illustrating mRNA levels in gene groups described above (activated, repressed and non-regulated; n=3). For description of the box plot, see legend to Extended Data Figure 1b.
f: Box plot showing the exon/intron ratio for 27,369 genes in 4sU-seq (n=6) compared to RNA-seq data (n=6). For description of the box plot, see legend to Extended Data Figure 1b.
Extended Data Figure 2.
a: Metagene plots (mean+SEM as shadow) of total RNAPII (top) and RNAPII-pSer2 (bottom) in SH-EP MYCNER cells after 4-OHT treatment (3 h) for 14,488 expressed genes (n=4).
b: Empirical cumulative distribution function of RNAPII traveling ratio after MYCNER-activation (4-OHT) of 14,488 expressed genes (n=4).
c: 2D kernel density plot of total RNAPII occupancy at the TSS of 14,945 expressed genes in SH-EP MYCNER cells treated with EtOH (top) or after activation of MYCN (bottom). Samples are normalized either to sequencing depth or using a murine spike-in (n=1). r: Pearson’s correlation coefficient.
d: Metagene plots (mean+SEM as shadow) of total RNAPII (top) and RNAPII-pSer2 (bottom) in SH-EP MYCNER cells after 4-OHT treatment (3 h; n=4) of 1,000 non-regulated genes.
Extended Data Figure 3.
a: Schematic overview of the shRNA screen in SH-EP MYCNER cells. Samples were analyzed in duplicates after 14 days of cell culture.
b: Waterfall plot (left) visualizing the depletion of the six screened shRNAs targeting BRCA1 in SH-EP MYCNER cells with activated MYCN (Z-score for the log2 fold-change (4-OHT vs start)). From all 12,931 individual shRNA, only the 1,000 shRNAs are shown that were most strongly depleted in the screen following OHT treatment. Z-scores for the depletion of all individual shRNAs were calculated based on the population mean and SD of the log2 FC of all screened shRNAs (n=2). Box plot (right) comparing depletion of all shRNAs targeting BRCA1 in SH-EP MYCNER cells upon activation of MYCN. Shown are the median and the lower and upper quartiles of the log2 FC (4-OHT vs start and EtOH vs start) for n=6 independent shRNAs targeting BRCA1 mRNA. Whiskers extend to 1.5x interquartile range (IQR) above and below the upper and lower quartiles, respectively.
c: Immunoblot (left) of BRCA1 in SH-EP MYCNER and in MYCN-amplified IMR5 and SMS-KAN cells showing the knockdown of BRCA1 by two shRNAs. Note the high BRCA1 levels in MYCN-amplified neuroblastoma cell lines (IMR5 and SMS-KAN) relative to the non-MYCN amplified cell line (SH-EP). The arrow points to the BRCA1 band, asterisks denote unspecific bands. Vinculin was used as loading control. For all gel source data, see Supplementary Figure 1. qPCR (right) of BRCA1 mRNA levels in BRCA1-depleted SH-EP MYCNER cells. Shown is mean of technical triplicates (n=3).
d: Clonogenic assay in SH-EP MYCNER cells after shRNA-mediated knockdown of BRCA1 and induction of MYCN for six days. Colonies were stained with crystal violet (n=3).
e: Expression of a gene set of the 99 genes, identified in the shRNA screen, in primary neuroblastoma patients. Each patient is ranked using a defined gene set of MYCN-amplified tumors53. MYCN-amplification status of all 498 patients is indicated on the right.
f: BRCA1 gene expression in 498 neuroblastoma samples (GSE62564). Tumors are sorted based on BRCA1 expression.
g: Survival of 498 human neuroblastoma patients (GSE62564) stratified by BRCA1 expression. Data were obtained from GEO and the R2 platform was used for grouping tumor samples by ,,scanning” mode based on BRCA1 expression. The q-value reflects a Bonferroni-corrected p-value (log-rank test).
h: BRCA1 genomic region around the transcription start with average methylation status in high versus low risk neuroblastoma.
Extended Data Figure 4.
a: Quantification (top) and representative FACS profiles (bottom) documenting cell cycle distribution of bromodeoxyuridine (BrdU) / propidium iodide (PI)-stained control and BRCA1-deficient cells with shBRCA1#2 after 6 h of 4-OHT treatment. PI-staining was used for quantification. Shown is the mean and error bars indicate SD of biological triplicates.
b: Same experimental setup as panel a after 48 h 4-OHT treatment.
c: Percentage of apoptotic cells in control and BRCA1-deficient cells with shBRCA1#2 measured in a PI/AnnexinV FACS after treatment with 4-OHT for 48 h. Shown is the mean and error bars indicate SD of biological triplicates. p-values were calculated using an unpaired, two-tailed t-test.
d: (Top) Fork progression rates during both labels based on the track length under the indicated conditions in control and BRCA1-deficient cells for shBRCA1#1. The number of analyzed DNA fibers are shSCR: EtOH 130, 4-OHT 131; shBRCA1#1: EtOH 161, 4-OHT 139. Fork progressions are
displayed as boxplots with the central line reflecting the median and the borders of the boxes show the lower and upper quartile of the plotted data with 10 to 90 percentile whiskers. Outliers are shown as dots. P-values were calculated using a two-tailed, unpaired t-test with additional Welch’s correction. Shown is one representative experiment (n=3). (Bottom) Scheme of DNA fiber experiment labeled with CldU (red) and IdU (blue).
e: Same experimental setup as above with shBRCA1#2. The number of DNA fibers are shSCR: EtOH 95, 4-OHT 69; shBRCA1#2: EtOH 109, 4-OHT 90. For description of the box plot, see legend to Extended Data Figure 4d. P-values were calculated using a two-tailed, unpaired t-test with additional Welch’s correction. Shown is one representative experiment (n=3).
f: Number of γH2A.X (left) and 53BP1 (right) foci per cell/cell per well indicating DNA damage in control and BRCA1-deficient cells with shBRCA1#2 after 24 h of 4-OHT treatment. Etoposide (25μM) was used as positive control and added for the last 2 h. Shown is the mean and error bars indicate SD of biological triplicates. p-values were calculated using an unpaired, two-tailed t-test. Shown is one representative experiment (n=3).
Extended Data Figure 5.
a: Venn diagram documenting genome-wide overlap of BRCA1 and MYCN peaks.
b: Relative E-box (CACGTG) frequency around BRCA1 peaks in promoter regions (+/- 1 kb relative to the TSS). The curve is smoothed using a sliding window of 50 bp.
c: Enriched DNA motifs in 12,161 BRCA1 peaks located in promoter (+/- 1kb relative to the TSS) identified by de novo motif search. A region of +/- 50 bp around the BRCA1 peak summit was analyzed and similarity to known motifs was assigned with TOMTOM and the JASPAR vertebrate motif database. E-values are calculated with Fisher’s Exact test corrected for the number of input sequences and q-values for the comparison to known motifs are FDR-corrected p-values calculated with a null model based on sampling motif columns from all the columns in the set of target motifs44. Shown are the top 3 motifs from DREME analysis (n=3).
d: ChIP of BRCA1 from SH-EP MYCNER cells transfected either with a control siRNA or siRNA targeting BRCA1. Selected promoters have both a robust MYCN and an overlapping BRCA1 peak. IgG was used as control. Where indicated, 4-OHT or EtOH was added for 5 h. Shown is the mean and error bars indicate SD of technical triplicates (n=1).
e: ChIP of BRCA1 from SH-EP MYCNER cells stably expressing either a control shRNA or shRNA targeting BRCA1. IgG was used as control. The experiment was carried out as above. Shown is the mean and error bars indicate SD of technical triplicates (n=1).
f: ChIP of BRCA1 from SH-EP MYCNER cells using two different BRCA1 antibodies. 4-OHT was added for 5 h. Shown is the mean of the enrichment over IgG (+SD of technical triplicates) (n=1).
g: Browser track of the LDHA locus of a BRCA1 and MYCN ChIP-sequencing experiment documenting BRCA1 binding to the LDHA promoter in SH-EP MYCNER cell after MYCN-activation (5 h), and in SH-EP cells expressing ectopic MYCN or empty vector as control. For ectopically expressing cells the MYCN browser track is shown.
h: Heat map showing occupancy of BRCA1 and MYCN in SH-EP MYCNER cells and SH-EP cells expressing ectopic MYCN or empty vector as a control. Plot is centered to TSS.
i: ChIP of BRCA1 from control SH-EP and from SH-EP MYCNER cells treated either with 4-OHT or EtOH (5 h). Shown is the mean and error bars indicate SD of technical triplicates of one representative experiment (n=2).
Extended Data Figure 6.
a: (Left) ChIP of BRCA1 at the indicated loci upon treatment of SH-EP MYCNER cells with 4-OHT (5 h) and flavopiridol (100 nM, 3 h) where indicated. Shown is the mean and error bars indicate SD of technical triplicates of one representative experiment (n=2). (Right) Immunoblot of cells treated as described. Asterisk denotes an unspecific band. Vinculin was used as loading control (n=1).
b: Density plots (mean+SEM as shadow) of BRCA1 occupancy in 6887 intergenic regions after treatment with either 4-OHT or EtOH (5 h) in (left) DMSO and (right) flavopiridol (100 nM, 3 h) treated cells (n=1).
c: (Left) ChIP of BRCA1 in SH-EP MYCNER cells treated with CDK7 inhibitor THZ1 (200 nM, 4 h) or DMSO as control together with 4-OHT or EtOH. Shown is the mean and error bars indicate SD of technical triplicates. (Right) Immunoblots for pSer5, pSer2 and total RNAPII after treatment as described above. Actin was used as loading control (n=1).
d: (Left) ChIP of BRCA1 at the indicated loci in MYCN-amplified IMR-5 neuroblastoma cells expressing a doxycycline-inducible shRNA targeting MYCN. Where indicated, cells were treated with flavopiridol (200 nM, 4 h) or doxycycline (1 μg/ml, 48 h). Shown is the mean and error bars indicate SD of technical triplicates of one representative experiment (n=2). (Right) Immunoblot of cells treated as described above. Asterisks denote unspecific bands. CDK2 was used as loading control (n=2).
Extended Data Figure 7.
a: Metagene plots (mean+SEM as shadow) of total RNAPII after 4-OHT treatment (3 h) in control (top) and BRCA1-depleted cells with shBRCA1#1 (bottom) on 14,488 expressed genes.
b: Immunoblot of total RNAPII (RBP1) and phosphorylated forms after knockdown of BRCA1 and activation of MYCN. Shown is one representative experiment (n=2). The arrow points to the BRCA1 band, asterisks denote unspecific bands.
c: ChIP of NELF-E in control and BRCA1-depleted SH-EP MYCNER cells after 4-OHT treatment (4 h). Shown is the mean and error bars indicate SD of technical triplicates of one representative experiment (n=3 using two different shRNAs).
d: Empirical cumulative distribution function of RNAPII traveling ratio after MYCNER-activation (3 h) in control (top) and BRCA1-depleted (bottom) cells with shBRCA1#2 of 14,488 expressed genes.
e: Metagene plots (mean+SEM as shadow) of RNAPII-pSer2 in control (top) and BRCA1-depleted (bottom) cells with shBRCA1#2 upon treatment as described above on 14,488 expressed genes.
f: Gene-set enrichment analysis upon activation of MYCN (5 h) in BRCA1-depleted and control conditions (n=3). Significantly enriched gene sets are highlighted in black (FDR q-value <0.25), MYC-activated gene sets are marked in red and MYC-repressed in blue. FDR was calculated using a Kolmogorov-Smirnov test) with 1,000 permutations using a Benjamini-Höchberg correction for multiple testing.
g: 2D kernel density plot correlating gene expression changes after MYCNER-activation (5 h) in BRCA1-depleted and control cells. Results are shown for two shRNAs of 19,429 expressed genes. r: Pearson’s correlation coefficient.
Extended Data Figure 8.
a: DNA-RNA-Immunoprecipitation (DRIP) using the S9.6 antibody, indicating R-loops at known loci within the ACTB gene. Digestion with RNaseH1 was used as control for specificity of the antibody and IgG as control for unspecific chromatin binding. Shown is the mean and error bars indicate SD of technical triplicates of one representative experiment (n=2).
b: DRIP documenting binding of the S9.6 R-loop antibody to the indicated loci upon depletion of BRCA1 and activation of MYCN for 4 h. Shown is the mean and error bars indicate SD of technical triplicates of one representative experiment (n=4). The panel shows the non-normalized data of Figure 3d.
c: ChIP of Senataxin at the indicated loci in SH-EP MYCNER cells after 4-OHT treatment (3 h) in control or BRCA1-depleted cells. Shown is the mean and error bars indicate SD of technical triplicates of one representative experiment (n=2 with two different antibodies).
d: RNAPII density (mean+SEM as shadow) around the first downstream polyA site in SH-EP MYCNER cells after BRCA1-depletion with shBRCA1#2 and MYCN-activation for 3h: 1,713 genes are shown. One representative experiment is shown (n=3).
e: Heat map of 8,077 TSSs of genes with an RNAPII-peak downstream of the start site. Reads originate from GRO-seq, mRNA-seq and total RNAPII-ChIP-seq samples and genes are sorted based on the distance from the TSS to the RNAPII-peak.
Extended Data Figure 9.
a: ChIP of BRCA1 in SH-EP MYCNER cells synchronized by a double thymidine block. Cells were released and harvested in the indicated cell cycle phase after 4 h of 4-OHT treatment. IgG was used as control. Shown is the mean and error bars indicate SD of technical triplicates (n=1).
b: Bar plot summarizing the proximity ligation assays of MYCN and BRCA1 in G1-, S- and G2-phase in SH-EP MYCNER cells synchronized as described above and upon 3 h 4-OHT treatment. The plot shows mean and error bars indicate SD of biological triplicates. For each cell cycle phase, between 74 and 276 cells were counted. P-values were calculated using an unpaired, two-tailed t-test (n=1).
c: Representative pictures of proximity ligation assay from panel b showing proximity of MYCN and BRCA1 in G1-, S- and G2-phase (green dots). Nuclei were stained with Hoechst, cytoskeleton was stained using phalloidin indicated in violet (n=1).
d: Representative FACS profiles of propidium-iodide stained SH-EP MYCNER cells used for the experiments above (n=1).
e: Immunoblot of α-MYCN immunoprecipitates from IMR-5 MYCN-amplified neuroblastoma cells. The input corresponds to 0.75 % of the amount used for the precipitation. Shown is one representative experiment (n=2).
f: Immunoblot of indicated proteins after knockdown of USP11 in SMS-KAN cells and treatment with MG-132 (10 μM, 6 h) where indicated. Vinculin was used as loading control (n=1).
g: Extracted ion chromatogram of MYCN phosphorylation status from SH-EP cells expressing ectopic MYCN. Values in brackets indicate m/z ratio for each peak and the normalized target level (NL) is given for each chromatogram (n=1).
h: Immunoblot of α-USP11 immunoprecipitates from SH-EP cells stably expressing wild-type MYCN (“wt”), Thr58Ala (“TA”) or Ser62Ala (“SA”) mutants of MYCN. Asterisk denotes an unspecific band. Shown is one representative experiment (n=3).
i: Immunoblot documenting phosphorylation status of the indicated alleles of MYCN. Actin was used as loading control. Shown is one representative experiment (n=2).
j: (Left) Quantification of a proximity ligation assay illustrating complex formation of BRCA1 with MYCN in SH-EP cells expressing ectopic MYCN or empty vector as control. Between 749 and 1854 cells were counted for each condition. p-values were calculated with a two-tailed Wilcoxon test. In the box plot, the central line reflects the median and the borders of the boxes show the interquartile range of the plotted data. The whiskers extend to 1.5x of the interquartile range and outliers are shown as dots. (Right) Quantification of the corresponding immunofluorescence signals of the indicated antibodies (n=1).
Extended Data Figure 10.
a: ChIP of BRCA1 in SH-EP MYCNER cells that were pre-treated with ATR inhibitor VE-821 (1 μM, 2 h), 4-OHT or EtOH was added for 4 h. Shown is the mean and error bars indicate SD of technical triplicates of one representative experiment (n=2).
b: Immunoblot of pSer345-CHK1 after treatment with ATR inhibitor VE-821 as described above. Cells were treated with HU (5 mM) for 4 h as positive control. Asterisk denotes an unspecific band. Vinculin was used as loading control. Shown is one representative experiment (n=2).
c: ChIP of BRCA1 in SH-EP MYCNER cells at the indicated loci after treatment (9 h) with olaparib (10 μM), talazoparib (1 μM) or DMSO as control. Shown is the mean and error bars indicate SD of technical triplicates of one representative experiment (n=3).
d: Immunoblot of pSer1981-ATM after treatment with etoposide (5 μM, 3 h). Actin was used as loading control (n=1).
e: Density plots of BRCA1 occupancy after treatment with either 4-OHT or EtOH (5 h) in DMSO (left) and etoposide-treated (right) SH-EP MYCNER cells.
f: Immunoblots of α-USP11 immunoprecipitates from either control SH-EP cells or cells expressing transiently transfected MYC. CDK2 was used as loading control, asterisks denote unspecific bands. The input corresponds to 2 % of the amount used for the precipitation. Shown is one representative experiment (n=3).
g: (Left) ChIP of BRCA1 at the indicated loci in SH-EP MYCNER or SH-EP MYCER cells treated with 4-OHT (5 h) or EtOH. Shown is the mean and error bars indicate SD of technical triplicates of one representative experiment (n=2). (Right) Immunoblot performed with the ER-antibody to detect MYCNER and MYCER in SH-EP, SH-EP MYCNER or SH-EP MYCER cells treated with 4-OHT or EtOH. CDK2 was used as loading control (n=2).
h: Model illustrating our findings. We propose that BRCA1 is recruited jointly by MYCN and Ser5-phosphorylated RNAPII. BRCA1 recruitment is strongly enhanced by blockade of CDK9, which blocks pause release, and by increasing torsional stress using etoposide, suggesting that it is predominantly a stress response to stalling of RNAPII. BRCA1 in turn is required to prevent an MYCN-dependent accumulation of stalling RNAPII and R-loop formation via a mRNA de-capping complex. The critical signal in MYCN that enables recruitment of BRCA1 is the de-phosphorylation of T58, a residue that, when phosphorylated, is recognized by FBXW7 and promotes turnover of MYCN. Dephosphorylation of T58 allows binding of USP11, which stabilizes MYCN and BRCA1 on chromatin, suggesting that a kinetic competition between MYCN turnover and dephosphorylation/de-ubiquitination controls the fate of RNAPII at promoters.
Acknowledgements
This work was supported by Grants from the European Research council (AuroMYC), the German Cancer Aid (111300), the Federal Ministry of Education and Research (SYSMED) and the German Research Foundation (WO 2108/1-1). We thank Johannes Dirks and Markus Brockmann for initial experiments on USP11.
Footnotes
Author Contributions
S.H., J.K., G.B. and A.C. performed most experiments, D.S. and C.K. performed PLA assays, S.R. performed replication assays, C.S.-V performed immunofluorescence experiments. G.B. performed DRIP and GRO-sequencing analyses, A.B. performed 4sU-sequencing analyses, J.X. and C.P.A. performed shRNA screening, S.W. analyzed ChIP- and RNA-sequencing data, A.B., M.E., and C.P.A. analyzed additional high-throughput data, Jan Koster analyzed methylation status in neuroblastomas, M.D., E.W., J.M., R.V., S.H. and M.E. devised and supervised experiments and S.H. and M.E. wrote the paper.
Conflict of Interest
The authors do not declare a conflict of interest.
Data Availability
ChIP- and mRNA-sequencing datasets as well as results from the shRNA screen are available at the Gene Expression Omnibus under the accession number GEO: GSE111905. 4sU-sequencing data is available at the Gene Expression Omnibus under the accession number GEO: GSE113861.
References
- 1.Rickman DS, Schulte JH, Eilers M. The Expanding World of N-MYC-Driven Tumors. Cancer Discov. 2018;8:150–163. doi: 10.1158/2159-8290.CD-17-0273. [DOI] [PubMed] [Google Scholar]
- 2.Nie Z, et al. c-Myc Is a Universal Amplifier of Expressed Genes in Lymphocytes and Embryonic Stem Cells. Cell. 2012;151:68–79. doi: 10.1016/j.cell.2012.08.033. [DOI] [PMC free article] [PubMed] [Google Scholar]
- 3.Rahl PB, et al. c-Myc regulates transcriptional pause release. Cell. 2010;141:432–445. doi: 10.1016/j.cell.2010.03.030. [DOI] [PMC free article] [PubMed] [Google Scholar]
- 4.Pao GM, et al. Role of BRCA1 in brain development. Proceedings of the National Academy of Sciences of the United States of America. 2014;111:E1240–1248. doi: 10.1073/pnas.1400783111. [DOI] [PMC free article] [PubMed] [Google Scholar]
- 5.Kortlever RM, et al. Myc Cooperates with Ras by Programming Inflammation and Immune Suppression. Cell. 2017;171:1301–1315.:e1314. doi: 10.1016/j.cell.2017.11.013. [DOI] [PMC free article] [PubMed] [Google Scholar]
- 6.de Pretis S, et al. Integrative analysis of RNA polymerase II and transcriptional dynamics upon MYC activation. Genome Res. 2017;27:1658–1664. doi: 10.1101/gr.226035.117. [DOI] [PMC free article] [PubMed] [Google Scholar]
- 7.Lorenzin F, et al. Different promoter affinities account for specificity in MYC-dependent gene regulation. eLife. 2016;5 doi: 10.7554/eLife.15161. [DOI] [PMC free article] [PubMed] [Google Scholar]
- 8.Muhar M, et al. SLAM-seq defines direct gene-regulatory functions of the BRD4-MYC axis. Science. 2018;360:800–805. doi: 10.1126/science.aao2793. [DOI] [PMC free article] [PubMed] [Google Scholar]
- 9.Rahl PB, et al. c-Myc regulates transcriptional pause release. Cell. 2010;141:432–445. doi: 10.1016/j.cell.2010.03.030. [DOI] [PMC free article] [PubMed] [Google Scholar]
- 10.Ginno PA, Lim YW, Lott PL, Korf I, Chedin F. GC skew at the 5’ and 3’ ends of human genes links R-loop formation to epigenetic regulation and transcription termination. Genome Res. 2013;23:1590–1600. doi: 10.1101/gr.158436.113. [DOI] [PMC free article] [PubMed] [Google Scholar]
- 11.Quinet A, Lemacon D, Vindigni A. Replication Fork Reversal: Players and Guardians. Mol Cell. 2017;68:830–833. doi: 10.1016/j.molcel.2017.11.022. [DOI] [PMC free article] [PubMed] [Google Scholar]
- 12.Gorthi A, et al. EWS-FLI1 increases transcription to cause R-loops and block BRCA1 repair in Ewing sarcoma. Nature. 2018;555:387–391. doi: 10.1038/nature25748. [DOI] [PMC free article] [PubMed] [Google Scholar]
- 13.Scully R, et al. BRCA1 is a component of the RNA polymerase II holoenzyme. Proceedings of the National Academy of Sciences of the United States of America. 1997;94:5605–5610. doi: 10.1073/pnas.94.11.5605. [DOI] [PMC free article] [PubMed] [Google Scholar]
- 14.Zhang X, et al. Attenuation of RNA polymerase II pausing mitigates BRCA1-associated R-loop accumulation and tumorigenesis. Nat Commun. 2017;8:15908. doi: 10.1038/ncomms15908. [DOI] [PMC free article] [PubMed] [Google Scholar]
- 15.Hatchi E, et al. BRCA1 recruitment to transcriptional pause sites is required for R-loop-driven DNA damage repair. Mol Cell. 2015;57:636–647. doi: 10.1016/j.molcel.2015.01.011. [DOI] [PMC free article] [PubMed] [Google Scholar]
- 16.Chen L, et al. R-ChIP Using Inactive RNase H Reveals Dynamic Coupling of R-loops with Transcriptional Pausing at Gene Promoters. Mol Cell. 2017;68:745–757.:e745. doi: 10.1016/j.molcel.2017.10.008. [DOI] [PMC free article] [PubMed] [Google Scholar]
- 17.Brannan K, et al. mRNA decapping factors and the exonuclease Xrn2 function in widespread premature termination of RNA polymerase II transcription. Mol Cell. 2012;46:311–324. doi: 10.1016/j.molcel.2012.03.006. [DOI] [PMC free article] [PubMed] [Google Scholar]
- 18.Almada AE, Wu X, Kriz AJ, Burge CB, Sharp PA. Promoter directionality is controlled by U1 snRNP and polyadenylation signals. Nature. 2013;499:360–363. doi: 10.1038/nature12349. [DOI] [PMC free article] [PubMed] [Google Scholar]
- 19.Hernandez G, et al. Decapping protein EDC4 regulates DNA repair and phenocopies BRCA1. Nat Commun. 2018;9:967. doi: 10.1038/s41467-018-03433-3. [DOI] [PMC free article] [PubMed] [Google Scholar]
- 20.Chang CT, Bercovich N, Loh B, Jonas S, Izaurralde E. The activation of the decapping enzyme DCP2 by DCP1 occurs on the EDC4 scaffold and involves a conserved loop in DCP1. Nucleic Acids Res. 2014;42:5217–5233. doi: 10.1093/nar/gku129. [DOI] [PMC free article] [PubMed] [Google Scholar]
- 21.Buechel G, et al. Association with Aurora-A Controls N-MYC-Dependent Promoter Escape and Pause Release of RNA Polymerase II during the Cell Cycle. Cell reports. 2017;21:3483–3497. doi: 10.1016/j.celrep.2017.11.090. [DOI] [PMC free article] [PubMed] [Google Scholar]
- 22.Orthwein A, et al. A mechanism for the suppression of homologous recombination in G1 cells. Nature. 2015;528:422–426. doi: 10.1038/nature16142. [DOI] [PMC free article] [PubMed] [Google Scholar]
- 23.Maertens GN, El Messaoudi-Aubert S, Elderkin S, Hiom K, Peters G. Ubiquitin-specific proteases 7 and 11 modulate Polycomb regulation of the INK4a tumour suppressor. The EMBO journal. 2010;29:2553–2565. doi: 10.1038/emboj.2010.129. [DOI] [PMC free article] [PubMed] [Google Scholar]
- 24.Tavana O, et al. HAUSP deubiquitinates and stabilizes N-Myc in neuroblastoma. Nat Med. 2016;22:1180–1186. doi: 10.1038/nm.4180. [DOI] [PMC free article] [PubMed] [Google Scholar]
- 25.Jaenicke LA, et al. Ubiquitin-Dependent Turnover of MYC Antagonizes MYC/PAF1C Complex Accumulation to Drive Transcriptional Elongation. Mol Cell. 2016;61:54–67. doi: 10.1016/j.molcel.2015.11.007. [DOI] [PubMed] [Google Scholar]
- 26.Farrell AS, Sears RC. Vol. 4. Cold Spring Harbor perspectives in medicine; 2014. MYC degradation. [DOI] [PMC free article] [PubMed] [Google Scholar]
- 27.Li J, et al. EYA1’s Conformation Specificity in Dephosphorylating Phosphothreonine in Myc and Its Activity on Myc Stabilization in Breast Cancer. Molecular and cellular biology. 2017;37 doi: 10.1128/MCB.00499-16. [DOI] [PMC free article] [PubMed] [Google Scholar]
- 28.Hu Y, et al. PARP1-driven poly-ADP-ribosylation regulates BRCA1 function in homologous recombination-mediated DNA repair. Cancer Discov. 2014;4:1430–1447. doi: 10.1158/2159-8290.CD-13-0891. [DOI] [PMC free article] [PubMed] [Google Scholar]
- 29.Kouzine F, et al. Transcription-dependent dynamic supercoiling is a short-range genomic force. Nat Struct Mol Biol. 2013;20:396–403. doi: 10.1038/nsmb.2517. [DOI] [PMC free article] [PubMed] [Google Scholar]
- 30.Vo BT, et al. The Interaction of Myc with Miz1 Defines Medulloblastoma Subgroup Identity. Cancer cell. 2016;29:5–16. doi: 10.1016/j.ccell.2015.12.003. [DOI] [PMC free article] [PubMed] [Google Scholar]
- 31.Sanz LA, et al. Prevalent, Dynamic, and Conserved R-Loop Structures Associate with Specific Epigenomic Signatures in Mammals. Mol Cell. 2016;63:167–178. doi: 10.1016/j.molcel.2016.05.032. [DOI] [PMC free article] [PubMed] [Google Scholar]
- 32.Schulein-Volk C, et al. Dual regulation of fbw7 function and oncogenic transformation by usp28. Cell reports. 2014;9:1099–1109. doi: 10.1016/j.celrep.2014.09.057. [DOI] [PubMed] [Google Scholar]
- 33.Ginno PA, Lott PL, Christensen HC, Korf I, Chedin F. R-loop formation is a distinctive characteristic of unmethylated human CpG island promoters. Mol Cell. 2012;45:814–825. doi: 10.1016/j.molcel.2012.01.017. [DOI] [PMC free article] [PubMed] [Google Scholar]
- 34.Boguslawski SJ, et al. Characterization of monoclonal antibody to DNA.RNA and its application to immunodetection of hybrids. Journal of immunological methods. 1986;89:123–130. doi: 10.1016/0022-1759(86)90040-2. [DOI] [PubMed] [Google Scholar]
- 35.Walz S, et al. Activation and repression by oncogenic MYC shape tumour-specific gene expression profiles. Nature. 2014;511:483–487. doi: 10.1038/nature13473. [DOI] [PMC free article] [PubMed] [Google Scholar]
- 36.Chen X, et al. Integration of external signaling pathways with the core transcriptional network in embryonic stem cells. Cell. 2008;133:1106–1117. doi: 10.1016/j.cell.2008.04.043. [DOI] [PubMed] [Google Scholar]
- 37.Gardini A. Global Run-On Sequencing (GRO-Seq) Methods Mol Biol. 2017;1468:111–120. doi: 10.1007/978-1-4939-4035-6_9. [DOI] [PMC free article] [PubMed] [Google Scholar]
- 38.Klusmann I, et al. p53 Activity Results in DNA Replication Fork Processivity. Cell reports. 2016;17:1845–1857. doi: 10.1016/j.celrep.2016.10.036. [DOI] [PubMed] [Google Scholar]
- 39.Langmead B, Trapnell C, Pop M, Salzberg SL. Ultrafast and memory-efficient alignment of short DNA sequences to the human genome. Genome Biol. 2009;10:R25. doi: 10.1186/gb-2009-10-3-r25. [DOI] [PMC free article] [PubMed] [Google Scholar]
- 40.Zhang Y, et al. Model-based analysis of ChIP-Seq (MACS) Genome Biol. 2008;9:R137. doi: 10.1186/gb-2008-9-9-r137. [DOI] [PMC free article] [PubMed] [Google Scholar]
- 41.Quinlan AR, Hall IM. BEDTools: a flexible suite of utilities for comparing genomic features. Bioinformatics. 2010;26:841–842. doi: 10.1093/bioinformatics/btq033. [DOI] [PMC free article] [PubMed] [Google Scholar]
- 42.Freese NH, Norris DC, Loraine AE. Integrated genome browser: visual analytics platform for genomics. Bioinformatics. 2016;32:2089–2095. doi: 10.1093/bioinformatics/btw069. [DOI] [PMC free article] [PubMed] [Google Scholar]
- 43.Ramirez F, Dundar F, Diehl S, Gruning BA, Manke T. deepTools: a flexible platform for exploring deep-sequencing data. Nucleic Acids Res. 2014;42:W187–191. doi: 10.1093/nar/gku365. [DOI] [PMC free article] [PubMed] [Google Scholar]
- 44.Bailey TL, et al. MEME SUITE: tools for motif discovery and searching. Nucleic Acids Res. 2009;37:W202–208. doi: 10.1093/nar/gkp335. [DOI] [PMC free article] [PubMed] [Google Scholar]
- 45.Shen L, Shao N, Liu X, Nestler E. ngs.plot: Quick mining and visualization of next-generation sequencing data by integrating genomic databases. BMC Genomics. 2014;15:284. doi: 10.1186/1471-2164-15-284. [DOI] [PMC free article] [PubMed] [Google Scholar]
- 46.Martin M. Cutadapt removes adapter sequences from high-throughput sequencing reads. 2011;17:3. doi: 10.14806/ej.17.1.200. 2011. [DOI] [Google Scholar]
- 47.Kim D, et al. TopHat2: accurate alignment of transcriptomes in the presence of insertions, deletions and gene fusions. Genome Biol. 2013;14:R36. doi: 10.1186/gb-2013-14-4-r36. [DOI] [PMC free article] [PubMed] [Google Scholar]
- 48.Langmead B, Salzberg SL. Fast gapped-read alignment with Bowtie 2. Nature methods. 2012;9:357–359. doi: 10.1038/nmeth.1923. [DOI] [PMC free article] [PubMed] [Google Scholar]
- 49.Derti A, et al. A quantitative atlas of polyadenylation in five mammals. Genome Res. 2012;22:1173–1183. doi: 10.1101/gr.132563.111. [DOI] [PMC free article] [PubMed] [Google Scholar]
- 50.Subramanian A, et al. Gene set enrichment analysis: a knowledge-based approach for interpreting genome-wide expression profiles. Proceedings of the National Academy of Sciences of the United States of America. 2005;102:15545–15550. doi: 10.1073/pnas.0506580102. [DOI] [PMC free article] [PubMed] [Google Scholar]
- 51.Liberzon A, et al. The Molecular Signatures Database (MSigDB) hallmark gene set collection. Cell Syst. 2015;1:417–425. doi: 10.1016/j.cels.2015.12.004. [DOI] [PMC free article] [PubMed] [Google Scholar]
- 52.Su Z, et al. An investigation of biomarkers derived from legacy microarray data for their utility in the RNA-seq era. Genome Biol. 2014;15:523. doi: 10.1186/s13059-014-0523-y. [DOI] [PMC free article] [PubMed] [Google Scholar]
- 53.Kim YH, et al. Combined microarray analysis of small cell lung cancer reveals altered apoptotic balance and distinct expression signatures of MYC family gene amplification. Oncogene. 2006;25:130–138. doi: 10.1038/sj.onc.1208997. [DOI] [PubMed] [Google Scholar]
Associated Data
This section collects any data citations, data availability statements, or supplementary materials included in this article.
Data Availability Statement
ChIP- and mRNA-sequencing datasets as well as results from the shRNA screen are available at the Gene Expression Omnibus under the accession number GEO: GSE111905. 4sU-sequencing data is available at the Gene Expression Omnibus under the accession number GEO: GSE113861.


