Abstract
Myosin-2 is essential for processes as diverse as cell division and muscle contraction. Dephosphorylation of its regulatory light chain (RLC) promotes an inactive, ‘shutdown’ state with the filament-forming tail folded onto the two heads1, preventing filament formation and inactivating the motors2. The mechanism by which this happens is obscure. Here we report a cryo-electron microscopy structure of shutdown smooth muscle myosin, with a resolution of 6 Å in the head region. A pseudo-atomic model, obtained by flexible fitting of crystal structures into the density and molecular dynamics simulations, describes interaction interfaces at the atomic level. The N-terminal extension of one RLC interacts with the tail and the other with the partner head, revealing how the RLCs stabilise the shutdown state in different ways and how their phosphorylation would allow myosin activation. Additional interactions between the three segments of the coiled coil, the motor domains and LCs stabilise the shutdown molecule. The structure of the lever in each head is competent to generate force upon activation. This shutdown structure is relevant to all myosin-2 isoforms and provides a framework for understanding their disease-causing mutations.
Myosin-2 is a molecular motor that interacts with actin using the energy from ATP hydrolysis to generate force and movement. It comprises two heavy chains, two essential light chains (ELC) and two regulatory light chains (RLC). The first ~800 residues of the heavy chain form the globular motor, which contains binding sites for actin and nucleotide. The remaining heavy chain forms an α-helix, in which the proximal region complexes with one ELC and one RLC to form a stiff light chain domain (LCD) that transmits motor force via a lever mechanism. The motor and the LCD comprise the myosin head. C-terminal to the LCD, the two heavy chains dimerise to form a 160-nm coiled-coil tail. The coiled coil contains the typical seven residue heptad repeat3, interrupted by three ‘skip’ residues in smooth muscle and non-muscle myosin-2 isoforms.
In the active state of smooth muscle myosin (SmM), the two RLCs are phosphorylated4 and the tails are polymerised into thick filaments. Dephosphorylation of S20 and/or T19 within the N-terminal extension of the RLCs4,5 triggers an extraordinary transformation into a monomeric, shutdown state, in which both motors are trapped in a primed state, phosphate release is inhibited and ATPase activity is very low6. The two motor domains are organised into an asymmetric, interacting heads motif (IHM) (Fig. 1a), in which part of the actin-binding interface of the motor in the ‘blocked’ head is positioned onto the converter domain of the motor in the ‘free’ head, preventing interaction with actin7. The coiled-coil tail folds into three segments and wraps around the heads8,9.
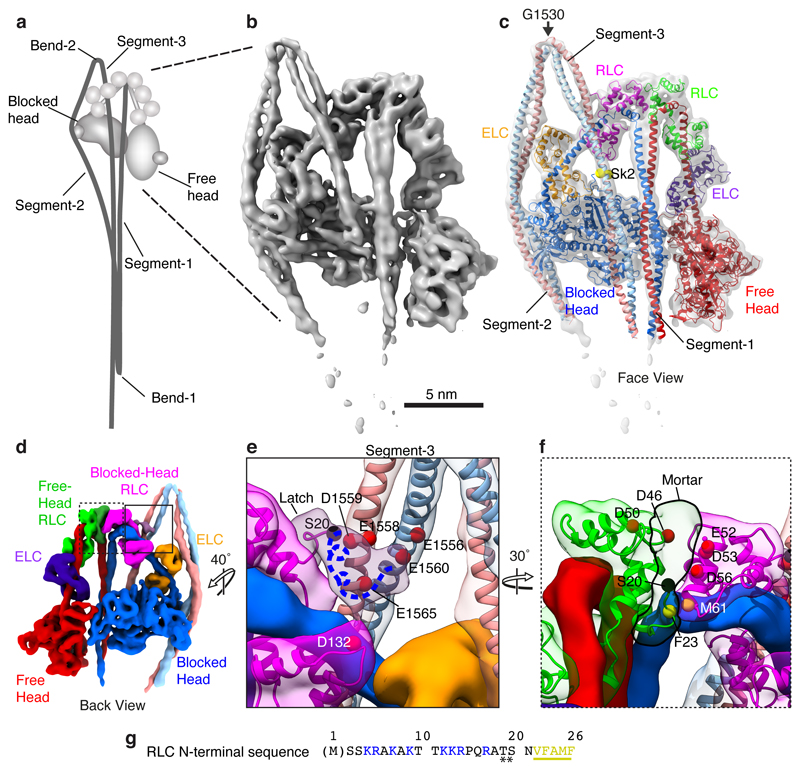
Figure 1. Structure of the heads region of shutdown SmM and contributions of the RLCs to the shutdown state.
a, Cartoon of the entire folded molecule showing head-head interaction (IHM), and path of the folded tail including its three segments and two bends. b, cryoEM density map of the heads region (face view) thresholded (0.369) to display secondary structure. c, Backbone depiction of pseudo-atomic model fitted into the density map with individual chains labelled. Residue G1530 is at the centre of bend-2; Sk2 denotes skip residue 2 (Q1592). d, Density map as in b (back view), segmented and coloured by chain as in c, boxed regions shown enlarged (e and f) to highlight additional density of the blocked-head RLC-N-terminal extension ‘latch’ (e) and free-head and RLC-N-terminal extension ‘mortar’ (f). Canonical RLCs shown translucent with fitted model. In e & f, the phosphorylatable serine (S20) is highlighted (black sphere). The approximate path of the remaining N-terminal extension (containing positively-charged residues (as shown in g) depicted as a blue dashed line. In e, a ring of negatively-charged residues in segment-3 is shown as red Cα spheres. In f, negatively-charged residues in RLCs that could interact with positively-charged residues in the N-terminal extension are shown as red Cα spheres; the hydrophobic interface between free-head and blocked-head RLCs is indicated by yellow spheres. g, Amino acid sequence of SmM RLC-N-terminal extension; basic residues highlighted blue; hydrophobic residues highlighted yellow. (Note: N-terminal Met is residue 1 in our numbering, thus residue numbers used in this paper are in some cases one higher than elsewhere in the literature.)
The shutdown state and IHM appear conserved across myosin-2 isoforms1,8. It may have originated to sequester motors from their interaction with actin and facilitate transport or movement of myosin within the cytoplasm. Its formation is driven by RLC dephosphorylation or, in some invertebrate muscles, by release of Ca2+ from the ELC10. In vertebrate striated muscle IHM can form spontaneously9. In resting striated muscle, the IHM, in which the heads interact with tail segment-111, correlates with suppressed ATPase activity12,13. Mutations that disrupt these interactions may cause cardiomyopathies14,15.
Structural studies of the shutdown state have been limited to 20 Å7,16, limiting our understanding of the key interactions required for formation, maintenance and release of the shutdown state, the role of the RLCs in this transformation, and how ATPase activity and filament formation are suppressed.
We report a sub-nanometre cryo-electron microscopy (cryoEM) structure of shutdown SmM, which allows the structure of a two-headed myosin to be seen in unprecedented detail (Fig. 1, Extended data Fig. 1 and Supplementary Video 1). This was fitted by pseudo-atomic models to allow detailed interpretation (Methods). The density for segment-3 shows a skip residue perturbation that was best fit by placing the skip residue Q1592 centrally within it. This fit assigns tail bend-2 to G1530, a point of weakness previously identified as the bend site from tail segment lengths17 (Fig. 1b, c).
RLC stabilisation of the shutdown state
Interactions between the N-terminal extension of the RLCs and the rest of the molecule are crucial to understanding how the shutdown state is stabilised. Our EM structure reveals the positions of the N-terminal extension for the RLCs of both blocked- and free heads, and shows that they are different, suggesting that phosphorylation unlocks different interactions within the shutdown molecule for each RLC.
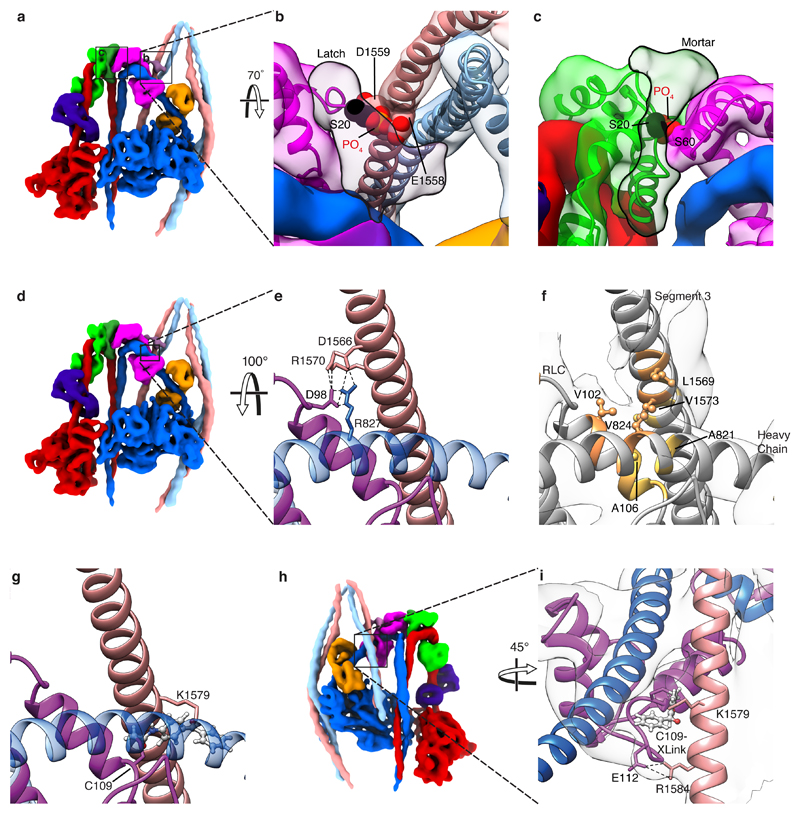
In the blocked-head RLC, the phosphorylatable serine, S20, lies close to two negatively-charged residues, E1558 and D1559, in segment-3 (Fig. 1d, e). Phosphorylated S20 would clash sterically with the side chain of E1558 (Extended Data Fig. 2a, b). There is no crystal structure for the remaining N-terminal extension. However, unfilled density from the blocked-head RLC continues close behind segment-3, where four positively-charged residues, K12, K13, R14 and R17 (Fig. 1g) that stabilise the shutdown state18 could make ionic interactions with negatively-charged residues (between E1556 and E1565) in segment-3 and in the C-lobe of the blocked-head RLC (D132) (Fig. 1e). Both helices of segment-3 are thus captured by this ‘latch’ and held close to the blocked-head RLC. Phosphorylated T19 and S20 would repel the negatively-charged region of segment-3, and this, combined with a potential alteration in structure19, would open the latch between the RLC and segment-3, freeing the tail and disrupting the shutdown state.
In the free-head RLC, the N-terminal extension, rearwards of S20, continues as unfilled density to the top of the head-tail junction and across the top of the free-head RLC (Fig. 1d, f). It appears to cement the two RLCs together, hence the term ‘mortar’. Positively-charged residues (K12, K13, R14 and R17) in the mortar could form stabilising ionic interactions with negatively-charged residues in both RLCs (Fig. 1f). Additional hydrophobic interactions between the free- and blocked-head RLC help stabilise this interaction (Fig. 1f). Phosphorylation of S20 in the free-head RLC would disrupt this RLC-RLC interaction and destabilise the IHM (Extended Data Fig. 2a, c).
Both RLC N-terminal extensions are surface exposed and their weaker EM density suggests they are mobile. The free-head RLC may be phosphorylated by myosin light chain kinase first, as the blocked-head RLC is juxtaposed with the folded tail, and thus less available. This is consistent with observations that in SmM, phosphorylation of 50% of the total sites only slightly activates the ATPase activity and phosphorylation of RLC is ordered while in heavy meromyosin, which lacks segments 2 and 3, RLC phosphorylation is random20–22. The mobility of the N-terminal extensions may enable the kinase to phosphorylate the RLCs in situ in the shutdown state, rather than requiring the structure to open transiently.
In striated muscle thick filaments, the RLCs have similar complementary basic and acidic residues so the mortar may form and help stabilise the IHM11. All human RLCs contain a phosphorylatable serine residue at the equivalent position of that in SmM23. Its phosphorylation modulates striated muscle contraction and is critical for normal cardiac output24. The mortar is on the outward-facing side of the IHM11, where it could be accessible for phosphorylation.
The C-lobe of the blocked-head RLC and the LCD-heavy chain makes ionic and hydrophobic interactions with segment-3 (Extended Data Fig. 2d-i, Extended Data Table 2). The interaction of RLC E112 with segment-3 R1584 is interesting as E112 is conserved across many myosin-2 isoforms but is replaced by proline in vertebrate striated-muscle myosins, potentially explaining their incomplete folding9. Our model demonstrates that blocked-head RLC C109 would most likely crosslink to segment-3 K1579 (Extended Data Fig. 2 g-i), consistent with crosslinking evidence that C109 interacts with segment-3 between L1555 and E158417.
Role of segment-2 in stabilisation
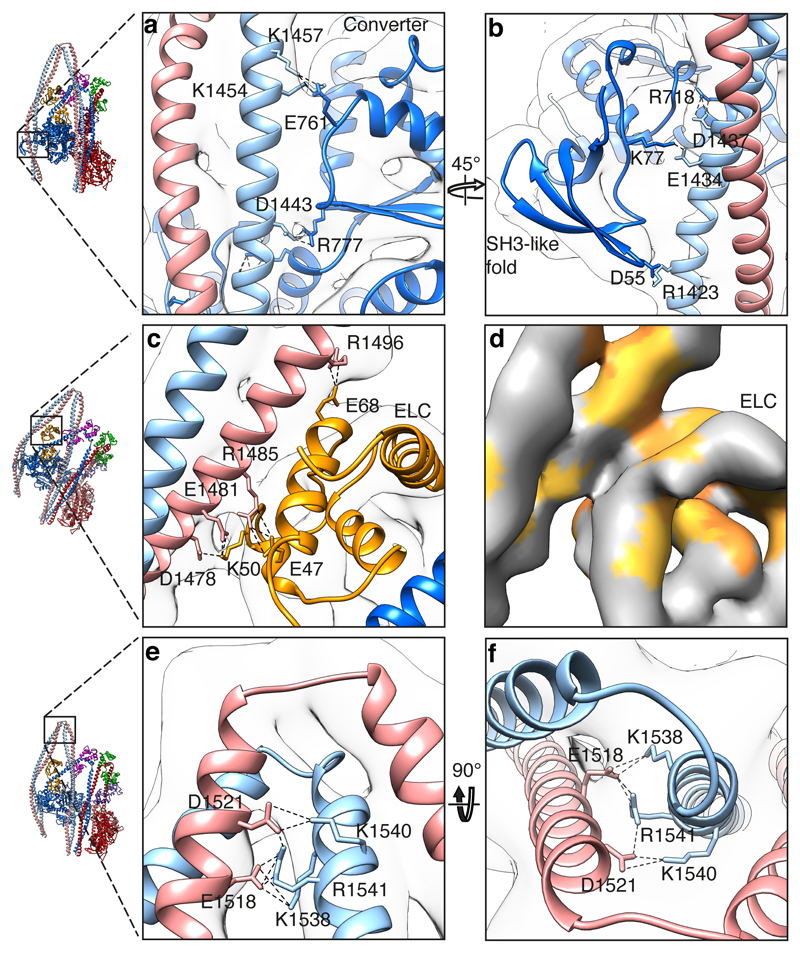
Extensive interactions between segment-2 and the blocked head motor, blocked-head ELC and segment 3 help stabilise the shutdown state (Fig. 2 and Supplemental Video 2). Residues 1430-1457 of one chain (chain G) of segment-2 dock into a groove formed between the SH3-like domain, SH1 helix and the converter domain stabilised by multiple ionic interactions (Fig. 2a, b, Extended data Table 1). The importance of the interaction between SH3 K77 and segment-2 E1434 is indicated by disease-causing missense mutations of the equivalent residues in human SmM and non-muscle myosin-2A (Extended Data Fig. 3)25–28.
Figure 2. Interactions of tail segment-2 with the blocked head.
a, Ionic interactions of segment 2 with the converter (0.369). b, Ionic interactions of segment-2 with the SH3-like fold and SH1 Helix (0.369). c, Ionic interactions of segment-2 with ELC (0.280). d, Hydrophobic interactions between segment-2 and ELC; a shallow hydrophobic pocket formed by the ELC contacts segment-2 (0.369). e, f, Orthogonal views of ionic interactions between segment-2 and segment-3 at bend 2 (0.250). CryoEM density contour levels shown in brackets.
Segment-2 interacts with the N-lobe of the blocked-head ELC by ionic (Fig. 2c, Extended Data Table 1) and hydrophobic (A1491-A1495 in segment-2 and F67-M74 in ELC (Fig. 2d)) interactions. Bend-2 is stabilised by ionic interactions between acidic residues in segment-2 and basic residues in segment-3 (Fig. 2e-f). All these interactions are consistent with the path of segment-2 seen in negative-stain EM structures8,29. They clamp the blocked head lever in the primed state, with phosphate trapped in its active site.
LCDs and head-tail junction structure
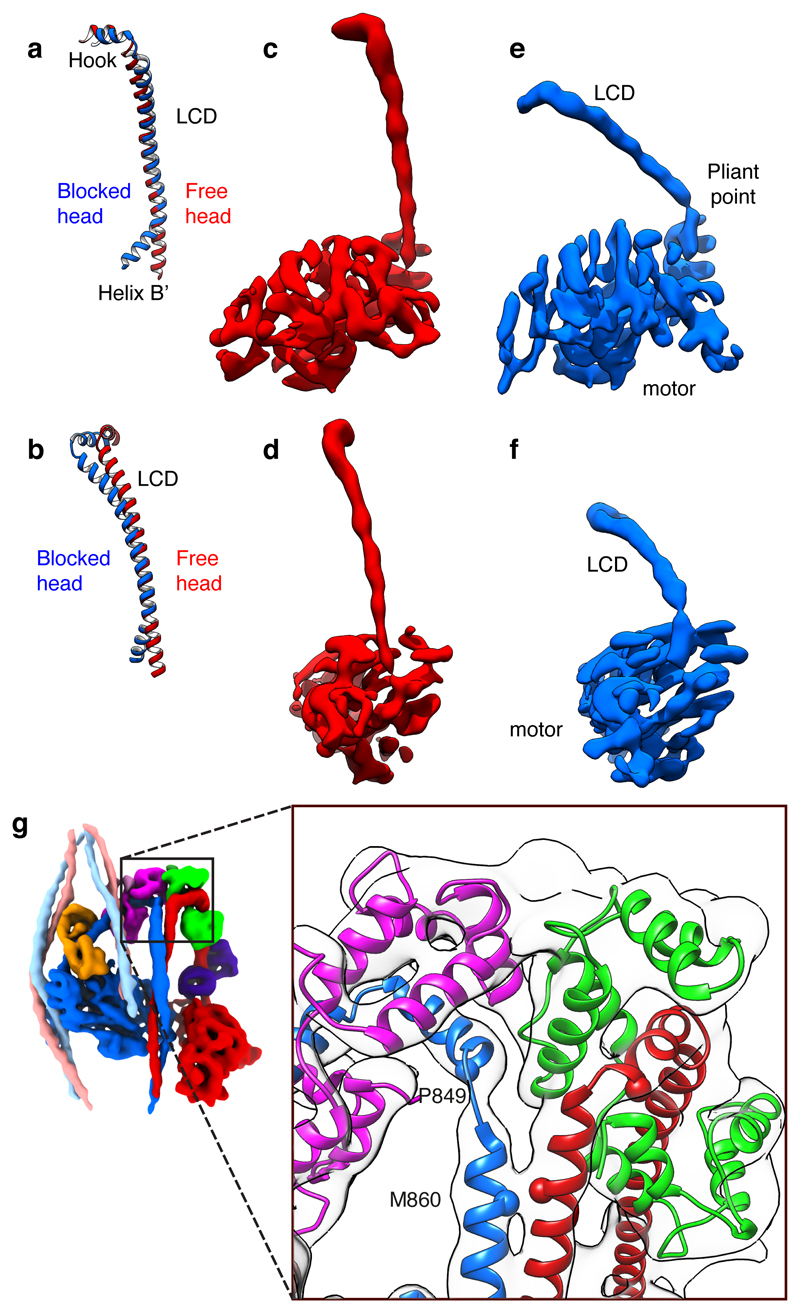
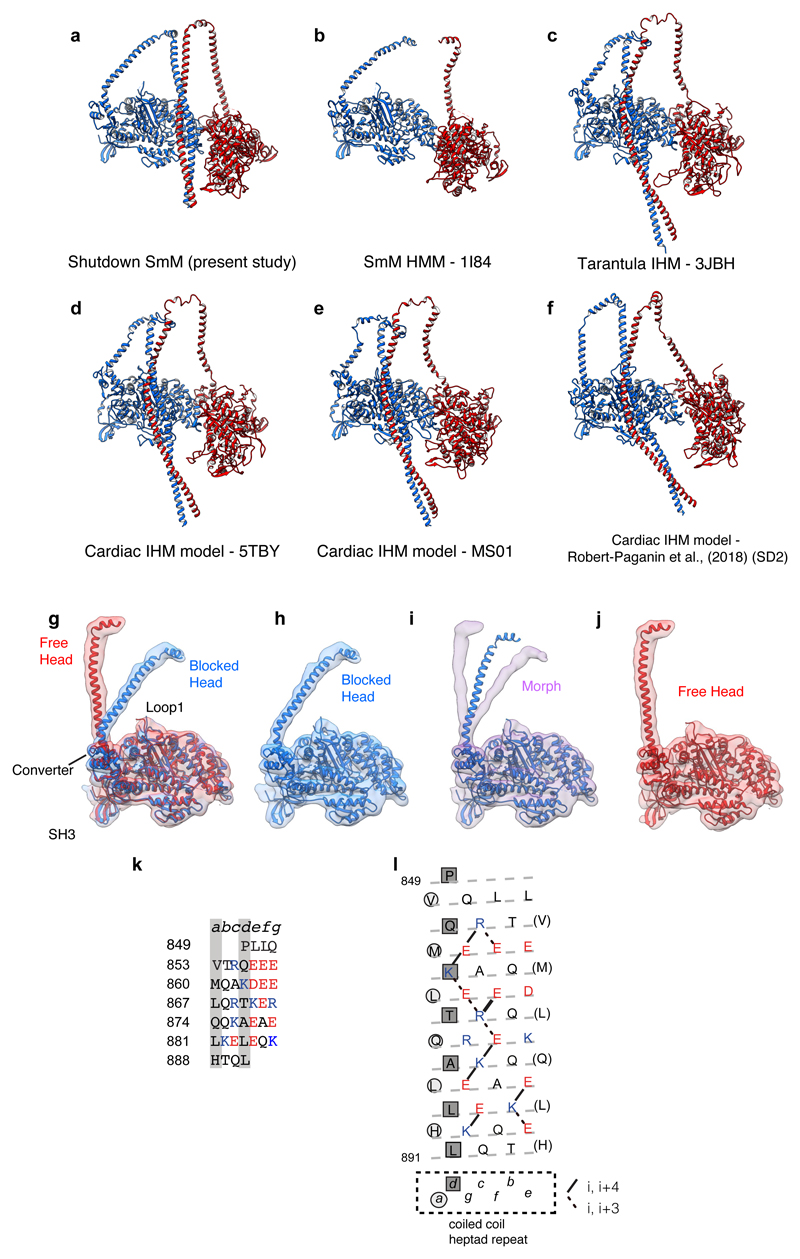
The heavy chain backbone of both LCDs has strong and continuous α-helical density that is only gently curved (Fig. 3a-f). The shape of the blocked-head LCD most closely matches that of a squid muscle myosin head crystal structure30, while the free-head LCD has even less curvature at the ELC-RLC boundary (Fig. 3a, b). This compact structure is consistent with the essential role of the LCD in withstanding bending force in active muscle. In contrast, recent pseudo-atomic models of the IHM fitted to lower resolution structures15,31,32 have included segments of extended coil in the LCD heavy chain (Extended Data Fig. 4a-f), which would render the LCD incompetent as a lever.
Figure 3. The levers of free- and blocked-heads and head-tail junction.
a, b, Blocked and free-head lever heavy chain pseudo-atomic models superposed on backbone atoms of the ELC-binding IQ motif, oriented to match panels c-f. Heavy chain shown runs from Helix B’ of converter to hook helix of LCD. c, d, Two orthogonal views of density map of free-head motor plus LCD with LCs omitted for clarity, and e, f, corresponding views of blocked-head motor. Threshold for density maps chosen to illustrate the narrow density at the pliant point of the blocked-head motor. g, Structure of the head-tail junction with atomic model fitted into electron density map; colours as Fig. 1. Cα of invariant Pro849 of hook helix and Met860 at start of coiled coil shown as spheres. Contour level for c–f 0.594; for g 0.475.
The motor-LCD junctions of the two heads are markedly different. In the free head cryoEM density, the heavy-chain helix of the LCD is an unbroken extension of converter Helix B’, as is found in most crystal structures of myosin heads (Fig.3c, d). However, the blocked-head density has a sharp pinch point and abrupt change in direction between the converter and LCD heavy-chain helices, which match the ‘pliant point’ in a primed SmM motor-ELC crystal structure33 (Fig. 3e, f). As such apparent weakness of the head at the pliant point appears incompatible with force transmission by the lever, tight binding to actin and concomitant structural changes in the motor during the working stroke must strengthen this region. A flexible junction in the primed state may facilitate initial binding of the motor to actin, as seen in myosin 5 walking on actin34.
The blocked- and free-head motors have similar structures, despite the difference in their LCD positions (Extended Data Fig.4g-j and Supplementary Video 3). Bending at the pliant point in the blocked-head lever is accompanied by a small shift of the converter away from the LCD, suggestive of strain induced by IHM formation. Small changes are also seen in SH3 and Loop1 positions relative to the rest of the motor. The similarity of shutdown motor structures to those of primed myosin motors suggests that Pi is trapped in the shutdown state if the lever is in the primed position.
At the head-tail junction, the density is compatible with the two-fold rotational symmetry of the coiled-coil tail C-terminal to residue M860. However, upstream the two helices diverge and bend sharply to connect to P849 at the end of the hook helix of each head with minimal loss of α-helix (Fig. 3g, Supplementary Video 4). Thus, about seven residues of the predicted coiled coil at the start of segment-1 are separated in the shutdown state. This region of sequence is rich in charged residues, which would allow formation of the intrahelical ionic interactions characteristic of single α-helical domains35 (Extended Data Fig. 4k, l). These two chains could thus be stable as separate α-helices in the active state and could extend as constant force springs36 to transmit force from the lever to the thick filament backbone.
The tail-tail-motor complex
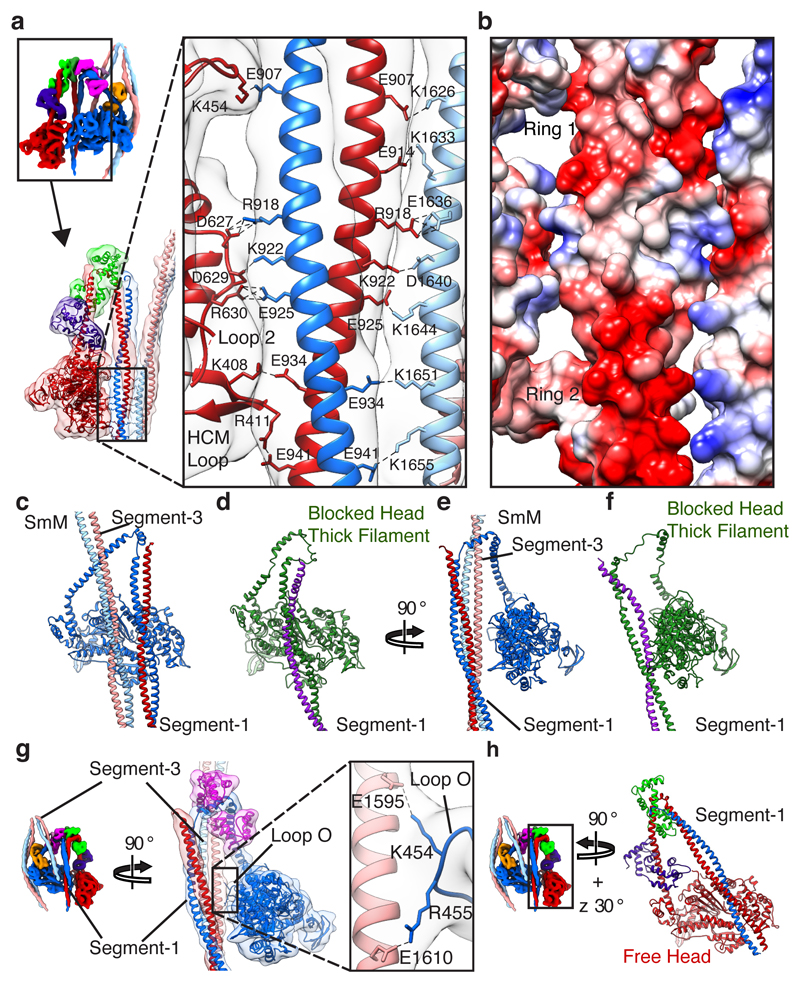
The shutdown state is further stabilised by extensive ionic interactions between segments 1 and 3 as they pass the free- and blocked-head motors, and between segment-1 and the free-head motor (Fig. 4a). Negatively charged residues in two rings37, and positively charged residues in between, promote the interaction of one chain of segment-1 with segment-3, and the other chain with the free head motor (Fig. 4a, b). These interactions form a stripe near the tip of the free head motor that comprises loop O (K454), loop 2 (part of the actin-binding interface38) and the HCM loop (Fig. 4a).
Figure 4. Interactions of segments 1 and 3 with blocked- and free-head motors.
a, b, Network of ionic interactions clamping together the free-head motor, segment-1 and segment-3, shown in back view. a, Model fitted into density map with side chains of interacting residues shown (contour level 0.170). b, Surface view of model with acidic areas shaded red and basic areas shaded blue. Ring 1 and Ring 2 denote two rings of acidic character in segment-137. c-f, Comparison of blocked-head tail interactions between shutdown SmM and tarantula thick filament IHM (PDB id 3JBH); segment-2, blocked-head LCs and free head omitted for clarity. c, d Face view. e, f, Side view. g, Ionic interaction of loop O in the blocked-head motor with segment-3 (contour level 0.280); segment-2, blocked-head ELC and free-head omitted for clarity. h, Depiction of segment-1 crossing the free-head motor, with the motor shown in the same orientation as that of the blocked head in c-d.
The interaction between the blocked-head motor and segment-1 (Fig. 4c, e) is limited to a single interface involving blocked-head loop 2 (Extended Data Fig. 5a, b). In contrast, in the IHM in striated muscle thick filaments, the blocked-head motor interacts extensively with segment 1 (Fig. 4d, f) along the ‘mesa trail’39. In shutdown SmM, access of segment-1 to the mesa trail is blocked by the interaction of segment-3 with loop O of the blocked-head motor, and segment-1 interacts with the free-head motor instead (Fig. 4c, g). Segment-1 is straight in our map and in a crystal structure37. In thick filaments it is bent31 possibly due to local packing effects. While the path of segment-1 across the face of the blocked-head motor (Fig. 4c) and equivalent view of the free-head motor (Fig. 4h) appear similar, segment-1 is parallel to the free-head motor when viewed from the side (Fig. 4a) but rotated away from the blocked-head motor (Fig. 4e), preventing the formation of extensive interactions.
Mesa trail interactions (blocked-head motor to segment-1) have been suggested as critical for the stability of the IHM across the myosin-2 class14,15,39. It is possible that mesa interactions could steer the formation of the shutdown state in SmM. However, their absence in shutdown myosin shows that they are not an essential part of IHM structure and that the IHM can be stabilised in other ways.
Motor-motor interactions in the IHM
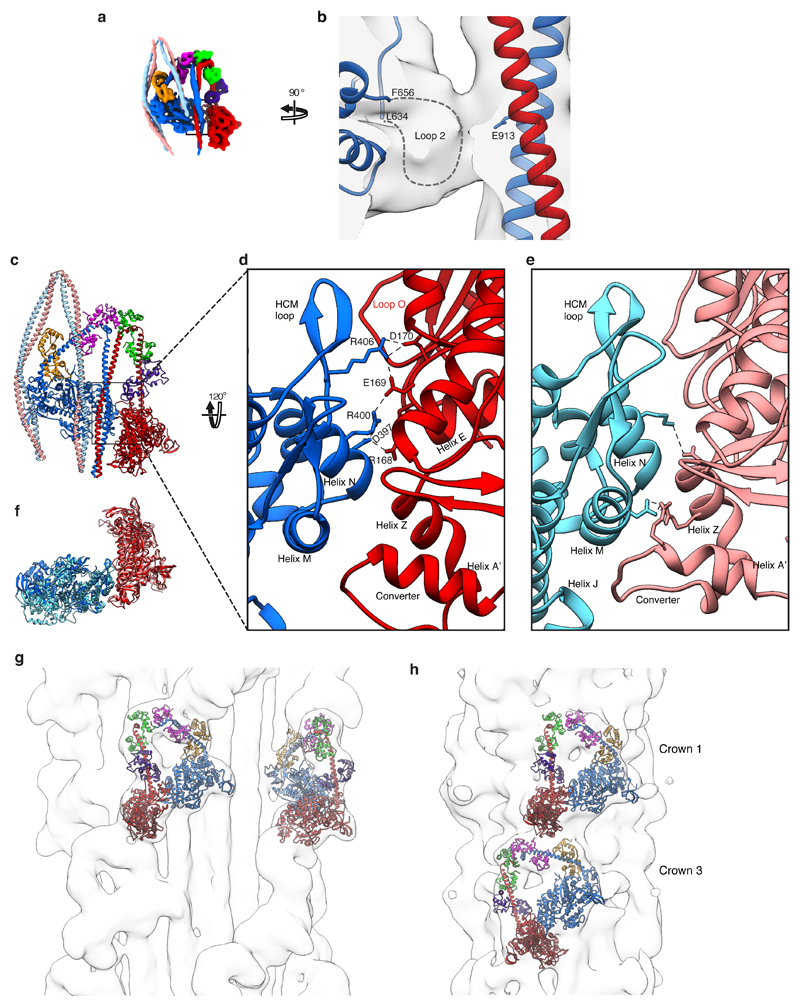
A small network of stabilising ionic interactions occurs between residues in Helix N and the HCM loop of the blocked-head motor and residues 168-170 close to Helix E of the free-head motor (Extended Data Fig. 5c-d and Supplementary Video 5). The close similarities between previous lower resolution structures of IHMs in shutdown myosin8,29 and resting thick filaments40 indicate that these interactions are common to both states, but they can now be seen in detail. A similar interaction interface was proposed for a recent model of the cardiac IHM32, with additional ionic interactions of helix M with helices Z and A’ of the converter (Extended Data Fig. 5e). While ionic interactions are not observed within this region in our structure, due to sequence differences, the overall position of helices M and Z and the converter are similar and hydrogen bonds between these regions are observed in our model. Discrepancies at the interaction interface largely result from a small counter-clockwise rotation of the blocked-head in the cardiac model (Extended Data Fig. 5f). The pseudo-atomic model of the heads region of shutdown SmM fits the lower resolution IHM density maps of both tarantula and cardiac thick filaments well (Extended Data Fig. 5g-h). Since our model is constrained by a sub-nanometre density map, it probably describes the thick filament IHM structure better than previous pseudo-atomic models.
Whole SmM molecule
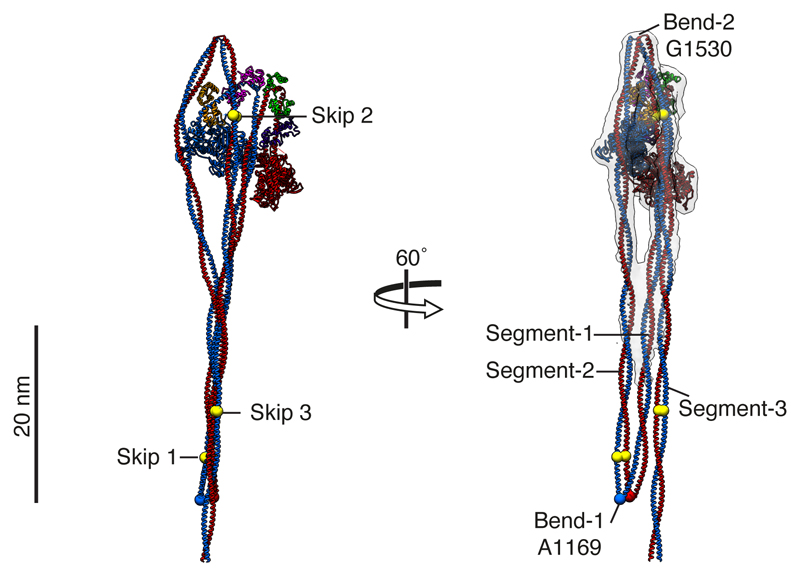
To learn about the folded tail region, we also generated a 9-Å structure of the whole shutdown SmM (Methods. Here, a short distance away from the myosin heads, the three tail segments form an untwisted ribbon, seen edge-on in the face view plane, with segment-2 at the rear, segment-1 central and segment-3 in front (Fig. 5a and Supplementary Video 6). The ribbon flexes in plane, presumably due to thermal excitation, from which we estimate a Young’s modulus of 3.5 GPa (Extended Data Fig. 6 and Supplementary Video 7), comparing well with an estimate of ~1.0 GPa for a single tail8.
Figure 5. CryoEM density map and pseudo-atomic model of whole SmM molecule.
a, Cryo-EM density of whole SmM molecule, thresholded to display the tail ribbon (contour 0.022). b, c, Spacefill and ribbon depictions respectively of pseudo-atomic model of SmM. d, Model fitted into density map, to show arrangement of tail segments. Colours as in Fig. 1 except segment-2 and segment-3 are coloured as continuations of segment-1. Skip residues 1 (Q1199), 2 (Q1592) and 3 (K1817) are indicated by yellow spheres. Bend-1 at A1169 also highlighted. The tail ribbon is ~220 Å long. The C-terminal non-helical tailpiece of SmM is not modelled.
We extended the pseudo-atomic model of the heads region to incorporate the entire predicted coiled-coil tail (Fig. 5b), fitted into the structure. Bend-1 is at A1169, close to the estimate of A1176 based on segment lengths8. The predicted coiled coil ends 75 Å beyond bend-1, similar to the 66 Å measured in negatively-stained molecules8. At bend-1, the coiled-coil twist azimuth at A1169 naturally causes the start of segment-2 to lie behind (rather than to the side of) segment-1.
The local lack of supercoiling caused by skip-1 in segment-2 results in a mismatch between the coiled-coil crossovers of the antiparallel segment-1 and segment-2 (Fig. 5d). Skip-3 in segment-3 is also in this ribbon region, but the local lack of supercoiling brings no obvious benefit to the ribbon structure. An additional skip residue in segment-2 in striated muscle myosins (following T1395 of the Mg SmM sequence), lies between the tail ribbon and segment-2 interactions with the SH3-converter region of the blocked-head motor. A local lack of supercoiling would alter the azimuth of the coiled coil at the SH3-converter, possibly weakening interactions there and thus contributing to the observed instability of the shutdown conformation of these myosins8.
Throughout the tail ribbon, residues are positioned that allow ionic interactions between adjacent segments. The ionic interactions between segments 1 and 3 in the heads region (Fig. 4a, b) are separated by ~720 residues in sequence, corresponding to 107 nm along the coiled coil. This matches a parallel stagger between SmM molecules predicted to favour interaction within thick filaments41 and strongly suggests that the shutdown monomer prevents filament formation by mimicking filament interactions.
Discussion
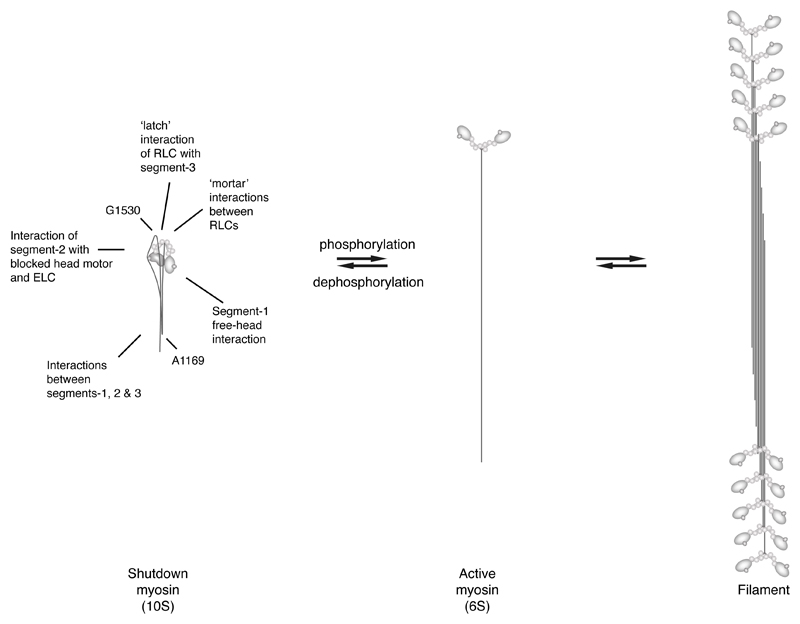
Our structure reveals an unpredicted mechanism by which dephosphorylated RLCs inactivate SmM, and phosphorylation likely disrupts interactions between the RLCs, and between the blocked-head RLC and segment-3 to release myosin from its shutdown state (Extended Data Fig. 7). The interactions of the tail segments with the rest of the molecule are likely important in the invariant conformation of this state. Features such as the well-defined position and structure of bend-2 suggest the binding interfaces depend on sequence-specific recognition and not non-specific electrostatic interactions that could slip position. Extensive interactions with segment-1 in shutdown SmM, not present in the filament IHM, may be responsible for stopping the free head from cycling through ATP at the filament-IHM rate. The inhibited state of heavy meromyosin, which lacks segments-2 and 3, so the latch cannot form, has ~10-fold higher ATPase than full length SmM6. Its structure is more variable suggesting that with fewer constraints its structure breathes more than shutdown myosin8.
Many of the known disease mutations in SmM and non-muscle myosin 2A (Extended Data Fig. 3) are found in regions that are at, or close to, the sites of interaction identified here and could perturb this shutdown state. Given the close agreement between the structure of the IHM in our SmM structure and IHM structures in thick filaments, this structure may also be invaluable as a model for understanding mutations in striated muscle myosins, such as those in β-cardiac myosin that result in hypertrophic cardiomyopathy.
Methods
Protein purification
SmM from turkey gizzard was prepared as described8 and stored in liquid nitrogen. To form the shutdown state, Mg.ATP was added to the SmM, before dilution into a low ionic strength solution. Final conditions were 150 mM KCl, 10 mM MOPS pH 7.2, 0.1 mM EGTA, 2 mM MgCl2, 1 mM ATP.
Grid preparation and cryo-EM data acquisition
Grids were prepared with a Vitrobot Mark IV (Thermo Fisher), applying 3 μl of sample (0.9 μM SmM) to Quantifoil R2/1 carbon Cu 300 mesh grids (Agar Scientific, UK) glow discharged in an amylamine vapour for 30 seconds prior to use (GloCube, Quorum Technologies Ltd., UK). Grids were blotted with Whatman no. 42 Ashless filter paper (Agar Scientific, UK) for 3 seconds at force 6, 8°C and 100% humidity, and flash-frozen in liquid ethane. Data were recorded on a FEI Titan Krios (Astbury Biostructure Laboratory, University of Leeds) operating at 300 kV equipped with a Gatan K2-summit detector and a Bio-quantum energy filter (Gatan, CA, USA). Micrographs were recorded with the EPU automated acquisition software at 130,000x nominal magnification, giving a final object sampling of 1.07 Å/pixel, a total dose of 60 e-/Å2, and a target defocus range between −1.2 – −3.0 μm44. 30,947 micrographs were acquired over 7 microscope sessions.
Cryo-EM image processing
Image processing was carried out using the RELION 3.0 pipeline45 and cryoSPARC v2.246. Drift-corrected averages of each movie were created using RELION’s implementation of MotionCor247 and the defocus of each determined using gCTF48. Particle picking was performed using crYOLO 1.3 49, which was trained to pick particles, centred on the IHM region, for the first data collection (3,576 micrographs). This trained model was used for picking from subsequent data collections. In total, 780,492 particles were extracted in a box size of 352x352 pixels, centred on the IHM region from 29,288 micrographs. Particles were classified using reference-free 2D classification in RELION and classes that contained features reflective of shutdown myosin structure (as compared to negative-stain classes) were selected and taken forward for further classification in both RELION and cryoSPARC. These classes contained 329,910 particles from 28,817 micrographs. Both programs generated a map with a similar final particle number and nominally 6 Å global resolution map. The final 6 Å map was produced using non-uniform refinement in cryoSPARC, which produced the most interpretable density. An initial 3D volume was produced using ab initio reconstruction in cryoSPARC. This model was refined with several rounds of heterogeneous and non-uniform refinement. The EM density map was sharpened using a negative B-factor (Extended Data Table 2) that was automatically determined in cryoSPARC using a Guinier plot. Local resolution was estimated using cryoSPARC.
To obtain a structure of the whole SmM molecule, particles that produced a 6 Å global resolution map of the SmM heads region in RELION 3.0 were re-extracted in a box size of 1152 x 1152 (binned 3-fold into a 384 x 384 box) and subjected to 3D classification without image alignment. This was followed by 3D refinement of the most populated class and post-processing in RELION.
The final resolutions of the SmM shutdown whole molecule map, and of the heads region, were determined using the gold standard Fourier shell correlation reported to FSC = 0.143 using RELION and cryoSPARC respectively. The IHM region map had a global resolution of 6.3 Å and contained 96,351 particles. Resolution in the blocked-head extended to 4 Å. Flexibility of the tail limited global resolution of the whole molecule SmM map to 9 Å, and this contained 52,713 particles. Data acquisition and processing details are provided in Table 1. Figures and videos were generated in UCSF Chimera50 and ChimeraX51.
Model building and refinement
To interpret the 6 Å map, we created a pseudo-atomic model for the myosin heads, by flexibly fitting available crystal structures into the map and performing modelling, refinement and molecular dynamics simulations. The crystal structures were fitted unambiguously into the density, requiring only minor reorientations of subdomains. We used Chimera to initiate model building, by rigid body fitting a pseudo-atomic model of the SmM IHM, kindly supplied by Wulf Blankenfeldt 37, into the EM density. The Blankenfeldt model had been produced using chicken SmM structures for the heavy chain plus ELC (pdb file 1BR1) and a SmM homology model of the skeletal muscle RLC (from pdb file 2MYS), by aligning the ELC (chain C) of 2MYS onto the ELC (chain B) of 1BR1. The ELC from 2MYS had been subsequently deleted and overlapping residues of the heavy chain had been deleted and joined. The model had then been rigid body fitted52 to the 2 nm electron density map of 2D crystals of chicken SmM16.
In the present study, for fitting of the RLCs, RLC from scallop myosin LCD, (pdb file 1WDC) was substituted for 2MYS RLC by aligning the RLCs. This step provided side chain information as 2MYS contains only α-carbons for the RLC. The N-terminal extensions (beginning at S20) were modelled from scallop smooth muscle LCD (3TS5 chain E) by superposition onto Helix A of our RLC models (which began at F26). The overlapping residues were removed and the PDBs were joined. Modeller 9.23 53 was used to replace amino acid sequences for each of the chains with their corresponding turkey sequence (heavy chain: XP_010717783.1, ELC: NP_001290154.1, RLC: XP_010720520.1).
Modeller 9.23 was used to build atomic co-ordinates for loop O (amino acids 451-458) within the motors as there was sufficient electron density pertaining to this region in our map. Atomic co-ordinates for this loop were not defined in 1BR1. Modeller 9.23 was also used to co-ordinate Mg.ADP.AlF4 (from 1BR1), which had been omitted in the Blankenfeldt model, and Mg2+ (from 1WDC). AlF4 was then replaced with inorganic phosphate, as it would exist under our experimental conditions, by superposing the phosphorus atom onto the position of Al, and then deleting the AlF4. The model was then subjected to flexible fitting by use of Flex-EM52.
As a crystal structure is not available for the coiled-coil tail, BeammotifCC, a program kindly supplied by the late Dr Gerald Offer54, was used to model the α-helical coiled-coil structure of the tail. The model generated takes account of the skip residue perturbations of coiled-coil geometry. Chimera was used to rigid body fit the modelled coiled coils to the density where possible. Regions where the straight model coiled coils deviated away from the curved density were selected and rigid body fitted with the flag ‘fit selection only’ to introduce the curves in our tail while maintaining the coiled coil register. Coot55 was used to correct changes introduced in the coiled coil Phi and Psi angles by the rigid body fitting procedure. Segments of the tail were modelled within the IHM region where there was sufficient EM density to show the path of each coiled coil (local resolution better than approximately 10 Å).
The models of the myosin heads and coiled-coil regions were joined at the head-tail junction and each chain defined as follows: Chain A = blocked-head and segment-1 heavy chain; Chain B = Free-head and segment-1 heavy chain; Chain C = blocked-head ELC; Chain D = free-head ELC; Chain E = blocked-head RLC; Chain F = free-head RLC; Chains G and H = the two chains of coiled-coil segments 2 and 3. The model was subjected to real space refinement in Coot55, in which several iterations of manual adjustment followed by real-space refinement in PHENIX56 were implemented57. To identify the contributions of the various polypeptide chains to the cryoEM density map, segmented maps were produced using the segment map function in Chimera58.
To enable interpretation of interactions occurring at contact interfaces we used molecular dynamics simulations performed using the GBSA implicit solvent model in conjunction with the Amber FF14SB force field59. Hydrogen atoms were automatically added with the Leap module in the AMBER package60. The system was then minimised using a steepest descent minimisation followed by a conjugate gradient algorithm and then thermalized, where the temperature is increased in a stepwise manner with the constraining forces slowly moved over the number of steps. Shake61, found within the AMBER package, which constrains bond length, was used to constrain all bonds involving hydrogen atoms with a time step of 2 fs and a 10.0 Å cut-off for non-bonded interactions. For production runs, simulations were run for 3 ns using backbone restraints to allow formation of ionic interactions. The final frame of the simulation was analysed and used as the basis for our pseudo-atomic model. Any ionic interactions that were observed in at least 50 % of the simulation were included within this model which was then subjected to refinement by use of the PDB-REDO web server62 and this resulted in our pseudo-atomic model. Stereochemistry of our model was assessed by Molprobity58.
To generate the full length SmM pseudo-atomic model, beammotifCC56 was used to generate three model coiled-coil segments for the missing tail sequences (up to K1933) which each contained 14 residues that overlapped the tail sequences of segments 1, 2 and 3 of our pseudo-atomic model of the IHM region. These models were superposed onto the existing coiled-coil tail segments and then the ‘fit selection only’ flag was used in rigid body fitting as described above to our 9 Å map of the whole SmM shutdown molecule. This allowed the introduction of the bends into the coiled-coil tail and for them to lie in plane as seen in the density map. With segments 1 and 2 lying antiparallel to one another, the point where their sequences coincided was found to occur at A1169, so bend-1 was created at this point. The chains were joined and duplicated sequence was deleted followed by manual refinement in Coot. The junction made between segments 1 and 2 at bend-1 implies that in segments 2 and 3, chain G is a continuation of chain A and chain H is a continuation of chain B. The coiled-coil model fits the density map of segment-1 and segment-3 well, including around skip 2, (Q1592; Fig 1c), suggesting it is a reasonable model of the structure of the entire coiled-coil tail.
Finally, Young’s modulus of the tail ribbon, was calculated as described previously8.
Extended Data
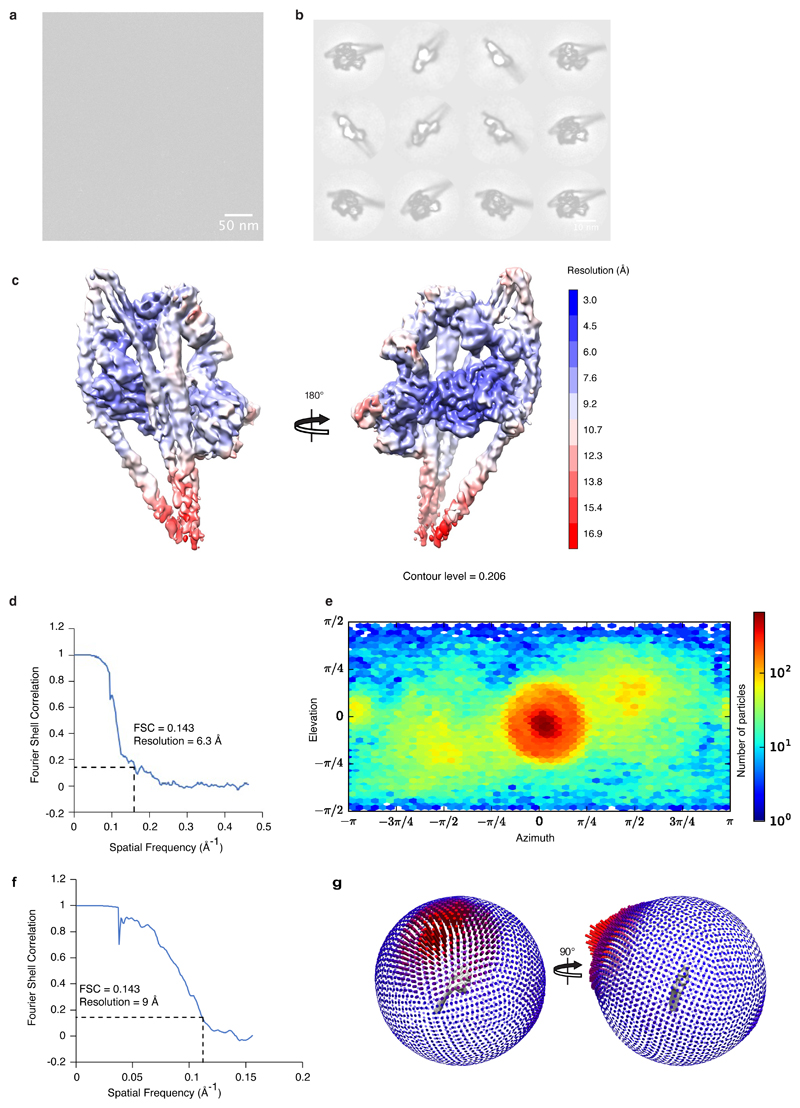
Extended Data Figure 1. Micrograph, 2-D classification, angular distribution and resolution parameters.
a, Representative micrograph of shutdown SmM molecules from 28,817 micrographs. Scale bar 50 nm. b, Representative 2D classes (representing approximately 25% of particles that contributed to the final reconstruction). Scale bar 10 nm. c, Local resolution of SmM shutdown heads region cryoEM map. d, FSC curve of the heads region reconstruction, illustrating 6.3 Å resolution at 0.143 FSC. e, Angular distribution of particles in the heads region 3D reconstruction. f, FSC curve of the whole molecule reconstruction. g, Angular distribution of particles contributing to the whole molecule 3D reconstruction.
Extended Data Figure 2. Interaction of segment-3 with blocked-head RLC and analysis of RLC photo-crosslink.
a, Segmented map highlighting latch and mortar regions (boxed), which are shown in more detail in panels b and c respectively. The position of phosphorylated serine (S20) in the latch (b) and in the mortar (c) are shown. This illustrates how phosphorylation would disrupt latch-segment-3 and mortar-RLC interactions respectively. d, Segmented map showing region of interest for panels e-g. e, ionic interactions between segment-3 and blocked-head RLC inter-lobe linker and blocked-head heavy chain. f, Hydrophobic interface where segment-3 crosses the blocked head RLC. g, Same view as e and f showing photo-crosslinker benzophenone-4-acetamide attached to C109 of blocked-head RLC and in close proximity to the aliphatic side chain of K1579 of segment 3 chain H. K1579 lies within crosslinked peptide L1554-E1583 42. h, Segmented map (face view) to show the location (boxed) of i, which shows an alternative view of photo-crosslinker interaction and the ionic interaction between blocked head RLC E112 and segment 3 R1584. For clarity the non-involved chain of the coiled coil has been omitted in the close-up panels.
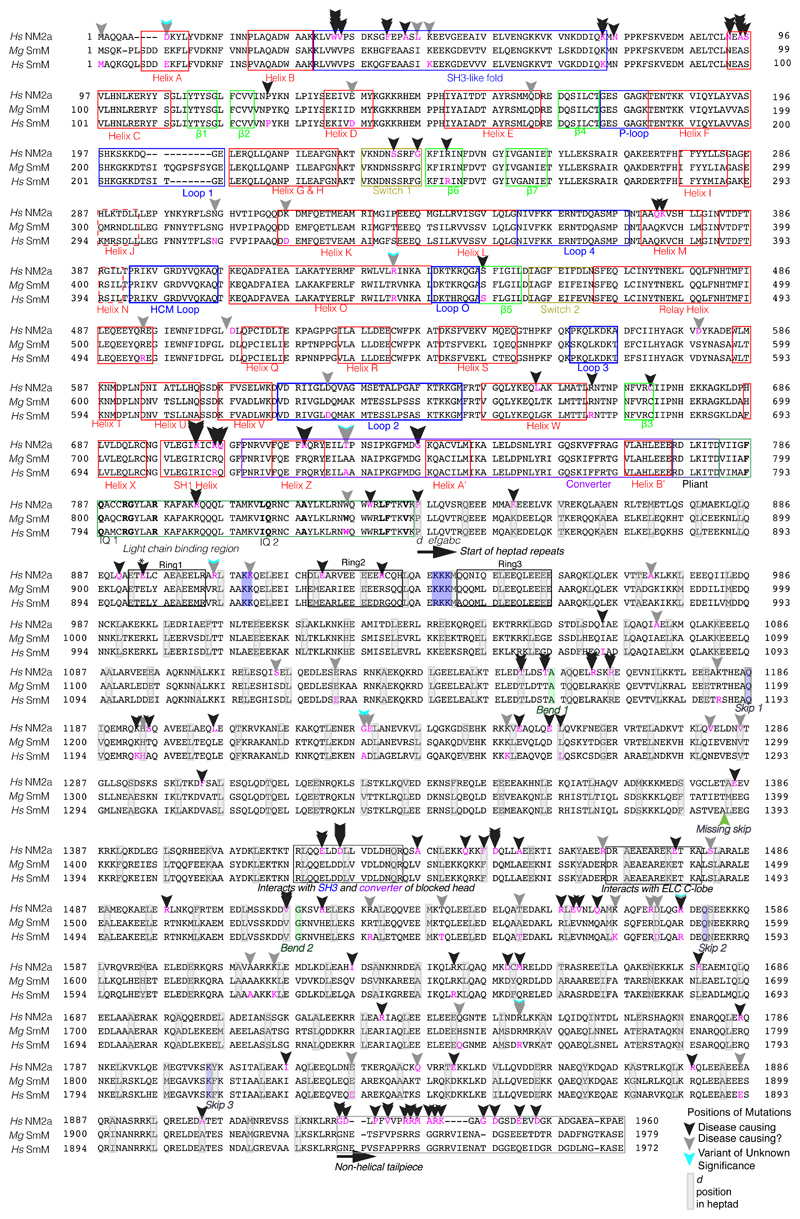
Extended Data Figure 3. Annotated sequence alignment of heavy chains of human non-muscle myosin 2A (NM2A) and smooth muscle myosin (SmM) with Turkey SmM, showing sites of mutation.
HsNM2A: Homo sapiens MYH9; MgSmM: Meleagris gallopavo MYH11; HsSmM: Homo sapiens MYH11. Boxes delimit structural features. Grey background identifies residues in the d position of the coiled coil heptad repeat. Skip residues and bend positions are highlighted. Arrowheads and magenta letters denote known sites of mutation, obtained from the Human Genome Mutation Database (HGMD), Variant of unknown significance: retrieved from the Leiden mutation database.
Extended Data Figure 4. Comparisons of IHM pseudo-atomic models, free- and blocked-heads and the SAH-domain character of start of segment-1.
a-f, Comparison of pseudo-atomic models of the IHM with LCs omitted to allow comparison of LCD heavy-chain structure. a, Pseudo-atomic model of SmM from the present study. b, Model (PDB id 1I84) produced from SmM heavy meromyosin IHM 2D crystal 20Å map7; tentative assignment of tail omitted. c, Model (PDB id 3JBH) produced from IHM of tarantula thick filament 20Å map40, fitted with tarantula sequence. d, Model (PDB id 5TBY) proposed for human cardiac IHM by homology modelling the cardiac amino acid sequences on the tarantula model14. e, Model (downloaded from Spudich lab website as MS01.pdb) of human cardiac myosin IHM (produced by use of homology models fitted to tarantula IHM model 3DTP15). f, Model (downloaded as Supplementary Data 2) for cardiac IHM produced by use of a cardiac motor domain-ELC crystal structure (5N69) and homology model of RLC fitted into the tarantula thick filament IHM 20Å map31. g, Superposition of free- and blocked-head motors (up until pliant region) showing how the LCD regions differ between the heads (without light chains shown), segmented maps and model for motor domains shown. h, Blocked-head motor, model in map, i morph between blocked-head and free-head model and maps (shown without light chains), j Free-head model in map. Map contour level 0.28 (Supplementary Video 3). k, SmM heavy-chain sequence at the start of the predicted coiled coil. Coiled-coil seam a and d residues marked by grey stripes; acidic residues red, basic residues blue. i, Heptad net projection of sequence 35 in which the dashed line shows the path of the polypeptide backbone as α-helix, circles and squares indicate the a and d positions of the heptad repeat and every seventh residue is repeated (in brackets) to allow all ionic interactions to be mapped.
Extended Data Figure 5. Interaction between loop 2 (blocked-head motor) and segment-1, the motor-motor interface of the IHM and fit of the SmM IHM structure into filament cryoEM density maps for tarantula and cardiac myosin filaments.
a-b, EM density map reveals an interaction interface between segment-1 and density attributable to the blocked-head motor loop 2 (dashed line). E913 in segment-1 is highlighted for reference. Map contour level 0.17. c. Overall model to show region of interest, the motor-motor interface (boxed). d, Ionic interactions across this interface, involving Helix N and HCM loop of the blocked-head motor with 3 successive residues (168-170) close to Helix E in the free-head motor (Supplementary Video 5). e, The same region of interest from a recent cardiac IHM pseudo-atomic model15. f, Superimposition of the motor domains for our structure, and for the cardiac IHM pseudo-atomic model15 aligned on the free-head (red/pink) with view as in d. The blocked head of the cardiac IHM (cyan) is rotated counter-clockwise compared to that for SmM (blue) g, h, Fit of the paired heads of the pseudo-atomic model of shutdown SmM into the IHM motifs of reconstructions of thick filaments, using Chimera. The filament axis is vertical and the filament tip is at the top of the page. g, The fit to 20 Å map of tarantula thick filaments, EMD-195043, contour level 28.6). h. The fit to 28 Å map of cardiac thick filaments (EMD-2240 14, contour level 0.14).
Extended Data Figure 6. Flexibility of SmM tail ribbon.
a, Representative class averages showing flexibility of the tail of myosin molecules (Supplementary Video 7), after alignment of the heads. Numbers at lower left indicate the chord angle of the tail at a position 29.7 nm along the tail from its emergence point from the head (taken to be the fulcrum). The angle is defined in relation to the path of the tail between bend-2 and the fulcrum, see the cartoon at the right. 4895 face view particles were classified into 50 classes of which 5 are shown to represent the range of motion of the tail. b, Cumulative frequency plot of tail angles for myosin with fitted Gaussian curve, yielding a variance value of 34°. Scale bar in a: 20 nm.
Extended Data Figure 7.
Diagram to show the dynamic relationship of the shutdown state (10S) to the open ‘active’ state (6S) and filament assembly. The shutdown state and filaments can both compete for 6S.
Extended Data Table 1.
Putative residues for stabilising ionic interactions between regions of the myosin molecule. Colour of letters corresponds to that of Figure 1. Chain A = blocked-head heavy chain and segment-1, Chain B = free-head heavy chain and segment-1, Chain C = blocked head ELC, Chain D = free-head ELC, Chain E = blocked head RLC, Chain F = free-head RLC, Chains G and H = the two chains of coiled-coil segments 2 and 3
| Location on myosin | Residue | Counterpart | Location on myosin |
|---|---|---|---|
| Blocked Head SH3 domain (residues 33-77) and helix C (residues 96-110), chain A |
Asp55
Lys77 |
Lys1423
Glu1434 |
Segment-2, chain G |
| Blocked Head SH1-helix (residues 710-719) and Converter (residues 722-788), chain A |
Arg718
Glu761 Glu761 Arg777 |
Asp1437
Lys1454 Lys1457 Asp1443 |
Segment-2, chain G |
| Blocked Head ELC, chain C |
Glu47
Lys50 Lys50 Glu68 |
Arg1485
Asp1478 Glu1481 Arg1496 |
Segment-2, chain H |
| Segment-2, chain H Close to bend 2 |
Glu1518
Glu1518 Asp1521 Asp1521 |
Lys1538
Arg1541 Lys1540 Arg1541 |
Segment-3, chain G Close to bend 2 |
| Blocked Head Loop O, chain A |
Lys454
Arg455 |
Glu1595
Glu1610 |
Segment-3, chain H |
| Free Head Loop O, chain B |
Lys454 | Glu907 | Segment-1, chain A (Ring 1) |
| Free Head Loop 2, chain H |
Asp627
Asp629 Arg630 |
Arg918
Lys922 Glu925 |
Segment-1, chain A |
| Free Head HCM loop |
Arg411
Arg411 |
Glu938
Glu941 |
Segment-1, chain B (Ring 2) |
| Segment-3, chain G |
Lys1626
Lys1633 Lys1633 Glu1636 Asp1640 Asp1640 Lys1644 |
Glu907
Glu907 Glu914 Arg918 Arg918 Lys922 Glu925 |
Segment-1, chain B R1:E905-R916 R2:E932-Q946 R3:A955-E969 |
| Segment-3, chain G |
Lys1651
Lys1655 |
Glu934
Glu941 |
Segment-1, chain A (Ring 2) |
| Free Head loop between helix E and β4, |
Arg168 | Asp397 | Blocked Head helix M, chain A |
|
Glu169
Glu169 |
Arg400
Arg406 |
Blocked Head Helix N, HCM loop |
|
| Free Head β4, |
Asp170 | Arg406 | Blocked head HCM loop, |
| Blocked Head RLC/LCD |
Asp98
Arg827 Glu112 |
Arg1570
Asp1566 Arg1584 |
Segment-3, chain H |
Extended Data Table 2. Cryo-EM data collection, refinement and validation statistics.
Cryo-EM data collection, refinement and validation statistics
| SmM Shutdown Heads Region (EMD-11069) (PDB 6Z47) |
SmM Shutdown Whole Molecule (EMD-11070) |
|
|---|---|---|
| Data collection and processing | ||
| Microscope | FEI Titan KRIOS | FEI Titan KRIOS |
| Detector | GATAN K2 | GATAN K2 |
| Voltage (keV) | 300 | 300 |
| Magnification | x 130,000 | x 130,000 |
| Total electron exposure (e–/Å2) | 60 | 60 |
| Exposure time (s) | 8 | 8 |
| Electron exposure per frame (e-/Å2) | 1.5 | 1.5 |
| Defocus range (μm) | -1.5 to -3.5 | -1.5 to -3.5 |
| Pixel size (Å) | 1.07 | 1.07 (3.21 for processing) |
| Symmetry imposed | C1 | C1 |
| Initial particle images (no.) | 329,910 | 90,914 |
| Final particle images (no.) | 96,351 | 52,713 |
| Map resolution (Å) | 6.3 | 9.0 |
| FSC threshold | 0.143 | 0.143 |
| Map resolution range (Å) | 2.9-12 | |
| Refinement | ||
| Initial model used (PDB code) | 1BR1, 2MYS, 1WDC, 3TS5 and beammotifCC | |
| Map sharpening B factor (Å2) | -362 | |
| Model composition | ||
| Non-hydrogen atoms | 23399 | |
| Protein residues | 2877 | |
| Ligands | 8 | |
| R.M.S.D from ideal geometry | ||
| Bond lengths (Å) | 0.007 | |
| Bond angles (°) | 1.062 | |
| Validation | ||
| MolProbity score | 1.23 | |
| Clashscore | 1.43 | |
| Poor rotamers (%) | 1.38 | |
| Ramachandran plot statistics | ||
| Favored (%) | 96.33 | |
| Allowed (%) | 3.42 | |
| Disallowed (%) | 0.24 | |
Supplementary Material
Acknowledgements
We thank staff at the Astbury Biostructure Laboratory, UoL, for their support, namely Dr Rebecca Thompson for advice regarding cryo-EM grid preparation and Dr Dan Maskell for image acquisition. We thank members of the CryoEM community at Leeds, for their help and guidance, particularly Dr Matthew Byrne for advice on structure validation. This work was supported by the Medical Research Council (grant numbers MR/S023593/1 to MP and MR/R009406/1 to MP and NAR) and by the Wellcome Trust (WT 094231/Z/10/Z to PJK, MP and NAR). The FEI Titan Krios microscopes were funded by the University of Leeds (UoL ABSL award) and Wellcome Trust (108466/Z/15/Z).
Footnotes
Author Contributions M.P. & N.A.R. designed the project. J.C. purified smooth muscle myosin. C.S., D.C-M. and M.P. performed cryoEM grid screening and optimisation. C.S. and D.C-M. prepared cryoEM grids for data collection and recorded data. C.S., G.C. and D. C-M analysed and processed the data. G.C. and D.C-M. and C.S. built the model. G.C. performed molecular dynamic simulations. C.S., G.C., D.C-M., M.P., and P.J.K, interpreted the data and the model. M.P managed the project. M.P., P.J.K, and C.S. wrote the manuscript. All authors discussed the results and commented on the manuscript.
Competing Interests. The authors declare no competing financial interests.
Data Availability
The electron density maps for the SmM shutdown heads region and whole molecule have been deposited into EMDB, with accession codes EMD-11069 and EMD-11070 respectively. The pseudo-atomic model of the SmM shutdown heads region has been deposited in the PDB, with accession code 6Z47. The following models were used for comparison purposes in our study: PDB 1I84, PDB 3JBH, PDB 5TBY, cardiac IHM model MS01 (http://spudlab.stanford.edu/homology-models) and cardiac IHM model SD2 Robert-Paganin et al., (2018).
References
- 1.Lee KH, et al. Interacting-heads motif has been conserved as a mechanism of myosin II inhibition since before the origin of animals. Proc Natl Acad Sci U S A. 2018;115:E1991–E2000. doi: 10.1073/pnas.1715247115. [DOI] [PMC free article] [PubMed] [Google Scholar]
- 2.Cross RA, Cross KE, Sobieszek A. ATP-linked monomer-polymerequilibrium of smooth muscle myosin: the free folded monomer traps ADP.Pi. EMBO J. 1986;5:2637–2641. doi: 10.1002/j.1460-2075.1986.tb04545.x. doi:j.1460-2075.1986.tb04545.x. [DOI] [PMC free article] [PubMed] [Google Scholar]
- 3.McLachlan AD, Karn J. Periodic charge distributions in the myosin rod amino acid sequence match cross-bridge spacings in muscle. Nature. 1982;299:226–231. doi: 10.1038/299226a0. [DOI] [PubMed] [Google Scholar]
- 4.Craig R, Smith R, Kendrick-Jones J. Light-chain phosphorylation controls the conformation of vertebrate non-muscle and smooth muscle myosin molecules. Nature. 1983;302:436–439. doi: 10.1038/302436a0. [DOI] [PubMed] [Google Scholar]
- 5.Ikebe M, Hartshorne DJ, Elzinga M. Identification, phosphorylation, and dephosphorylation of a second site for myosin light chain kinase on the 20,000-dalton light chain of smooth muscle myosin. J Biol Chem. 1986;261:36–39. [PubMed] [Google Scholar]
- 6.Cross RA, Jackson AP, Citi S, Kendrick-Jones J, Bagshaw CR. Active site trapping of nucleotide by smooth and non-muscle myosins. J Mol Biol. 1988;203:173–181. doi: 10.1016/0022-2836(88)90100-3. [DOI] [PubMed] [Google Scholar]
- 7.Wendt T, Taylor D, Trybus KM, Taylor K. Three-dimensional image reconstruction of dephosphorylated smooth muscle heavy meromyosin reveals asymmetry in the interaction between myosin heads and placement of subfragment 2. Proc Natl Acad Sci U S A. 2001;98:4361–4366. doi: 10.1073/pnas.071051098. [DOI] [PMC free article] [PubMed] [Google Scholar]
- 8.Burgess SA, et al. Structures of smooth muscle myosin and heavy meromyosin in the folded, shutdown state. J Mol Biol. 2007;372:1165–1178. doi: 10.1016/j.jmb.2007.07.014. [DOI] [PubMed] [Google Scholar]
- 9.Jung HS, Komatsu S, Ikebe M, Craig R. Head-head and head-tail interaction: a general mechanism for switching off myosin II activity in cells. Mol Biol Cell. 2008;19:3234–3242. doi: 10.1091/mbc.E08-02-0206. [DOI] [PMC free article] [PubMed] [Google Scholar]
- 10.Sellers JR. Regulation of cytoplasmic and smooth muscle myosin. Curr Opin Cell Biol. 1991;3:98–104. doi: 10.1016/0955-0674(91)90171-t. [DOI] [PubMed] [Google Scholar]
- 11.Woodhead JL, et al. Atomic model of a myosin filament in the relaxed state. Nature. 2005;436:1195–1199. doi: 10.1038/nature03920. [DOI] [PubMed] [Google Scholar]
- 12.Naber N, Cooke R, Pate E. Slow myosin ATP turnover in the super-relaxed state in tarantula muscle. J Mol Biol. 2011;411:943–950. doi: 10.1016/j.jmb.2011.06.051. [DOI] [PMC free article] [PubMed] [Google Scholar]
- 13.Stewart MA, Franks-Skiba K, Chen S, Cooke R. Myosin ATP turnover rate is a mechanism involved in thermogenesis in resting skeletal muscle fibers. Proc Natl Acad Sci U S A. 2010;107:430–435. doi: 10.1073/pnas.0909468107. [DOI] [PMC free article] [PubMed] [Google Scholar]
- 14.Alamo L, et al. Effects of myosin variants on interacting-heads motif explain distinct hypertrophic and dilated cardiomyopathy phenotypes. Elife. 2017;6 doi: 10.7554/eLife.24634. [DOI] [PMC free article] [PubMed] [Google Scholar]
- 15.Nag S, et al. The myosin mesa and the basis of hypercontractility caused by hypertrophic cardiomyopathy mutations. Nat Struct Mol Biol. 2017;24:525–533. doi: 10.1038/nsmb.3408. [DOI] [PMC free article] [PubMed] [Google Scholar]
- 16.Liu J, Wendt T, Taylor D, Taylor K. Refined model of the 10S conformation of smooth muscle myosin by cryo-electron microscopy 3D image reconstruction. J Mol Biol. 2003;329:963–972. doi: 10.1016/s0022-2836(03)00516-3. [DOI] [PubMed] [Google Scholar]
- 17.Jung HS, et al. Role of the tail in the regulated state of myosin 2. J Mol Biol. 2011;408:863–878. doi: 10.1016/j.jmb.2011.03.019. [DOI] [PMC free article] [PubMed] [Google Scholar]
- 18.Ikebe M, et al. Function of the NH2-terminal domain of the regulatory light chain on the regulation of smooth muscle myosin. J Biol Chem. 1994;269:28173–28180. [PubMed] [Google Scholar]
- 19.Kast D, Espinoza-Fonseca LM, Yi C, Thomas DD. Phosphorylation-induced structural changes in smooth muscle myosin regulatory light chain. Proc Natl Acad Sci U S A. 2010;107:8207–8212. doi: 10.1073/pnas.1001941107. [DOI] [PMC free article] [PubMed] [Google Scholar]
- 20.Persechini A, Hartshorne DJ. Phosphorylation of smooth muscle myosin: evidence for cooperativity between the myosin heads. Science. 1981;213:1383–1385. doi: 10.1126/science.6455737. [DOI] [PubMed] [Google Scholar]
- 21.Persechini A, Hartshorne DJ. Ordered phosphorylation of the two 20 000 molecular weight light chains of smooth muscle myosin. Biochemistry. 1983;22:470–476. doi: 10.1021/bi00271a033. [DOI] [PubMed] [Google Scholar]
- 22.Ikebe M, Ogihara S, Tonomura Y. Nonlinear dependence of actin-activated Mg2+-ATPase activity on the extent of phosphorylation of gizzard myosin and H-meromyosin. J Biochem. 1982;91:1809–1812. doi: 10.1093/oxfordjournals.jbchem.a133874. [DOI] [PubMed] [Google Scholar]
- 23.Collins JH. Myoinformatics report: myosin regulatory light chain paralogs in the human genome. J Muscle Res Cell Motil. 2006;27:69–74. doi: 10.1007/s10974-006-9057-6. [DOI] [PubMed] [Google Scholar]
- 24.Kamm KE, Stull JT. Signaling to myosin regulatory light chain in sarcomeres. J Biol Chem. 2011;286:9941–9947. doi: 10.1074/jbc.R110.198697. [DOI] [PMC free article] [PubMed] [Google Scholar]
- 25.Bury L, et al. Next-generation sequencing for the diagnosis of MYH9-RD: Predicting pathogenic variants. Hum Mutat. 2020;41:277–290. doi: 10.1002/humu.23927. [DOI] [PMC free article] [PubMed] [Google Scholar]
- 26.Harakalova M, et al. Incomplete segregation of MYH11 variants with thoracic aortic aneurysms and dissections and patent ductus arteriosus. Eur J Hum Genet. 2013;21:487–493. doi: 10.1038/ejhg.2012.206. [DOI] [PMC free article] [PubMed] [Google Scholar]
- 27.Kanematsu T, et al. A case of MYH9 disorders caused by a novel mutation (p.K74E) Ann Hematol. 2016;95:161–163. doi: 10.1007/s00277-015-2506-9. [DOI] [PubMed] [Google Scholar]
- 28.Zaninetti C, et al. MYH9-Related Thrombocytopenia: Four Novel Variants Affecting the Tail Domain of the Non-Muscle Myosin Heavy Chain IIA Associated with a Mild Clinical Evolution of the Disorder. Hamostaseologie. 2019;39:87–94. doi: 10.1055/s-0038-1645840. [DOI] [PubMed] [Google Scholar]
- 29.Yang S, et al. The central role of the tail in switching off 10S myosin II activity. J Gen Physiol. 2019;151:1081–1093. doi: 10.1085/jgp.201912431. [DOI] [PMC free article] [PubMed] [Google Scholar]
- 30.Yang Y, et al. Rigor-like structures from muscle myosins reveal key mechanical elements in the transduction pathways of this allosteric motor. Structure. 2007;15:553–564. doi: 10.1016/j.str.2007.03.010. [DOI] [PubMed] [Google Scholar]
- 31.Alamo L, et al. Three-dimensional reconstruction of tarantula myosin filaments suggests how phosphorylation may regulate myosin activity. J Mol Biol. 2008;384:780–797. doi: 10.1016/j.jmb.2008.10.013. [DOI] [PMC free article] [PubMed] [Google Scholar]
- 32.Robert-Paganin J, Auguin D, Houdusse A. Hypertrophic cardiomyopathy disease results from disparate impairments of cardiac myosin function and auto-inhibition. Nat Commun. 2018;9:4019. doi: 10.1038/s41467-018-06191-4. [DOI] [PMC free article] [PubMed] [Google Scholar]
- 33.Dominguez R, Freyzon Y, Trybus KM, Cohen C. Crystal structure of a vertebrate smooth muscle myosin motor domain and its complex with the essential light chain: visualization of the pre-power stroke state. Cell. 1998;94:559–571. doi: 10.1016/s0092-8674(00)81598-6. [DOI] [PubMed] [Google Scholar]
- 34.Burgess S, et al. The prepower stroke conformation of myosin V. J Cell Biol. 2002;159:983–991. doi: 10.1083/jcb.200208172. [DOI] [PMC free article] [PubMed] [Google Scholar]
- 35.Batchelor M, et al. Myosin tails and single alpha-helical domains. Biochem Soc Trans. 2015;43:58–63. doi: 10.1042/BST20140302. [DOI] [PubMed] [Google Scholar]
- 36.Wolny M, et al. Stable single alpha-helices are constant force springs in proteins. J Biol Chem. 2014;289:27825–27835. doi: 10.1074/jbc.M114.585679. [DOI] [PMC free article] [PubMed] [Google Scholar]
- 37.Blankenfeldt W, Thomä NH, Wray JS, Gautel M, Schlichting I. Crystal structures of human cardiac β-myosin II S2-Δ provide insight into the functional role of the S2 subfragment. Proc Natl Acad Sci U S A. 2006;103:17713–17717. doi: 10.1073/pnas.0606741103. [DOI] [PMC free article] [PubMed] [Google Scholar]
- 38.Behrmann E, et al. Structure of the rigor actin-tropomyosin-myosin complex. Cell. 2012;150:327–338. doi: 10.1016/j.cell.2012.05.037. [DOI] [PMC free article] [PubMed] [Google Scholar]
- 39.Woodhead JL, Craig R. The mesa trail and the interacting heads motif of myosin II. Arch Biochem Biophys. 2020;680:108228. doi: 10.1016/j.abb.2019.108228. [DOI] [PMC free article] [PubMed] [Google Scholar]
- 40.Alamo L, et al. Conserved Intramolecular Interactions Maintain Myosin Interacting-Heads Motifs Explaining Tarantula Muscle Super-Relaxed State Structural Basis. J Mol Biol. 2016;428:1142–1164. doi: 10.1016/j.jmb.2016.01.027. [DOI] [PMC free article] [PubMed] [Google Scholar]
- 41.Straussman R, Squire JM, Ben-Ya’acov A, Ravid S. Skip residues and charge interactions in myosin II coiled-coils: implications for molecular packing. J Mol Biol. 2005;353:613–628. doi: 10.1016/j.jmb.2005.08.010. [DOI] [PubMed] [Google Scholar]
- 42.Olney JJ, Sellers JR, Cremo CR. Structure and function of the 10 S conformation of smooth muscle myosin. J Biol Chem. 1996;271:20375–20384. doi: 10.1074/jbc.271.34.20375. [DOI] [PubMed] [Google Scholar]
- 43.Brito R, et al. A molecular model of phosphorylation-based activation and potentiation of tarantula muscle thick filaments. J Mol Biol. 2011;414:44–61. doi: 10.1016/j.jmb.2011.09.017. [DOI] [PMC free article] [PubMed] [Google Scholar]
- 44.Thompson RF, Iadanza MG, Hesketh EL, Rawson S, Ranson NA. Collection, pre-processing and on-the-fly analysis of data for high-resolution, single-particle cryo-electron microscopy. Nature Protocols. 2019;14:100–118. doi: 10.1038/s41596-018-0084-8. [DOI] [PMC free article] [PubMed] [Google Scholar]
- 45.Fernandez-Leiro R, Scheres SHW. A pipeline approach to single-particle processing in RELION. Acta Crystallographica Section D. 2017;73:496–502. doi: 10.1107/S2059798316019276. [DOI] [PMC free article] [PubMed] [Google Scholar]
- 46.Punjani A, Rubinstein JL, Fleet DJ, Brubaker MA. cryoSPARC: algorithms for rapid unsupervised cryo-EM structure determination. Nature Methods. 2017;14:290–296. doi: 10.1038/nmeth.4169. [DOI] [PubMed] [Google Scholar]
- 47.Zheng SQ, et al. MotionCor2: anisotropic correction of beam-induced motion for improved cryo-electron microscopy. Nature Methods. 2017;14:331. doi: 10.1038/nmeth.4193. [DOI] [PMC free article] [PubMed] [Google Scholar]
- 48.Zhang K. Gctf: Real-time CTF determination and correction. Journal of Structural Biology. 2016;193:1–12. doi: 10.1016/j.jsb.2015.11.003. [DOI] [PMC free article] [PubMed] [Google Scholar]
- 49.Wagner T, et al. SPHIRE-crYOLO is a fast and accurate fully automated particle picker for cryo-EM. Communications Biology. 2019;2:218. doi: 10.1038/s42003-019-0437-z. [DOI] [PMC free article] [PubMed] [Google Scholar]
- 50.Pettersen EF, et al. UCSF Chimera—A visualization system for exploratory research and analysis. Journal of Computational Chemistry. 2004;25:1605–1612. doi: 10.1002/jcc.20084. [DOI] [PubMed] [Google Scholar]
- 51.Goddard TD, et al. UCSF ChimeraX: Meeting modern challenges in visualization and analysis. Protein Sci. 2018;27:14–25. doi: 10.1002/pro.3235. [DOI] [PMC free article] [PubMed] [Google Scholar]
- 52.Topf M, et al. Protein Structure Fitting and Refinement Guided by Cryo-EM Density. Structure. 2008;16:295–307. doi: 10.1016/j.str.2007.11.016. [DOI] [PMC free article] [PubMed] [Google Scholar]
- 53.Webb B, Sali A. Comparative Protein Structure Modeling Using MODELLER. Curr Protoc Bioinformatics. 2016;54:5 6 1–5 6 37. doi: 10.1002/cpbi.3. [DOI] [PMC free article] [PubMed] [Google Scholar]
- 54.Offer G, Hicks MR, Woolfson DN. Generalized Crick equations for modeling noncanonical coiled coils. J Struct Biol. 2002;137:41–53. doi: 10.1006/jsbi.2002.4448. [DOI] [PubMed] [Google Scholar]
- 55.Emsley P, Lohkamp B, Scott WG, Cowtan K. Features and development of Coot. Acta Crystallogr D Biol Crystallogr. 2010;66:486–501. doi: 10.1107/S0907444910007493. [DOI] [PMC free article] [PubMed] [Google Scholar]
- 56.Afonine PV, et al. Towards automated crystallographic structure refinement with phenix.refine. Acta Crystallogr D Biol Crystallogr. 2012;68:352–367. doi: 10.1107/S0907444912001308. [DOI] [PMC free article] [PubMed] [Google Scholar]
- 57.Chen VB, et al. MolProbity: all-atom structure validation for macromolecular crystallography. Acta Crystallogr D Biol Crystallogr. 2010;66:12–21. doi: 10.1107/S0907444909042073. [DOI] [PMC free article] [PubMed] [Google Scholar]
- 58.Pintilie GD, Zhang J, Goddard TD, Chiu W, Gossard DC. Quantitative analysis of cryo-EM density map segmentation by watershed and scale-space filtering, and fitting of structures by alignment to regions. J Struct Biol. 2010;170:427–438. doi: 10.1016/j.jsb.2010.03.007. [DOI] [PMC free article] [PubMed] [Google Scholar]
- 59.Maier JA, et al. ff14SB: Improving the Accuracy of Protein Side Chain and Backbone Parameters from ff99SB. J Chem Theory Comput. 2015;11:3696–3713. doi: 10.1021/acs.jctc.5b00255. [DOI] [PMC free article] [PubMed] [Google Scholar]
- 60.Case DA, B K, Ben-Shalom IY, Brozell SR, Cerutti DS, Cheatham TE, III, Cruzeiro VWD, Darden TA, Duke RE, Giambasu G, Gilson MK, et al. Amber 2020. University of California; San Francisco: 2020. [Google Scholar]
- 61.Ryckaert J-P, Ciccotti G, Berendsen H. Numerical integration of the cartesian equations of motion of a system with constraints: Molecular dynamics of n-alkanes. J Comput Phys. 1977;23:327–341. [Google Scholar]
- 62.Joosten RP, Long F, Murshudov GN, Perrakis A. The PDB_REDO server for macromolecular structure model optimization. IUCrJ. 2014;1:213–220. doi: 10.1107/S2052252514009324. [DOI] [PMC free article] [PubMed] [Google Scholar]
Associated Data
This section collects any data citations, data availability statements, or supplementary materials included in this article.
Supplementary Materials
Data Availability Statement
The electron density maps for the SmM shutdown heads region and whole molecule have been deposited into EMDB, with accession codes EMD-11069 and EMD-11070 respectively. The pseudo-atomic model of the SmM shutdown heads region has been deposited in the PDB, with accession code 6Z47. The following models were used for comparison purposes in our study: PDB 1I84, PDB 3JBH, PDB 5TBY, cardiac IHM model MS01 (http://spudlab.stanford.edu/homology-models) and cardiac IHM model SD2 Robert-Paganin et al., (2018).


