Summary
Recent developments in high-throughput reverse genetics 1,2 have revolutionized our ability to map gene function and interactions 3–6 . The power of these approaches lies on their ability to discover functionally-associated genes, which elicit similar phenotypic changes across multiple perturbations (chemical, environmental, or genetic) when knocked out 7–9 . However, due to the large number of perturbations, these approaches have been limited to growth or morphological readouts 10 . Here, we have used a high-content biochemical readout, thermal proteome profiling 11 , to measure proteome-wide abundance and thermal stability of 121 genetic perturbations in Escherichia coli. We observed that thermal stability, and therefore the state and interactions of essential proteins is commonly modulated, opening up the possibility to study a protein group that is particularly inaccessible to genetics. We show that functionally-associated proteins have coordinated abundance and thermal stability changes across perturbations, due to their co-regulation and physical interactions (with proteins, metabolites, or co-factors). Finally, we provide mechanistic insights into previously determined growth phenotypes 12 that go beyond the deleted gene. These data, available at http://ecoliTPP.shiny.embl.de, represent a rich resource for inferring protein functions and interactions.
Understanding the function of genes is one of the main goals of molecular biology. While genetic approaches provide insights into protein function and interactions, biochemical readouts bring us closer to their molecular mechanism. Mass spectrometry (MS) has enabled a view of the entire proteome and, when coupled with traditional biochemistry tools, such as affinity purification 13 or size exclusion chromatography 14 , it can directly detect protein-protein interactions. While powerful, these approaches are performed after cell lysis, which can alter the protein environment and interactions 15 . Recently, we have developed thermal proteome profiling (TPP) 11 , which couples the cellular thermal shift assay (CETSA) 16 with multiplexed quantitative proteomics 17 . Protein thermal stability offers new insights into protein state in situ 18 , since it reflects interactions with metabolites 19 , other proteins 15,20,21 , and nucleic acids 21 , and post-translational make-up 22–24 . Here, we combine reverse genetics with TPP in Escherichia coli to profile the effect of genetic perturbations on protein abundance and thermal stability.
High-throughput thermal proteome profiling
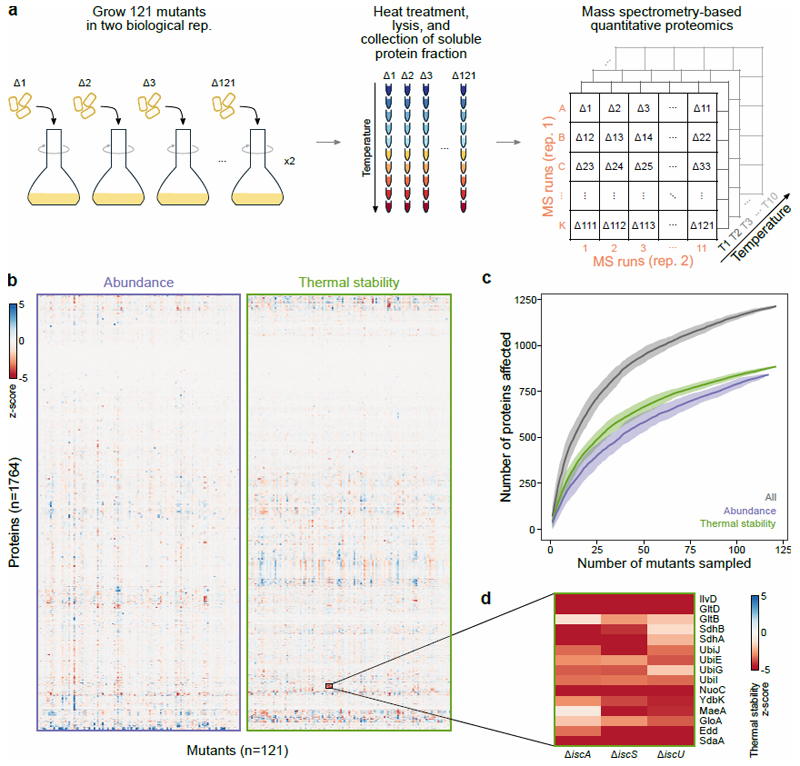
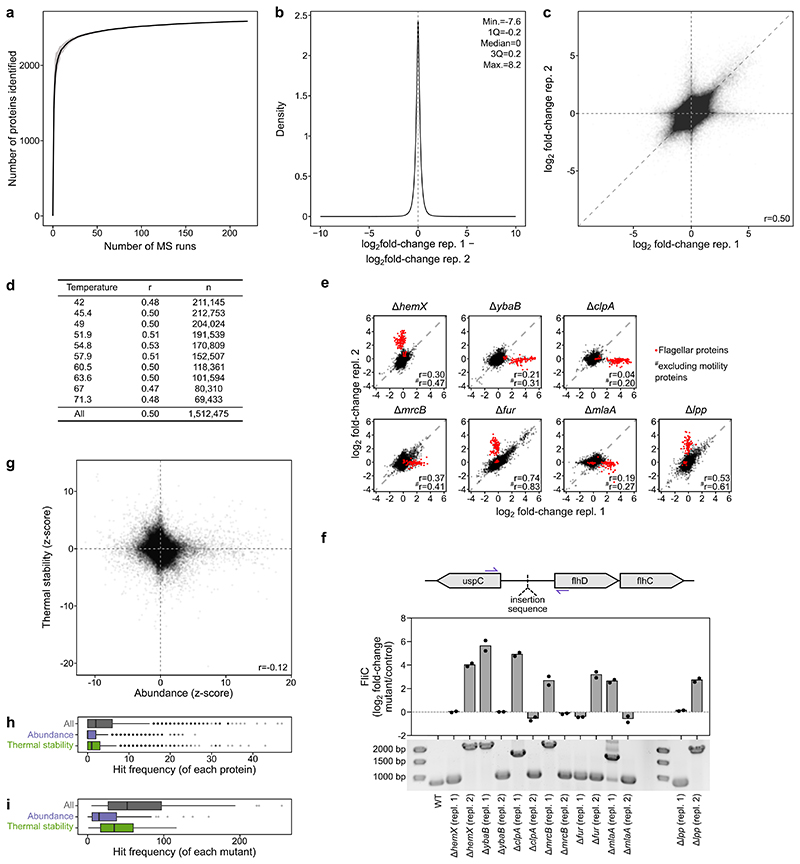
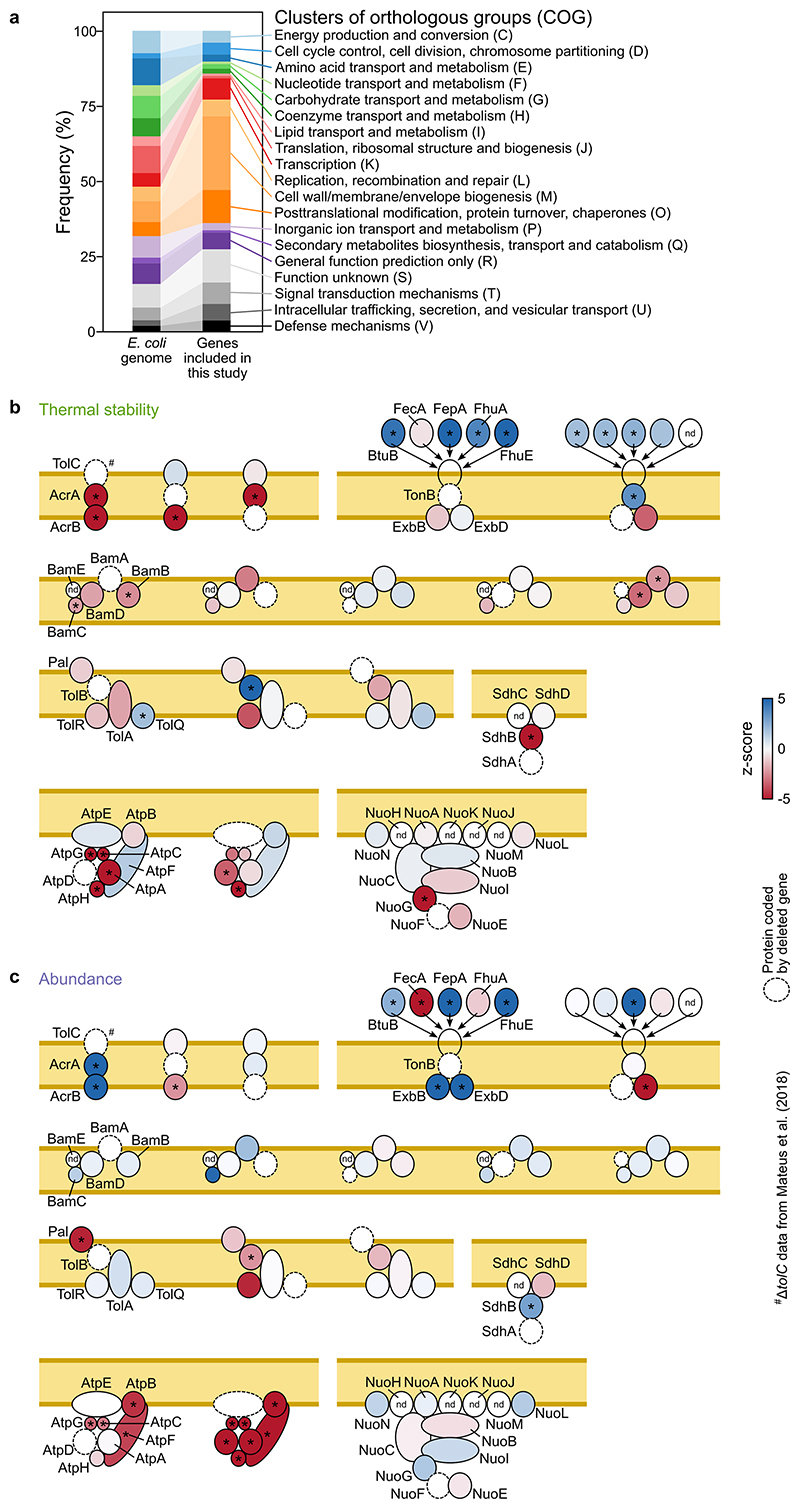
We used two-dimensional thermal proteome profiling (2D-TPP) 25 in 121 E. coli strains (the majority of which were single-gene deletion mutants from the Keio library 26 ; Supplementary Data 1). Mutants were selected to perturb diverse cellular processes (Extended Data Figure 2a), by leveraging chemical genetics data 12 . Each mutant was grown in duplicate to exponential phase, and heated to ten temperatures to induce protein denaturation, followed by cell lysis and collection of the soluble protein fraction at each temperature (Figure 1a). This generated 2,420 samples (121 mutants×2 replicates×10 temperatures) that were multiplexed with tandem mass tags (TMT) 27 and measured by quantitative MS-based proteomics 17 (Supplementary Figure 1). In total, we detected 2,586 proteins with at least two unique peptides (Extended Data Figure 1a; Supplementary Data 2). For each protein in each mutant, we calculated the ratio of the signal intensity to the median signal intensity of the respective protein in the same MS run (Supplementary Data 3). Measurements were largely consistent across biological replicates (Extended Data Figure 1b-d), with differences in clone behavior reflecting biological phenomena, such as mutations that activate the flagellar master regulator (FlhDC) in only one of the clones 28 (Extended Data Figure 1e-f; Supplementary Data 4; Supplementary Discussion).
Figure 1. Thermal proteome profiling (TPP) of 121 E. coli mutants.
(a) Experimental layout for TPP experiments. Two biological replicates of each mutant were grown to exponential phase and subjected to a short heat treatment. Cells were lysed and the soluble protein fraction at each temperature was analyzed by MS-based quantitative proteomics, using the multiplexing strategy depicted in panel at the right (for details see Online methods). (b) Heatmap of abundance and thermal stability of each protein (rows) in each mutant (columns). (c) Rarefaction analysis of the fraction of the proteome affected as a function of the number of genetic perturbations probed. Accumulation curves obtained after 50 random subsamples without replacement, where line represents the mean of the permutations and shaded area the standard deviation. (d) Zoomed inset from panel b demonstrates thermal destabilization of iron-sulfur cluster containing proteins in iron-sulfur cluster biosynthesis mutants.
Abundance (corresponding to the average changes at the two lowest temperatures 20 ) and thermal stability (corresponding to changes remaining at higher temperatures after correcting for protein abundance changes) were determined for 1,764 proteins across the genetic backgrounds (Figure 1b; Supplementary Data 5). We observed significant changes in 1,213 proteins in at least one mutant (|z-score| >1.96 and q-value <0.05; Figure 1c), with 840 proteins affected in abundance, 886 proteins in thermal stability, and 513 proteins in both. However, abundance and thermal stability were only weakly anti-correlated (r=-0.12; Extended Data Figure 1g).
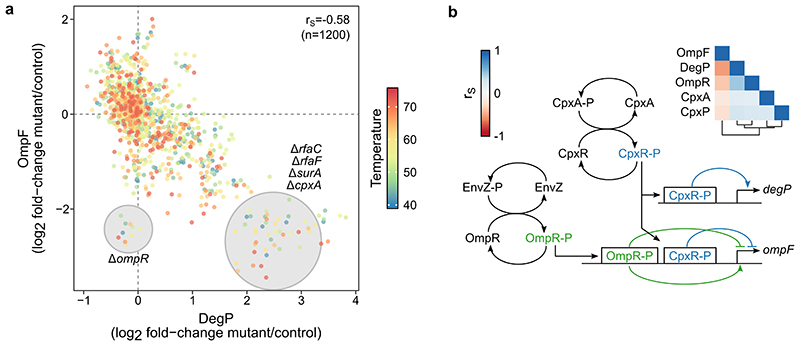
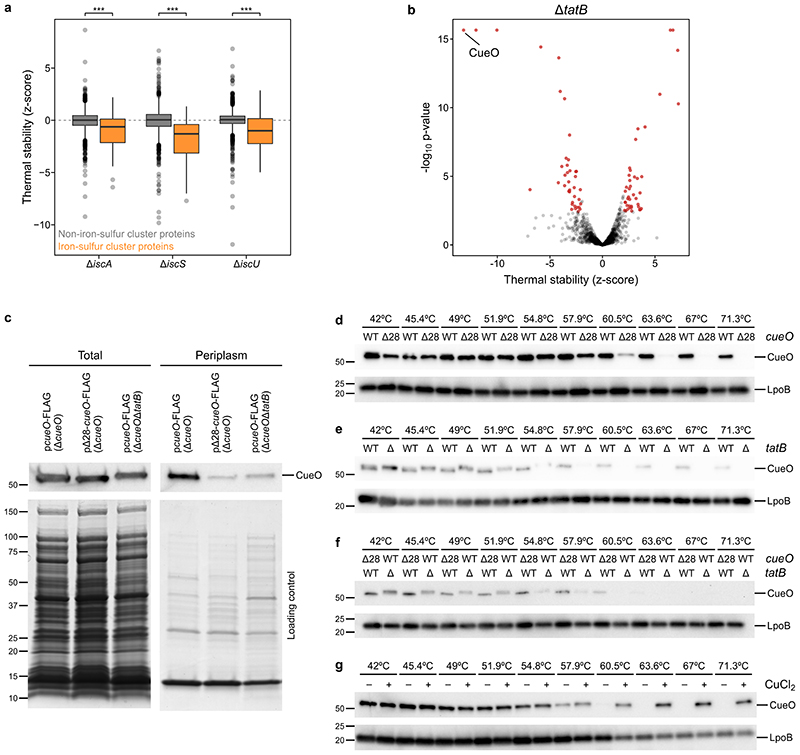
Multiple mechanisms can lead to these changes, such as the deletion of protein complex members leading to the thermal destabilization of other proximal complex members (Extended Data Figure 2b), or regulatory mechanisms of envelope stress responses (Extended Data Figure 3; Supplementary Discussion). Proteins were also affected in the absence of cofactors, as illustrated by the thermal destabilization of iron-sulfur cluster binding proteins in ΔiscA, ΔiscS, and ΔiscU (Figure 1d; Extended Data Figure 4a), or the thermal destabilization of the periplasmic copper oxidase CueO in ΔtatB (Extended Data Figure 4b). CueO is translocated from the cytosol to the periplasm after recognition of its signal peptide by the Tat system 29 . By deleting the signal peptide (Δ28-CueO), we could trap CueO in the cytosol in wildtype cells (Extended Data Figure 4c), and phenocopy the thermal destabilization observed in ΔtatB (Extended Data Figure 4d-f). Interestingly, Δ28-CueO was thermally stabilized by the addition of copper in lysate, which suggests that the lack of copper in the cytoplasm prevents CueO from being thermally stabilized (Extended Data Figure 4g; Supplementary Discussion).
In summary, we generated a comprehensive dataset of protein abundance and thermal stability changes in more than one hundred E. coli mutants. Nearly 70% of the proteins were altered in at least one perturbation (Extended Data Figure 1h-i), and abundance and thermal stability were largely orthogonal. The proteome changes observed can help in dissecting the physiological state of each mutant.
Essential proteins mostly change in thermal stability
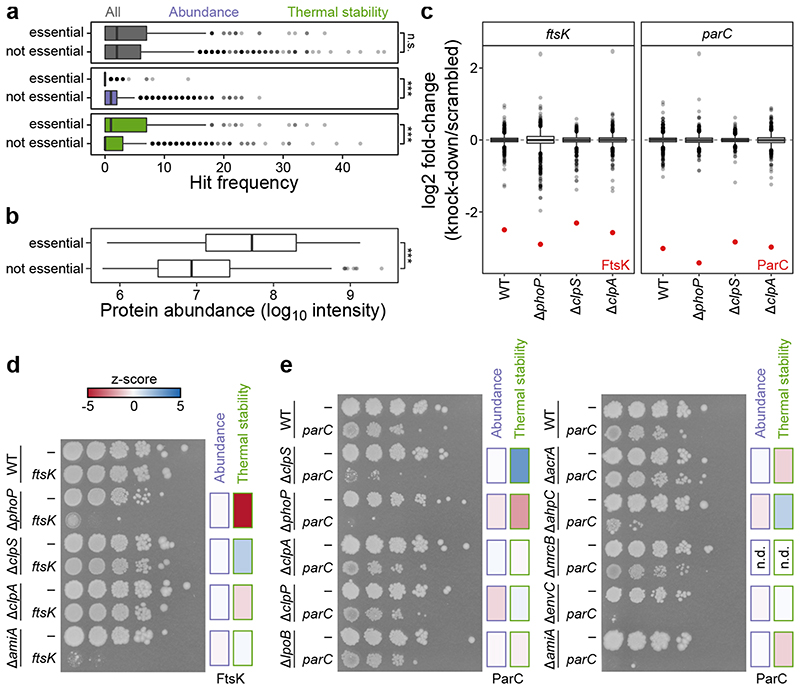
Since the function of essential genes (i.e., genes that cannot be deleted) is difficult to study by genetic approaches, we explored how essential genes behaved across the genetic perturbations included in this study. We observed that proteins coded by essential genes 30 were generally more abundant (Figure 2b), but less often altered in their abundance than those coded by non-essential genes (Figure 2a). However, essential proteins were more often hits in thermal stability than non-essential ones (Figure 2a), suggesting that their activity or interactions might be modulated in some genetic backgrounds.
Figure 2. Essential proteins change state, not abundance, in different genetic backgrounds.
(a) Distribution of the number of times a protein is significantly altered in abundance or thermal stability according to its classification as being encoded by an essential (n=273) or non-essential protein (n=1,491). Center line in box plots represents the median, box boundaries indicate the upper and lower interquartile range (IQR), and whiskers correspond to most extreme values, or to 1.5-fold of IQR if the extreme values are above this cutoff. ***Significance assessed with two-sided Wilcoxon signed-rank test (p All=0.48, p Abundance=6.9·10-22, p Stability=3.2·10-7). (b) Distribution of protein abundance (as measured by the three most abundant peptides for each protein; top3) for essential (n=273) or non-essential proteins (n=1,491). Box plots and statistical test as in panel a (p=1.9·10-99). (c) Distribution of proteome changes (n=2,096 proteins) in wildtype and 3 mutant strains when ftsK or parC are targeted by dCas9 compared to a scrambled guide RNA. FtsK and ParC (red) show the strongest downregulation in all strains. Box plots are depicted as in panel a. (d-e) Spot assay for the indicated mutant strains carrying in addition a guide RNA targeting ftsK (d) or parC (e) or a scrambled guide RNA (- in both panels). Abundance or thermal stability changes of the essential genes indicated by a heat map (Extended Data Figure 5).
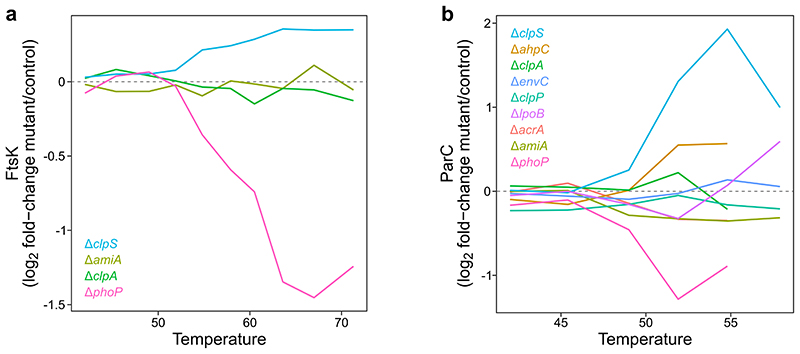
To gain insights into the consequence of changes in thermal stability of essential proteins, we used CRISPRi 31,32 to reduce the levels of FtsK (a cell division DNA translocase) and ParC (a subunit of topoisomerase IV) in different genetic backgrounds. Reducing the levels of FtsK (by ~6-fold) or ParC (by ~8-fold; Figure 2c) only mildly impacted cell growth in wildtype cells (Figure 2d-e). However, cells could not tolerate the depletion of the essential proteins in mutants in which these were affected in thermal stability (e.g., ΔclpS for ParC, or ΔphoP for both FtsK and ParC; Figure 2d-e; Extended Data Figure 5). Importantly, in mutants for which we did not observe thermal stability changes in the essential proteins, the growth phenotype was similar to wildtype cells (with the exception of ΔamiA and ΔenvC, both affecting cell division, and the latter being a genetic perturbation which by itself causes growth defects; Figure 2d-e). We confirmed by proteomics that the essential protein downregulation remained similar in all mutants tested (Figure 2c).
Overall, we observed that the levels of essential proteins are high and rarely modulated, consistent with their housekeeping roles. Although bacterial cells can tolerate fluctuations in the levels of these proteins, they seem to prefer maintaining them above the levels required for optimal growth 33 . In contrast, the thermal stability of essential proteins, a trait that is impervious to expression proteomics, was regularly affected. Remarkably, cells became more vulnerable to changes in levels of essential proteins in conditions that affected their thermal stability. Hence, cells may maintain higher levels of essential proteins to buffer changes in their activity across different conditions. Overall, this synthetic lethality of essential and non-essential genes could provide new paths for combinatorial drug therapies.
Functionally-related proteins are co-regulated
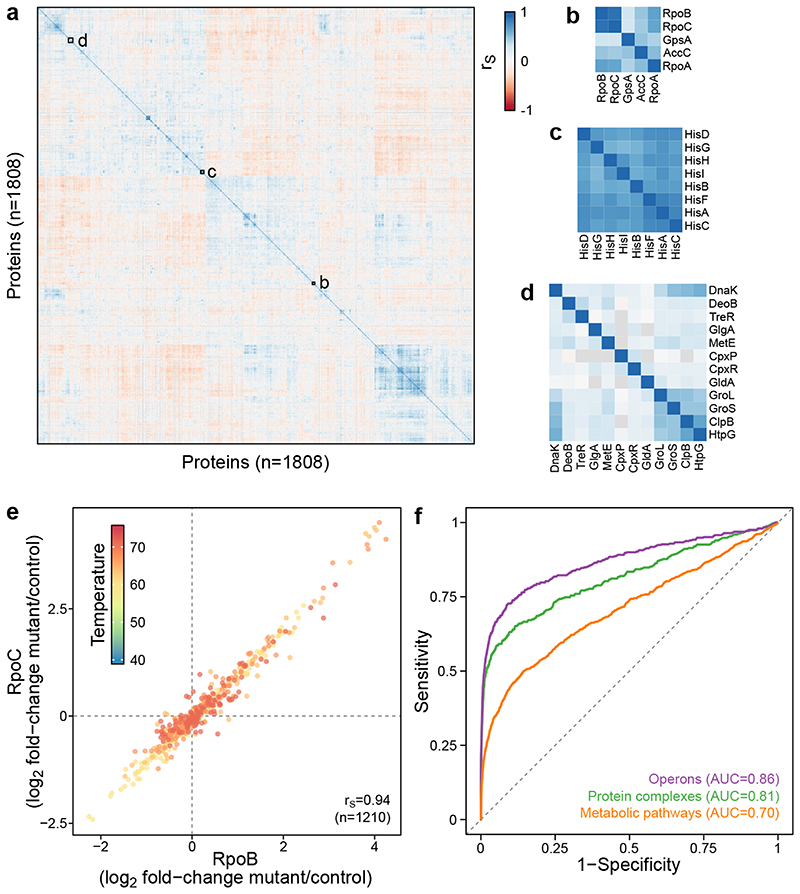
We assessed which pairs of proteins co-changed across the 121 genetic perturbations at the ten different temperatures, by calculating Spearman’s rank correlation (rS) for all protein pairs (Figure 3a; Supplementary Data 6). As previously shown for gene and protein co-expression analysis 14,34–37 , we observed an enrichment of strong correlations for proteins with known biological associations (Extended Data Figure 6a). Importantly, our ability to measure protein thermal stability further contributed to capturing functional associations. For example, the essential core subunits of RNA polymerase (RNAP; RpoA, RpoB and RpoC) were correlated (rS>0.68; Figure 3b) mostly due to changes at higher temperatures (Figure 3e). Although it is currently unclear how these thermal stability changes link to RNAP states (in eukaryotes, increase in RNAP II thermal stability correlates with DNA-bound active holoenzyme 21 ), these changes were unrelated to upregulation of the flagellar sigma factor (FliA) in a large number of mutants 28 —as we did not observe a correlation between flagellar protein abundance (e.g., FliC) and RNAP thermal stability (e.g., RpoB; rS=-0.22, n=121 mutants). Other functionally-related proteins also clustered closely, such as all the enzymes of the L-histidine biosynthesis pathway (Figure 3c), or proteins involved in protein folding (Figure 3d).
Figure 3. Co-changes in protein abundance and thermal stability are strong identifiers of functional relationships.
(a) Heatmap of Spearman’s rank correlation of all protein pairs using all the acquired data across the 121 genetic perturbations at the ten different temperatures. (b-d) Zoomed insets demonstrate co-clustering of functionally-related proteins, for members of the RNAP (b), L-histidine biosynthesis (c), and proteins involved in protein folding (d). (e) Example of protein pair (two subunits of RNA polymerase) co-changing in its thermal stability across all the genetic perturbations profiled in this study. Each data point corresponds to the log2 fold-change to control in one of the genetic perturbations at one temperature (color coded). (f) Receiver operating characteristic (ROC) analysis based on the decreasing absolute Spearman’s rank correlation compared to known operons, protein complexes and metabolic pathways.
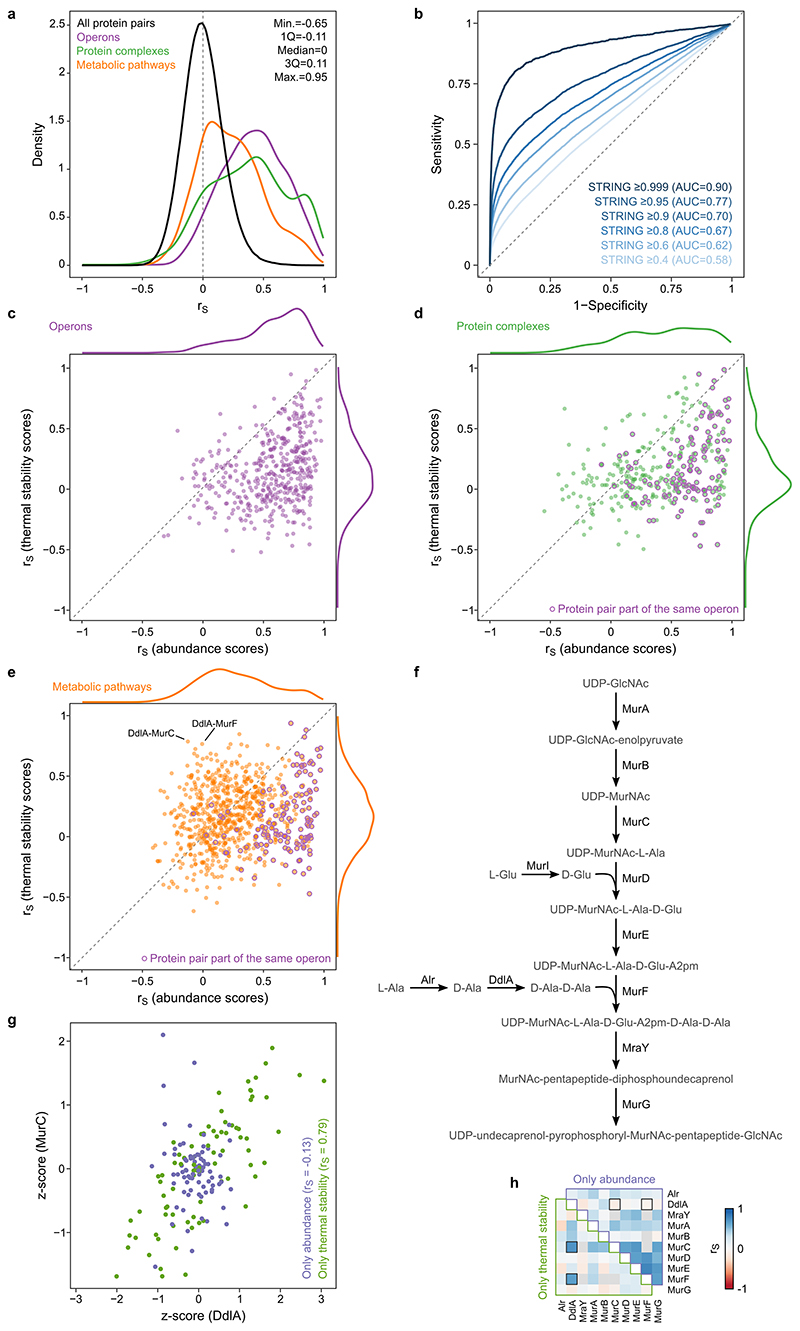
A receiver operating characteristic (ROC) analysis revealed that strongly correlated protein pairs captured previously described functional associations (Figure 3f), particularly for proteins expressed from the same operon (area under the ROC (AUROC)=0.86; strongly driven by protein abundance changes, Extended Data Figure 6c), part of the same protein complex (AUROC=0.81; mostly driven by protein abundance changes, since 38% of proteins that belong to the same complex are also in the same operon, Extended Data Figure 6d), or belonging to the same metabolic pathway (AUROC=0.70; driven to a large extent by thermal stability, Extended Data Figure 6e-h; Supplementary Discussion). Further, we compared our data with STRING associations and found that the higher the confidence of interactions in STRING the better they were recapitulated by our data (Extended Data Figure 6b). For the highest confidence interactions (combined STRING score ≥0.999; n=1,493), we obtained an AUROC of 0.90, recovering 47% true positive interactions at 1% false positive rate (corresponding to |rS|≥0.45).
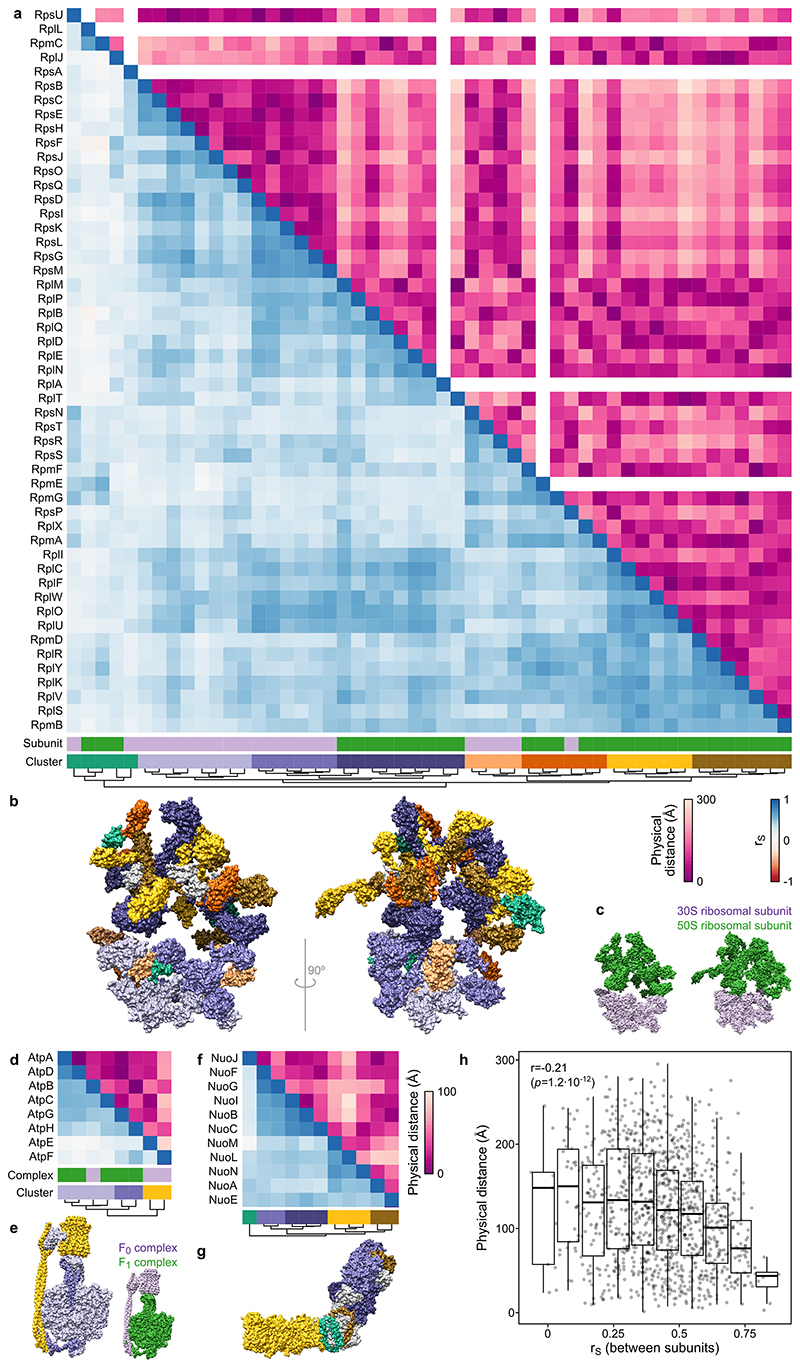
In addition to the overall strong correlation of proteins belonging to the same complexes or metabolic pathways, we also captured complex (see Supplementary Discussion for examples of the ribosome, ATP synthase and respiratory complex I; Extended Data Figure 7) or pathway substructures (next section; Figure 4a). For protein complexes, strongly correlating subunits were generally at a shorter physical distance from each other (Extended Data Figure 7h), confirming that physically interacting proteins melt coherently across perturbations 15,20,21 . Therefore, the data presented here might aid future structural biology efforts for other protein complexes, by constraining which subunits should be spatially close to each other.
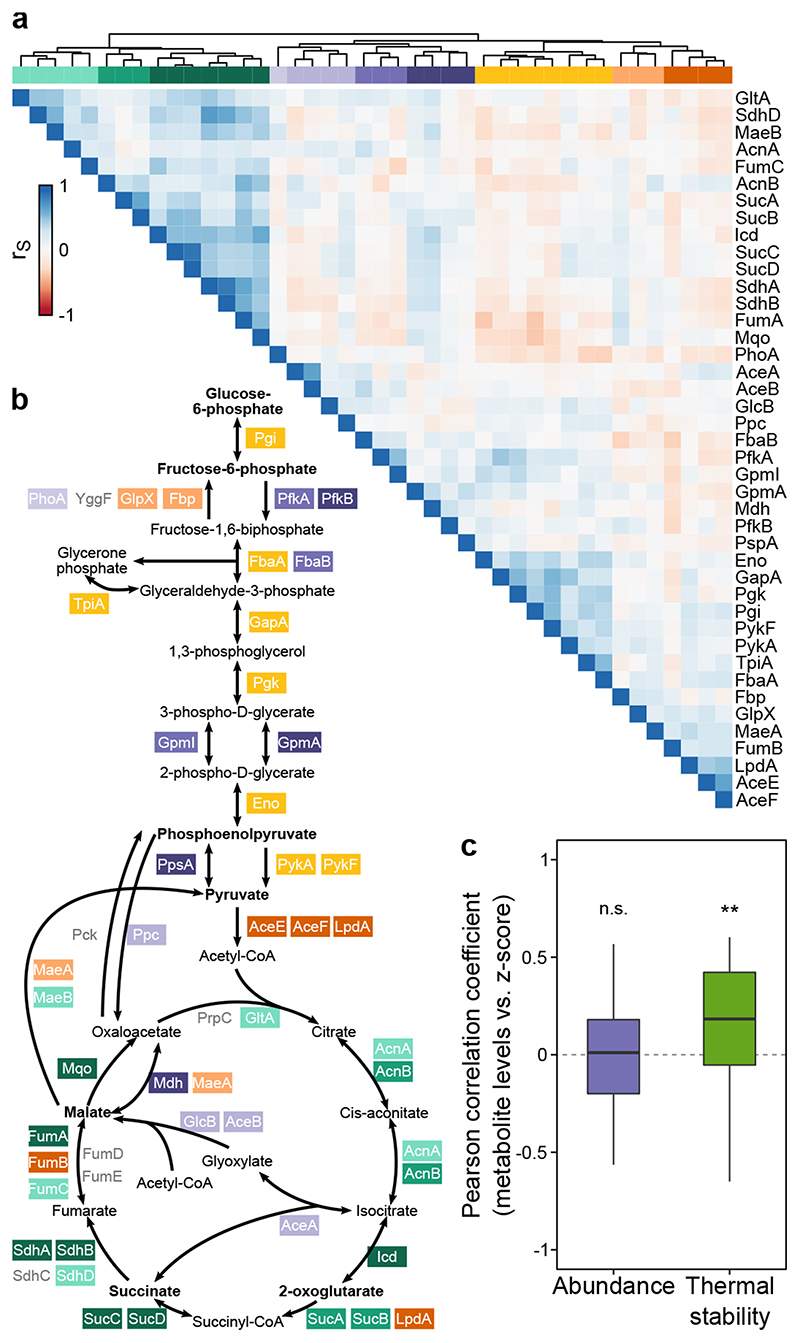
Figure 4. Protein thermal stability captures enzymatic activity.
(a) Hierarchically clustered heatmap of Spearman’s rank correlation (as in Figure 3a) of enzymes belonging to glycolysis and citric acid cycle. (b) Schematic representation of glycolysis and citric acid cycle with enzymes color coded according to the clusters from panel a. Metabolites in bold were quantified in 19 mutants and wildtype cells using targeted metabolomics. (c) Distribution of Pearson correlation coefficients for metabolite levels in each mutant and abundance or thermal stability of enzymes that directly interact with the metabolite (n=38 pairs of metabolite-enzyme for each distribution; see also Extended Data Figure 9a-b). Box plots are depicted as in Figure 2a. **p=0.005 that the median correlation coefficient is not different from zero using a bootstrap test.
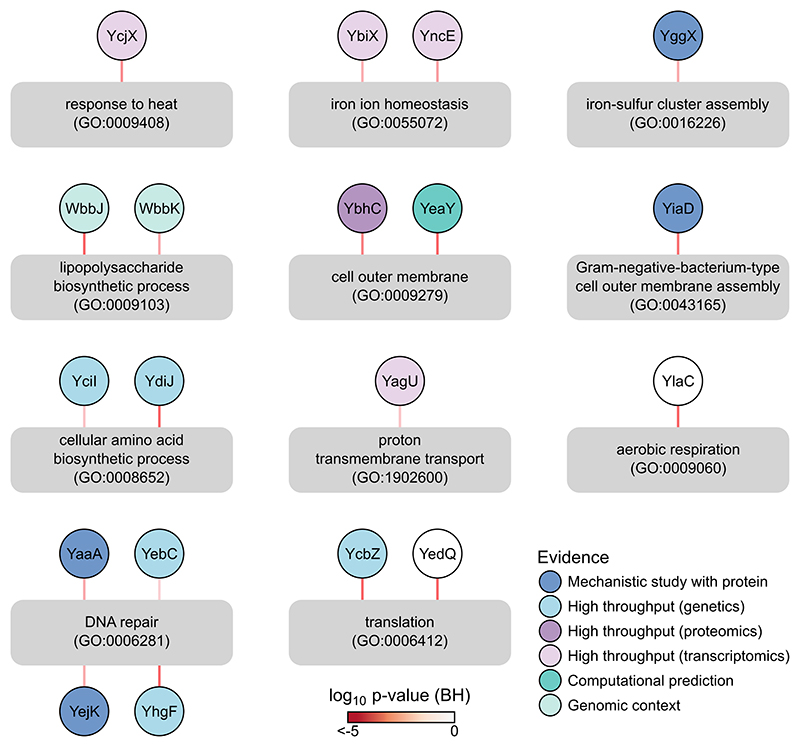
Having established that our data recapitulated known biology, we looked into our ability to provide new insights into the function of proteins of unknown function (orphan proteins). To facilitate this, we performed gene ontology (GO) enrichment of the highly correlated proteins (|rS|≥0.45) for each protein in our dataset (Supplementary Data 7). In total, 140 orphan proteins 38 could be associated with known biological processes. For several of these, we found corroborating evidence that they are involved in the process we link them to (Supplementary Discussion; Extended Data Figure 8).
Overall, we demonstrate that co-changes in protein abundance and thermal stability are strong identifiers of functional associations in the cell, and provide organizational insights into large protein complexes. Importantly, many functional associations identified by us are not previously described (only 6,116 of the 16,995 correlations with |rS|≥0.45 are reported in STRING). This could uncover new cellular links between proteins of known function, and provide leads for the function of orphan genes (see Supplementary Discussion on how integrating data from this study can be used to suggest molecular mechanisms).
Enzyme thermal stability reflects activity
Our data recapitulated pathway organization, as highlighted by the glycolysis and citric acid cycle enzymes, which clustered in three major groups (with sub-clusters in each of them; Figure 4a), corresponding to enzymes involved in glycolysis (orange-yellow cluster), the citric acid cycle (green cluster), or enzymes belonging to the glyoxylate shunt (AceA, AceB, GlcB) or performing anaplerotic (Ppc), reversible (PpsA, GpmA, GpmI), or parallel reactions (Mdh) (purple cluster).
As the thermal stability of proteins can be altered by ligand binding 11,39 , we wondered whether our ability to recapitulate the structure of metabolic pathways was linked to changes in enzyme activity, and hence in metabolite levels. Therefore, we quantified relative levels of metabolites from glycolysis (glucose/fructose-6-phosphate, phosphoenolpyruvate, and pyruvate) and citric acid cycle (2-oxoglutarate, succinate, and malate) in 19 of the mutants included in this study and in wildtype E. coli cells (as a reference; Extended Data Figure 9c). We observed large changes in metabolite levels, from a 4-fold reduction of succinate in ΔiscS to a 5.7-fold increase of glucose/fructose-6-phosphate in Δdam (Supplementary Data 8). The low levels of succinate in ΔiscS might be attributed to defects in iron-sulfur cluster biosynthesis, which would impair the function of SdhAB (thermally destabilized).
Interestingly, ΔiscS also showed increased thermal stability of GlcB and an increase in malate levels, which might indicate flux rearrangements, such as the glyoxylate shunt being more active.
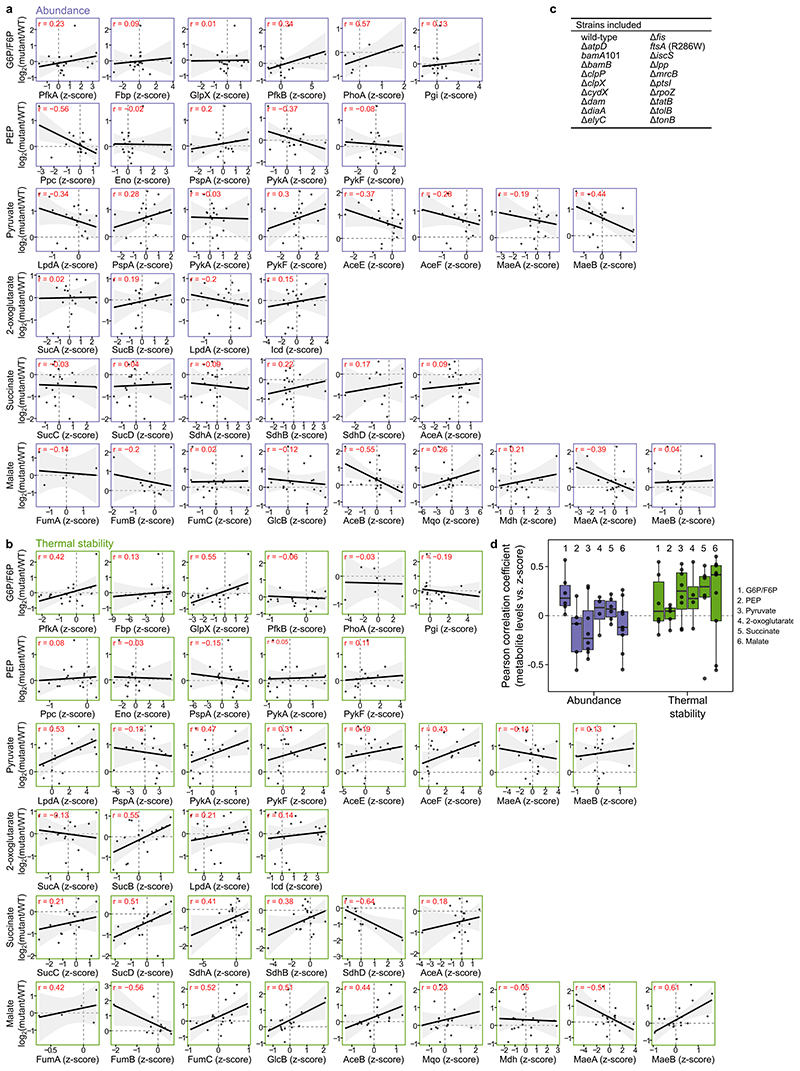
We then asked if abundance or thermal stability of enzymes directly upstream or downstream of each of the metabolites correlated with the metabolite levels across the mutants (Extended Data Figure 9a-b). We found a significant correlation between metabolite levels and enzyme thermal stability (median (interquartile range): 0.19 (-0.05–0.43); p=0.005 that the median correlation coefficient is not different from zero using a bootstrap hypothesis test), but not for enzyme abundance (median (interquartile range): 0.016 (-0.19–0.18); p=0.22; Figure 4c; Extended Data Figure 9d). For example, 2-oxoglutarate levels were correlated with the thermal stability of SucB (r=0.55). In some cases, the levels of metabolites were anti-correlated with the thermal stability of isoenzymes that utilized them—e.g., malate levels and MaeA (r=-0.51)—, indicating more complex interdependencies (e.g., the thermal destabilization being caused by some mechanism that leads to reduced enzyme function and therefore substrate accumulation).
Overall, enzyme thermal stability reflected the levels of intracellular metabolites that directly interacted with the enzymes as substrates or products. Thus, TPP captures enzymatic activity in vivo, offering a unique view into the metabolic state of the cell and the ability to generate metabolic pathway associations.
Proteome changes explain mutant phenotypes
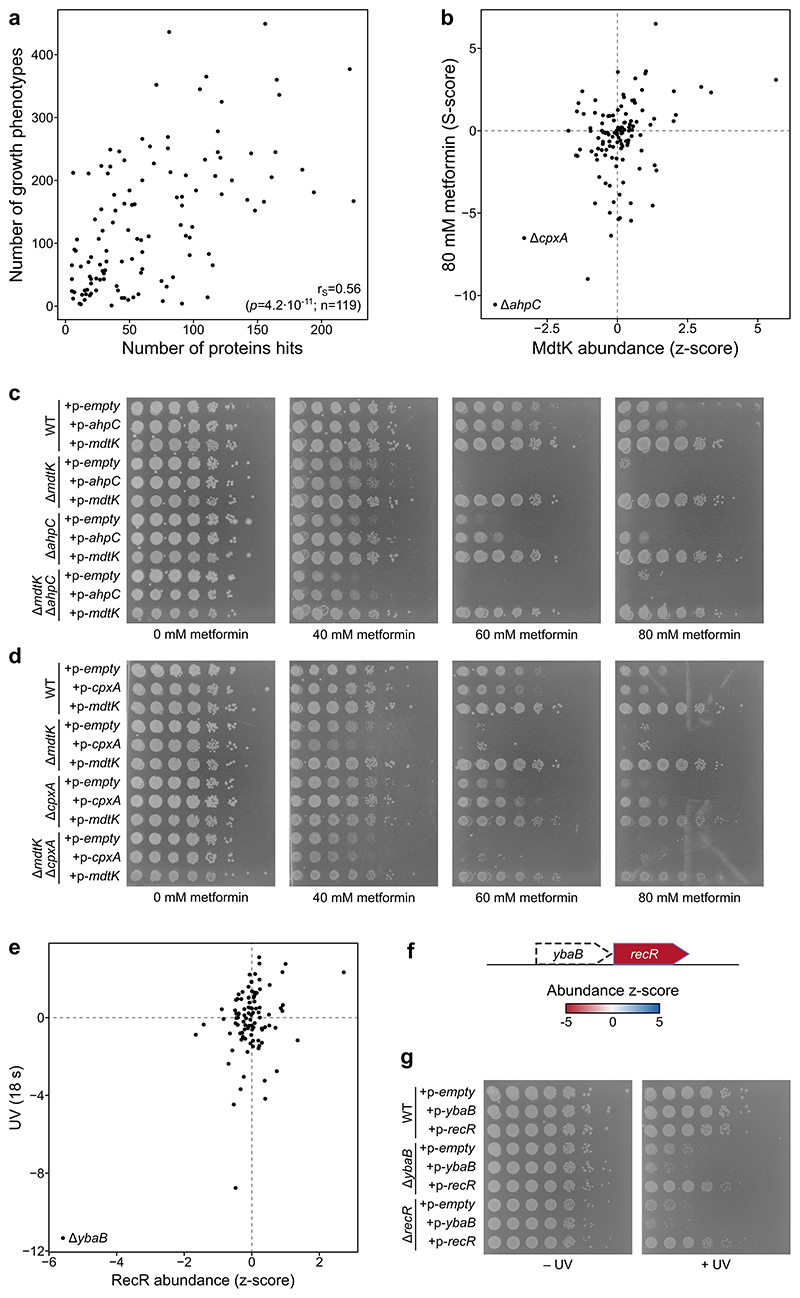
We investigated if proteome changes could explain growth phenotypes of the mutants in different chemical and environmental stresses. For this, we used data from chemical genetics studies, in which the fitness of all E. coli single-gene deletion mutants has been measured in nearly one thousand conditions 7,9,12,40 . In general, mutants with a larger proportion of the proteome affected, had a larger number of phenotypes in chemical genetics screens (r=0.57, p<0.001; Extended Data Figure 10a).
To gain insights into possible causal effects, we correlated protein abundance or thermal stability of each detected protein across all mutant backgrounds with the fitness of the same mutants in all chemical genetic conditions. This highlighted examples of proteome changes that explain growth phenotypes that are not solely related to the deleted gene (Supplementary Data 9), such as the abundance of the multidrug efflux pump MdtK explaining the resistance to metformin 12 (Extended Data Figure 10b-d), or the abundance of the DNA repair protein RecR explaining sensitivity to UV 7 (Extended Data Figure 10e-g; Supplementary Discussion).
Discussion
We systematically measured the abundance and thermal stability of nearly 1,800 proteins in 121 mutants of E. coli. We detected significant changes in more than 1,200 proteins, with thermal stability and abundance measurements being largely orthogonal. Only 61 of the 273 (22%) detected essential proteins changed in their abundance, most of them being altered in a single mutant. Recently, CRISPRi has provided a way to knockdown genes 31 . However, levels of knockdown and polar effects still present complications, especially for bacterial genomes 33,41,42 . Since we detected changes in the thermal stability of 164 (60%) essential proteins, our approach provides a unique view into their regulation and activity. Inspired by our ability to probe protein state and activity, we confirmed the power of our data to identify functional associations and identified more than 10,000 potentially new interactions, with 3,655 of these interactions involving 253 orphan proteins. These could provide new hints for the function of these orphan proteins. Having the largest perturbation dataset for TPP, we also investigated the underlying reasons for why proteins change melting behavior in living cells. It has been previously observed that protein thermal stability can be affected by drug 11,20,25,39 , nucleic acid 21 and metabolite 19 binding, as well as protein interactions 15,20,21 and post-translational modifications 22–24 . Here, we show that protein thermal stability can also be affected by levels of cofactors and metabolites that directly bind the protein. TPP thus provides a way for surveying metabolic activity. Finally, we combined our data with existing large-scale phenotyping data 7,9,12,40 to gain mechanistic insights into the causes of conditional growth phenotypes that lie beyond the knocked out gene, providing foundational information for thousands of such causal protein-phenotype connections. In conclusion, the dataset here presented can be used to gain insights into protein function and associations (with all data available at http://ecoliTPP.shiny.embl.de), and the approach is readily expandable to other organisms.
Online methods
Strains
All the E. coli mutants used in this study come directly from the Keio collection 26 , with the exception of bamA 43 , ftsA 44 , bamD 45 and lptD mutants 46 (Supplementary Data 1; described also in Nichols et al. 7 ). All mutants used have been made in the E. coli BW25113 strain background 47 . When possible, we used two independent clones from the Keio collection to maximize variability and to spot effects that might originate from secondary mutations. For CRISPRi experiments, we transferred the chromosomal dCas9 expression cassette from Lawson et al. 32 into the BW25113 strain using P1 transduction. For all follow-up work involving specific mutants, the gene deletions were retransduced into the wildtype or CRISPRi strain.
Mutant selection and multiplexing for thermal proteome profiling
In order to select 121 E. coli mutants that target diverse cellular processes, we first calculated the Pearson correlation coefficient of the chemical genetics fingerprint (S-scores across hundreds of chemical and environmental stresses 12 ) of all pairs of mutants. We then clustered the mutants based on their correlation coefficient profile, cut the tree at eleven clusters, and manually selected approximately eleven mutants per cluster—using previous knowledge of gene function to guide our selection.
For thermal proteome profiling experiments, we used tandem mass tags that allow multiplexing of 11 different conditions (TMT11plex). We decided not to use the wildtype strain in each mass spectrometry (MS) run to maximize the number of genetic perturbations tested. Instead, we considered that, in most mutants, proteins will not change abundance or thermal stability and hence the median of the 11 perturbations on each protein would work as control for each MS run (see below for details). Therefore, it was important that the cellular processes perturbed within each MS run were as diverse as possible. For this, the 121 mutants were randomly sampled to an 11×11 matrix, with the aim of running the first biological replicate of the mutants row-wise, and the second biological replicate column-wise—in this way, each perturbation was probed against a background of 20 different perturbations (Supplementary Figure 1). The Pearson correlation coefficient of the chemical genetic fingerprints of each mutant against the 20 different background perturbations was calculated as a proxy for the processes targeted (mutants with weak correlation target different processes 7 ). The randomization procedure was repeated 1,000 times and the solution in which the sum of all absolute correlation coefficients between the mutants within an experiment was minimal was considered optimal (Supplementary Figure 1; Supplementary Data 1).
Thermal proteome profiling
Thermal proteome profiling was performed as previously described 20 . Briefly, each mutant was streaked out from two independent glycerol stocks on lysogeny broth (LB) agar plates and incubated overnight at 37°C. The next day, single colonies were picked and incubated in 2 mL LB for ~6 hours, after which 50 μL of bacterial culture were transferred to 5 mL of LB and further incubated at 37°C overnight (~16 hours). Overnight cultures were diluted to OD578 0.001 in 50 mL LB medium and further incubated at 37°C, 220 rpm until OD578 ~0.1 (range: 0.084-0.176; Supplementary Data 1). Cells were pelleted at 4000 × g for 5 min, washed with 10 mL PBS, and resuspended in PBS in a volume in mL equal to 12× OD578 (equivalent to resuspending to an OD578 of 4). The cell suspension (100 μL) was then aliquoted to ten wells of a PCR plate, which was centrifuged at 4000 × g for 5 min. Most of the supernatant (80 μL) was removed and cells were subjected to a thermal gradient (42°C, 45.4°C, 49°C, 51.9°C, 54.8°C, 57.9°C, 60.5°C, 63.6°C, 67°C, 71.3°C) for 3 min in a PCR machine (Agilent SureCycler 8800) followed by 3 min at room temperature. Cells were lysed with 30 μl lysis buffer (final concentration: 50 μg/ml lysozyme, 0.8% NP-40, 1× protease inhibitor (Roche), 250 U/ml benzonase, and 1 mM MgCl2 in PBS) for 20 min, shaking at room temperature, followed by three freeze–thaw cycles (freezing in liquid nitrogen, followed by 1 min at 25°C in a PCR machine and vortexing). The plate was then centrifuged at 2,000 × g for 5 min to remove cell debris, and the supernatant was filtered at 500 × g for 5 min through a 0.45-μm 96-well filter plate (Millipore, ref: MSHVN4550) to remove protein aggregates. The flow-through was mixed 1:1 with 2× sample buffer (180 mM Tris pH 6.8, 4% SDS, 20% glycerol, 0.1 g bromophenol blue) and kept at -20°C until prepared for mass spectrometry analysis. To verify the effect of the heat treatment, the soluble protein concentration at each temperature for each experiment was determined using the BCA assay, according to the manufacturer’s instructions (ThermoFisher Scientific).
MS-based proteomics
Proteins were digested according to a modified SP3 protocol 48,49 . Briefly, approximately 2 μg of protein (4 μl of frozen samples) was added to 16 μl of water and added to the bead suspension (10 μg of beads (Thermo Fischer Scientific—Sera-Mag Speed Beads, CAT# 4515-2105-050250, 6515-2105-050250) in 10 μl 15% formic acid and 30 μl ethanol). After a 15 min incubation at room temperature with shaking, beads were washed four times with 70% ethanol. Next, proteins were digested overnight by adding 40 μl of digest solution (5 mM chloroacetamide, 1.25 mM TCEP, 200 ng trypsin, and 200 ng LysC in 100 mM HEPES pH 8). Peptides then were eluted from the beads, dried under vacuum, reconstituted in 10 μl of water, and labeled for 1 h at room temperature with 17 μg of TMT11plex (Thermo Fisher Scientific) dissolved in 4 μl of acetonitrile (the label used for each experiment can be found in Supplementary Data 1). The reaction was quenched with 4 μl of 5% hydroxylamine, and experiments belonging to the same mass spectrometry run were combined. Samples were desalted with solid-phase extraction by loading the samples onto a Waters OASIS HLB μElution Plate (30 μm), washing them twice with 100 μl of 0.05% formic acid, eluting them with 100 μl of 80% acetonitrile, and drying them under vacuum. Finally, samples were fractionated onto 29 fractions on a reversed-phase C18 system running under high pH conditions. This consisted of an 85 min gradient (mobile phase A: 20 mM ammonium formate (pH 10) and mobile phase B: acetonitrile) at a 0.1 ml/min starting at 0% B, followed by a linear increase to 35% B from 2 min to 60 min, with a subsequent increase to 85% B from up to 62 min and holding this up to 68 min, which was followed by a linear decrease to 0% B up to 70 min, finishing with a hold at this level until the end of the run. Fractions were collected every two minutes from 12 min to 70 min and every sixth fraction was pooled together.
Samples were analyzed with liquid chromatography coupled to tandem mass spectrometry, as previously described 20 . Briefly, peptides were separated using an UltiMate 3000 RSLCnano system (Thermo Fisher Scientific) equipped with a trapping cartridge (Precolumn; C18 PepMap 100, 5 μm, 300 μm i.d. × 5 mm, 100 Å) and an analytical column (Waters nanoEase HSS C18 T3, 75 μm × 25 cm, 1.8 μm, 100 Å). Solvent A was 0.1% formic acid in LC-MS grade water and solvent B was 0.1% formic acid in LC-MS grade acetonitrile. Peptides were loaded onto the trapping cartridge (30 μl/min of solvent A for 3 min) and eluted with a constant flow of 0.3 μl/min using 90 min of analysis time (with a 2–28% B elution, followed by an increase to 40% B, a washing step up to 90% B, followed by re-equilibration to initial conditions). The LC system was directly coupled to a Q Exactive Plus mass spectrometer (Thermo Fisher Scientific) or a Fusion Lumos Tribrid mass spectrometer (Thermo Fisher Scientific) using a Nanospray-Flex ion source and a Pico-Tip Emitter 360 μm OD × 20 μm ID; 10 μm tip (New Objective). The mass spectrometer was operated in positive ion mode with a spray voltage of 2.3 kV and capillary temperature of 320°C. Full-scan MS spectra with a mass range of 375–1,200 m/z were acquired in profile mode using a resolution of 70,000 (maximum fill time of 250 ms or a maximum of 3e6 ions (automatic gain control, AGC)). Fragmentation was triggered for the top 10 peaks with charge 2–4 on the MS scan (data-dependent acquisition) with a 30-s dynamic exclusion window (normalized collision energy was 32), and MS/MS spectra were acquired in profile mode with a resolution of 35,000 (maximum fill time of 120 ms or an AGC target of 2e5 ions).
Protein identification and quantification
MS data were processed as previously described 20 . Briefly, raw MS files were processed with isobarQuant 50 , and the identification of peptide and protein was performed with Mascot 2.4 (Matrix Science) against the E. coli (strain K12) UniProt FASTA (Proteome ID: UP000000625), modified to include known contaminants and the reversed protein sequences (search parameters: trypsin; missed cleavages 3; peptide tolerance 10 ppm; MS/MS tolerance 0.02 Da; fixed modifications were carbamidomethyl on cysteines and TMT10plex on lysine; variable modifications included acetylation on protein N-terminus, oxidation of methionine, and TMT10plex on peptide N-termini).
Abundance and thermal stability score calculation
We calculated abundance and thermal stability scores for every protein in every mutant by combining the data from the two replicates similarly to previously described, using R (ver. 3.6.1) 20,21 . Briefly, the overall distribution of signal sum intensities was normalized with vsn 51 to compensate for slight differences in protein amounts from each TMT channel. Then, for every protein, we calculated the ratio of the signal sum intensity of each mutant to the median signal sum of the same protein in all the mutants in the same mass spectrometry experiments (i.e., this yielded a fold-change relative to control for every protein in each mutant at each temperature). The abundance score of each protein in each mutant was calculated as the average log2 fold change at the two lowest temperatures weighted for the number of temperatures in which the protein was identified for each replicate (requiring that there was data for the two biological replicates in at least one of the two temperatures). The thermal stability score of each protein in each mutant was then calculated by subtracting the abundance score from the log2 fold changes of all temperatures, and summing the resulting fold changes weighted for the number of temperatures in which the protein was identified for each replicate (requiring that there were at least ten data points to calculate this score). To assess the significance of abundance and thermal stability scores, we used a limma analysis 52 instead of a previously described bootstrap approach 20,21 , followed by an FDR analysis, using the fdrtool package. Abundance and thermal stability scores for all mutants were separately transformed to z-scores. Proteins with calculated |z-score| >1.96 (corresponding to a global p <0.05 for the effect size) and with q-value <0.05 were considered significantly changed.
Highly variable protein analysis
We evaluated which proteins showed consistently different values between the two biological replicates. For this, we calculated the difference between replicates for all log2 fold-changes of each protein at each temperature (Extended Data Figure 1b). We extracted all the proteins that were in the top 5% of absolute difference (i.e., 2.5% of each side of the distribution) and counted how many times each protein appeared (i.e., from multiple mutants and multiple temperatures). We considered the top 10% of these proteins as highly variable proteins (Supplementary Data 4). GO enrichment was performed as described below.
flhDC upstream sequence size determination
The promoter of flhDC was amplified by PCR using the forward primer 5’- GTAACCGCAACAGCGACAAG-3’ and the reverse primer 5’-CAATCAAACGCTGTGCAAGTAG-3’ and the product was run on a 1% agarose gel.
CRISPRi experiments
We first designed guide RNAs for each gene that we wanted to knockdown. The guides comprised sequences of 20 nucleotides with perfect complementarity towards the open reading frame of the target gene and located next to a protospacer adjacent motif (NGG). The guides were designed with the guidelines from Cui et al. 53 in mind and using the CRISPOR tool 54 . We synthetized the following nucleotides 5’- TTCGGGCCCAAGCTTCAAAAAAAGCACCGACTCGGTGCCACTTTTTCAAGTTGATAACGGAC TAGCCTTATTTTAACTTGCTATTTCTAGCTCTAAAAC-3’ and 5’-CTAGGTATAATACTAGTNNNNNNNNNNNNNNNNNNNNGTTTTAGAGCTAGAAATAGCAAGTTAAAATAAGGCTAGTCCG-3’, in which the N’s were replaced by the sequence: TGAGACCAGTCTAGGTCTCG (for control); CCGTAAATTCATGTAGCGCA (for parC); GGATCAGCAACGCCTCCAGA (for ftsK). These were extended by PCR, digested with HindIII and SpeI restriction enzymes, and ligated to pgRNA plasmid 31 digested with the same restriction enzymes. Plasmids were sequenced with Sanger sequencing and transformed into the strains with dCas9 expression cassette—dCas9 expression was repressed by TetR 32 .
For growth inhibition experiments, strains were grown overnight at 37°C in the presence of 100 μg/ml ampicillin. Cells were then diluted to OD578=0.1, serially diluted in 10-fold steps in LB, and spotted on LB agar plates containing 100 μg/ml ampicillin to maintain the pgRNA plasmid and 1 ng/μl anhydrotetracycline to induce dCas9 expression. Plates were incubated at 37°C overnight and imaged in the morning.
To check the levels of downregulation of the proteins, strains were grown overnight at 37°C in the presence of 100 μg/ml ampicillin. Cells were then diluted to OD578=0.01 and grown to approximately OD578=1 in the presence of 100 μg/ml ampicillin, and 1 ng/μl anhydrotetracycline. Cells (2 ml) were pelleted at 4000 × g for 5 min, washed with 1 mL PBS, and resuspended in 100 μl of lysis buffer (final concentration: 50 μg/ml lysozyme, 2% SDS, 1× protease inhibitor (Roche), 250 U/ml benzonase, and 1 mM MgCl2 in PBS). Cells were lysed by five repeated freeze–thaw cycles (freezing in liquid nitrogen, followed by 5 min at room temperature while vortexing). Non-lysed cells were removed by centrifuging at 4000 × g for 5 min and the supernatant was analyzed by MS-based proteomics as described above.
Protein correlation profiling and receiver operating characteristic (ROC) analysis
For each protein, we averaged the log2 fold-change at each temperature and in each mutant (only if data was available for the two biological replicates), resulting in a maximum of 1,210 data points. We calculated the Spearman’s rank correlation for all protein pairs that overlapped by at least 242 data points (a minimum of 20% of the possible data). In this analysis, we kept proteins changing in abundance or thermal stability in only one of the two mutant clones (e.g., flagella proteins above), since these were consistently co-regulated within the replicate.
These data were then used to perform a receiver operating characteristic (ROC) analysis using the pROC package for R 55 , ignoring the sign of the correlation (i.e., the absolute correlation coefficient was used). Data were benchmarked against data from Ecocyc (operons, protein complexes, and metabolic pathways 56 ) and STRING 57 .
We further calculated the Spearman’s rank correlation based on z-scores of abundance or thermal stability, resulting in a maximum of 121 data points (requiring protein pairs to have their abundance or thermal stability quantified in a minimum of 60 overlapping mutants).
For GO enrichment of protein partners, we selected proteins with |rS|≥0.45 for each protein and performed GO enrichments as described below.
Physical distance in protein complexes
From the PDB files of the ribosome (PDB: 4YBB), the ATP synthase (PDB: 5T4O) and the respiratory complex I (PDB: 4HEA) structures, we retrieved the coordinates of every atom along with their subunit identity. We used this information to calculate the center-of-mass (assuming the same mass for every atom) of each subunit using the package SDMTools for R.
MS-based metabolite quantification
Cells were grown and harvested as described in the ‘Thermal proteome profiling’ section to keep the two experiments as similar as possible. After washing with PBS, cells were resuspended in a volume in mL equal to 12× OD578 (equivalent to resuspending to an OD578 of 4) with an acetonitrile:methanol:water (40:40:20) mixture with 100 ng/ml of creatinine-(methyl-13C) and 100 ng/ml phosphoenolpyruvic acid-2-13C potassium salt—used as internal standards. Samples were subjected to five freeze–thaw cycles (freezing in liquid nitrogen, followed by 5 min at 25°C in while vortexing), centrifuged at 20,000 × g for 15 min at 4 °C to remove cell debris, and the supernatant was collected and kept at -80 °C until analysis.
All samples and standards were analyzed on a Vanquish UHPLC system coupled to a Q Exactive Plus HRMS (Thermo Scientific, MA, USA) in HESI negative mode. The separation of metabolites was carried out on an XBridge BEH Amide column XP (100 x 2.1mm; 2.5μm) at a flow rate of 0.3 mL/min, maintained at 40°C. The mobile phase consisted of solvent A (7.5 mM ammonium acetate with 0.05% ammonium hydroxide) and solvent B (acetonitrile). A 16 min chromatographic run comprised a linear gradient from 2 to 12 min starting at 85% of solvent B and ending at 10%, followed by a hold from 12 to 14 min and a linear gradient to return to the initial conditions at 14.1 min.
Metabolites were analyzed in HRMS full scan mode at a resolution of 35,000, an AGC target of 1e6 ions, and a maximum IT of 100 ms, in the mass range of 60-900 m/z. The mass spectrometer was operated with a spray voltage of 3.5 kV, sheath gas 30 and auxiliary gas 5 units, S-Lens 65 eV, capillary temperature 320°C, and vaporization temperature of auxiliary gas 250°C.
Prior to the sample analysis, metabolite standards (D-Glucose 6-phosphate sodium salt, D-Fructose 6-phosphate disodium salt hydrate, phosphoenolpyruvic acid monopotassium salt, sodium pyruvate, succinic acid, alpha-ketoglutaric acid disodium salt hydrate, and malic acid) and a dilution series of a QC sample (prepared by mixing equal volumes of each sample) were analyzed on the LC-MS system to determine retention times and an injection volume allowing the detection of all metabolites of interest within a linear range. For the sample analysis, blank and multiple QC samples were injected at the beginning of the sample analysis sequence in order to stabilize the LC-MS system. Samples (8 μL injection volume) were randomized during LC-MS analysis and a QC sample was injected after every 5 samples to track the stability of the instrument and analytical method throughout the analysis sequence. Peak areas of the deprotonated M-H metabolite ions for each metabolite were quantified on the smoothed extracted ion chromatograms (15 smoothing points) using the XCalibur Quan Browser software (Thermo Scientific) with a mass tolerance of 7 ppm. Internal standards were used to detect procedural errors, not for data normalization.
Peak area ratios were calculated for each metabolite in each mutant replicate by dividing the peak area of the metabolite in the mutant by the average of the wildtype samples of the same mass spectrometry batch. For each mutant, the average of the log2-transformed peak area ratios was compared to abundance and thermal stability z-scores of enzymes that directly consume or produce each metabolite in glycolysis or citric acid cycle 56 . Correlation coefficients were also calculated for random metabolite-enzyme pairs (from the pool of the same enzymes)—with this procedure being repeated 1000 times to generate a distribution of the median of correlation coefficients. The real median of correlation coefficients was compared to the bootstrapped distribution, with the p-value corresponding to the fraction of times the bootstrapped median was higher than the real median—i.e., the probability that the real median is higher than zero.
CueO experiments
We amplified and FLAG-tagged cueO from the E. coli BW25113 strain genome by PCR using the forward primer 5’-TTCATCATCCCGGGATGCAACGTCGTGATTTCTTAAAATATTCCG-3’ (for full length CueO) or 5’-TTCATCATCCCGGGATGGCAGAACGCCCAACGTTAC-3’ (for Δ28-CueO) and the reverse primer 5’-TTCATCATAAGCTTCTACTTGTCATCGTCATCCTTGTAGTCAGAGCCGCCGCCGCCTACCGTA AACCCTAACATCATC-3’. The PCR products were digested with XmaI and HindIII restriction enzymes, and ligated to pBAD24 plasmid 58 digested with the same restriction enzymes. Plasmids were sequenced with Sanger sequencing to check that no mutations were introduced in cueO, and transformed into ΔcueO::FRT or ΔcueO::FRTΔtatB::kan.
For periplasm extraction experiments, cells (50 ml) were grown to OD578 ~0.5, as described in the ‘Thermal proteome profiling’ section, with the exception that LB medium contained 100 μg/ml of ampicillin and 0.2% arabinose. Cells were resuspended in wash buffer (10mM Tris-Cl, 150mM NaCl, pH 7.3) in a volume in mL equal to 2× OD578 (equivalent to resuspending to an OD578 of 25). An aliquot (500 μl) was transferred to a new tube, cells were centrifuged at 4000 × g for 5 min, and the supernatant was discarded. The pellet was resuspended in 300 μl SET buffer (0.5 M sucrose, 200 mM Tris-Cl, 1 mM EDTA, pH 7.3), followed by the addition of 100 μl of 3 mg/ml lysozyme and 300 μl of ice cold water. Cells were incubated for 20 min at 37°C without shaking. After incubation, a 50 μl aliquot (whole cells) was collected, cells were centrifuged at 10,000 × g for 30 s, and a 100 μl aliquot of supernatant (periplasm) was collected. Benzonase (final concentration: 250 U/ml) and MgCl2 (final concentration: 1 mM) were added to the samples, and samples were incubated for 10 min at room temperature. Sample buffer (180 mM Tris pH 6.8, 4% SDS, 20% glycerol, 0.1 g bromophenol blue) was added to the samples, and samples were kept at -20°C until analysis by western blot (described below).
For cellular thermal shift assay (CETSA) experiments, cells were grown as described in the ‘Thermal proteome profiling’ section, with the exception that LB medium contained 100 μg/ml of ampicillin and 0.2% arabinose. The CETSA experiment with 4 mM CuCl2 was performed in lysate of ΔcueO::FRT cells transformed with Δ28-CueO plasmid. Lysate was prepared as previously described 20 . Briefly, cells were grown to OD578 ~0.5 in 100 ml LB medium containing 100 μg/ml of ampicillin and 0.2% arabinose, washed with PBS, and resuspended in lysis buffer (without NP40) in a volume in mL equal to 2× OD578 (equivalent to resuspending to an OD578 of 50). Aliquots of lysate (200 μl) were treated with 4 mM CuCl2 (2 μl of 400 mM CuCl2) or water (2 μl), aliquoted (20 μl) to 10 wells of a PCR plate, and subjected to the temperature gradient described in ‘Thermal proteome profiling’. NP-40 was then added to a final concentration of 0.8%, and samples were processed as described in ‘Thermal proteome profiling’.
Samples were run on SDS-PAGE and CueO was detected by western blot using mouse monoclonal anti-FLAG antibody (F3165, Merck, dilution 1:1000) and goat anti-mouse IgG-HRP (sc-2005, Santa Cruz Biotechnology, dilution 1:5000). As a loading control, rabbit anti-LpoB antibody 3 (dilution 1:5000) and goat anti-rabbit IgG-HRP (sc-2004, Santa Cruz Biotechnology, dilution 1:5000) were used.
Metformin and UV sensitivity
Plasmids p-empty, p-mdtK, p-ahpC, p-cpxA were purified from the Transbac library 59 . Plasmids p-empty, p-recR, and p-ybaB were purified from the pMOB library 60 . These were transformed to wildtype, ΔahpC::kan, ΔcpxA::kan, ΔmdtK::FRT, ΔmdtK::FRTΔahpC::kan, and ΔmdtK::FRTΔcpxA::kan strains for metformin experiments, or wildtype, ΔybaB::kan, and ΔrecR::kan strains for UV experiments.
For metformin experiments, strains were grown to early stationary phase at 37°C in the presence of 10 μg/ml tetracycline. Cells were then diluted to OD578=0.5, serially diluted in 10-fold steps in LB, and spotted on LB agar plates containing 10 μg/ml tetracycline, 0.1 mM IPTG, and metformin to the desired concentration. Plates were incubated at 37°C overnight and imaged in the morning.
For UV sensitivity experiments, strains were grown to early stationary phase at 37°C in the presence of 50 μg/ml ampicillin. Cells were then diluted to OD578=0.1, serially diluted in 10-fold steps in LB, and spotted on LB agar plates containing 50 μg/ml ampicillin and 0.1 mM IPTG. Plates were exposed to UV with a total energy of 85 mJ/cm2 in a Spectrolinker XL-1500 UV crosslinker. Plates were incubated at 37°C overnight and imaged in the morning.
Gene ontology enrichments
Gene ontology (GO) enrichments were performed using the Fisher’s exact test and corrected for multiple comparison with the Benjamini-Hochberg procedure.
Extended Data
Extended Data Figure 1. Biological replicates show good reproducibility, with differences revealing biological phenomena.
(a) Rarefaction analysis of the proteome coverage (proteins with at least two unique peptides in each mass spectrometry run) as a function of the number of mass spectrometry runs. (b) Distribution of log2 fold-change differences between the two biological replicates. (c) Scatter plot of protein fold changes between all biological replicate measurements (n= 1,512,475; all proteins, all temperatures, all mutants). r depicts Pearson correlation. (d) Reproducibility of protein fold changes between biological replicate measurements at each temperature. (e) Examples of replicate correlation for specific mutants, highlighting that flagellar proteins are common outliers in one of the two clones (nΔhemX =13,150, nΔybaB =12,313, nΔclpA =12,950, nΔmrcB =12,604, nΔfur =12,543, nΔmlaA =12,559, nΔlpp =12,719; all proteins, all temperatures). (f) Polymerase chain reaction of the promoter region of the flhDC operon (schematic on top) demonstrates the presence of insertions in mutant clones (gel on bottom, n=1; for gel source data see Supplementary Figure 2) with high flagellar protein expression (FliC fold-changes at the two lowest temperatures of each mutant replicate used as a proxy for abundance). (g) Scatter plot of abundance and thermal stability z-scores of all proteins in all mutants (n=170,150). r depicts Pearson correlation. (h) Distribution of the number of mutants in which a protein is significantly altered (n=1,764 proteins). Box plots are depicted as in Figure 2a. (i) Distribution of the number of proteins that are significantly altered in each mutant (n=121 mutants). Box plots are depicted as in Figure 2a.
Extended Data Figure 2. Cellular processes targeted in this study and changes in thermal stability reflect protein complex architecture in E. coli mutants.
(a) Distribution of cellular processes targeted in this study compared to the general distribution of the E. coli genome using Clusters of Orthologous Groups (COG) (b-c) Schematic representation of protein complexes targeted by genetic perturbations in this study. Protein missing (encoded by gene deleted) is highlighted by a dashed line and other complex members are colored according to their thermal stability (b) or abundance (c) in that mutant. *|z-score| >1.96 and with q-value ≤0.05. ΔtolC data come from Mateus et al. 20 .
Extended Data Figure 3. Protein co-expression patterns provide insight into gene expression regulation.
(a) Correlation of DegP and OmpF log2 fold-changes to control in each of the genetic perturbations probed here (n=120, since OmpF is not detected in ΔompF) at each temperature (color coded; n=10). Mutants that lead to cell envelope stress (highlighted), and therefore activation of stress response (see also panel b) lead to upregulation of DegP and downregulation of OmpF. (b) Schematic representation of regulation of degP and ompF genes. CpxAR two-component system regulates both genes, while EnvZ/OmpR regulates only ompF. Heatmap shows Spearman’s rank correlation (calculated as in Figure 3a) for proteins involved in regulation of degP and ompF.
Extended Data Figure 4. Cofactor binding leads to changes in protein thermal stability.
(a) Distribution of thermal stability z-scores of all proteins in the iron-sulfur cluster biosynthesis mutants, ΔiscA, ΔiscS, and ΔiscU according to their gene ontology annotation as iron-sulfur cluster binding proteins (nΔiscA =41, nΔiscS =41, nΔiscU =40) or not (nΔiscA =1,400, nΔiscS =1,415, nΔiscU =1,314). Box plots are depicted as in Figure 2a. Significance assessed with two-sided Wilcoxon signed-rank test (p ΔiscA =3.9· 10-5, p ΔiscS =9.5·10-11, p ΔiscU =7.7·10-5). (b) Volcano plot showing proteins that significantly change in their thermal stability (highlighted in red) in ΔtatB shows that CueO is thermally destabilized. (c) Total and periplasmic protein extraction of different CueO constructs shows that deletion of Tat signal peptide (Δ28) and full-length construct in ΔtatB retain CueO protein levels, but only a small fraction makes it to the periplasm. CueO was detected using mouse monoclonal anti-FLAG antibody (F3165, Merck) and goat anti-mouse IgG-HRP (sc-2005, Santa Cruz Biotechnology) (n=1). An SDS-PAGE gel was run in parallel and stained with Coomassie to ensure that periplasmic extraction was successful (n=1). (d) Cellular thermal shift assay (CETSA) of CueO fused to FLAG peptide, either using the full length protein (WT) or a version lacking the first 28 aminoacids (Δ28; corresponding to the Tat signal peptide). Experiments performed in living cells in ΔcueO strain. CueO was detected using mouse monoclonal anti-FLAG antibody (F3165, Merck) and goat anti-mouse IgG-HRP (sc-2005, Santa Cruz Biotechnology) (n=1). As a loading control, run on the same gel, rabbit anti-LpoB antibody 3 and goat anti-rabbit IgG-HRP (sc-2004, Santa Cruz Biotechnology) were used (n=1). (e) As in panel d, but comparing the thermal stability of CueO fused to FLAG peptide, either in ΔcueO (WT) or ΔcueOΔtatB (Δ) live cells (n=1). (f) As in panel d, but comparing thermal stability of Δ28-CueO in ΔcueO strain and full length CueO in ΔcueOΔtatB (n=1). (g) CETSA of Δ28-CueO in lysate of ΔcueO strain upon addition of 4 mM CuCl2 or the same volume of vehicle (n=1). For gel source data see Supplementary Figure 2.
Extended Data Figure 5. Thermal stability changes of essential proteins.
(a) log2 fold-change of FtsK protein levels in each mutant compared to control at each temperature. FtsK is strongly thermally destabilized in the ΔphoP mutant and the ftsK knockdown is synthetically lethal with the phoP deletion (Figure 2d). (b) As in panel a for parC. ParC is strongly thermally stabilized in the ΔclpS mutant and thermally destabilized in the ΔphoP mutant and the parC knockdown is synthetically lethal with both. Synthetic lethality is also apparent in the ΔahpC, ΔamiA and ΔenvC mutants, despite the absence in changes in ParC thermal stability (Figure 2e).
Extended Data Figure 6. Protein correlation profiling recapitulates known biological interactions with abundance and thermal stability data having different contribution to functional associations.
(a) Distribution of Spearman’s rank correlation of all protein pair comparisons compared to known operons, protein complexes, and metabolic pathways. Distribution statistics refer to all protein pairs. (b) ROC analysis based on the decreasing absolute Spearman’s rank correlation compared to interactions in STRING database at different cut-offs of the combined STRING score. (c-e) Spearman’s rank correlation of protein pairs belonging to the same operon (c), protein complex (d), or metabolic pathway (e) using solely abundance changes (x-axis) or thermal stability changes (y-axis). Protein pairs belonging to the same operon are highlighted in purple. Distribution of Spearman’s rank correlation are shown outside the axes. n=446 for operons, n=348 for protein complexes, and n=801 for metabolic pathways. Proteins belonging to the same operon or complex mostly have coordinated abundance changes, while proteins belonging to the same pathway have also often coordinated thermal stability. (f) Schematic representation of UDP-N-acetylmuramoyl-pentapeptide biosynthesis pathway. (g) Example of protein pair (DdlA and MurC) co-changing in their thermal stability (rS=0.79), but not abundance (rS=-0.13) across 81 genetic perturbations. Each data point corresponds to the abundance or thermal stability z-score in one of the genetic perturbations (color coded). (h) Heatmap of Spearman’s rank correlation of all quantified members of UDP-N-acetylmuramoyl-pentapeptide biosynthesis pathway based on co-changes in abundance (upper triangle) or thermal stability alone (lower triangle).
Extended Data Figure 7. Protein correlation profiling reflects substructures of protein complexes.
(a) Heatmap of Spearman’s rank correlation (lower triangle; based on protein abundance and thermal stability data across 121 mutants, as in Figure 3a) and the physical distance (upper triangle; based on ribosome structure, PDB: 4YBB, and using the centers of mass of each protein) between the ribosome members. At the bottom, 30S and 50S ribosomal subunits are shown in purple and green, respectively, and lower triangle data are clustered hierarchically. (b-c) High resolution structure of the ribosome colored according to the heatmap clusters from panel a (b) or 30S and 50S ribosomal subunits (c). (d-g) ATP synthase members (d-e; PDB: 5T4O) and respiratory complex I (f-g; PDB: 4HEA), as in panels a-c. (h) Closely located members of protein complexes are more likely to be similarly regulated across different conditions. Spearman’s rank correlation plotted against the distance between complex subunits for the three complexes represented in the figure, with an apparent negative correlation. Box plots are depicted as in Figure 2a.
Extended Data Figure 8. GO enrichments of co-changing partners of proteins of unknown function can reveal their function.
Examples of links between proteins of unknown function and GO terms that their co-changing proteins are enriched in. Some of these links are supported by external evidence (node color, see Supplementary Discussion). Edges are colored according to the enrichment p-value using the Fisher’s exact test after correction for multiple comparison with the Benjamini-Hochberg procedure.
Extended Data Figure 9. Metabolite levels correlate with thermal stability of enzyme producing or using the metabolite.
(a-b) Scatter plot of metabolite log2 fold-changes in mutant compared to wildtype strain (y axis) and protein abundance (a) or thermal stability (b) in each mutant for enzymes that directly interact with the metabolite (x-axis) (n=19 mutants, except for G6P/F6P–PhoA (n=7), 2-oxoglutarate– SucA (n=18), Succinate–SdhD (n=12), Malate–FumA (n=6), and Malate–FumB (n=12)). r depicts the Pearson correlation coefficient for each metabolite-enzyme pair. Black line represents the linear fit and grey shades the 95% confidence interval of the fit. (c) Twenty strains used for targeted metabolomics analysis. (d) Distribution of Pearson correlation coefficients for metabolite levels in each mutant and abundance or thermal stability of enzymes that directly interact with the metabolite (upstream and downstream of metabolite, as in panels a and b). Box plots are depicted as in Figure 2a. With all data represented on top of the box plots (nG6P/F6P=6, nPEP =5, nPyruvate=8, n2-oxoglutarate=4, nSuccinate=6, nMalate=9).
Extended Data Figure 10. Protein abundance and thermal stability changes explain growth phenotypes of E. coli mutants.
(a) Scatter plot of number of significantly affected proteins (abundance or thermal stability) in each mutant (x-axis) and the number of significant growth phenotypes of the same mutant (y-axis; data from Herrera-Dominguez 12 ). p refers to the correlation p-value and n to the number of mutants. (b) Scatter plot of MdtK abundance in mutants profiled in this study and their sensitivity to 80 mM metformin 12 (r=0.44; n=119 mutants). (c-d) Spot assay for the indicated strains overexpressing mdtK, ahpC or cpxA, or a control empty plasmid in plates containing 0-80 mM metformin. Cells were diluted to OD578=0.5, serially diluted in 10-fold steps, and spotted on LB agar plates containing 10 μg/ml tetracycline (to maintain plasmid), 0.1 mM IPTG (to induce expression of encoded gene), and metformin as indicated. (e) As in panel b, but showing correlation of RecR abundance and UV exposure for 18 s (r=0.53; n=99 mutants). (f) Schematic representation of the ybaB-recR operon and protein abundance scores in the ΔybaB mutant. (g) Spot assay for the indicated strains overexpressing ybaB, recR, or a control empty plasmid after exposure to UV with a total energy of 85 mJ/cm2 or control non-exposed plate. Cells were diluted to OD578=0.1 and then serially diluted in 10-fold steps, and spotted on LB agar plates containing 50 μg/ml ampicillin (to maintain plasmid) and 0.1 mM IPTG (to induce expression of encoded gene).
Supplementary Material
Acknowledgements
We thank Prasad Phapale (EMBL Metabolomics Core Facility) for help with metabolomics analysis, and Hannes Link and David Bikard for strains and plasmids for the dCas9 work. This work was supported by the European Molecular Biology Laboratory. AM and KM were supported by a fellowship from the EMBL Interdisciplinary Postdoc (EI3POD) programme under Marie Skłodowska-Curie Actions COFUND (grant number 664726). CVG is recipient of an EMBO long-term postdoctoral fellowship and an add-on fellowship from the Christiane Nüsslein-Volhard-Stiftung. AT is supported by an ERC consolidator grant, uCARE.
Footnotes
Author contributions
A.M., N.K., F.S., M.M.S. and A.T. designed the study. A.M. and J.H. performed the thermal proteome profiling experiments. A.M., J.H. and D.H. performed the proteomics mass spectrometry analysis. A.M., and K.M performed the metabolomics mass spectrometry analysis. A.M., J.B., M.S., C.V.G. performed follow-up molecular work: flhDC (A.M.), CueO (A.M. and J.B.), CRISPRi (A.M. and M.S.), MdtK and RecR (A.M., M.S. and J.B.), other genetics and biochemistry (A.M., J.B., and C.V.G.). A.M., N.K. and F.S. performed the data analysis. A.M., A.T. and M.M.S. drafted the manuscript, which was reviewed and edited by all authors. A.T. and M.M.S. supervised the study.
The authors declare no competing interests.
Reprints and permissions information is available at www.nature.com/reprints
Data availability
The mass spectrometry proteomics data have been deposited to the ProteomeXchange Consortium via the PRIDE partner repository with the dataset identifier PXD016589. The mass spectrometry metabolomics data have been deposited to the MassIVE repository with the dataset identifier MSV000084632.
Data for protein complexes, pathways, and operons was retrieved from Ecocyc v21.1 (https://ecocyc.org/) 56 . STRING database v10.5 was used (https://string-db.org/) 57 . Data referring to protein localization was retrieved from STEPdb v1.0 (http://stepdb.eu/) 61 . Cellular processes targeted by mutants in this study were derived from Clusters of Orthologous Groups (COG) database (https://www.ncbi.nlm.nih.gov/research/cog-project/) 62 . Gene ontology annotations (release: 2020-01-01) were downloaded from http://geneontology.org.
Code availability
The code to process raw mass spectrometry data (available at PRIDE partner repository with the dataset identifier PXD016589) and to calculate abundance and thermal stability scores and q-values (Supplementary Data 3) is available at https://github.com/fstein/EcoliTPP.
References
- 1.Beltrao P, Cagney G, Krogan NJ. Quantitative genetic interactions reveal biological modularity. Cell. 2010;141:739–745. doi: 10.1016/j.cell.2010.05.019. [DOI] [PMC free article] [PubMed] [Google Scholar]
- 2.Costanzo M, et al. Global Genetic Networks and the Genotype-to-Phenotype Relationship. Cell. 2019;177:85–100. doi: 10.1016/j.cell.2019.01.033. [DOI] [PMC free article] [PubMed] [Google Scholar]
- 3.Typas A, et al. Regulation of peptidoglycan synthesis by outer-membrane proteins. Cell. 2010;143:1097–1109. doi: 10.1016/j.cell.2010.11.038. [DOI] [PMC free article] [PubMed] [Google Scholar]
- 4.Gray AN, et al. Coordination of peptidoglycan synthesis and outer membrane constriction during Escherichia coli cell division. Elife. 2015;4 doi: 10.7554/eLife.07118. [DOI] [PMC free article] [PubMed] [Google Scholar]
- 5.Surma MA, et al. A lipid E-MAP identifies Ubx2 as a critical regulator of lipid saturation and lipid bilayer stress. Mol Cell. 2013;51:519–530. doi: 10.1016/j.molcel.2013.06.014. [DOI] [PMC free article] [PubMed] [Google Scholar]
- 6.Collins SR, et al. Functional dissection of protein complexes involved in yeast chromosome biology using a genetic interaction map. Nature. 2007;446:806–810. doi: 10.1038/nature05649. [DOI] [PubMed] [Google Scholar]
- 7.Nichols RJ, et al. Phenotypic landscape of a bacterial cell. Cell. 2011;144:143–156. doi: 10.1016/j.cell.2010.11.052. [DOI] [PMC free article] [PubMed] [Google Scholar]
- 8.Costanzo M, et al. A global genetic interaction network maps a wiring diagram of cellular function. Science. 2016;353 doi: 10.1126/science.aaf1420. [DOI] [PMC free article] [PubMed] [Google Scholar]
- 9.Price MN, et al. Mutant phenotypes for thousands of bacterial genes of unknown function. Nature. 2018;557:503–509. doi: 10.1038/s41586-018-0124-0. [DOI] [PubMed] [Google Scholar]
- 10.Kritikos G, et al. A tool named Iris for versatile high-throughput phenotyping in microorganisms. Nat Microbiol. 2017;2:17014. doi: 10.1038/nmicrobiol.2017.14. [DOI] [PMC free article] [PubMed] [Google Scholar]
- 11.Savitski MM, et al. Tracking cancer drugs in living cells by thermal profiling of the proteome. Science. 2014;346:1255784. doi: 10.1126/science.1255784. [DOI] [PubMed] [Google Scholar]
- 12.Herrera-Dominguez L, Typas A. 2020. https://ecoli-darkgen.shinyapps.io/app-1/
- 13.Babu M, et al. Global landscape of cell envelope protein complexes in Escherichia coli. Nat Biotechnol. 2018;36:103–112. doi: 10.1038/nbt.4024. [DOI] [PMC free article] [PubMed] [Google Scholar]
- 14.Wan C, et al. Panorama of ancient metazoan macromolecular complexes. Nature. 2015;525:339–344. doi: 10.1038/nature14877. [DOI] [PMC free article] [PubMed] [Google Scholar]
- 15.Tan CSH, et al. Thermal proximity coaggregation for system-wide profiling of protein complex dynamics in cells. Science. 2018;359:1170–1177. doi: 10.1126/science.aan0346. [DOI] [PubMed] [Google Scholar]
- 16.Martinez Molina D, et al. Monitoring drug target engagement in cells and tissues using the cellular thermal shift assay. Science. 2013;341:84–87. doi: 10.1126/science.1233606. [DOI] [PubMed] [Google Scholar]
- 17.Bantscheff M, Lemeer S, Savitski MM, Kuster B. Quantitative mass spectrometry in proteomics: critical review update from 2007 to the present. Anal Bioanal Chem. 2012;404:939–965. doi: 10.1007/s00216-012-6203-4. [DOI] [PubMed] [Google Scholar]
- 18.Mateus A, et al. Thermal proteome profiling for interrogating protein interactions. Mol Syst Biol. 2020;16:e9232. doi: 10.15252/msb.20199232. [DOI] [PMC free article] [PubMed] [Google Scholar]
- 19.Sridharan S, Günthner I, Becher I, Savitski M, Bantscheff M. Mass Spectrometry-Based Chemical Proteomics. 2019. pp. 267–291.
- 20.Mateus A, et al. Thermal proteome profiling in bacteria: probing protein state in vivo. Mol Syst Biol. 2018;14:e8242. doi: 10.15252/msb.20188242. [DOI] [PMC free article] [PubMed] [Google Scholar]
- 21.Becher I, et al. Pervasive Protein Thermal Stability Variation during the Cell Cycle. Cell. 2018;173:1495–1507.:e1418. doi: 10.1016/j.cell.2018.03.053. [DOI] [PMC free article] [PubMed] [Google Scholar]
- 22.Huang JX, et al. High throughput discovery of functional protein modifications by Hotspot Thermal Profiling. Nature Methods. 2019 doi: 10.1038/s41592-019-0499-3. [DOI] [PMC free article] [PubMed] [Google Scholar]
- 23.Potel CM, et al. Impact of phosphorylation on thermal stability of proteins. bioRxiv. 2020:2020.2001.2014.903849. doi: 10.1101/2020.01.14.903849. [DOI] [Google Scholar]
- 24.Smith IR, et al. Identification of phosphosites that alter protein thermal stability. bioRxiv. 2020:2020.2001.2014.904300. doi: 10.1101/2020.01.14.904300. [DOI] [PMC free article] [PubMed] [Google Scholar]
- 25.Becher I, et al. Thermal profiling reveals phenylalanine hydroxylase as an off-target of panobinostat. Nat Chem Biol. 2016;12:908–910. doi: 10.1038/nchembio.2185. [DOI] [PubMed] [Google Scholar]
- 26.Baba T, et al. Construction of Escherichia coli K-12 in-frame, single-gene knockout mutants: the Keio collection. Mol Syst Biol. 2006;2:2006 0008. doi: 10.1038/msb4100050. [DOI] [PMC free article] [PubMed] [Google Scholar]
- 27.Werner T, et al. Ion coalescence of neutron encoded TMT 10-plex reporter ions. Anal Chem. 2014;86:3594–3601. doi: 10.1021/ac500140s. [DOI] [PubMed] [Google Scholar]
- 28.Parker DJ, Demetci P, Li GW. Rapid Accumulation of Motility-Activating Mutations in Resting Liquid Culture of Escherichia coli. J Bacteriol. 2019;201 doi: 10.1128/JB.00259-19. [DOI] [PMC free article] [PubMed] [Google Scholar]
- 29.Palmer T, Berks BC. The twin-arginine translocation (Tat) protein export pathway. Nat Rev Microbiol. 2012;10:483–496. doi: 10.1038/nrmicro2814. [DOI] [PubMed] [Google Scholar]
- 30.Koo BM, et al. Construction and Analysis of Two Genome-Scale Deletion Libraries for Bacillus subtilis. Cell Syst. 2017;4:291–305.:e297. doi: 10.1016/j.cels.2016.12.013. [DOI] [PMC free article] [PubMed] [Google Scholar]
- 31.Qi LS, et al. Repurposing CRISPR as an RNA-guided platform for sequence-specific control of gene expression. Cell. 2013;152:1173–1183. doi: 10.1016/j.cell.2013.02.022. [DOI] [PMC free article] [PubMed] [Google Scholar]
- 32.Lawson MJ, et al. In situ genotyping of a pooled strain library after characterizing complex phenotypes. Mol Syst Biol. 2017;13:947. doi: 10.15252/msb.20177951. [DOI] [PMC free article] [PubMed] [Google Scholar]
- 33.Peters JM, et al. A Comprehensive, CRISPR-based Functional Analysis of Essential Genes in Bacteria. Cell. 2016;165:1493–1506. doi: 10.1016/j.cell.2016.05.003. [DOI] [PMC free article] [PubMed] [Google Scholar]
- 34.Kustatscher G, et al. Co-regulation map of the human proteome enables identification of protein functions. Nat Biotechnol. 2019;37:1361–1371. doi: 10.1038/s41587-019-0298-5. [DOI] [PMC free article] [PubMed] [Google Scholar]
- 35.Romanov N, et al. Disentangling Genetic and Environmental Effects on the Proteotypes of Individuals. Cell. 2019;177:1308–1318.:e1310. doi: 10.1016/j.cell.2019.03.015. [DOI] [PMC free article] [PubMed] [Google Scholar]
- 36.Havugimana PC, et al. A census of human soluble protein complexes. Cell. 2012;150:1068–1081. doi: 10.1016/j.cell.2012.08.011. [DOI] [PMC free article] [PubMed] [Google Scholar]
- 37.Lalanne JB, et al. Evolutionary Convergence of Pathway-Specific Enzyme Expression Stoichiometry. Cell. 2018;173:749–761.:e738. doi: 10.1016/j.cell.2018.03.007. [DOI] [PMC free article] [PubMed] [Google Scholar]
- 38.Ghatak S, King ZA, Sastry A, Palsson BO. The y-ome defines the 35% of Escherichia coli genes that lack experimental evidence of function. Nucleic Acids Res. 2019;47:2446–2454. doi: 10.1093/nar/gkz030. [DOI] [PMC free article] [PubMed] [Google Scholar]
- 39.Mateus A, Maatta TA, Savitski MM. Thermal proteome profiling: unbiased assessment of protein state through heat-induced stability changes. Proteome Sci. 2016;15:13. doi: 10.1186/s12953-017-0122-4. [DOI] [PMC free article] [PubMed] [Google Scholar]
- 40.Shiver AL, et al. A Chemical-Genomic Screen of Neglected Antibiotics Reveals Illicit Transport of Kasugamycin and Blasticidin S. PLoS Genet. 2016;12:e1006124. doi: 10.1371/journal.pgen.1006124. [DOI] [PMC free article] [PubMed] [Google Scholar]
- 41.Rousset F, et al. Genome-wide CRISPR-dCas9 screens in E. coli identify essential genes and phage host factors. PLoS Genet. 2018;14:e1007749. doi: 10.1371/journal.pgen.1007749. [DOI] [PMC free article] [PubMed] [Google Scholar]
- 42.Liu X, et al. High-throughput CRISPRi phenotyping identifies new essential genes in Streptococcus pneumoniae. Mol Syst Biol. 2017;13:931. doi: 10.15252/msb.20167449. [DOI] [PMC free article] [PubMed] [Google Scholar]
- 43.Aoki SK, et al. Contact-dependent growth inhibition requires the essential outer membrane protein BamA (YaeT) as the receptor and the inner membrane transport protein AcrB. Mol Microbiol. 2008;70:323–340. doi: 10.1111/j.1365-2958.2008.06404.x. [DOI] [PMC free article] [PubMed] [Google Scholar]
- 44.Bernard CS, Sadasivam M, Shiomi D, Margolin W. An altered FtsA can compensate for the loss of essential cell division protein FtsN in Escherichia coli. Mol Microbiol. 2007;64:1289–1305. doi: 10.1111/j.1365-2958.2007.05738.x. [DOI] [PMC free article] [PubMed] [Google Scholar]
- 45.Malinverni JC, et al. YfiO stabilizes the YaeT complex and is essential for outer membrane protein assembly in Escherichia coli. Mol Microbiol. 2006;61:151–164. doi: 10.1111/j.1365-2958.2006.05211.x. [DOI] [PubMed] [Google Scholar]
- 46.Sampson BA, Misra R, Benson SA. Identification and characterization of a new gene of Escherichia coli K-12 involved in outer membrane permeability. Genetics. 1989;122:491–501. doi: 10.1093/genetics/122.3.491. [DOI] [PMC free article] [PubMed] [Google Scholar]
- 47.Grenier F, Matteau D, Baby V, Rodrigue S. Complete Genome Sequence of Escherichia coli BW25113. Genome Announc. 2014;2 doi: 10.1128/genomeA.01038-14. [DOI] [PMC free article] [PubMed] [Google Scholar]
- 48.Hughes CS, et al. Ultrasensitive proteome analysis using paramagnetic bead technology. Mol Syst Biol. 2014;10:757. doi: 10.15252/msb.20145625. [DOI] [PMC free article] [PubMed] [Google Scholar]
- 49.Hughes CS, et al. Single-pot, solid-phase-enhanced sample preparation for proteomics experiments. Nat Protoc. 2019;14:68–85. doi: 10.1038/s41596-018-0082-x. [DOI] [PubMed] [Google Scholar]
- 50.Franken H, et al. Thermal proteome profiling for unbiased identification of direct and indirect drug targets using multiplexed quantitative mass spectrometry. Nat Protoc. 2015;10:1567–1593. doi: 10.1038/nprot.2015.101. [DOI] [PubMed] [Google Scholar]
- 51.Huber W, von Heydebreck A, Sultmann H, Poustka A, Vingron M. Variance stabilization applied to microarray data calibration and to the quantification of differential expression. Bioinformatics. 2002;18 Suppl 1:S96–104. doi: 10.1093/bioinformatics/18.suppl_1.s96. [DOI] [PubMed] [Google Scholar]
- 52.Ritchie ME, et al. limma powers differential expression analyses for RNA-sequencing and microarray studies. Nucleic Acids Res. 2015;43:e47. doi: 10.1093/nar/gkv007. [DOI] [PMC free article] [PubMed] [Google Scholar]
- 53.Cui L, et al. A CRISPRi screen in E. coli reveals sequence-specific toxicity of dCas9. Nat Commun. 2018;9:1912. doi: 10.1038/s41467-018-04209-5. [DOI] [PMC free article] [PubMed] [Google Scholar]
- 54.Haeussler M, et al. Evaluation of off-target and on-target scoring algorithms and integration into the guide RNA selection tool CRISPOR. Genome Biol. 2016;17:148. doi: 10.1186/s13059-016-1012-2. [DOI] [PMC free article] [PubMed] [Google Scholar]
- 55.Robin X, et al. pROC: an open-source package for R and S+ to analyze and compare ROC curves. BMC Bioinformatics. 2011;12:77. doi: 10.1186/1471-2105-12-77. [DOI] [PMC free article] [PubMed] [Google Scholar]
- 56.Keseler IM, et al. The EcoCyc database: reflecting new knowledge about Escherichia coli K-12. Nucleic Acids Res. 2017;45:D543–D550. doi: 10.1093/nar/gkw1003. [DOI] [PMC free article] [PubMed] [Google Scholar]
- 57.Szklarczyk D, et al. STRING v11: protein-protein association networks with increased coverage, supporting functional discovery in genome-wide experimental datasets. Nucleic Acids Res. 2019;47:D607–D613. doi: 10.1093/nar/gky1131. [DOI] [PMC free article] [PubMed] [Google Scholar]
- 58.Guzman LM, Belin D, Carson MJ, Beckwith J. Tight regulation, modulation, and high-level expression by vectors containing the arabinose PBAD promoter. J Bacteriol. 1995;177:4121–4130. doi: 10.1128/jb.177.14.4121-4130.1995. [DOI] [PMC free article] [PubMed] [Google Scholar]
- 59.Otsuka Y, et al. GenoBase: comprehensive resource database of Escherichia coli K-12. Nucleic Acids Res. 2015;43:D606–617. doi: 10.1093/nar/gku1164. [DOI] [PMC free article] [PubMed] [Google Scholar]
- 60.Saka K, et al. A complete set of Escherichia coli open reading frames in mobile plasmids facilitating genetic studies. DNA Res. 2005;12:63–68. doi: 10.1093/dnares/12.1.63. [DOI] [PubMed] [Google Scholar]
- 61.Orfanoudaki G, Economou A. Proteome-wide subcellular topologies of E. coli polypeptides database (STEPdb) Mol Cell Proteomics. 2014;13:3674–3687. doi: 10.1074/mcp.O114.041137. [DOI] [PMC free article] [PubMed] [Google Scholar]
- 62.Tatusov RL, Galperin MY, Natale DA, Koonin EV. The COG database: a tool for genome-scale analysis of protein functions and evolution. Nucleic Acids Res. 2000;28:33–36. doi: 10.1093/nar/28.1.33. [DOI] [PMC free article] [PubMed] [Google Scholar]
Associated Data
This section collects any data citations, data availability statements, or supplementary materials included in this article.
Supplementary Materials
Data Availability Statement
The mass spectrometry proteomics data have been deposited to the ProteomeXchange Consortium via the PRIDE partner repository with the dataset identifier PXD016589. The mass spectrometry metabolomics data have been deposited to the MassIVE repository with the dataset identifier MSV000084632.
Data for protein complexes, pathways, and operons was retrieved from Ecocyc v21.1 (https://ecocyc.org/) 56 . STRING database v10.5 was used (https://string-db.org/) 57 . Data referring to protein localization was retrieved from STEPdb v1.0 (http://stepdb.eu/) 61 . Cellular processes targeted by mutants in this study were derived from Clusters of Orthologous Groups (COG) database (https://www.ncbi.nlm.nih.gov/research/cog-project/) 62 . Gene ontology annotations (release: 2020-01-01) were downloaded from http://geneontology.org.
The code to process raw mass spectrometry data (available at PRIDE partner repository with the dataset identifier PXD016589) and to calculate abundance and thermal stability scores and q-values (Supplementary Data 3) is available at https://github.com/fstein/EcoliTPP.


