Abstract
Tissues acquire function and shape via differentiation and morphogenesis. Both processes are driven by coordinating cellular forces and shapes at the tissue scale, but general principles governing this interplay remain to be discovered. Here, we report that self-organization of myoblasts around integer topological defects, namely spirals and asters, suffices to establish complex multicellular architectures. In particular, these arrangements can trigger localized cell differentiation or, alternatively, when differentiation is inhibited, they can drive the growth of swirling protrusions. Both localized differentiation and growth of cellular vortices require specific stress patterns. By analyzing the experimental velocity and orientational fields through active gel theory, we show that integer topological defects can generate force gradients that concentrate compressive stresses. We reveal these gradients by assessing spatial changes in nuclear volume and deformations of elastic pillars. Altogether, we propose integer topological defects as mechanical organizing centers controlling differentiation and morphogenesis.
In materials, long-range order, robust shapes, and patterns can emerge from self-organization phenomena driven by interactions between particles, molecules, and atoms, rather than being imposed by external constrains. In active materials, additional energy-consuming processes generate forces that can self-organize to give rise to motion and shape. In tissues, the emergence of shapes arises from the coordination of cellular forces and is referred to as morphogenesis. By analogy, morphogenesis is thus thought to be driven by cellular self-organization. However, because development is under the tight control of genetics, discovering the nature of self-organization mechanisms involved in morphogenesis remains challenging, focusing the efforts of many creative studies1.
Akin to elongated molecules in liquid crystals2, elongated cells can self-organize into patterns featuring long-range orientational order3–6. Orientational fields may present topological defects, regions where the orientational order is ill-defined. Still, defects imply very specific orientational configurations around their cores2. In active systems – driven by internal energy-consuming processes – topological defects entail characteristic flow and stress patterns that depend on the defects’ topological strength s, which indicates the rotation of the orientational field along a path encircling the defect’s core2. In particular, active half-integer defects (s=±1/2) have been thoroughly studied7–14. Importantly, in cell monolayers, their position correlates with cell extrusion12 or changes in cell density13.
Integer topological defects in cell monolayers, such as vortices, spirals, or asters (s=+1), remain less characterized. Yet, they abound in nature, at cellular, tissue, and organismal scales15. Astral and spiral cellular patterns have been identified in fibroma16, brain tumor17, and corneal epithelia18, where they lead to abnormal cell aggregation in the defect core. Because of their symmetry, integer defects may play essential roles in organizing tissue architecture by stabilizing mechanical patterns. Indeed, integer defects colocalize with the mouth, tentacles and foot of hydra during its development19. In vitro, cellular integer defects have been generated by imposing their orientational patterns through cell substrate microstructuration20,21. Still, their dynamics and mechanics remain unknown, as well as the mechanisms by which active integer topological defects could directly contribute to remodeling tissues.
Formation of cellular spirals and asters
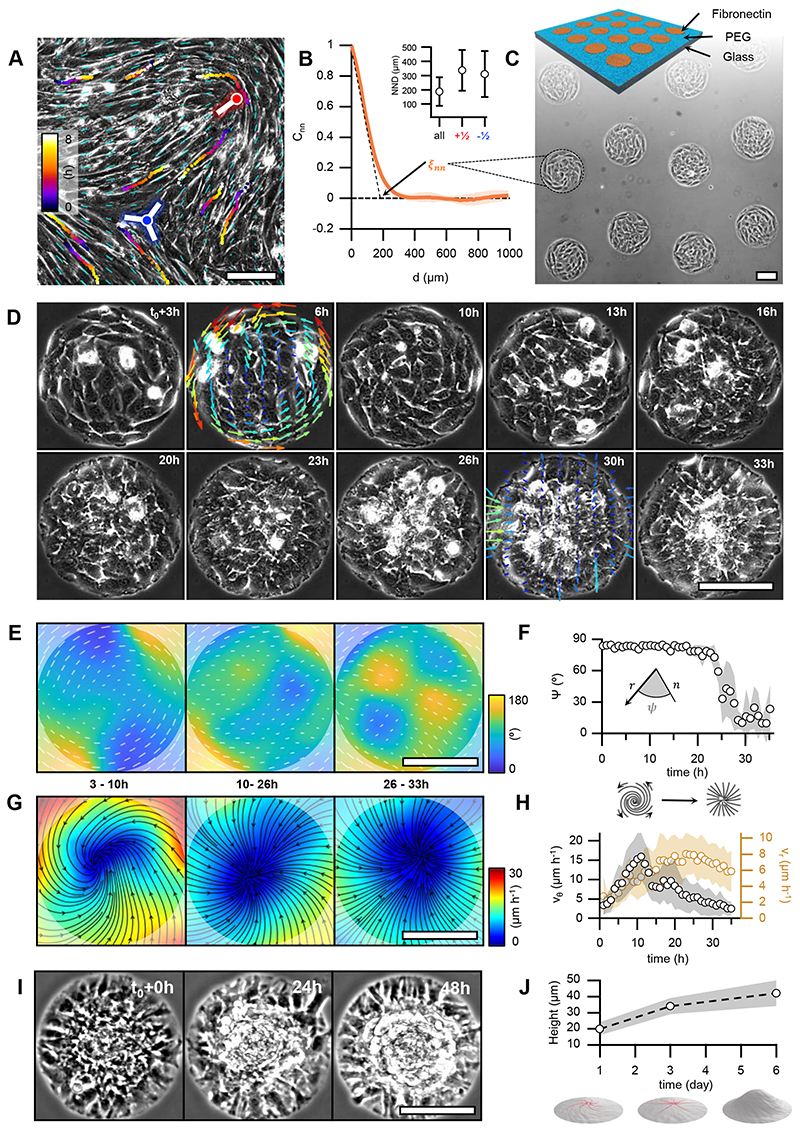
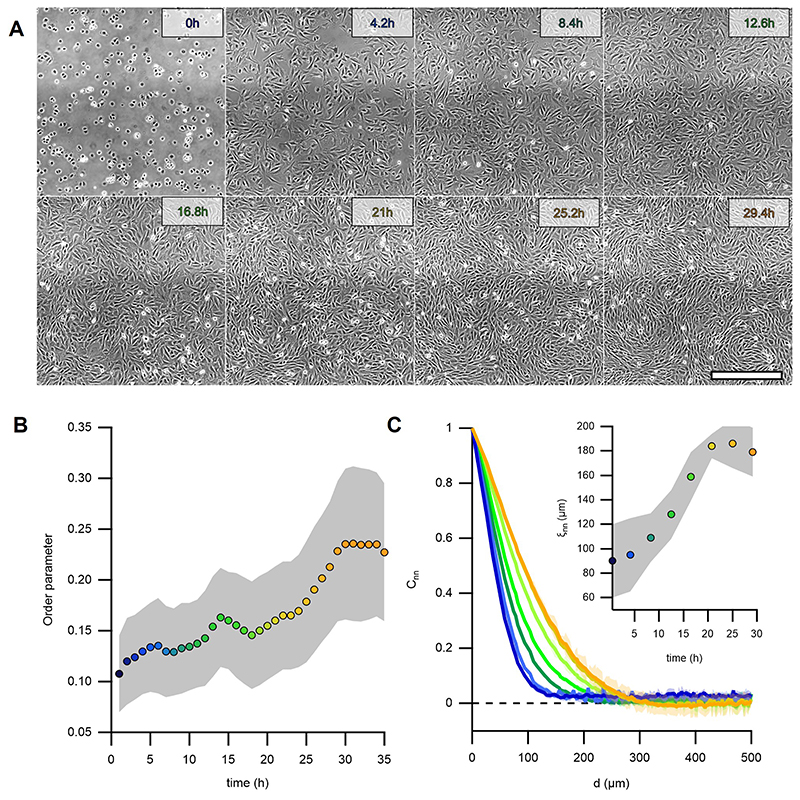
Here, we aimed at forming cellular integer topological defects to investigate their role in tissue morphogenesis. To this end, we used C2C12 myoblasts, which feature elongated shapes and can differentiate into myotubes, the precursors of skeletal muscle22. Confluent C2C12 cells formed collective alignment with long-range orientational order, referred to as nematic order (Fig.1A)5,14,23. Without confinement, they exhibited topological defects with charges s=±1/2 (Fig.1A and Methods)13,14. The spatial nematic correlation distance, ξnn, increased to 190±10μm 30h after cell platting (Fig.1B, Extended Data Fig.1 and Methods), which set a characteristic length for inter-defect spacing at initial stages (Fig.1B, inset, and Methods).
Figure 1. Myoblasts arrange into integer topological defects on circular micropatterns.
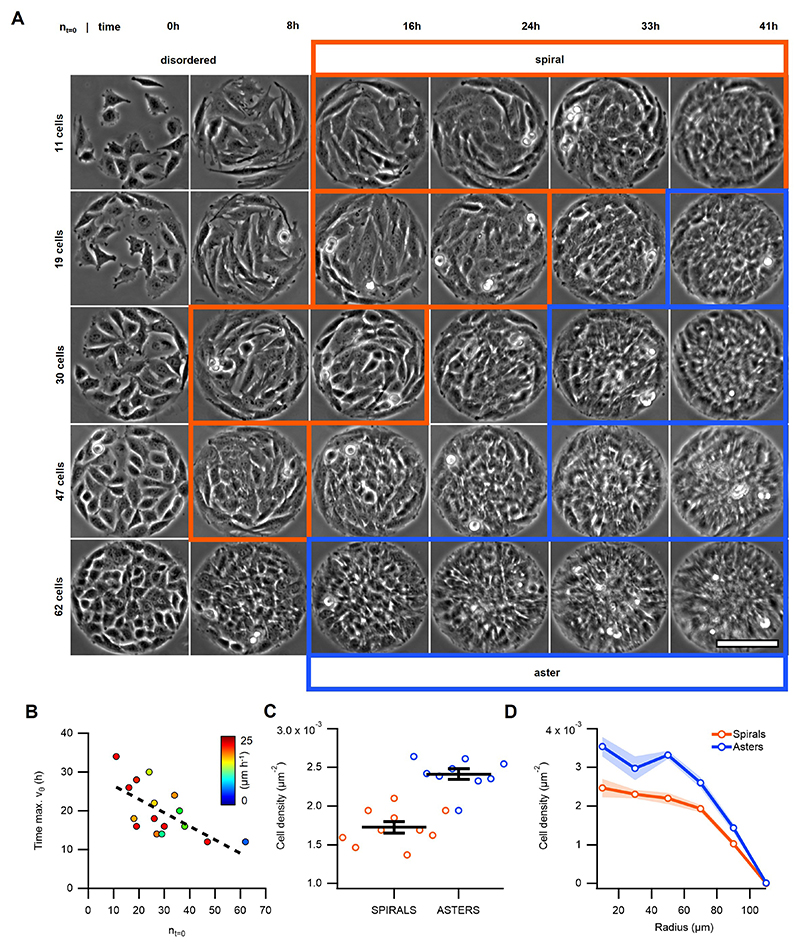
A, Phase contrast image of a confluent monolayer of myoblasts. Cyan dashes indicate the local orientational field. Positions of half-integer topological defects are shown (blue dot, s=-½; red dot, s=+½). Trajectories of single cells are depicted with color gradients. Colormap represents time. B, Spatial autocorrelation function Cnn of the orientational field. ξnn is the nematic correlation length. Inset: nearest neighbor distance (NND) between half-integer, +½ and -½ topological defects. C, Scheme of the micro-patterned surface and corresponding phase-contrast image with confined myoblasts in circular domains of radius r=100μm. D, Time series of a single myoblast disc (r=100μm). t=t0 at the onset of confluence. For clarity, velocity fields are only shown for 6 and 30h. The colormap depicts the local average speed. Colorbar in G. E, Time-averaged orientational field calculated from D (N=1). Vectors and colormap depict local cellular orientation with respect to the x-axis. The amplitude of the vectors corresponds to the coherency (see Methods). F, Mean value of angle 𝜓 between the local orientation and the radial direction over time (N=12). G, Time-averaged flow field calculated from D (N=1). Flow directions are shown as black streamlines. The colormap depicts the local average speed. In E and G, semi-transparent areas enclose a region corresponding to a circle with a radius of 100μm. H, Absolute values of the average azimuthal (vθ) and radial (vr) velocities over time (N=12). I, Time series of myoblast asters (r=100μm) forming cellular mounds. t=t0 at the onset of mound formation. J, Average height of myoblast assemblies with time (N=17, 10, 16, for mounds at 1, 3 and 6 days after the onset of confluence, respectively). In panels B and J, data are presented as mean values +/- SD. In panels F and H, data are presented as mean values +/- SE. Scale bars, 100μm.
Inspired by previous studies14,24–27, we reasoned that circular confinement of cells below ξnn would induce their self-organization around one single defect with s=+1. C2C12 myoblasts were thus seeded on fibronectin-coated discs (Fig.1C) with diameters of the order of ξnn. After reaching confluence, C2C12 cells self-organized into single-defect configurations featuring well-defined alignment and spontaneous flows. At low density, cells self-organized into spiral configurations with persistent rotation for several hours (Fig.1D-H, 3-10h). Further proliferation led to the transformation of spirals into asters (Fig.1D-H, 10-26h). In the latter, cells oriented radially from the center of the disc and ceased to rotate (Fig.1D-H, 26-33h, and Supplementary Video 1). In active nematic systems, transitions between spirals and asters have been theoretically predicted for changes in activity and elasticity28. In our experiments, the spiral-to-aster transition correlated with an increase in cell density (Extended Data Fig.2A-C) and was reversible, as expanding the confinement after aster formation reestablished the spiral arrangement (Supplementary Video 2). Further work is necessary to unveil the role of density gradients in spiral-to-aster transitions of active liquid crystals. Interestingly, both spiral and aster configurations exhibited accumulation of cells in their centers (Extended Data Fig.2D) and further proliferation in asters led to the formation of cellular mounds (Fig.1I,J and Supplementary Video 3). Growth of cellular mounds may also be controlled by nematic order and topological cues. To test this, we characterized the order and dynamics of spirals, asters, and mounds.
Orientation and dynamics of cellular spirals and asters
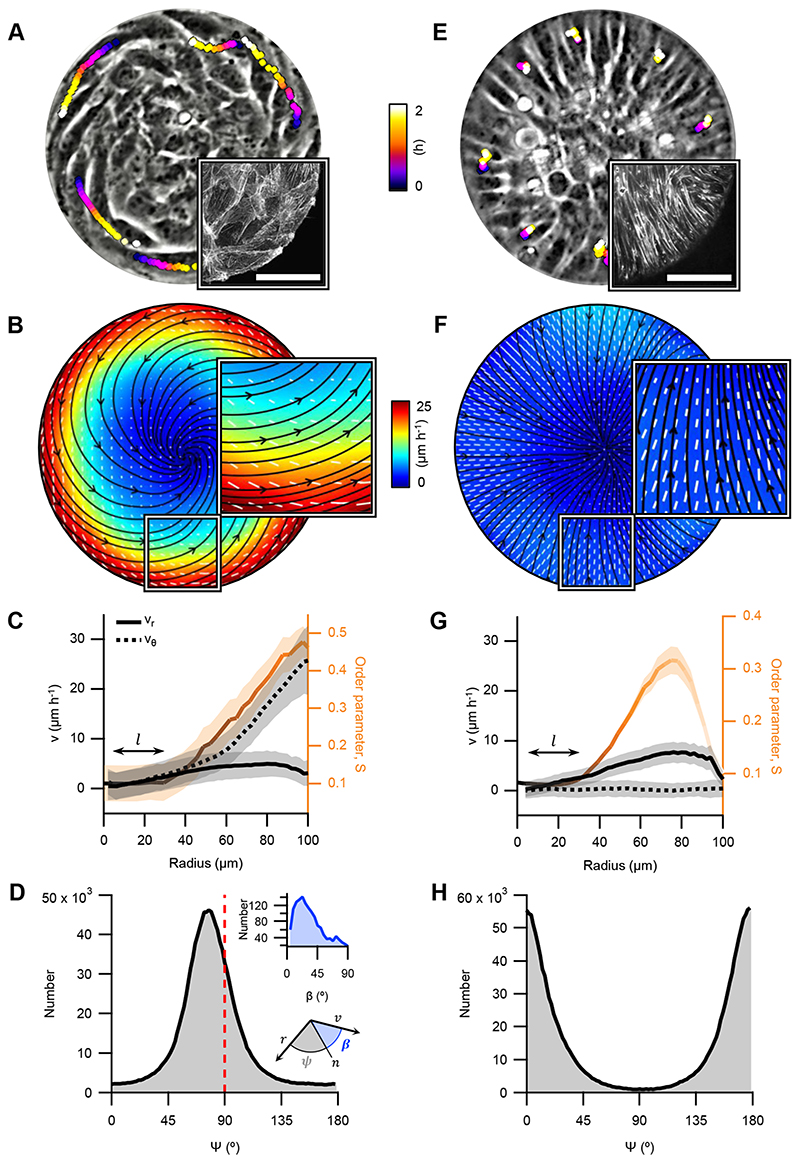
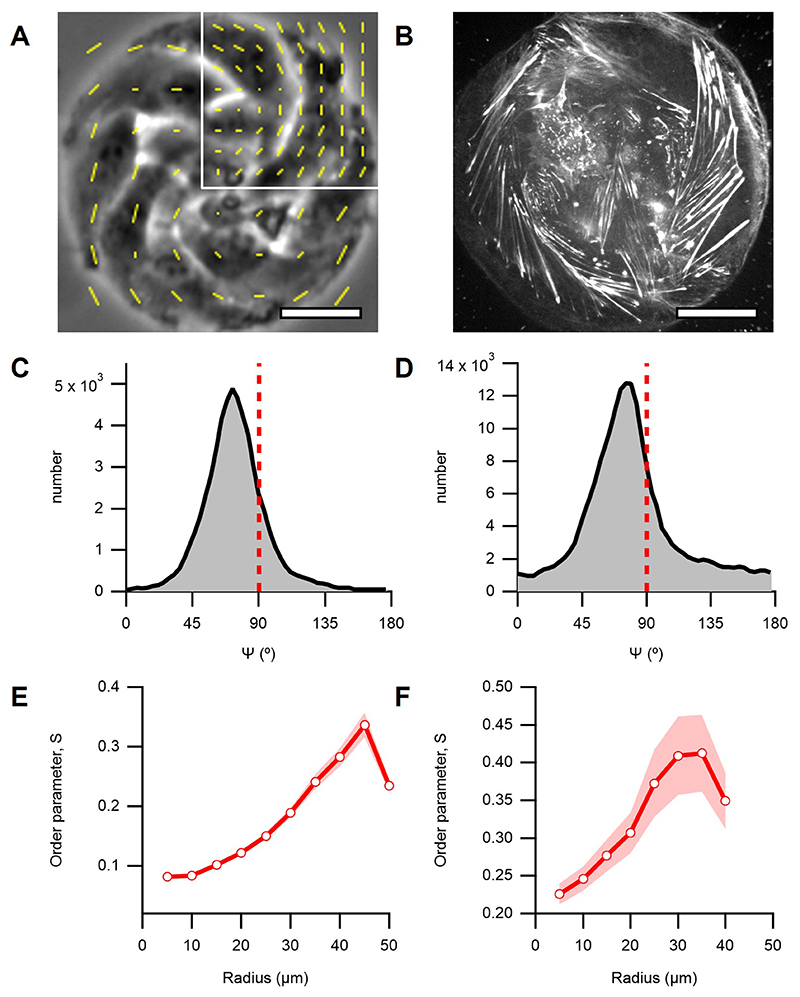
In order to stabilize spiral configurations, we inhibited proliferation with Mitomycin-C (Methods). We used OrientationJ29 to measure locally averaged orientational field from phase contrast images of Mitomycin-C-stabilized spirals (Fig.2A, Supplementary Video 4 and Methods). The order parameter S, which measures the degree of orientational order, was minimal at the discs center and increased towards their boundaries (Fig.2B,C and Methods). The angle 𝜓 between local orientation and the radial direction was 79±5° (N=12, Fig.2D and Methods). The orientational field extracted from fluorescence images of spirals labelled with SiR-actin (Methods) showed comparable 𝜓 distribution, nematic order profile, and rotation dynamics (Fig.2A, inset, Extended Data Fig.3 and Supplementary Video 5), supporting that the orientational field measured from phase contrast images is determined by actin structures.
Figure 2. Cellular spiral and aster configurations.
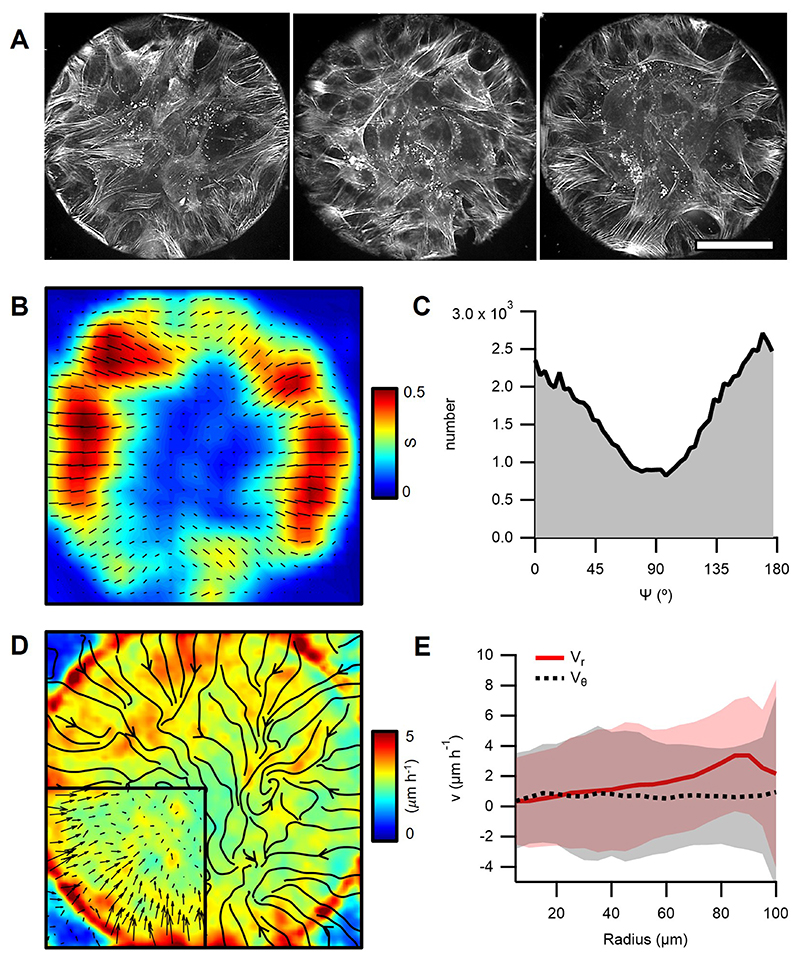
A and E, Phase contrast images of spiral and aster arrangements (r=100μm), respectively. Trajectories of single cells are depicted with color gradients. Colormap represents time. Insets: Confocal image of the actin fibers at the base of a spiral and an aster, respectively. Actin was stained with SiR-actin. Scale bars, 50μm. B and F, Average velocity, and orientation fields. Streamlines indicate the direction of the cellular flows. Colormap represents average speed. White lines indicate local cellular orientation, their length corresponds to the coherency (see Methods). C and G, Radial profiles of the average azimuthal (vθ, dashed black) and radial velocity (vr, solid black) components in absolute values, and the profiles of S (orange). l depicts the size of the defect core. Data are presented as mean values +/- SE. D and H, Distribution of the angle 𝜓. Insets: distribution of the angle β between the velocity and cell orientation calculated from B (D), illustration of the angles 𝜓 and β (H). Panels B, C and D correspond to spirals (N=12), and F, G and H to asters (N=43).
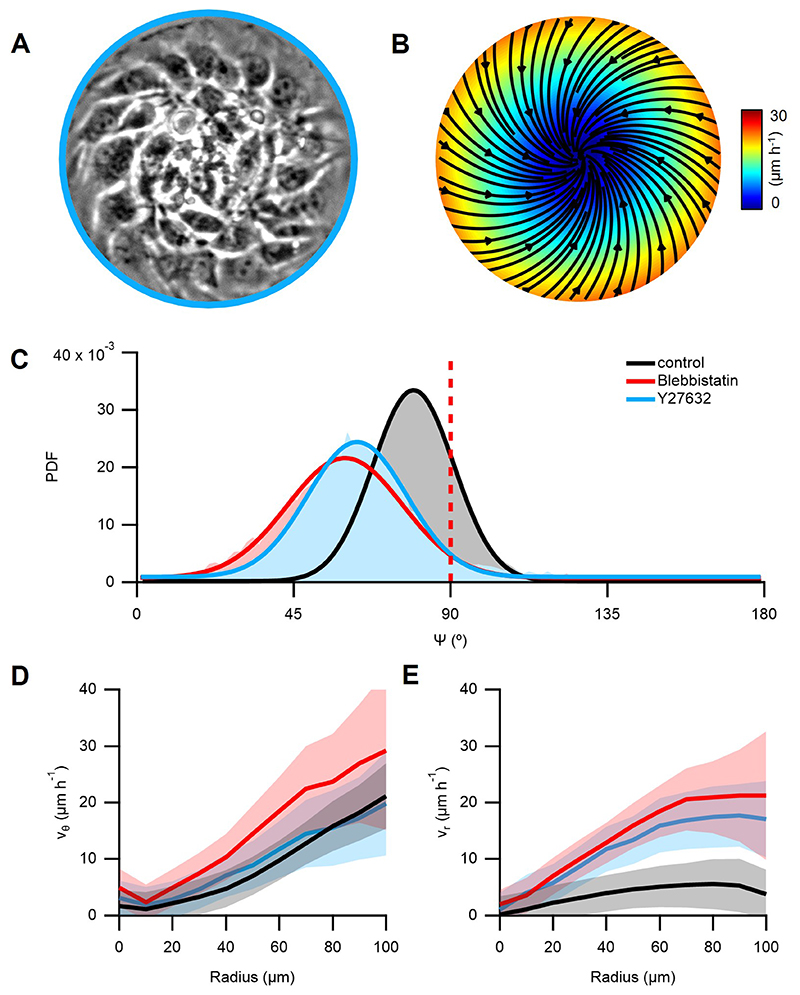
The average velocity field was extracted from phase contrast movies of spirals with particle image velocimetry30 (PIV, Methods). The velocity was maximal near boundaries at 27±7ºm/h, dominantly azimuthal, as was the direction of cell migration (Fig.2A), with non-vanishing radial component (Fig.2B,C, N=12). The angle between the local orientation and the velocity was β=23±5º (Fig.2D, inset, N=12), similar to monolayers of elongated cells confined to stripes23 or externally-sheared liquid crystal slabs2. Interestingly, when inhibiting myosin-driven contractility with either Blebbistatin or the ROCK inhibitor Y-27632 (Methods), we observed a significant impact on the spirals’ arrangement. Although rotation persisted, 𝜓 decreased to 60±5ºwith Blebbistatin (N=21) and to 63±4º with Y-27632 (N=20). Radial velocity substantially increased (Extended Data Fig.4). The decrease of 𝜓 in spirals as a result of partial inhibition of contractility is consistent with theory predicting transitions from spirals to asters driven by a decrease in activity28.
Above ~2.5·10-3cells/μm2 (N=13), C2C12 cells formed stable aster arrangements (Fig.2E and Supplementary Video 6). Like in spirals, S increased towards the boundaries, but both orientation and velocity were strictly radial (Fig.2E-H, Extended Data Fig.5). Fluorescence images of SiR-actin labelled asters revealed a radial disposition of actin fibers (Fig.2E, inset, Extended Data Fig.5 and Supplementary Video 7). The radial velocity component (Fig.2F,G) was comparable to that in spirals (Fig.2B,C). However, cells at the periphery remained almost immobile (Fig.2E and Supplementary Video 6). We thus suspected that the radial velocity originated from actin flows. PIV from images of SiR-actin labelled asters revealed net inward radial velocities similar to those observed by phase contrast microscopy (Fig.2E-H, Extended Data Fig.5, and Supplementary Video 7). These observations support that both the orientation and the velocity fields in asters are related to the morphology and dynamics of actin structures.
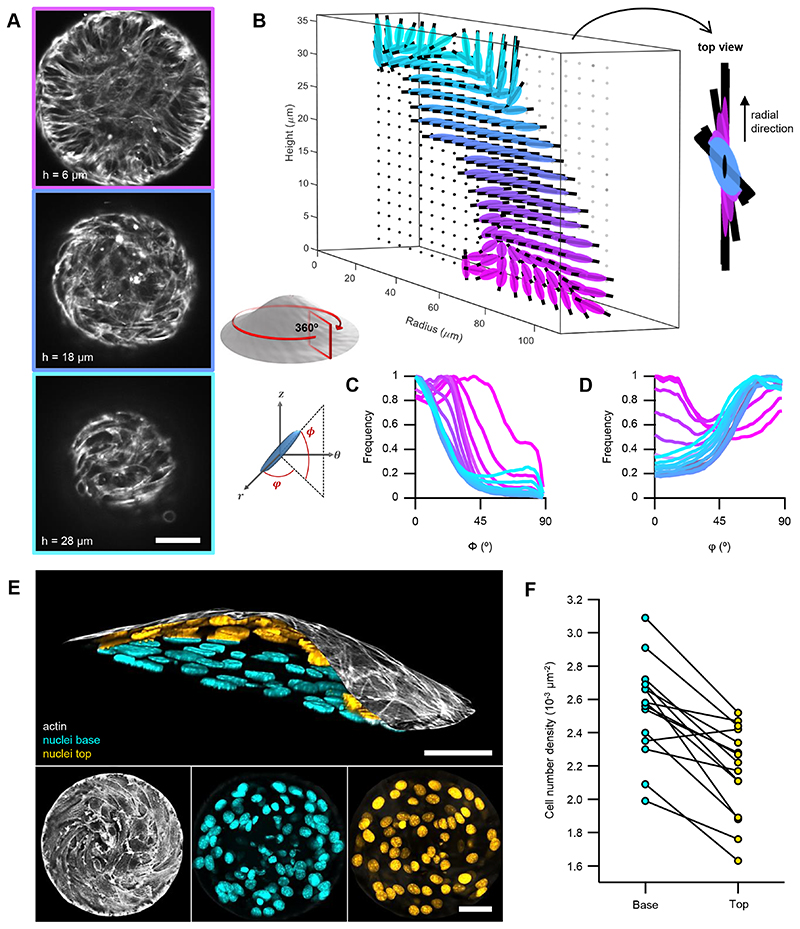
To study how cellular mounds formed, we characterized their orientation in 3D. SiR-actin labelled mounds were imaged with confocal z-stacks for several hours (Fig.3A and Methods). The 3D-orientation was averaged in the azimuthal direction revealing a peripheral order that was lost in the centers of mounds (Fig.3B and Methods). To evaluate the orientation of cells in mounds, radial distributions for the elevation angle ϕ and the azimuthal angle φ were extracted at different heights (Fig.3C,D). The elevation angle, between vertical axis and cells’ orientation, was ϕ ~0° at the top of the mound, whereas an oblique component, ϕ ~45°, appeared at the bottom (Fig.3C). φ exhibited a bimodal distribution with peaks around 0° and 90°. For the azimuthal angle, below ~10μm, φ~0° dominated, whereas above, φ~90° did (Fig.3D). Therefore, cells formed asters at the bottom of mounds and spirals at their top, featuring radial and rotational flows, respectively (Supplementary Video 8 and Methods). This aster-to-spiral transition is consistent with the one shown above (Fig.1D) as cell density decreased from bottom-to-top (Fig.3E,F and Methods).
Figure 3. Minimal nematic cellular mounds.
A, Confocal images of an actin-labelled cell mound at different heights (h). B, 3D orientational field averaged in the azimuthal direction and in time (see schematic below). Right panel shows a top view at a radial distance of 80μm. C and D, Histograms of the elevation (ϕ) and azimuth (φ) angles (see schematic on the left), respectively, for different heights. E, Vertical section of a cellular mound (top): actin on the top surface (white) and nuclei from the base (cyan) and top (orange) surfaces. Bottom panels show the corresponding vertical projections. F, Cell number density for the base and top surfaces for different cellular mounds (N=15). Actin was stained with SiR-actin. Nuclei were stained with Hoechst 33342. Scale bars, 50μm.
Force field around integer topological defects in mounds
To elucidate the specific stress fields corresponding to spirals and asters, we developed a theoretical description of a 2D active polar fluid. The cell monolayer state is characterized by the cell velocity field ν, the cell number density field ρ and the cell polarization p. In absence of active processes, the dynamics of the cell monolayer is governed by the hydrodynamics of passive liquid crystals2. To describe our system, we consider contributions of two active processes, being the directional motility of cells via traction forces, and the cytoskeleton rearrangement via active stresses. This theory is summarized in the Supplementary Note 1 and described in detail elsewhere31,32.
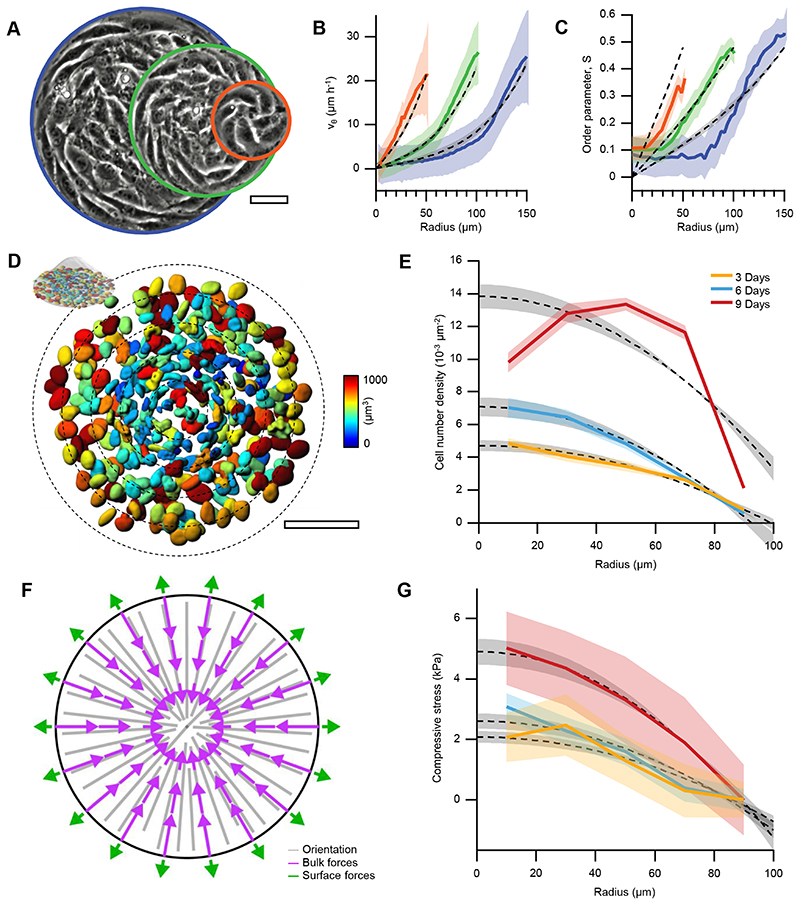
Previous studies showed that bidimensional rotational flows can arise either from traction forces of active particles24,33–35 or from gradients in anisotropic active stresses28,36. To constrain the values of our parameters, we fitted our theoretical results to the experimental azimuthal velocity and orientational order profiles of spirals with radii of 50, 100, and 150μm (Fig.4A-C and Supplementary Note 2). Solutions that exhibited cell accumulation in the confinement center, as observed experimentally (Fig.1I,J, Extended Data Fig.2D and Fig.4D,E), implied that the contribution from traction forces cannot dominate over that from active stresses31,32. In these solutions, compressive stress increased with the cell density (Fig.4F,G and Methods).
Figure 4. Integer topological defects concentrate active stress.
A, Phase contrast images of spiral defects in cell monolayers confined to circular domains of radii r=50 (orange), 100 (green) and 150μm (blue). B Radial profiles of the average azimuthal velocity vθ, and C, the orientational order parameter S (N=11, 12 and 5 for r=50, 100 and 150 μm, respectively) and theoretical fits (dashed gray lines). D, 3D rendering of nuclei at the base of a 9-days-old cellular mound (r=100 μm). Colormap indicates nuclear volume. Nuclei were stained with Hoechst 33342. Scale bars, 50μm. E, Radial cell density profiles for aster bases of 3-, 6- and 9-days-old cellular mounds and theoretical fits (dashed gray lines). F, Steady-state active forces in asters. G, Compressive stress profiles extracted from nuclear deformations for aster bases of 3-, 6- and 9-days-old cellular mounds (N=9, 40 and 10 for 3-, 6- and 9-days-old cellular mounds, respectively) and theoretical fits (dashed gray lines). In experimental plots, data are presented as mean values +/- SE. In theoretical plots, shaded areas correspond to the uncertainty of the fitting method, see Supplementary Note 2. For more details on the theoretical curves and fitting analyses see also Supplementary Note 2.
To test our theory, we obtained stress gradients within mounds from volume changes of cell nuclei37,38 (Methods) and found them to match our theoretical results (Fig.4G). In the center of the mounds, both density and compressive stresses increased with time (Fig.4E,G). We found that in the absence of orientational order, the experimental density and stress profiles cannot be reproduced by the theory (Supplementary Note 3). Additionally, our theoretical description suggests that when active anisotropic stresses dominate, then the compressive stress in asters exceeds that in spirals (Supplementary Note 4). Consequently, in mounds, the aster-to-spiral transition as a function of height could be associated with a vertical stress gradient, promoting growth by driving an upward cellular flow.
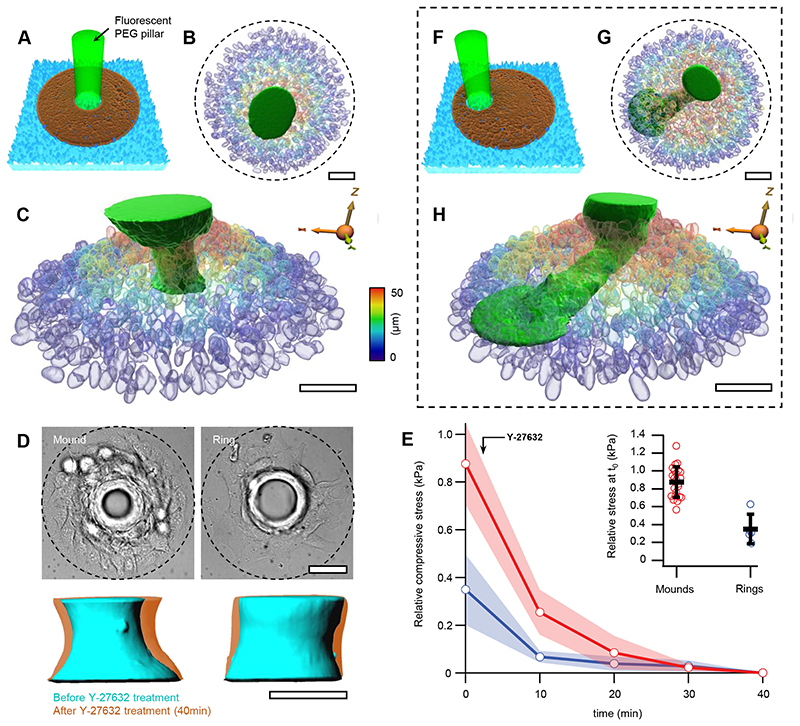
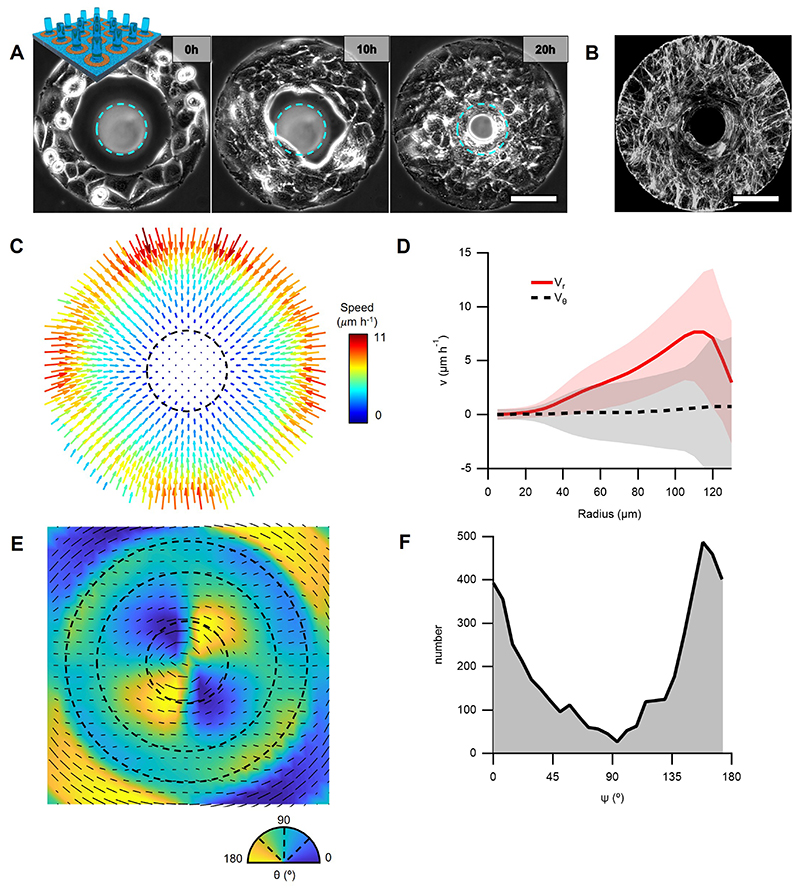
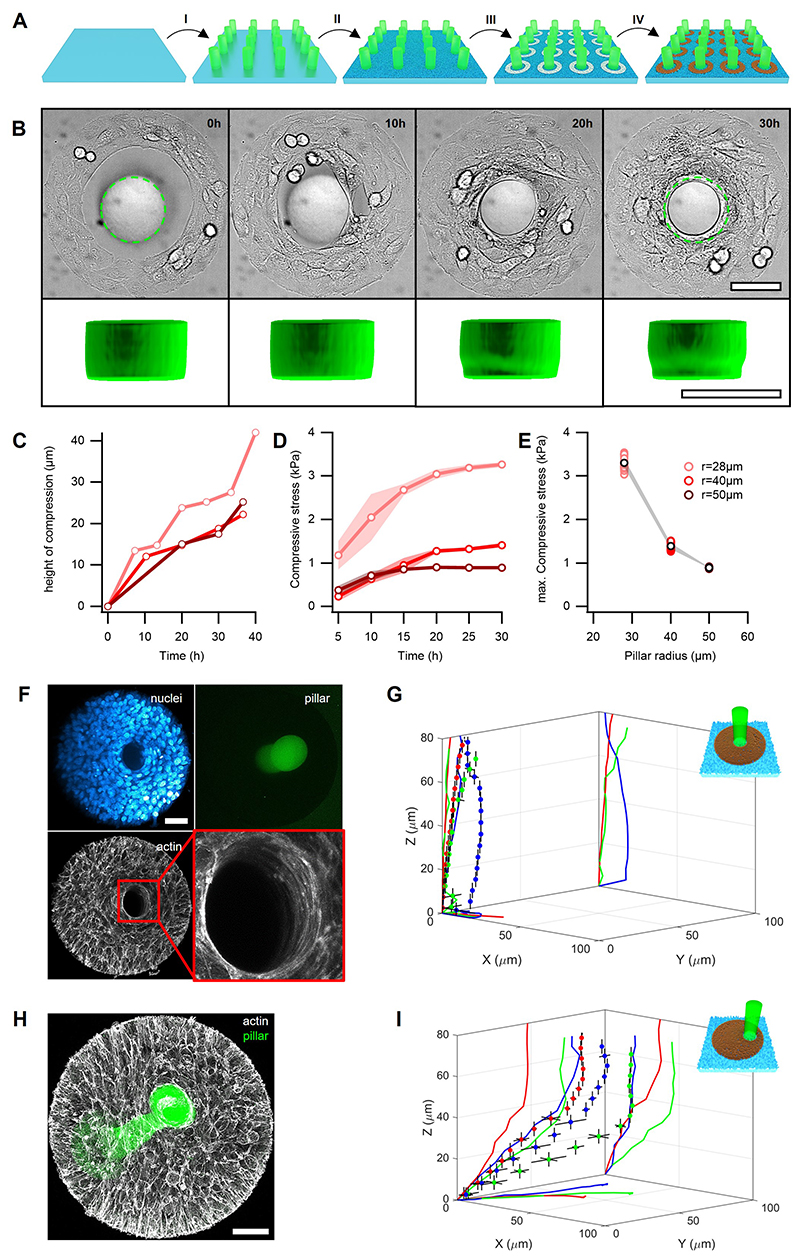
To further assess the stresses generated in mounds, we seeded myoblasts on circular fibronectin rings enclosing non-adhesive fluorescent micro-pillars with an elastic modulus E~4kPa (Fig.5A, Supplementary Note 5, and Methods). After confluency on the adhesive fibronectin patterns, myoblasts accommodated around the pillars and compressed them (Fig.5B,C, Extended Data Fig.6,7A,B and Supplementary Video 9). This compression was compatible with the stresses inferred from nuclear volume changes (Fig.4G). We determined the stresses on the pillars from their elastic deformations (Methods). After ~30h, the stresses exerted by cellular mounds saturated at maximum values between 1-4kPa and were smaller for larger pillar radii (Extended Data Fig.7C-E).
Figure 5. Soft pillars in compressive cellular mounds.
A, Scheme of a pillar deformation experiment. Fluorescent PEG pillars (green) are surrounded by cell-adhesive fibronectin patterns (brown), enclosed by non-adhesive PEG (cyan). B, Top view of a 3D rendering from confocal stacks showing the nuclei in a mound surrounding and compressing a PEG pillar. C, Side view of the experiment in B. Colormap indicates height of cells in B and C. D, Top panels: Brightfield (DIC) images of a cellular mound (left) and a cellular ring (right) around a pillar. Bottom panels: 3D renderings of pillars before (cyan) and 40 min after (orange) Y-27632 treatment corresponding to top panels. Data are presented as mean values +/- SD. E, For cellular mounds (red) and cellular rings (blue), relative compressive stress in time after application of Y-27632, which was added right after time=0. Inset: difference of compressive stress between the time=0 and 40 min in cellular mounds and cellular rings. F-H as A-C but for an experiment, where the pillar is off center. Nuclei were stained with Hoechst 33342. Scale bars, 50μm.
Actomyosin cables and multicellular rings have been shown to play an important role in gap closure39 and in the generation of compressive stresses40. We performed several experiments to confirm that most of the stresses contributing to pillar compression in mounds were independent of actin or multicellular rings (Fig. 5D,E, and Supplementary Note 6)
Finally, to better evidence stress gradients, we positioned pillars off center (Fig.5F). After the formation of mounds, these pillars appeared strongly bent towards the confinement centers (Fig.5G,H and Extended Data Fig.7H-I). These deformations are qualitatively captured by the theory of elastic rods subjected to stress gradients as generated by our cellular mounds (Supplementary Note 7).
Integer topological defects in mounds localize differentiation of myoblasts
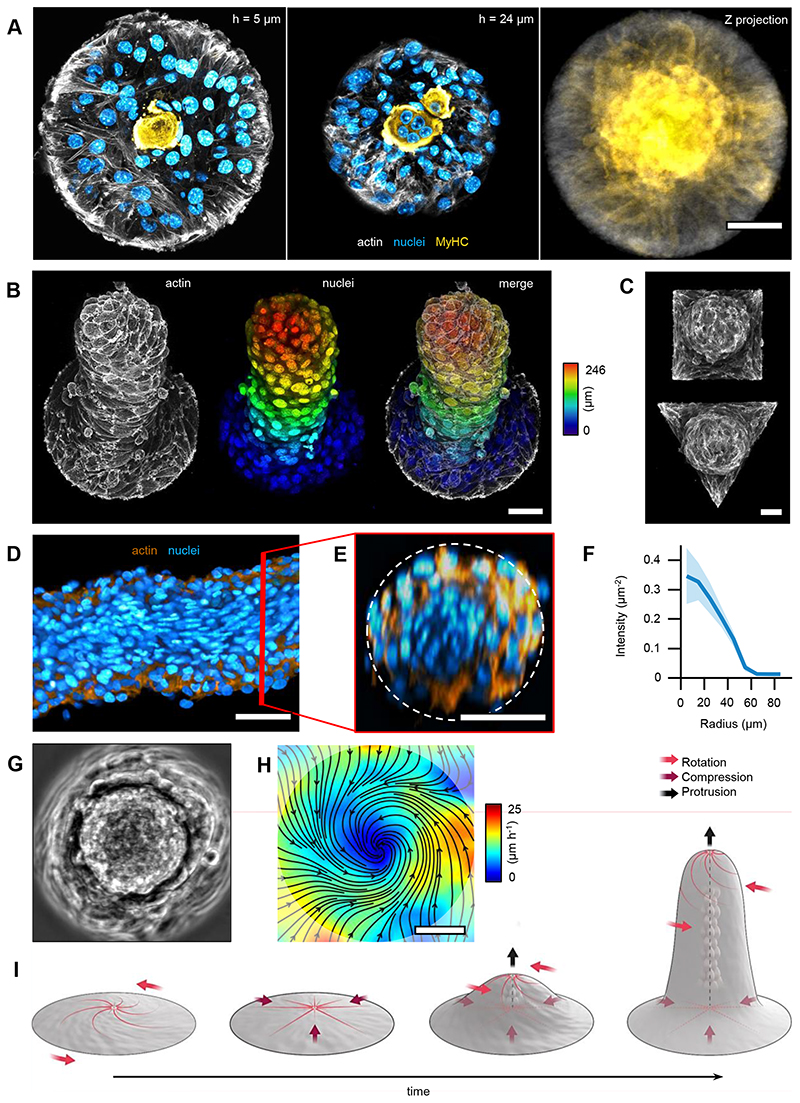
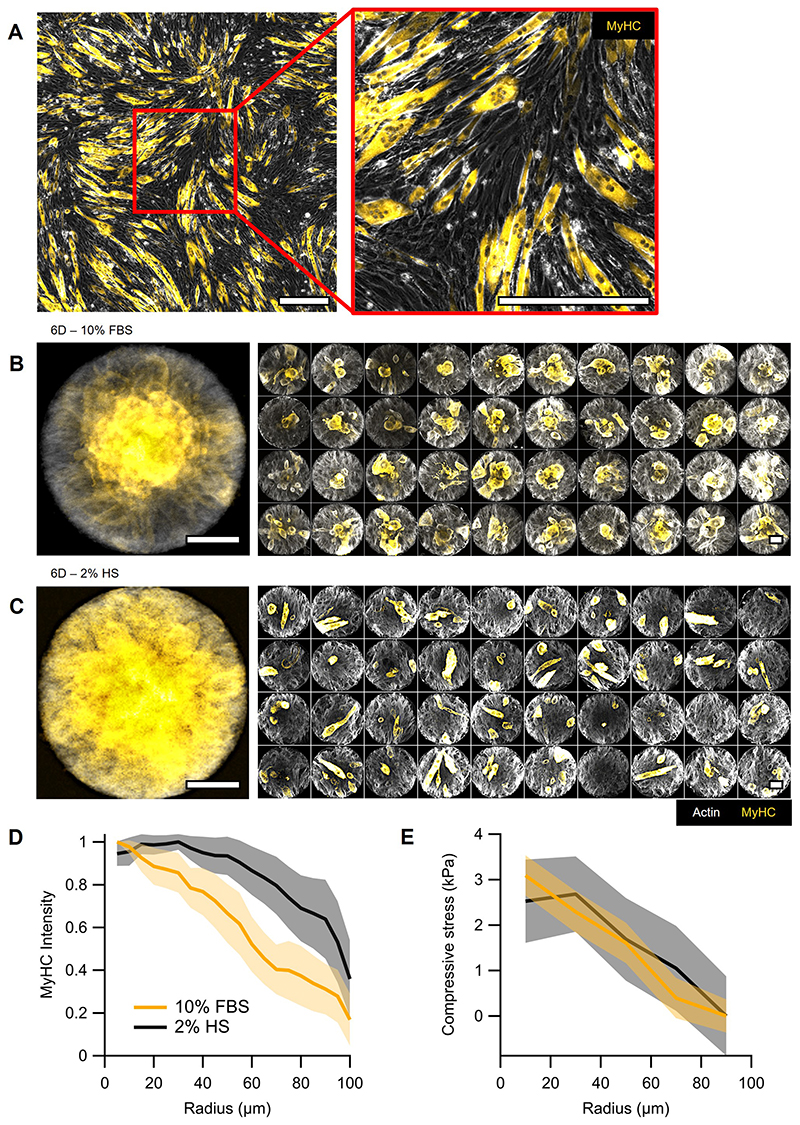
Further evolution of mounds depended on whether myoblasts could differentiate or not. In the first case, myoblasts differentiated and fused into globular multi-nucleated structures that expressed the muscle-specific protein myosin heavy chain (MyHC) (Fig.6A and Extended Data Fig.8A). These differentiated syncytia localized preferentially at the center of mounds, suggesting that the compressive stress patterns generated by integer defects in mounds can localize differentiation (Fig.6A, right panel, and Extended Data Fig.8B). When differentiation was biochemically induced by serum deprivation, myotubes exhibited a broader spatial distribution in spite of a similar distribution of mechanical stress (Extended Data Fig.8C-E and Methods). Besides, in this case, myotubes mainly presented canonical elongated morphologies (Extended Data Fig.8C). These findings indicate that biochemical signaling is a stronger trigger of differentiation than mechanical cues. However, it does not lead to spatially patterned differentiation and thus further supports the importance of mechanics for localizing differentiation.
Figure 6. Topological defects organize differentiation and morphogenesis in 3D nematic tissues.
A, Confocal images at different heights (h) showing the preferential position for myosin heavy chain (MyHC) expression. Confinement radius r=100 μm. Left panel corresponds to the first layer of cells. Center panel corresponds to the midplane, displaying a multinucleated myotube-like structure. Right panel shows the projection of MyHC intensity (N=43). B, Z-projection of a 12-days-old cellular protrusion. Colormap indicates height. C, Z-projection of 6-days-old protrusions that were grown on patterns with the same area but different geometries. D, Cross-section of a tilted protrusion along the protrusion long axis, which goes from left to right in the panel. E, Cross-section of the tilted protrusion perpendicular to the protrusion long axis and along the red line in panel D. Dashed line corresponds to a circle of radius r=50μm. F, Radial profile of fluorescence intensity per unit area from the nuclei average along the azimuthal and the main protrusion axis directions for the protrusion in D. Sections were centered prior to extracting the intensity profile (N=191 sections). Data are presented as mean values +/- SD. G, Phase contrast image of top view of a 9-days-old protrusion and H, corresponding average velocity field. Streamlines indicate the direction of the cellular flows. Colormap represents average speed. I, Scheme of the time evolution of cellular nematic architectures from 2D to 3D. Actin was stained with SiR-actin. MyHC was stained with the Myosin-4 Monoclonal Antibody conjugated with Alexa Fluor 488. Nuclei were stained with Hoechst 33342. Scale bars, 50μm.
Cellular protrusions organized by integer topological defects
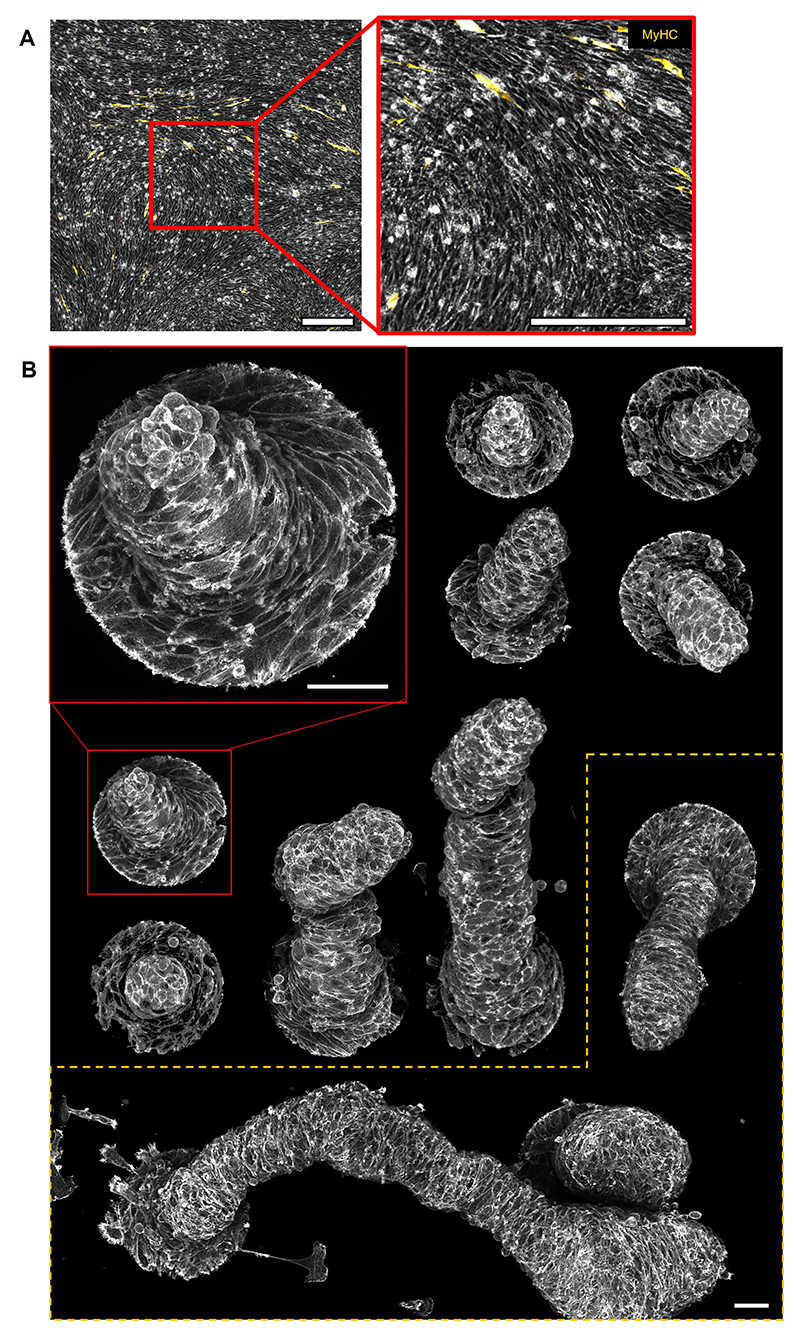
During morphogenesis, however, proliferating cells usually do not differentiate41. Accordingly, we sought to inhibit differentiation to promote further proliferation of mounds and study their 3D shape evolution. As previously observed42, C2C12 cells cultured at high-passage numbers were unable to differentiate (Extended Data Fig.9A). In this case, cellular mounds grew further in height, forming cylindrical protrusions up to hundreds of microns (Fig.6B, Extended Data Figs.9B and 10A).
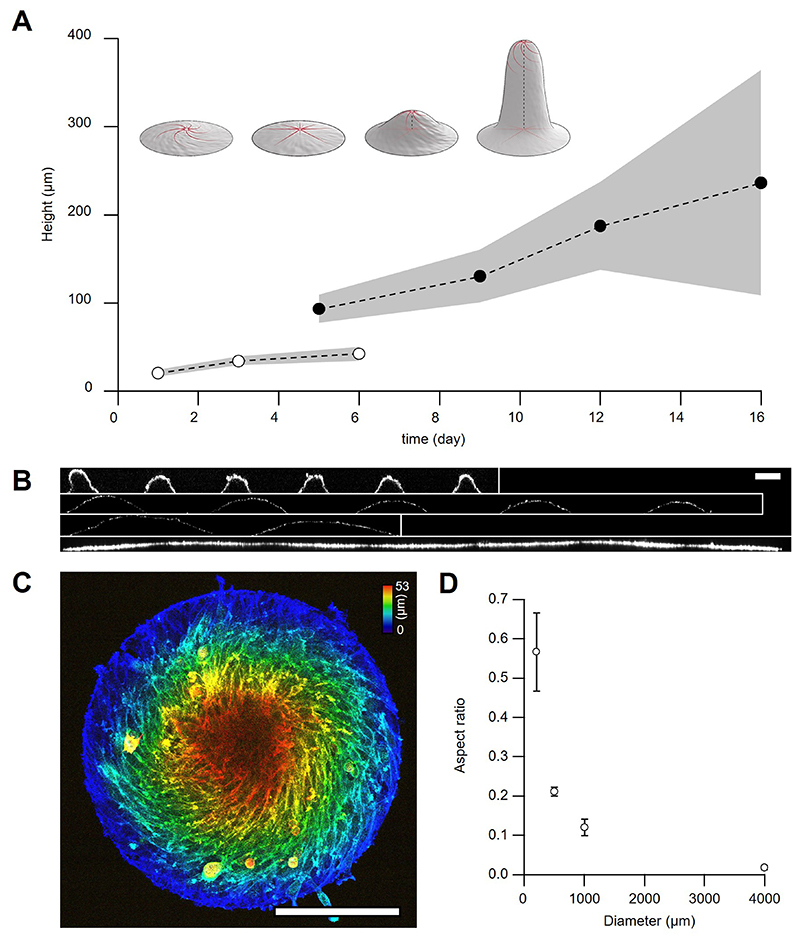
The stability of these large multicellular structures was strictly dependent on confinement as degradation of the surrounding non-adhesive coating induced the protrusions to collapse (Supplementary Video 10). Other confinement geometries, namely squares and triangles, topologically equivalent to a disc, also led to the growth of cylindrical protrusions (Fig.6C). After 6 days, larger confinement sizes also led to the formation of mounds, which were flatter for bigger confinements, and organized around integer topological defects (Extended Data Fig.10B-D). Furthermore, in our theory, by forcing integer topological defects in the absence of confinement, we obtained qualitatively similar stress profiles around the defects (Supplementary Note 8). Altogether, this indicates that, in these cellular arrangements, topological defects and the specific orientational order around them play the prime role in the formation of protrusions.
The density of nuclei was larger in the core of protrusions than at the periphery (Fig.6D-F), similar to the density patterns in the confined monolayers (Fig.4E). This suggests that cells at the core were subjected to compressive stresses. Consistent with this idea, nuclei in the core of these protrusions often displayed highly anisometric shapes, elongated along the protrusions’ long axis (Fig.6D). These compressive stresses could be generated by the specific organization of cells in the protrusions.
We observed collective rotation around the protrusions’ axis (Fig.6G-I and Supplementary Video 10). This feature indicates that cells were organized as a 3D vortex, which is also supported by the azimuthal orientation of cells in the external layer of the protrusions (Fig.6B, Extended Data Fig.9B) and the twisted cylindrical shapes exhibited by some protrusions after 14 days (Extended Data Fig.9B). We concluded that minimal cellular mounds based on asters and spirals can evolve into cylindrical vortices, the shape, and dynamics of which are dominated by the interplay between nematic order and topological constraints (Fig.6I).
In summary, our findings show how integer topological defects control the self-organization of myoblast monolayers, localizing differentiation and steering 3D morphogenesis through mechanics. We foresee that integer topological defects could mechanically control multiple cell fate decisions and morphogenetic movements during development.
Methods
Cell culture and drug treatments
C2C12 mouse myoblasts were cultured in DMEM media containing 4500mg/L glucose, 1mM sodium pyruvate (Life Technologies) and supplemented with 10% Fetal bovine serum (FBS), 100units/mL penicillin and 100μg/mL streptomycin. Maximum passages were kept below 20. For starvation conditions, used to promote differentiation, we supplemented the same DMEM media with 2% horse serum. For inhibiting differentiation, C2C12 cells were used after 50-60 passages.
For inhibiting proliferation, cells were treated with Mitomycin-C (Sigma) at 10μM for 1h at 37°C, then washed away and replaced by fresh medium. Imaging data were acquired up to 10h after treatment with Mitomycin-C, to avoid toxic effects43.
For inhibiting contractility (myosin-II ATPase), cells were treated either with Blebbistatin (Sigma) at 17μM or with the ROCK inhibitor Y-27632 (BioVision) at 25μM.
In all treatments, DMSO concentration was kept below 10-3%v/v.
Fluorescence labelling and imaging
For fluorescence immunostaining of myosin heavy chain, cells were fixed with 4% paraformaldehyde (Sigma) in PBS for 10min. Fixation time for 3D protrusions was set to 1h. Cells were subsequently permeabilized for 30min with 0.1% Saponin (Sigma) while blocked with 0.1% bovine serum albumin (BSA, Sigma). Finally, fixed cells were incubated with primary antibodies. Myosin-4 Monoclonal Antibody conjugated with Alexa Fluor 488 (MF20, Thermofisher) was incubated for 1h at room temperature, at 5μg/mL (1:100 dilution) and 0.1% BSA.
Actin was labelled with SiR-actin (Spirochrome). Concentrations used were 1μM (30min incubation) for fixed samples and 100nM (6h incubation) for live imaging.
Cell nuclei were labelled after fixation with Hoechst 33342 (Thermofischer) at 10μg/mL (5min incubation).
Fixed samples were imaged by using a Nikon Eclipse Ti-E microscope equipped with a Nikon A1 confocal unit. We employed x40/x60 water/oil immersion objectives (NA 1.15/1.4). The microscope was operated with NIS-Elements (ver. 4.60.00). A Zeiss LSM-710 upright confocal microscope (40x objective, NA 0.75) was used for imaging the top and exterior of cellular protrusions. The microscope was operated with Zeiss Zen 2011.
Optical clearing
In-depth imaging of 3D tissue protrusions required optical clearing, which was performed by following a protocol designed to clear organoids44. In brief, protrusions were fixed with 4% paraformaldehyde (Sigma) for 30min, and permeabilized with a solution of Tween-20 (Sigma) in PBS (0.1% v/v) for 10’ at 4°C. Subsequently, we used a solution of BSA (0.2% w/v, Sigma) and Triton-100 (0.1% v/v, Sigma) in PBS, used for 15’ at 4°C. Finally, protrusions were rinsed with PBS, and immersed in an optically-transparent solution composed of fructose (2.5M, Sigma) and glycerol (60% v/v, Sigma) in PBS.
Time-lapse imaging
Time-lapse imaging was performed with an inverted microscope Nikon Ti-E installed into a thermostatically controlled chamber (Life Imaging Technologies) and equipped with a micro-incubator for thermal, CO2 and humidity control (OKOlab). The microscope was also equipped with an automated stage and a Yokogawa CSU-W1 spinning disk unit. Image acquisition was performed with an Andor Zyla 4.2 Plus camera, operated with Slidebook (ver.6.0.19). We performed fluorescence (60x lens, NA 1.4), phase contrast (10/20x objectives, NA 0.3/0.45) and differential interference contrast (DIC) imaging (20x lens, NA 0.45). 4D time-lapse was used for actin-labelled cell mounds (60x lens, NA 1.4) and for the pillar compression experiments. The latter combined DIC and confocal fluorescence modes (20x lens, NA 0.45). Typically, we acquired 12 images/h for >10h.
Substrate functionalization and micro-patterning
To prepare surfaces for micropatterning, glass bottom dishes (Mattek) were first activated using a plasma cleaner (Harrick Plasma, PDC-32G) for 3min. Then, the glass surface was treated with a 0.1mg/mL poly-lysine (PLL, Sigma) solution for 30min, then washed with HEPES buffer (pH=8.4). A solution of 50mg/mL mPEG (MW 5,000) - Succinimidyl Valerate (SVA) (Laysan Bio) was applied to passivate the surface for 1.5h, and then washed out with PBS. Substrates were normally used after preparation although they can be kept under PBS for 1-2 weeks at 4°C.
Micropatterns were generated by using a UV-activated mPEG-scission reaction, spatially controlled by the system PRIMO (Alvéole)45, mounted on an inverted microscope Nikon Eclipse Ti-2. In the presence of a photo-initiator compound (PLPP, Alvéole), the antifouling properties of the PEGylated substrate are tuned by exposure to near-UV light (375nm). After illumination (1,200mJ/mm2) through a 20x objective PLL is exposed. After rinsing with PBS, fibronectin (Calbiochem) was incubated at 50μg/mL at room temperature for 5min to coat the PEG-free motifs with the cell-adhesive protein. The excess of fibronectin was washed out with PBS. PBS was finally replaced by medium, and a suspension of cells was added at densities of ~1·105 cells/cm2. Samples were kept in an incubator at 37°C and 5% CO2. After 10-30min, non-adhered cells were washed out.
Micro-fabrication of hydrogel pillars
To fabricate PEG-based fluorescent micropillars onto glass we used a photopolymerizable aqueous solution composed of fluorescent-PEG(2k)-Acrylate, 4-Arm-PEG(20k)-Acrylate and the photo-initiator PLPP (Alvéole). For the preparation of the fluorescent-PEG(2k)-Acrylate, Fluoresceinamine (Sigma) was dissolved at 0.1mg/mL in HEPES buffer solution (pH=8.3) and mixed with an equal volume of a 50mg/mL AC-PEG-(MW 2,000)-SVA (Laysan Bio) solution, which was prepared in the same buffer. The resulting mixture was vortexed and let sit at room temperature in the dark for 1h. The photopolymerizable solution was then prepared by dissolving 4arm-PEG-(MW 20,000)-AC (Laysan Bio) in a 14mg/mL PLPP solution at the desired concentration (2.5%w/v to obtain gels of stiffness 4kPa) with 10% of the 25mg/mL solution of fluorescent-PEG(2k)-Acrylate. To prepare the pillars, the photopolymerizable solution was placed between plasma-treated glass and a 150μm-thick Polytetrafluoroethylene film separated by spacers composed of the same film. Subsequently, photopolymerization of pillars was performed by illuminating the top surface of the glass with full circle motifs of UV light (100-200mJ/mm2) with the system PRIMO (Alvéole). After polymerization, the pillars were rinsed with deionized water. We then PEGylated the surface and micropatterned it with rings that enclosed the micropillars (Extended Data Fig.7A).
Image and data analysis
Igor Pro (ver. 7.08) was used for representing the data in 2D plots. Matlab R2017a (ver. 9.2) was used for generating velocity and orientation vector fields as well as for representing data in 3D plots.
Nearest neighbor distance between half integer defects
For the detection of half-integer defects for the nearest neighbor analysis in Fig.1B we first define as defect areas, the regions where the parameter was below a threshold value. The brackets 〈⬚〉 denote an average over a local region. To assess their topological strength, we calculated the winding number , where ∑Δθ is the accumulated rotation of the orientational field around these low-order regions46. Finally, for the nearest neighbor distance analysis, we compared all the distances between defects and selected the minimum values corresponding to each pair.
Flow, orientation and associated quantities
Tracer-free velocimetry analysis of the flows in the cell monolayers was performed with a public domain particle image velocimetry (PIV) program implemented as an ImageJ plugin30. In particular, we used the (basic) iterative PIV with 3 passes, with decreasing interrogation window size. Minimum window sizes used in the analysis were normally set at 10x10μm, which show good qualitative agreement with our experimental observations. Temporal resolution was set to a minimum of 5 or 10 minutes between frames.
The Manual Tracking plugin for ImageJ was used to manually track trajectories of cells in figures 1A, 2A and 2E.
The 2D orientational field in cell monolayers was extracted by using the plugin OrientationJ (ver. 2.0.5) for ImageJ, which is based on the structure tensor method29. In brief, for each pixel of an image, intensity gradients are computed. A structure matrix is obtained from the products of the components of the intensity gradients that are averaged in local sub-windows. For most of the cases, sub-window size was set to 6x6μm. Diagonalization of this structure matrix results in two eigenvectors per pixel. The eigenvector with the smallest eigenvalue represented the direction of smallest variation of the intensity map in the vicinity of the pixel and was associated with the main orientation. Finally, orientations were then typically averaged in image sub-windows of 12x12μm. The amplitude of the orientation vectors, named coherency C, was also extracted from OrientationJ. Note that the coherency associated to orientation vectors is informative of relative changes in space but cannot be compared between different images.
Further analyses were performed with custom written Matlab codes.
The spatial nematic autocorrelation function Cnn (Fig.1B and Extended Data Fig.1) was calculated from each orientational field position like
| (1) |
where θ is the local orientation of n with respect to a fixed axis. We considered Cnn at timepoints within one-hour period for temporal averaging. The characteristic nematic length ξnn was extracted from the intersection of the initial linear decay and Cnn=0.
The angle 𝜓 was obtained for each position as the angle between the orientation vectors n and their corresponding radial direction vectors . Unless stated otherwise, for the calculation of 𝜓, we considered only n vectors at distances r<0.9R, being R the radius of the islands, and with associated S >0.4. Only in Extended Data Figure 6, we considered only vectors n at distances 0.65R<r<0.85R. The threshold for S was kept at S >0.4.
The angle β was obtained for each position from the scalar product between the orientation vectors n and their corresponding velocity vectors ν.
To obtain the orientational order parameter S, we first computed the nematic order tensor Q from the orientational field n. Specifically, the components of the nematic tensor were
| (2) |
| (3) |
where C corresponds to the coherency and θ is the local orientation of n with respect to a fixed axis. The orientational order parameter S was calculated from the time-averaged components of the nematic tensor Q for each position like
| (4) |
where the brackets 〈⬚〉 denote a time average over a local position in the space matrix.
3D director field from fluorescence confocal z-stacks
3D orientation analysis was based on a generalization of the above-mentioned method to intensity maps in 3D and it was implemented as a Matlab function. In the following, we explain the procedure to determine 3D director field n from z-stacks of fluorescence images.
Let us consider a 3D intensity map I(x, y, z), such as a z-stack of fluorescence images, where (x, y, z) represents the cartesian coordinates. First, using the Matlab function interp3, we interpolated the 3D intensity map I(x, y, z) so that the resolution of the z coordinate matched the resolution of the (x, y)-planes. Next, we used the Matlab function imgaussfilt3 to apply a Gaussian filter with standard deviation σ1 on I(x, y, z). This part eliminated small-wavelength fluctuations from the intensity map. For each pixel, we computed the gradient of the intensity map (𝜕xI, 𝜕yI, 𝜕zI) by using the Matlab function imgradientxyz. We computed the structure matrix, which is defined as
| (5) |
where the brackets 〈·〉 denote a second Gaussian filter with standard deviation σ2. We defined the traceless structure matrix as , where Tr denotes the trace operator and 𝕀 denotes the identity matrix. For each pixel, the matrix was diagonalized by the Matlab function eig. For each pixel, the three eigenvectors of define, in general, an orthogonal basis. The eigenvector with the smallest eigenvalue represented the direction of smallest variation of the intensity map I(x, y, z) in the vicinity of the pixel (x, y, z). We considered the director field n parallel to the eigenvector with minimal eigenvalue. Note that, the orientation of n was determined up to a sign, meaning that n → −n were indistinguishable. We choose nz to be positive. The amplitude of n was set by the smallest eigenvalue of . For each pixel, we computed the components of the nematic tensor field Q in cylindrical coordinates, taking as the center the geometrical center of the confining domains. Finally, we averaged the components of the nematic tensor field Q over time and experiments. In conclusion, the method presented two input parameters given by the standard deviations of two Gaussian filters, and outputted a nematic tensor field Q from a 3D intensity map I(x, y, z).
To construct Fig.3B, we apply the above-mentioned routine with the input parameters σ1 = 1 px and σ2 = 5 px to 3D time-lapse stacks of actin-stained cell mounds (N=8) and obtained the averaged nematic tensor field Q in cylindrical coordinates. We binned the data in the radial direction so that 20 points are shown. To represent the data, we used the following procedure. First, for each data point, we computed the eigenvectors and eigenvalues of the binned nematic tensor field using eig. Next, for each data point, we constructed a 3D ellipsoid of revolution with the major axis proportional to the largest eigenvalue and the minor axes proportional to the mean of the two lowest eigenvalues. For each z-plane in Fig.3B, only the 3D ellipsoids of revolution that had a trace of the binned nematic tensor larger than the mean of each plane, were shown.
Characterization of cell number density in mounds
Nuclei density in mounds was assessed by using MorphoGraphX (ver. 1.0)47 on 3D confocal stacks of actin- and nuclei-labelled fixed mounds. The actin signal was used to extract two triangular meshes with points corresponding to the outer mounds’ surface and to the mounds’ base in contact with the substrate. These meshes were used to compute the top and bottom surfaces of mounds. Nuclei at a distance up to 3μm from these surfaces were then manually counted to calculate the cell number density. The nuclei near the edges of the top and bottom surfaces were considered for both surfaces. These nuclei corresponded to 12±4% and 13±4% of the total number of nuclei for the bottom and top surfaces, respectively (mean +/- SD, N=15).
MorphoGraphX was also used for the visualization of the rotating actin spiral on the mound’s top surface shown in Supplementary Video 8. This was achieved by considering only the actin signal at a distance up to 6μm from the top surface.
Calculation of stresses from nuclei deformations
Both the volume of nuclei and pillars were obtained by segmenting fluorescence confocal stacks with Imaris (Oxford Instruments, ver. 9.5.0). Further analyses were performed with custom written Matlab codes.
For the calculation of stresses from nuclear deformations, we first calculated average nuclear volumes (Vr) as a function of the radial distance r and computed the difference with respect to the average volume of the nuclei at the periphery (VR). We then considered the linear relation between pressure and the relative variation of nuclear volume48.
| (6) |
For the nuclei, we considered an elastic bulk modulus (B) of 11kPa38.
Calculation of stresses from pillar deformations
In the following, we derive the theoretical equation used to quantify the cellular forces exerted on deformable elastic pillars. The geometry of pillars is approximated by a cylinder of radius R and height h. Due to the symmetries of the cylinder, we focus on axisymmetric solutions, (i.e. independent on the azimuthal coordinate θ) and use cylindrical coordinates (r, θ, z). Furthermore, we consider that our deformable elastic pillars behave as a linear elastic material (Fig.S9, A), so that the stress tensor σ obeys
| (7) |
where the symmetric part of the strain tensor is with u being the displacement vector. The material parameters are the elastic modulus E and the poisson ratio ν.
The force balance equation reads
| (8) |
as there are no bulk forces applied on the pillars.
To complete our description, we need to specify the boundary conditions. On the lateral surface of the cylinder, we consider that cells exert a uniform compressional stress −P, so that σrr(r = R)= −P and σzr(r = R)= 0. On the bottom surface of the cylinder, we consider vanishing displacement in the z-direction uz(z = 0)= 0. On the bottom surface, the cylinder is allowed to slide freely in the radial direction, so that σzr(z = h)= 0. On the upper surface of the cylinder, we consider stress free conditions σzz(z = h)= 0 and σrz(z = h)= 0.
A steady-state solution to the above problem, corresponds to a displacement field u with , uθ = 0, and . In this case, the non-vanishing components of the stress tensor are:
| (9) |
| (10) |
By enforcing that σzz(z = h)= 0 and σrr(r = R)= −P, we obtain the displacement field
| (11) |
| (12) |
Rewritten in terms of the areal strain, the stress reads
| (13) |
where ΔA is the difference of cylinder base’ area after deformation and A0 is the area of the cylinder base before deformation. For the 2.5%w/v PEG pillars, we considered a Poisson ratio (ν) of 0.549 and an elastic modulus (E) of 4kPa (Supplementary Note 5).
For the calculation of compressive stress as a function of time in Extended Data Fig.7, the areal strain was calculated from the experimentally measured pillar volumes as
| (14) |
where V corresponds to the volume of the cylindrical pillar up to a fixed height, typically 40μm, which was larger than the height hc up to which the cylindrical pillar was compressed. Temporal evolution of hc was assessed manually from 3D volume renderings of the pillars. V0 and A0 correspond to the initial volume and base area of the cylindrical pillar, respectively. Because the areal strain was computed with respect to the stress-free state with volume V0, this calculation led to absolute values of compressive stress.
For the calculation of compressive stress as a function of time in Fig.5E, corresponding to myosin inhibition experiments, the areal strain was calculated from the experimentally measured pillar volumes as
| (15) |
where V corresponds to the volume of the cylindrical pillar up to a fixed height and Vf corresponds to the final volume, 40min after inhibition of myosin activity. Because the areal strain was computed with respect to a state with residual stresses and volume Vf, this calculation led to relative variations of compressive stress.
Statistics and Reproducibility
All the reported results were obtained from experiments repeated successfully and independently 2-3 times in different weeks. Quantification always considered measurements from several cellular disks (N, indicated in the figure captions). Average vector fields (velocity and orientation) as well as the corresponding radial profiles were obtained by averaging >5 cellular disks per condition. Each cellular disk was imaged for at least 10 hours every 5 minutes. For fixed cellular disks we considered >10 disks to be sufficient for the statistical analyses. No temporal averaging was applied to the data prior to the calculation of errors.
Extended Data
Extended Data Figure. 1.
Extended Data Figure. 2.
Extended Data Figure. 3.
Extended Data Figure. 4.
Extended Data Figure. 5.
Extended Data Figure. 6.
Extended Data Figure. 7.
Extended Data Figure. 8.
Extended Data Figure. 9.
Extended Data Figure. 10.
Supplementary Material
Acknowledgements
We thank C. Roffay for suggesting the representation of 3D orientational fields and all the members from the Roux and Kruse groups for fruitful discussions and support. We thank S. Gabriele for useful insights on the elastic properties of C2C12 cells’ nuclei. P.G. acknowledges support from the Human Frontiers of Science Program (LT-000793/2018-C). AR acknowledges funding from SystemsX RTD program EpiPhysX, the Swiss National Fund for Research Grants N°31003A_130520, N°31003A_149975 and N°31003A_173087, and the European Research Council Consolidator Grant N° 311536.
Footnotes
Author Contributions
P.G and A.R designed the research. P.G performed the experiments. P.G and C.B-M analyzed the data. G.P analyzed cell number density in mounds. C.B-M and K.K developed the theoretical model. All the authors participated in writing the manuscript.
Competing Interests
Authors declare no competing interests.
Data Availability
The data that support the findings of this study are available in the Zenodo repository https://doi.org/10.5281/zenodo.5549501. High resolution images and movies will be available from the corresponding authors (A.R and K.K) upon request.
Code Availability
The Matlab code employed for the 3D orientation analysis is available in the Zenodo repository doi.org/10.5281/zenodo.5680045.
References
- 1.Stooke-Vaughan GA, Campàs O. Physical control of tissue morphogenesis across scales. Current Opinion in Genetics & Development. 2018;51:111–119. doi: 10.1016/j.gde.2018.09.002. [DOI] [PMC free article] [PubMed] [Google Scholar]
- 2.de Gennes PG, Prost J. The Physics of Liquid Crystals. Clarendon Press; 1995. [Google Scholar]
- 3.Kemkemer R, Kling D, Kaufmann D, Gruler H. Elastic properties of nematoid arrangements formed by amoeboid cells. The European Physical Journal E. 2000;1:215. [Google Scholar]
- 4.Junkin M, Leung SL, Whitman S, Gregorio CC, Wong PK. Cellular self-organization by autocatalytic alignment feedback. Journal of Cell Science. 2011;124:4213–4220. doi: 10.1242/jcs.088898. [DOI] [PMC free article] [PubMed] [Google Scholar]
- 5.Duclos G, Garcia S, Yevick HG, Silberzan P. Perfect nematic order in confined monolayers of spindle-shaped cells. Soft Matter. 2014;10:2346–2353. doi: 10.1039/c3sm52323c. [DOI] [PubMed] [Google Scholar]
- 6.Morales-Navarrete H, et al. Liquid-crystal organization of liver tissue. eLife. 2019;8 doi: 10.7554/eLife.44860. [DOI] [PMC free article] [PubMed] [Google Scholar]
- 7.Sanchez T, Chen DTN, DeCamp SJ, Heymann M, Dogic Z. Spontaneous motion in hierarchically assembled active matter. Nature. 2012;491:431–4. doi: 10.1038/nature11591. [DOI] [PMC free article] [PubMed] [Google Scholar]
- 8.Keber FC, et al. Topology and dynamics of active nematic vesicles. Science. 2014;345:1135–1139. doi: 10.1126/science.1254784. [DOI] [PMC free article] [PubMed] [Google Scholar]
- 9.Kumar N, Zhang R, de Pablo JJ, Gardel ML. Tunable structure and dynamics of active liquid crystals. Science Advances. 2018;4:eaat7779. doi: 10.1126/sciadv.aat7779. [DOI] [PMC free article] [PubMed] [Google Scholar]
- 10.Thampi SP, Golestanian R, Yeomans JM. Instabilities and topological defects in active nematics. EPL (Europhysics Letters) 2014;105:18001 [Google Scholar]
- 11.Giomi L. Geometry and Topology of Turbulence in Active Nematics. Physical Review X. 2015;5:031003 [Google Scholar]
- 12.Saw TB, et al. Topological defects in epithelia govern cell death and extrusion. Nature. 2017;544:212–216. doi: 10.1038/nature21718. [DOI] [PMC free article] [PubMed] [Google Scholar]
- 13.Kawaguchi K, Kageyama R, Sano M. Topological defects control collective dynamics in neural progenitor cell cultures. Nature. 2017;545:327–331. doi: 10.1038/nature22321. [DOI] [PubMed] [Google Scholar]
- 14.Duclos G, Erlenkamper C, Joanny J-F, Silberzan P. Topological defects in confined populations of spindle-shaped cells. Nat Phys. 2017;13:58–62. [Google Scholar]
- 15.Thompson DW. On Growth and Form. The University Press; Cambridge [England]: 1942. [Google Scholar]
- 16.Mandal S, Mahajan D, Roy S, Singh M, Khurana N. Fibroma with minor sex cord elements - An incidental finding in a normal sized ovary a case report with literature review. Diagnostic Pathology. 2007 doi: 10.1186/1746-1596-2-46. [DOI] [PMC free article] [PubMed] [Google Scholar]
- 17.Kepes JJ. Cellular whorls in brain tumors other than meningiomas. Cancer. 1976;37:2232–7. doi: 10.1002/1097-0142(197605)37:5<2232::aid-cncr2820370512>3.0.co;2-y. [DOI] [PubMed] [Google Scholar]
- 18.Dua HS, et al. Vortex or whorl formation of cultured human corneal epithelial cells induced by magnetic fields. Eye. 1996;10:447–450. doi: 10.1038/eye.1996.98. [DOI] [PubMed] [Google Scholar]
- 19.Maroudas-Sacks Y, et al. Topological defects in the nematic order of actin fibres as organization centres of Hydra morphogenesis. Nature Physics. 2021;17:251–259. [Google Scholar]
- 20.Turiv T, et al. Topology control of human fibroblast cells monolayer by liquid crystal elastomer. Science Advances. 2020;6:eaaz6485. doi: 10.1126/sciadv.aaz6485. [DOI] [PMC free article] [PubMed] [Google Scholar]
- 21.Endresen KD, Kim M, Pittman M, Chen Y, Serra F. Topological defects of integer charge in cell monolayers. Soft Matter. 2021:1912.03271. doi: 10.1039/d1sm00100k. [DOI] [PMC free article] [PubMed] [Google Scholar]
- 22.Yaffe D, Feldman M. The formation of hybrid multinucleated muscle fibers from myoblasts of different genetic origin. Developmental Biology. 1965;11:300–317. doi: 10.1016/0012-1606(65)90062-x. [DOI] [PubMed] [Google Scholar]
- 23.Duclos G, et al. Spontaneous shear flow in confined cellular nematics. Nature Physics. 2018;14:728–732. doi: 10.1038/s41567-018-0099-7. [DOI] [PMC free article] [PubMed] [Google Scholar]
- 24.Wioland H, Woodhouse FG, Dunkel J, Kessler JO, Goldstein RE. Confinement Stabilizes a Bacterial Suspension into a Spiral Vortex. Physical Review Letters. 2013;110:268102. doi: 10.1103/PhysRevLett.110.268102. [DOI] [PubMed] [Google Scholar]
- 25.Guillamat P, Ignés-Mullol J, Sagués F. Taming active turbulence with patterned soft interfaces. Nature Communications. 2017;8:564. doi: 10.1038/s41467-017-00617-1. [DOI] [PMC free article] [PubMed] [Google Scholar]
- 26.Opathalage A, et al. Self-organized dynamics and the transition to turbulence of confined active nematics. Proceedings of the National Academy of Sciences. 2019;116:4788–4797. doi: 10.1073/pnas.1816733116. [DOI] [PMC free article] [PubMed] [Google Scholar]
- 27.Jalal S, et al. Actin cytoskeleton self-organization in single epithelial cells and fibroblasts under isotropic confinement. Journal of Cell Science. 2019;132:jcs220780. doi: 10.1242/jcs.220780. [DOI] [PMC free article] [PubMed] [Google Scholar]
- 28.Kruse K, Joanny JF, Jülicher F, Prost J, Sekimoto K. Asters, vortices, and rotating spirals in active gels of polar filaments. Physical review letters. 2004;92:078101. doi: 10.1103/PhysRevLett.92.078101. [DOI] [PubMed] [Google Scholar]
- 29.Püspöki Z, Storath M, Sage D, Unser M. Transforms and Operators for Directional Bioimage Analysis: A Survey. Advances in Anatomy Embryology and Cell Biology. 2016:69–93. doi: 10.1007/978-3-319-28549-8_3. [DOI] [PubMed] [Google Scholar]
- 30.Tseng Q, et al. Spatial organization of the extracellular matrix regulates cell-cell junction positioning. Proceedings of the National Academy of Sciences of the United States of America. 2012;109:1506–11. doi: 10.1073/pnas.1106377109. [DOI] [PMC free article] [PubMed] [Google Scholar]
- 31.Blanch-Mercader C, Guillamat P, Roux A, Kruse K. Quantifying Material Properties of Cell Monolayers by Analyzing Integer Topological Defects. Physical Review Letters. 2021;126:028101. doi: 10.1103/PhysRevLett.126.028101. [DOI] [PubMed] [Google Scholar]
- 32.Blanch-Mercader C, Guillamat P, Roux A, Kruse K. Integer topological defects of cell monolayers: Mechanics and flows. Physical Review E. 2021;103:012405. doi: 10.1103/PhysRevE.103.012405. [DOI] [PubMed] [Google Scholar]
- 33.Schaller V, Weber C, Semmrich C, Frey E, Bausch AR. Polar patterns of driven filaments. Nature. 2010;467:73–77. doi: 10.1038/nature09312. [DOI] [PubMed] [Google Scholar]
- 34.Lushi E, Wioland H, Goldstein RE. Fluid flows created by swimming bacteria drive self-organization in confined suspensions. Proceedings of the National Academy of Sciences. 2014;111:9733–9738. doi: 10.1073/pnas.1405698111. [DOI] [PMC free article] [PubMed] [Google Scholar]
- 35.Doxzen K, et al. Guidance of collective cell migration by substrate geometry. Integrative Biology. 2013;5:1026. doi: 10.1039/c3ib40054a. [DOI] [PubMed] [Google Scholar]
- 36.Fürthauer S, Neef M, Grill SW, Kruse K, Jülicher F. The Taylor–Couette motor: spontaneous flows of active polar fluids between two coaxial cylinders. New Journal of Physics. 2012;14:023001 [Google Scholar]
- 37.Hobson CM, et al. Correlating nuclear morphology and external force with combined atomic force microscopy and light sheet imaging separates roles of chromatin and lamin A/C in nuclear mechanics. bioRxiv. 2020 doi: 10.1101/2020.02.10.942581. [DOI] [PMC free article] [PubMed] [Google Scholar]
- 38.Collinsworth AM, Zhang S, Kraus WE, Truskey GA. Apparent elastic modulus and hysteresis of skeletal muscle cells throughout differentiation. American journal of physiology Cell physiology. 2002;283:C1219-27. doi: 10.1152/ajpcell.00502.2001. [DOI] [PubMed] [Google Scholar]
- 39.Da Costa ADS, et al. Fibroblasts close a void in free space by a purse-string mechanism. bioRxiv. 2020:2020.08.15.250811. doi: 10.1101/2020.08.15.250811. [DOI] [PubMed] [Google Scholar]
- 40.Barbazan J, et al. Cancer-associated fibroblasts actively compress cancer cells and modulate mechanotransduction. bioRxiv. 2021:2021.04.05.438443. doi: 10.1101/2021.04.05.438443. [DOI] [PMC free article] [PubMed] [Google Scholar]
- 41.Gilbert SF, Barresi MJF. DEVELOPMENTAL BIOLOGY, 11TH EDITION 2016. American Journal of Medical Genetics Part A. 2017;173:1430–1430. [Google Scholar]
- 42.Sharples AP, Al-Shanti N, Lewis MP, Stewart CE. Reduction of myoblast differentiation following multiple population doublings in mouse C2C12 cells: A model to investigate ageing? Journal of Cellular Biochemistry. 2011;112:3773–3785. doi: 10.1002/jcb.23308. [DOI] [PubMed] [Google Scholar]
- 43.Poujade M, et al. Collective migration of an epithelial monolayer in response to a model wound. Proc Natl Acad Sci. 2007;104:15988–15993. doi: 10.1073/pnas.0705062104. [DOI] [PMC free article] [PubMed] [Google Scholar]
- 44.Dekkers JF, et al. High-resolution 3D imaging of fixed and cleared organoids. Nat Protoc. 2019;14:1756–1771. doi: 10.1038/s41596-019-0160-8. [DOI] [PubMed] [Google Scholar]
- 45.Strale PO, et al. Multiprotein Printing by Light-Induced Molecular Adsorption. Adv Mater. 2016;28:2024–2029. doi: 10.1002/adma.201504154. [DOI] [PubMed] [Google Scholar]
- 46.Huterer D, Vachaspati T. Distribution of singularities in the cosmic microwave background polarization. Phys Rev D. 2005;72:043004 [Google Scholar]
- 47.Barbier de Reuille P, et al. MorphoGraphX: A platform for quantifying morphogenesis in 4D. Elife. 2015;4:e05864. doi: 10.7554/eLife.05864. [DOI] [PMC free article] [PubMed] [Google Scholar]
- 48.Guo M, et al. Cell volume change through water efflux impacts cell stiffness and stem cell fate. Proc Natl Acad Sci. 2017;114:E8618–E8627. doi: 10.1073/pnas.1705179114. [DOI] [PMC free article] [PubMed] [Google Scholar]
- 49.Kloxin AM, Kloxin CJ, Bowman CN, Anseth KS. Mechanical Properties of Cellularly Responsive Hydrogels and Their Experimental Determination. Adv Mater. 2010;22:3484–3494. doi: 10.1002/adma.200904179. [DOI] [PMC free article] [PubMed] [Google Scholar]
Associated Data
This section collects any data citations, data availability statements, or supplementary materials included in this article.
Supplementary Materials
Data Availability Statement
The data that support the findings of this study are available in the Zenodo repository https://doi.org/10.5281/zenodo.5549501. High resolution images and movies will be available from the corresponding authors (A.R and K.K) upon request.
The Matlab code employed for the 3D orientation analysis is available in the Zenodo repository doi.org/10.5281/zenodo.5680045.


