Fully referenced paragraph
Antibiotics are used to fight pathogens, but also target commensal bacteria, disturbing the gut microbiota composition and causing dysbiosis and disease1. Despite this well-known collateral damage, the activity spectrum of different antibiotic classes on gut bacteria remains poorly characterized. Having previously screened >1,000 drugs on 38 representative human gut microbiome species2, here we characterize further the 144 antibiotics therein. Antibiotic classes exhibited distinct inhibition spectra, including generation-dependence for quinolones and phylogeny-independence for β-lactams. Macrolides and tetracyclines, both prototypic bacteriostatic protein synthesis inhibitors, inhibited nearly all commensals tested, but also killed several species. Killed bacteria were more readily eliminated from in vitro communities than those inhibited. This species-specific killing activity challenges the long-standing distinction between bactericidal and bacteriostatic antibiotic classes, and provides a possible explanation for the strong impact of macrolides on animal3–5 and human6,7 gut microbiomes. To mitigate this collateral damage of macrolides and tetracyclines, we screened for drugs, which specifically antagonized the antibiotic activity against abundant Bacteroides species, but not against relevant pathogens. Such antidotes selectively protected Bacteroides species from erythromyc in treatment in human stool-derived communities and gnotobiotic mice. These findings illluminate the activity spectra of antibiotics in commensal bacteria and suggest strategies to circumvent their adverse effects on the gut microbiota.
Medication is emerging as a major factor influencing the human gut microbiome composition 2,8–10. Although the role ofnon-antibiotic drugshas been until recently unappreciated2,10,11, antibiotics, developed to have broad-spectum activities, are known to also directly impact our gut microbiota. As consequence, they causenumerous gastrointestinal side-effects12, including Clostridioides difficile infections. This collateral damage of antibiotics on the gut microbiota has recently received more attention. In vivo studies have highlighted links between antibiotic-induced longterm microbiota changes and various allergic, metabolic, immunological and inflammatory malfunctions3–7,13,14. Yet, technical difficulties hamper routine testing of antibiotic susceptibility in anaerobes15, and available data on bacterial susceptibility to antibiotics offers minimal resolution on human gut microbes16. Information is missing even for common or disease-associated17,18 gut bacterial species. In addition, animal or cohort studies use few antibiotics or merge data on different antibiotic classes, precluding systematic conclusions on antibiotic collateral damage on gut commensals.
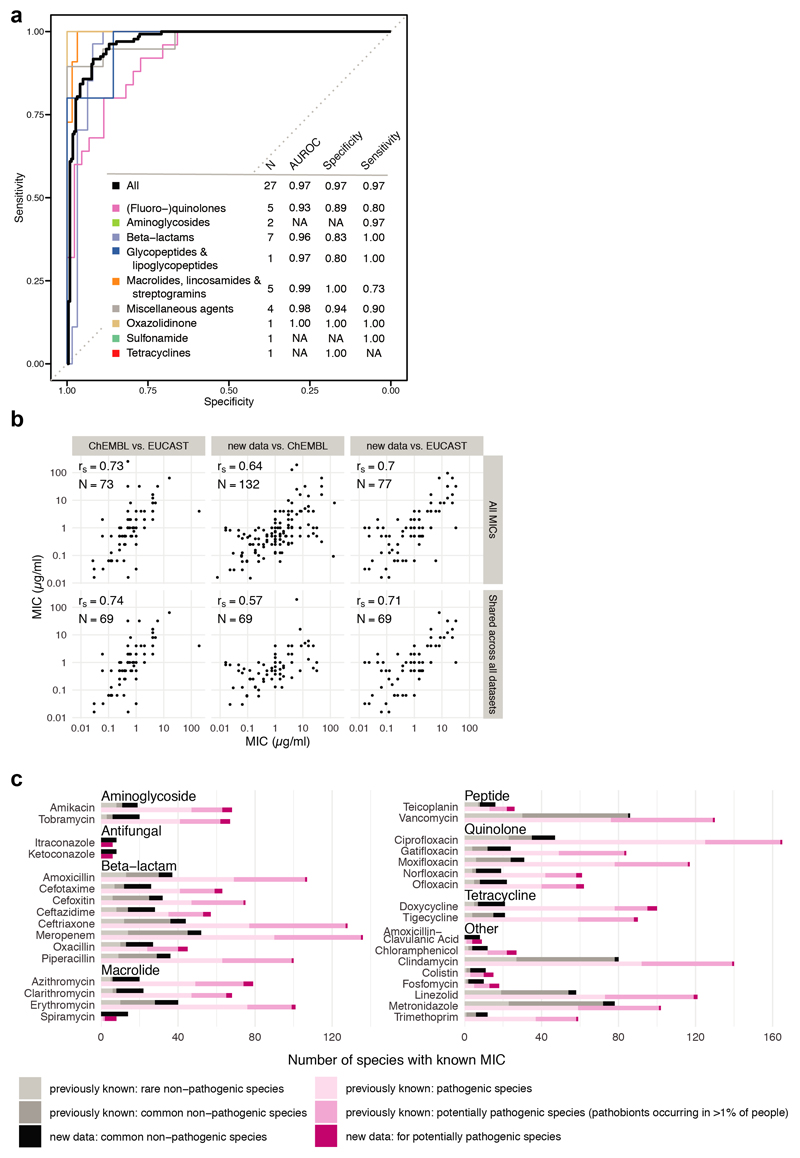
We recently assessed the direct effect of 1197 pharmaceuticals on the growth of 38 prevalent and abundant human gut-derived bacterial species at a concentration of 20μM2. A single wildtype strain was used per species, except for Escherichia coli and Bacteroides fragilis, for which 2 strains were screened (Suppl. Table 1); unless otherwise mentioned, these are also the strains used here when referring to the species. This initial screen (called hereafter “screen”) included 144 antibiotics with discernible class-dependent effects on gut bacteria (Fig. 1a, Extended Data Fig. 1 & Table 2).We validated these results by measuring 815 Minimal Inhibitory Concentrations (MICs) for up to 33 antibiotics and 2 antifungals across 16 strains from the screen and 11 additional ones to account better for intra/interspecies variation within the Bacteroides genus(Extended Data Fig. 2, Suppl. Table 3 & 4). Despite experimental differences, the screen exhibited high specificity and sensitivity, when benchmarked against the MIC data (Extended Data Fig. 3a). The measured MICs also correlated well with the limited available data on antimicrobial susceptibility from EUCAST16 or ChEMBL19 (rs=0.70 and rs=0.64; N=77 and N=132, respectively), despite differences in strains and media used (Extended data Fig. 3b). Importantly, this dataset expands the available MICs, up to75% for non-pathogenic bacteria (Fig. 1b, Extended Data Fig. 3c). Altogether, the screen and MIC dataset provide high-resolution information on the target spectrum of antibiotics on commensal bacteria.
Figure 1. Activity spectrum of antibiotic classes on human gut commensals.
a. Overview of antibiotics tested in initial screen at 20 μM concentration2 and validated by MIC determination in this study.
b. Comparison of measured MICs (dark grey) to available ones from public databases (light grey). Shaded areas represent the overlap. Species are classified as “common” if they are present in the gut microbiome of more than 1% of 727 healthy individuals.
c. MICs of drug-species pairs per antibiotic class (color scheme as in a) are depicted next to EUCAST clinical (susceptibility) breakpoints for pathogens. Numbers of drug-species pairs (MICs; colored) and antibiotic per class (EUCAST clinical breakpoints; grey) are shown in brackets. Boxes span the IQR and whiskers extend to the most extreme data points up to a max of 1.5x IQR, y-axis is log2 scale.
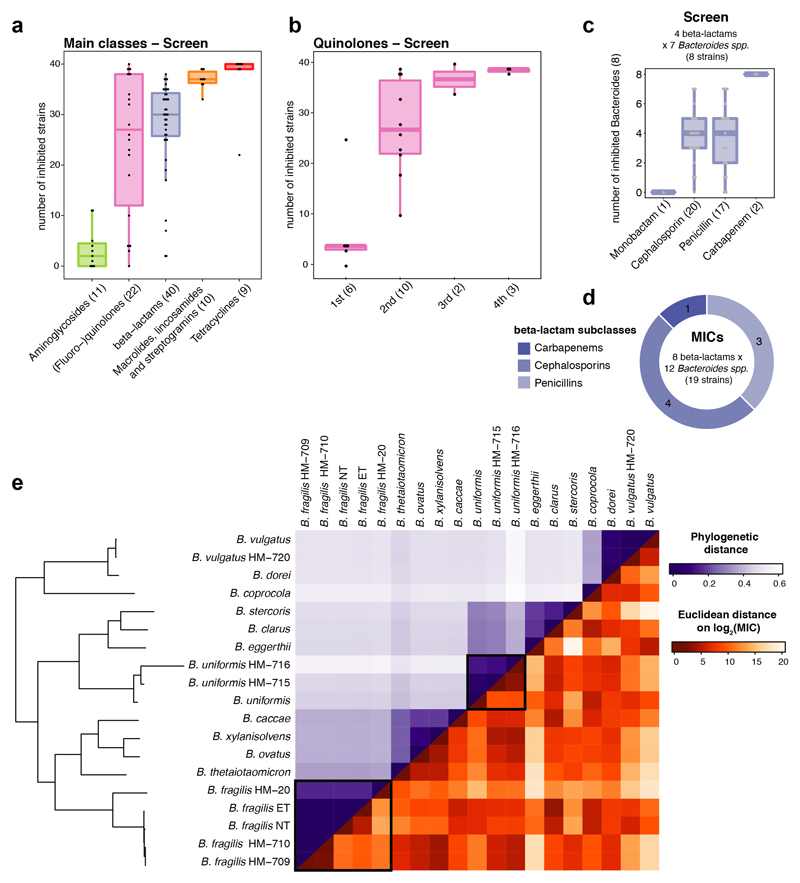
Antibiotic classes exhibited distinct behaviours (Extended Data Fig. 4a). For example, quinolones acted according to their generation. First-generation variants were effective against few microbes, second- and third-generation quinolones had broader activity, and fourth-generation variants (developed to increase activity against anaerobes) inhibited almost all tested species (Extended Data Fig. 4b). For β-lactams, resistance was phylogenetically patchy, which was corroborated by additional data collected for Bacteroides strains and species (Extended Data Fig. 2, 4c-e). β-lactam sensitivity and phylogenetic relatedness within the Bacteroides genus were uncoupled (Extended Data Fig. 4e). This implies that β-lactam resistance mechanisms are strain-specific and horizontally transferred. Macrolides showed a strong impact on gut commensals and inhibited all tested microbes (Extended Data Fig. 4a), except for C. difficile, which was resistant to macrolides and clindamycin (Extended Data Fig. 2, red box), consistent with the known risk of C. difficile infection after macrolide/clindamycin treatment20. Finally, 8/9 tested tetracyclines inhibited nearly all tested species, which is surprising, since the gut microbiota has been considered as reservoir for tetracycline resistance genes21. Concentration-resolved MICs confirmed the drug class-dependent trends observed in the screen. In addition, MICs allowed for comparisons with clinical breakpoints, i.e. MICs below which species is considered susceptible (Fig. 1c). Overall, the gut microbes probed here (anaerobic growth, modified GAM broth22) had slightly higher MICs than those reported for pathogens (aerobic growth, Mueller-Hinton agar). Tetracyclines were the exception, inhibiting commensals at significantly lower concentrations (Fig. 1c).
Recent in vivo studies have shown that β-lactams and macrolides can strongly impact the gut microbiota and there by, the host’s health3–5. As β-lactams exhibited strain-specific activity and are known to kill bacteria (bactericidal), we reasoned they would irrevocably deplete specific microbiota members and hence cause long-lasting effects on community composition. In contrast, macrolides affected all tested gut commensals and are text book bacteriostatic antibiotics, i.e. inhibit bacterial growth, but do not kill (at high numbers). Hence the long term community composition change is harder to rationalize, as all community members are uniformly inhibited, but should regrow once treatment stops. Similarly, bacterio static tetra cyclinesacted across the board and have known gastro intestinal side-effects12, which are indicative of per turbed gut microbiota. We thus wondered at which level macrolides and tetracyclines act differently on gut microbes. Although both clinical use23,24 and basic research25 heavily rely on classifying antibiotic classes as bactericidal or bacteriostatic, there are reports of antibiotics changing killing capacities depending on the organism, drug concentration or medium tested26,27 (and meta-analyses indicating that the distinction has little relevance to clinical practice28,29). We hypothesized that this bacteriostatic/bactericidal divide may be less rigid for gut commensals, since they represent more phylogenetic diversity than the few pathogens usually tested for antibiotic susceptibility.
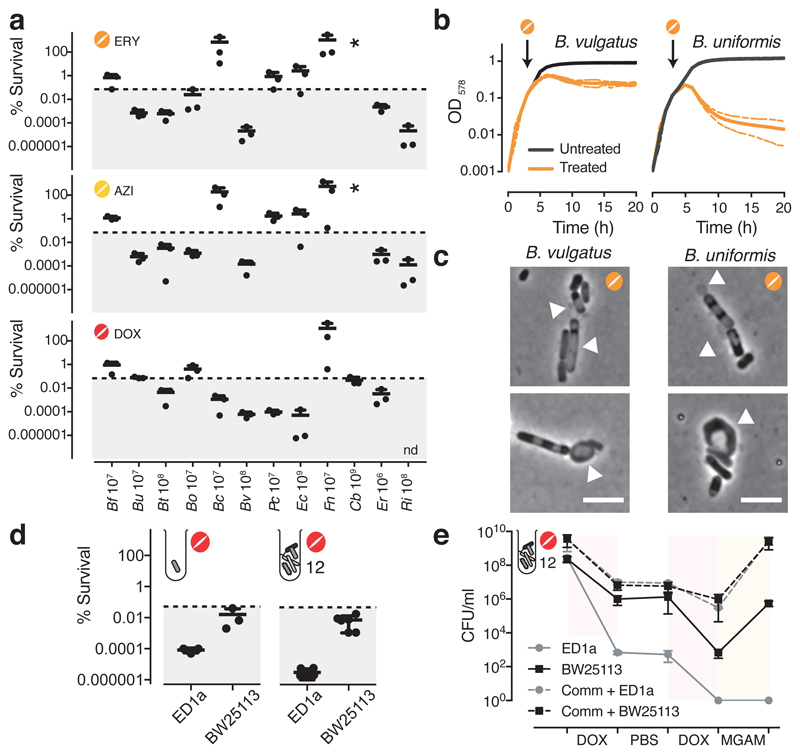
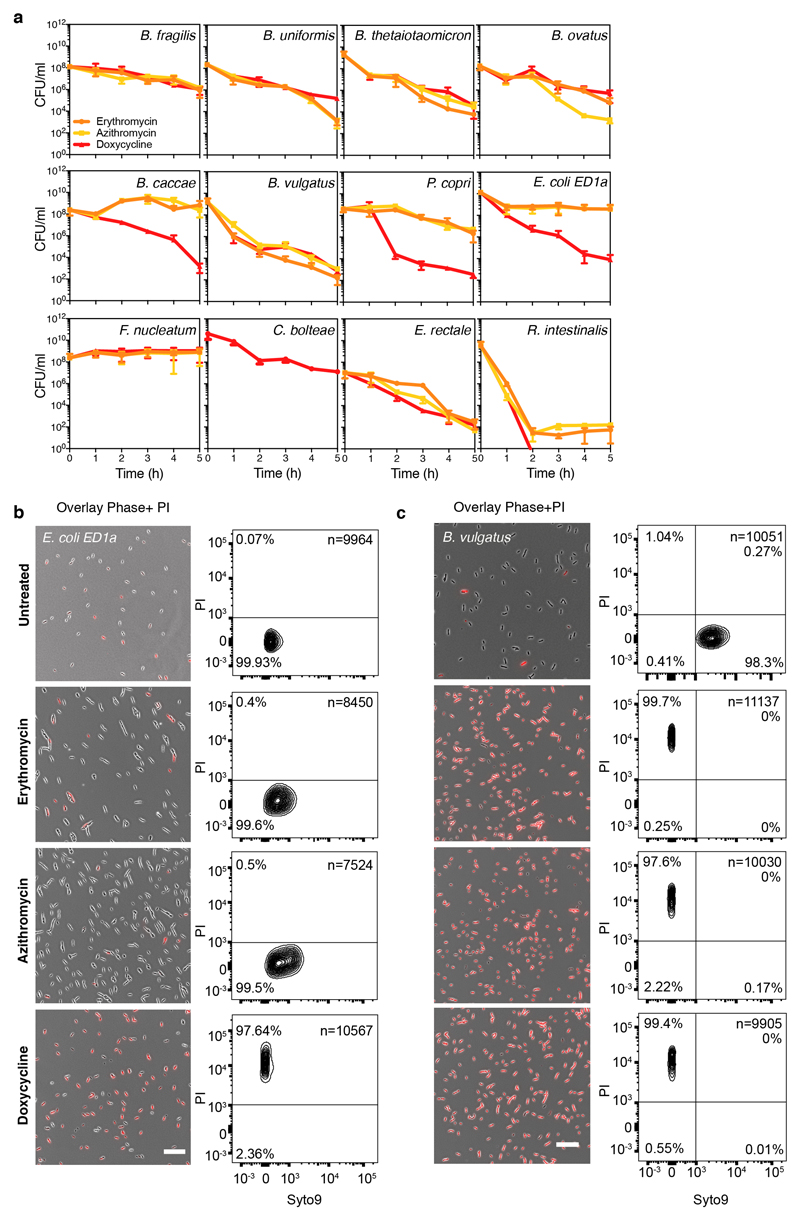
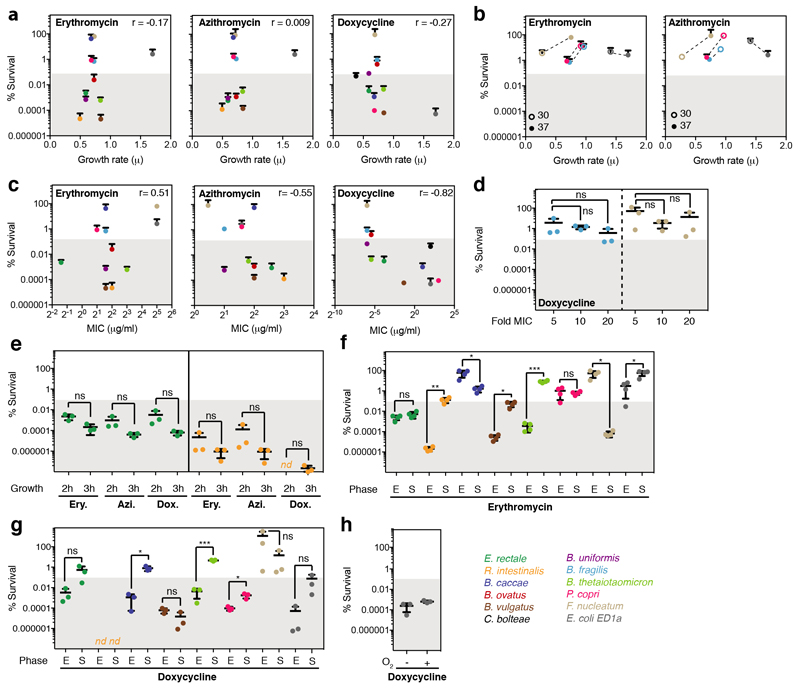
The standard way to determine whether antibiotics are bactericidal is to perform time-kill assays, in which survival is counted on agar (forming colonies) after drug treatment. If over a period of antibiotic treatment (5-24 hours) at concentrations above MIC, the number of colony forming units (CFU)/ml decreases by >99.9%, the antibiotic is considered bactericidal26. We assessed the survival of 12 abundant gut microbes over a 5-hour treatment with a macrolide (erythromycin or azithromycin) or a tetracycline (doxycycline) at 5x MIC (Fig 2a, Extended Data Fig. 5a). In nearly half of the cases, survival decreased (rapidly) by >99.9%, indicating that these drugs are bactericidal to several abundant gut microbes. This was corroborated by testing the viability of B. vulgatus and E. coli ED1a upon erythromycin, azithromycin or doxycycline treatment with microscopy and flow cytometry (Extended Data Fig. 5b). We excluded that differences in killing capacity were confounded by growth rate, growth phase or MIC, and established that active growth was needed for almost all cases of killing (Extended Data Fig. 6). Interestingly, B. vulgatus and B. uniformis cultures lysed when treated with erythromycin (Fig. 2b), as confirmed by time-lapse microscopy − with erythromycin causing cell shape defects and ultimatelyly sing both species (Fig.2c, Videos 1-4). As tetracyclines are established bacteriostatic drugs in E. coli, we were surprised to see that doxycycline killed so effectively the commensal E. coli ED1a (Fig. 2a, Extended Data Fig. 5b). This was also true during aerobic growth (Extended Data Fig. 6h). Doxycycline killed more effciently this natural isolate than the E. coli K-12 lab strain, BW25113, both alone and when part of a 12-member synthetic community (Fig. 2d). We wondered whether this strain-specific killing of E. coli by doxycycline would affect the retentionof E. coli in a microbial community during longer antibiotic exposures. Indeed, E. coli ED1a was eliminated from the same synthetic community after two rounds of doxycycline treatment, while BW25113 was retained and recovered after treatment stopped (Fig. 2e). Altogether, this selective bactericidal activity of macrolides and tetracyclines could explain their strong impact on gut microbiota composition. Conceivably, microbes killed by the antibiotic are more likely to be inadvertently lost from the community, whereas ones inhibited can recover easier after treatment stops.
Figure 2. Macrolides and tetracyclines kill some human gut commensal species.
a. The survival of 12 abundant human gut microbial species was measured after 5h treatment with erythromycin, azithromycin or doxycycline at 5-fold MIC concentrations (mean+SD of 3 independent experiments). CFUs/ml before treatment were set to 100%. Absolute values are indicated next to strain abbreviations – Bf: B.fragilis; Bu: B.uniformis; Bt: B.thetaiotaomicron; Bo: B.ovatus; Bc: B.caccae; Bv: B.vulgatus; Pc: P.copri; Ec: E.coli ED1a; Fn: F.nucelatum; Cb: C.bolteae; Er: E.rectale; Ri: R.intestinalis. Shaded area denotes bactericidal threshold; nd "not detected" (detection limit: 1 CFU/ml); “*“ resistant strains. Species are plotted according to phylogeny.
b. Erythromycin causes lysis in B. vulgatus and B. uniformis. Strains were grown for 3h (arrow) before adding (orange) or not (black) 15 μg/ml erythromycin (5-fold MIC). Growth curves depict mean±SD (dashed line) of 3 independent experiments.
c. Erythromycin induces blebbing, cytoplasmic shrinkage and lysis (white arrows) in B. vulgatus and B. uniformis. Represenative images of phase contrast videos (Supplementary Material) acquired after erythromycin treatment; scale bar5 μm.
d. The commensal E. coli ED1a is more susceptible to doxycycline killing than lab E. coli (BW25113), despite both strains having same MIC (4 μg/ml). Survival of E. coli strains was measured in monocultures or as part of 12-member communities (all species from panel a) after 5h treatment with 5-fold MIC doxycycline (mean±SD of 3-6 independent experiments). CFUs/ml before treatment were set to 100%.
e.E. coli ED1a, but not BW25113, is eliminated from community after two rounds of doxycycline treatment. A 12-member community (same as d) containing either E. coli ED1a or BW25113 was treated with doxycycline for 5h (5-fold E. coli MIC), washed with PBS, treated again with doxycycline, and re-grown in MGAM. CFUs/ml were counted to assess community (dashed lines) and E. coli (solid lines) survival - shown the mean±SD of 3 independent experiments.
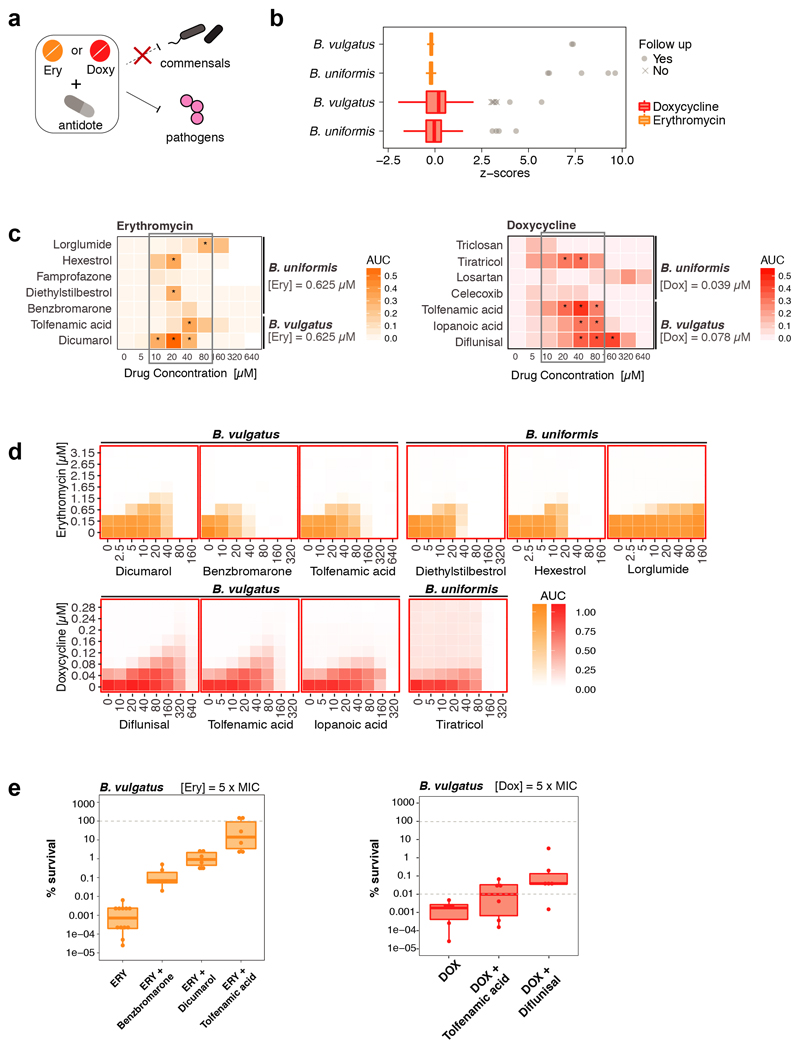
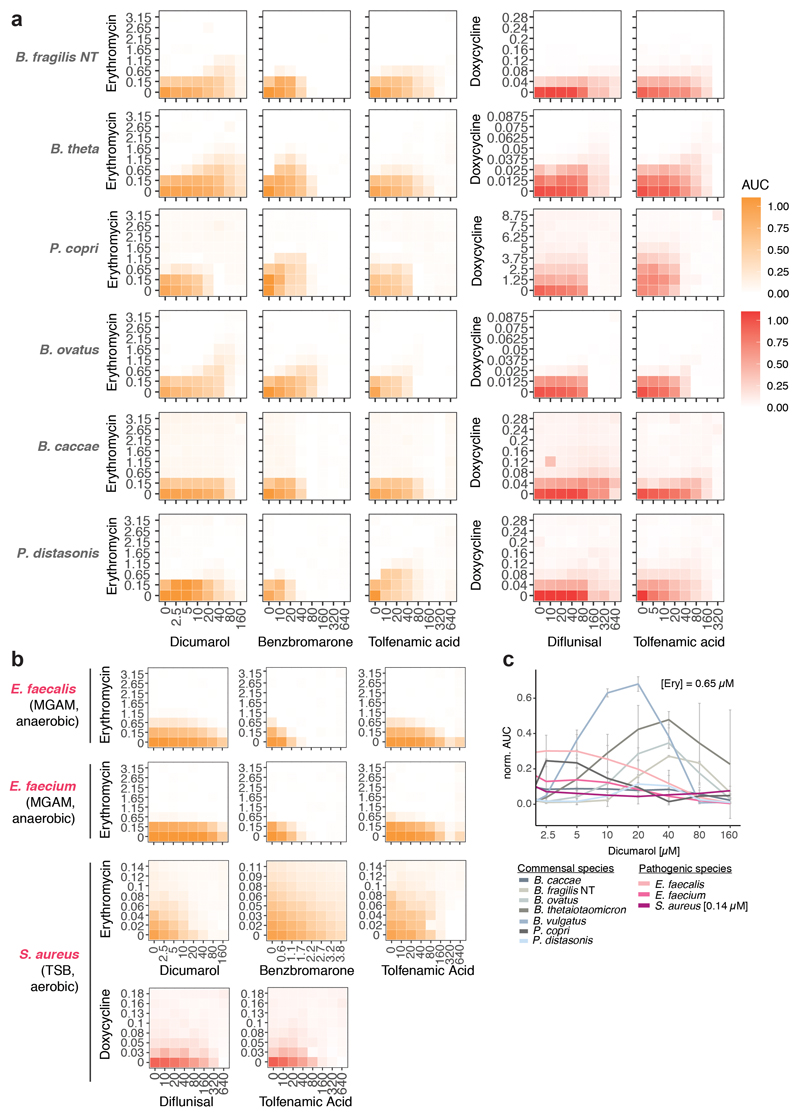
As drugs interactions are often species-specific30, we reasoned that a second drug could selectively antagonize the effect of antibiotics on gut microbes, but not on pathogens – acting as an antidote. Therefore, we screened the same library of 1197 pharmaceuticals (Prestwick library) for compounds that antagonize erythromycin or doxycycline on the abundant gut microbes, B. vulgatus and B. uniformis (Extended Data Fig. 7a). Of the 19 identified hits (Extended Data Fig. 7b, Suppl. Table 5), we tested the 14 over broader concentration ranges. Ten combinations retained antagonistic activity (Extended Data Fig. 7c-d, 8). The strongest antidotes were the anticoagulant drug dicumarol, the uricosuric agent benzbromarone and two non-steroidal anti-inflammatory drugs, tolfenamic acid and diflunisal. While dicumarol and benzbromarone rescued B. vulgatus from erythromycin and diflunisal from doxycycline, tolfenamic acid protected B. vulgatus from both drugs. The antidotesalso partially rescued B. vulgatus killing by both antibiotics (Extended Data Fig. 7e), and protected other phylogenetically related, abundant gut commensals from erythromycin and doxycycline (Extended Data Fig. 8, 9a). Importantly, antidotes did not affect antibiotic efficacy against pathogens for which those antibiotics are prescribed (Extended Data Fig. 9b, Suppl. Table 1).Consistently, tolfenamic acid and dicumarol rescued the growth of most tested Bacteroidetes species at clinically relevant erythromycin concentrations, but allowed erythromycin to act against relevant pathogens (Extended Data Fig. 9c, 11a).
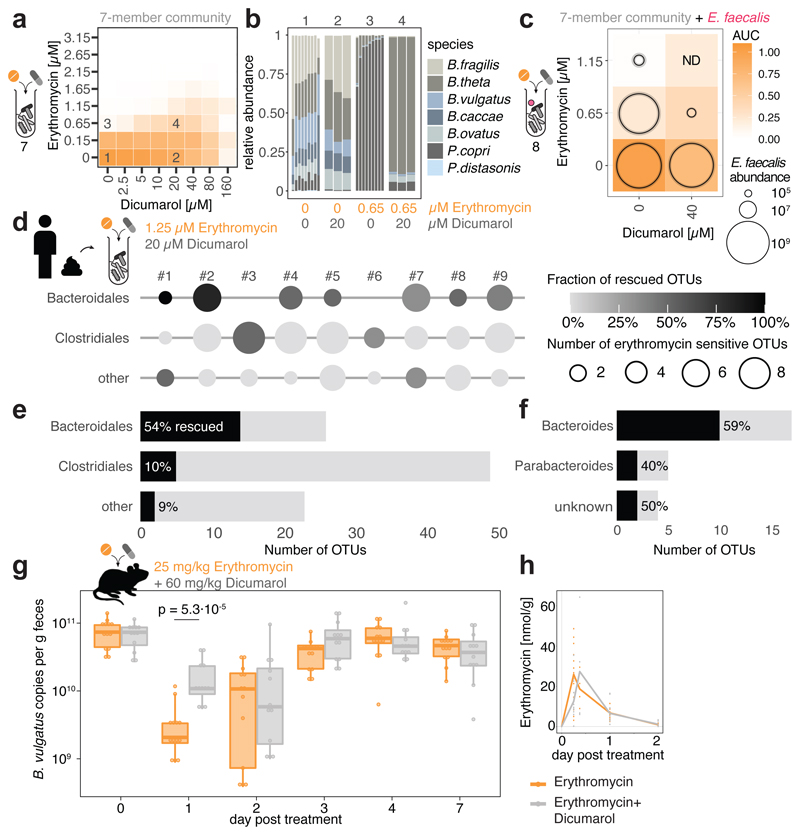
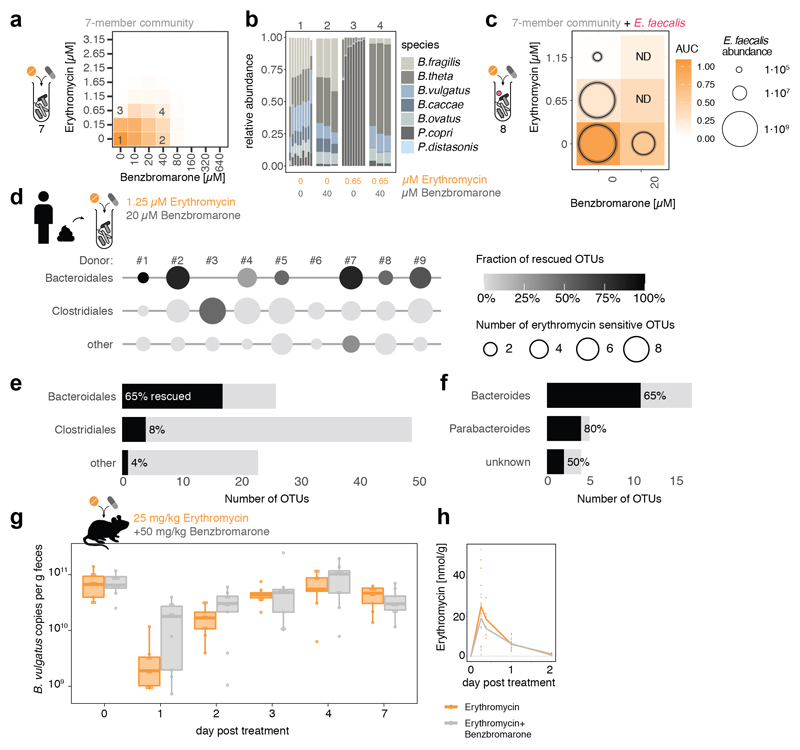
We wondered whether antidotes would also work in community settings. All three antidotes that antagonized erythromycin, also protected a synthetic microbial community composed of seven members of the order Bacteroidales (Fig. 3a, Extended Data Fig. 10a & 11b). The antidotes did not affect community structure when used alone, but protected several Bacteroides species when combined with erythromycin, and prevented the P. copri dominance in the community upon erythromycin treatment (Fig. 3b, Extended Data Fig. 10b & 11c). When including the opportunistic pathogen E. faecalis to these communities, the antidote allowed erythromycin to eradicate E. faecalis from the community, but the community could now grow (Fig. 3c, Extended Data Fig. 10c). We then tested the antidote on nine different complex communities derived from human stool, and all antidotes preferentially rescued Bacteroidales OTUs from erythromycin (Fig. 3d-f, Extended Data Fig. 10d-f, 11d-f). Hence the antidote effect holds largely true, independent of the Bacteroidales species and strains each individual carries. Finally, we tested the ability of dicumarol and benzbromarone to act as macrolide-antidote for B. vulgatus in vivo. First, we stably colonized gnotobiotic mice harboring a defined 12-member mouse microbiome31 with B. vulgatus, and then applied a single oral erythromycin dose alone or together with the antidote. All animals showed significant drops of B. vulgatus counts one day after erythromycin treatment. However, antidote co-treatment mitigated this temporal decline, especially for dicumarol (Fig. 3g, Extended Data Fig. 10g).This effect was not due to changes in fecal erythromycin levels, which were similar for single and double drug treatments, and peaked shortly after administration (Fig. 3h, Extended Data Fig. 10h).
Figure 3. Dicumarol selectively protects Bacteroides species from erythromycin in microbial communities.
a. Checkerboard assay with a synthetic 7-member gut microbial community of Bacteroidales species (B. caccae, B. fragilis NT, B. ovatus, B. thetaiotaomicron, B. vulgatus, P. copri, P. distasonis) indicates that dicumarol rescues overall community growth. Heat map depicts median growth across triplicates.
b. Community compositions in selected erythromycin-dicumarol concentration combinations (1-4 referring to checkerboard tiles in a) demonstrate that dicumarol alone does not alter community structure, but rescues Bacteroides species from erythromycin (primarily B. thetaiotaomicron and B. ovatus, consistent with Extended Data Fig. 9a). Depicted are relative abundances of individual replicates as determined by 16S rRNA sequencing and rescaled to 100%.
c. When the Bacteroidales community contains the pathogen E. faecalis, the antidote dicumarol rescues community growth upon erythromycin treatment, but allows erythromycin to still target E. faecalis (even enhances its activity). Tiles show medians of normalized community growth and circles within tiles represent the mean±SD CFU/ml of E. faecalis (3 biological X 2 technical replicates; initial inoculum: 1.25·106 CFU/ml). ND: not detected (detection limit:104 CFU/ml).
d-f. In complex human-stool derived communities from 9 healthy donors, dicumarol protects most Bacteroidales Operational Taxonomic Units from erythromycin (per order – e; per genus – f), and at least one Bacteroidales OTU per individual. Circle diameter depicts the number of OTUs per order inhibited by erythromycin, and gradient fill the fraction of these OTUs rescued by dicumarol (2 biological X 2 technical replicates). All Bacteroidales of donors #3 and #6 are resistant to the erythromycin concentrations used.
g. Administration of dicumarol mitigates the decrease in fecal B. vulgatus counts that erythromycin causes in gnotobiotic mice colonized with a 12-member mouse microbiome31 and B. vulgatus. The mice were treated once orally with either erythromycin (N=13) or erythromycin/dicumarol (N=12) in three independent experiments. Boxes are plotted as in Fig. 1c. Only p-values for significant differences (two-sided Mann-Whitney U test) between two groups of mice at same day are shown.
h. Fecal erythromycin concentrations and kinetics do not differ between the two groups of mice.
Altogether, we provide a route for identifying antidotes that specifically mitigate the collateral damage of antibiotics on commensals, particularly on Bacteroides spp. This concept needs further development before any application — e.g. antidotes should be tested for dosing or formulation to optimize pharmacokinetics and minimize adverse effects from their primary action. Currently, benzbromarone and dicumarol reach high enough colon concentrations when taken in normal doses2. Dietary compounds may also bear antidote potential.
In summary, this study provides a high-resolution map of the direct effect of antibiotics on human gut bacteria (Suppl. Table 1) down to the level of individual drugs, species and some selected strains. Since not designed to establish translational relevance, future work will be needed to assess the generalizability of these findings, given the intraspecies variation among bacteria. Nevertheless, our results challenge the traditional view that antibiotics are bona fide bacteriostatic or bactericidal, as this hard division breaks in non-model bacteria. Antibiotics that preferentially kill some species may be most detrimental to our gut microbiota, although the first studies in limited numbers of healthy individuals point to the gut microbiota having some resilience against specific antibiotic regimens32. Understanding the underlying mechanisms for this selective killing might open up ways for the development of new antimicrobials and strategies for controlled microbiome modulation33. Overall, interactions of antibiotics and commensals merit deeper exploration, and we anticipate future studies on the variation of antibiotic susceptibility within individual gut microbiomes and its relation to drug use, as well as on the specific antibiotic mode(s) of action and resistance in gut commensals.
Methods
Growth conditions
Species names in the manuscript refer to the strain listed in Suppl. Table 1 and are only further specified if different strains of the same species were tested. All experiments from this study were performed in an anaerobic chamber (Coy Laboratory Products Inc) (2% H2, 12% CO2, 86% N2) and all materials and solutions used for these experiments were pre-reduced for at least 24 h before use unless specified otherwise. Bacteria used in this study were typically pre-cultured for two overnights: Cells were cultured in 5 ml modified Gifu Anaerobic Medium broth (MGAM) (HyServe GmbH & Co.KG, Germany, produced by Nissui Pharmaceuticals) and grown at 37°C overnight. The next day, cells were diluted 1/100 in 5 ml MGAM medium and grown at 37°C for a second overnight before starting the experiments.
Quantitative assay for minimum inhibitory concentration determination with MICs test strips
MICs test strips were purchased from Liofilchem or Oxoid (Suppl. Table 3). All MICs were measured under anaerobic growth conditions inside a Coy anaerobic chamber. Bacteria were pre-cultured in MGAM for two overnights and cultures were diluted to OD578 = 0.5. 50 μl of the diluted culture were spread on a MGAM agar plate and allowed to dry for 15 min. The MIC test strip was placed on the agar with sterile tweezers, allowing the part with the lowest concentration to touch the agar first. Plates were incubated at 37°C inside the anaerobic chamber overnight and longer depending on the species-specific growth requirements. After formation of a symmetrical inhibition ellipse, plates were taken out of the chamber and imaged under controlled lighting conditions (spImager S&P Robotics Inc.) using an 18 megapixel Canon Rebel T3i (Canon Inc. USA). MICs were directly determined from the strip scale at the point where the edge of the inhibition ellipse intersects the MIC test strip. All MICs were determined in duplicates. In cases of an eight-fold difference between the two values, a third replicate was done. In all cases, this resulted in a clear outlier (> 8-fold different from other two MICs) that was removed from the dataset.
MIC comparison to ChEMBL and EUCAST databases
Previously known MICs were extracted from the ChEMBL database (version 24)19 and EUCAST (obtained on May 14, 2018)16. Antibiotics from these two datasets were mapped to our dataset by compound name. Species were mapped using NCBI Taxonomy Identifiers and species names. For MICs from ChEMBL, a keyword-based approach was used to exclude experiments on species with mutations, deletions, insertions, etc. The EUCAST database contains a large number of reported MICs for each compound–species pair. We collapsed these to a single value by calculating the median MIC.
Estimates on the abundance and prevalence of species in the healthy human gut microbiome were calculated using mOTUs v234 as follows: Relative species abundances were determined in 727 shotgun metagenomic samples from donors in the control groups of multiple studies from various countries and continents35–39. Prior to taxonomic profiling, metagenomes were quality controlled using the MOCAT2 -rtf procedure40, which removed reads with ≥95% sequence identity and an alignment length of ≥45bp to the human genome hg19. Taxonomic profiles were then created using mOTUs version 2.1.034 with parameters -l 75 ; -g 2; and -c. Afterwards relative abundances below 10-4 were set to zero and species with nonzero abundance in <5 samples were discarded. For the retained 1,350 species, prevalence was defined as the percentage of samples with nonzero abundance; a prevalence cut-off of 1% was chosen to classify species into “rare” and “common” species. For all species in the MIC dataset, we manually assessed their status as pathogenic or non-pathogenic species using encyclopedic and literature knowledge. Pathogenic species that occur in more than 1% of healthy people (i.e. are designated as “common”) were classified as “potentially pathogenic species” that can, for example, cause diseases in immunocompromised patients.
Killing curves and survival assay
Cells were pre-cultured as described in the growth conditions section before being diluted to an OD578=0.01 and grown for 2 h at 37°C (unless specified otherwise). Next, cells were diluted 1/2 in MGAM containing a 10-fold MIC of erythromycin, azithromycin or doxycycline (final antibiotic concentration is 5-fold MIC) and incubated in the presence of the antibiotic for 5 h at 37°C. 5-fold antibiotic MICs are conventionally used in killing curves to be well above the MIC value. As MICs are not fully precise values and can slightly vary from one experimental set-up to the other, using 5x MIC ensures to reach a concentration that is effective in preventing bacterial growth. At several time-points (0, 1 h, 2 h, 3 h, 4 h, 5 h), 100 μl of cells were serial-diluted in PBS (10-1 to 10-8 dilutions) and plated on MGAM-Agar plates for CFU counting. When no cells were detected using this method, a bigger volume of culture (up to 2 ml) was plated to be able to detect CFUs. Agar plates were incubated overnight at 37°C and colonies were counted the next day, either manually, for low CFU numbers, or using the Analyze Particles tool from ImageJ41. Data was plotted with GraphPad Prism, version 8.
Live/dead staining
Cells were pre-cultured as described in the growth conditions section before being diluted to an OD578=0.01 and grown for 2 h at 37°C. Cells were next diluted 1/2 in MGAM containing 10-fold MIC of erythromycin, azithromycin or doxycycline (final concentration is 5-fold the MIC) and incubated in the presence of the antibiotic for 5 h at 37°C. Then, cells were live/dead stained using the LIVE/DEAD BacLight Bacterial viability and counting kit (#L34856 Molecular Probes, ThermoFisher) according to the manufacturer's protocol before and after antibiotic treatment.
Flow cytometry
Stained cells were counted using a BD LSRFortessa flow cytometer (BD FACSDiva software V8.0.2). The forward and side scatter signals (488 nm) as well as the green and red fluorescent signals (488-530/30A filter and 561-610/20A filter, respectively) were acquired. The FSC/SSC detectors were set to logarithmic scale and gates were set as illustrated in Suppl. Fig. 1. The flow rate varied between 12 μl/min and 60 μl/min depending on the concentration of each sample, and the analysis was stopped when 10,000 target events were measured. Graphs were generated using the FlowJo V10.3 software (Treestar).
Microscopy
For live/dead imaging, stained cells were washed twice in 0.85% NaCl before being spotted on 0.85% NaCl +1% agarose pads between a glass slide and a coverslip. For time-lapse imaging, cells were pre-cultured as described in the growth conditions section. Cells were then diluted to an OD578=0.01 and grown for 3 h at 37°C before being spotted on MGAM +1% agarose pads, supplemented or not with 15 μg/ml erythromycin (5-fold MIC) between a glass slide and a coverslip. Slides were sealed with valap (to avoid/delay oxygen permeation) and taken outside of the anaerobic chamber for imaging. In these conditions, untreated bacteria kept growing rapidly (Video 1 + 3). The imaging was performed using a Nikon Eclipse Ti inverted microscope, equipped with a Nikon DS-Qi2 camera, a Nikon Plan Apo Lambda 60X oil Ph3 DM phase contrast objective and a Nikon HC mCherry filter set (Ex 562/40; DM 593; BA 641/75) to detect propidium iodide fluorescence. Images were acquired with the NIS-Elements AR4.50.00 software and processed with Fiji v.2.0.0-rc-68/1.52h42.
Growth curves
Cells were pre-cultured as described in the growth conditions section. Then, cells were diluted to an OD578=0.01 in a 96-well plate sealed with a breathable membrane (Breathe-Easy®) and grown for 2 h. Next, erythromycin was added to the culture to a final concentration of 15 μg/ml (5-fold MIC) and growth curves were acquired for 20 h using a microplate spectrophotometer (EON, Biotek, Gen5 software V3.05) by measuring the OD578 every hour after 30 sec of linear shaking.
Community assembly
Monocultures were pre-cultured as described in the growth conditions section. In the morning, communities were assembled by mixing equal amounts (volume depending on their individual OD) of the different species, to reach a total OD of 0.01 in MGAM. The 12-member community (Fig. 2) was assembled from monocultures of B. fragilis, B. uniformis, B. thetaiotaomicron, B. ovatus, B. caccae, B. vulgatus, P. copri, F. nucleatum, C. boltae, E. rectale, R. intestinalis and E. coli ED1a or BW25113 (Suppl. Table 1).
To test for E. coli survival, the communities were subsequently grown for 2 h and treated with doxycycline (20 μg/ml; 5-fold MIC) for 5 h. 100 μl of cells were then serial-diluted in PBS (10-1 to 10-8 dilutions) in the absence of oxygen and plated on MGAM-Agar plates for CFU counting of the whole community. To specifically count E. coli survivors, the same dilutions were plated on LB-Agar plates in the presence of oxygen, as none of the other community members grew under aerobic conditions. Plates were incubated at 37°C overnight and colonies were counted the next day, either manually, for low CFU numbers, or using the Analyze Particles tool from ImageJ41.
To test the fate of E. coli strains as part of a synthetic community, cells were grown, assembled in a community as described above and treated with doxycycline (20 μg/ml; 5-fold MIC). After the first 5-h treatment, communities were centrifuged, washed with PBS 3 times to remove residual doxycycline and kept in PBS overnight. The next day, communities were re-suspended in MGAM containing doxycycline (20 μg/ml; 5-fold MIC) and incubated at 37°C for 5 h. They were then washed again with PBS 3 times and re-suspended in MGAM without drug for recovery. CFU/ml of E. coli were counted in all cases.
Screen for microbiome-protective antibiotic antagonism
Preparation of screening plates
The Prestwick Chemical Library was purchased from Prestwick Chemical Inc. and drugs were re-arrayed, diluted and stored in 96 well format as described before2. We prepared drug plates (2 x drug concentration) in MGAM medium and stored them at -30°C. For each experiment, drug plates were thawed, supplemented with the respective antibiotic solution (freshly prepared in MGAM) and pre-reduced in the anaerobic chamber overnight. All rearranging and aliquoting steps were done using the Biomek FXP (Beckman Coulter) system.
Inoculation and screening conditions
Strains were grown twice overnight; the second overnight culture was diluted in MGAM to reach OD578 nm 0.04 (4 x the desired starting OD). 25 μl of the diluted cultures were used to inoculate wells containing 50 μl of 2x concentrated Prestwick drug and 25 μl of the 4x concentrated antibiotic using the semi-automated, 96-well multi-channel pipette epMotion 96 (Eppendorf). Each well contained 1% DMSO, 20 μM of the Prestwick drug and a species-specific antibiotic concentration that was just inhibitory for the respective strain (0.625 μM for erythromycin, 0.04 μM doxycycline for B. uniformis and 0.08 μM doxycycline for B. vulgatus). Plates were sealed with breathable membranes (Breathe-Easy®) and OD578 was measured hourly after 30 sec of linear shaking with a microplate spectrophotometer (EON, Biotek, Gen5 software V3.05) and an automated microplate stacker (Biostack 4, Biotek) fitted inside a custom-made incubator (EMBL Mechanical Workshop). Growth curves were collected up to 24 h. For each antibiotic, each species was screened in biological duplicates. All experiments included control wells of unperturbed growth (32 wells per run) and control wells for growth in the presence of the antibiotic only (8 wells per plate).
Analysis pipeline and hit calling
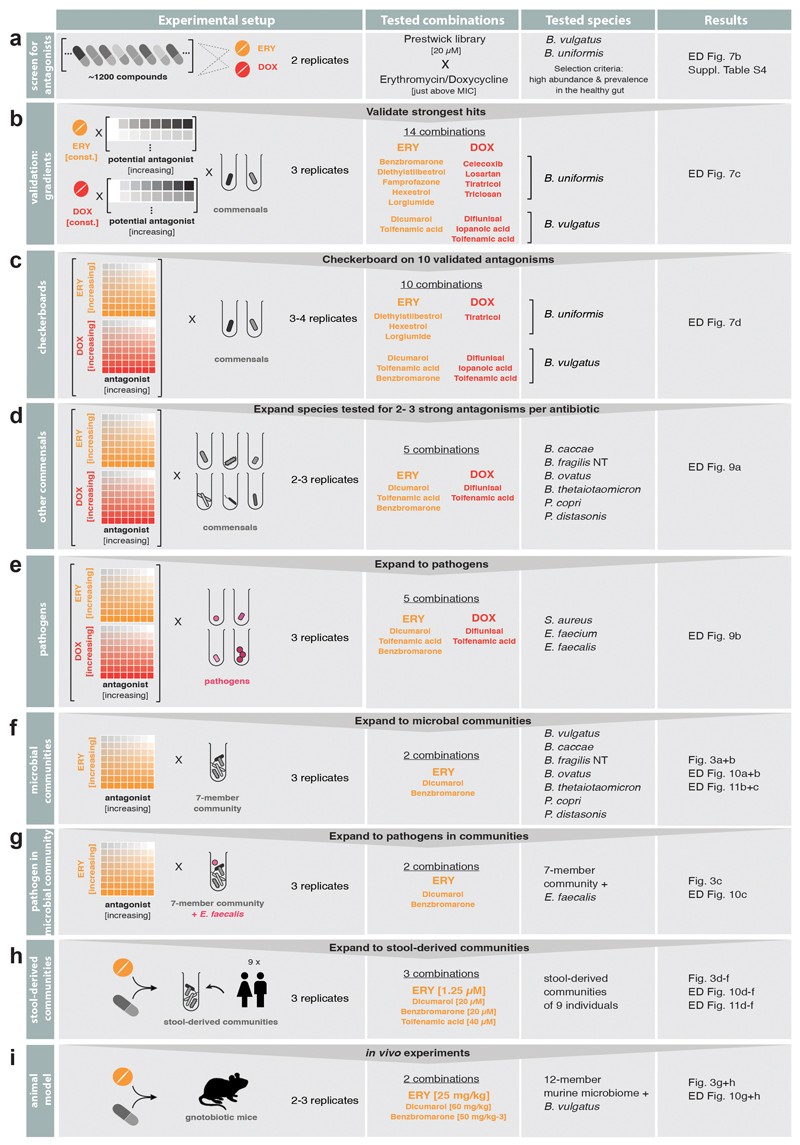
All growth curves within a plate were truncated at the transition time from exponential to stationary phase and converted to normalized AUCs using in-run control wells (no drug) as described before2. We then calculated z-scores based on these normalized AUCs, removed replicates with 8-fold differences in z-scores to eliminate noise effects, computed mean z-scores across the two replicates and selected combinations with mean z-scores > 3. This selection included 19 potential antibiotic antagonists and we followed up on 14 of them (7 potential erythromycin and 7 potential doxycycline antagonists in either B. vulgatus or B. uniformis − see Extended Data Fig. 8) in independent experiments.
Validation of microbiome-protective antagonists
First, we kept the erythromycin/doxycycline concentration constant (0.625 μM for erythromycin, 0.078 μM (B. vulgatus)/0.039 μM (B. uniformis) for doxycycline) and tested concentration gradients of the potential antagonists with ranges depending on the antagonist’s solubility. Compounds were purchased from independent vendors (Suppl. Table 6) and dissolved at 100x starting concentration in DMSO. Eight 2-fold serial dilutions were prepared in 96-well plates with each row containing a different antagonist, sufficient control DMSO wells and wells with just the respective antibiotic (‘antibiotic-only’ control). These master plates were diluted in MGAM medium (50 μl) to 2 x assay concentration and 25 μl freshly prepared antibiotic solution (4x test concentration) was added. Plates were pre-reduced overnight in an anaerobic chamber and inoculated with 25 μl of overnight cultures (prepared as described under Growth conditions) to reach a starting OD578 of 0.01 and 1% DMSO concentration. Growth was monitored hourly for 24 h after 30 sec of linear shaking (as described for the screen2). Experiments were performed in biological triplicates. For analysis, growth curves were converted into normalized AUCs (see above). We accounted for residual growth in the presence of the antibiotic by subtracting the median normalized AUCs of the ‘antibiotic-only’ control per plate. We computed medians across triplicates and considered a normalized AUC > 0.25 as concentration-dependent growth rescue by the antagonist.
Checkerboard assays for anaerobic commensals and pathogens
Validated antagonists were further investigated in 8x8 checkerboard assays, where both antibiotics and antagonists were titrated against each other. Such assays were first performed for the commensals that were originally screened (i.e. B. vulgatus and B. uniformis – 4 replicates) and later expanded towards six other gut microbes (B. caccae, B. fragilis NT, B. ovatus, B. thetaiotaomicron, P. copri, P. distasonis – 2 replicates) and two pathogens (E. faecalis and E. faecium, Suppl. Table 1). For horizontal gradients, 2-fold serial dilutions of the antagonists were prepared first in 100x in DMSO and diluted in MGAM as described above (section ‘Validation of microbiome-protective antagonists’). Vertical antibiotic dilution series were freshly prepared in MGAM at 4x final concentration in 2-fold serial dilution steps. Both, vertical and horizontal dilution series were combined (50 μl of the antagonist gradients (2x) and 25 μl of the antibiotic gradients (4x)) in 96 well plates. Plates were pre-reduced under anaerobic conditions overnight, inoculated with 25 μl of diluted overnight culture (at 4x starting OD) and sealed with breathable membrane (Breathe-Easy®). Bacterial growth was monitored once per hour for 24 h after 60 sec linear shaking (Eon + Biostack 4, Biotek) under anaerobic conditions. Growth curves were converted into normalized AUCs as described using in-plate controls to define unperturbed growth.
Checkerboard assays for pathogens under aerobic conditions
For S. aureus DSM 20231 8x8 checkerboard assays were performed under aerobic conditions in Tryptic Soy Broth using 384 well plates (Greiner BioOne GmbH) with each well containing a total volume of 50 μl. Antidotes were arrayed in the checkerboards in 2-fold serial dilutions, while antibiotics were diluted over a more resolved, evenly spaced gradient, starting from the highest concentration selected. Cells were inoculated at initial OD595 nm ~0.01 from an overnight culture. Plates were sealed with breathable membranes (Breathe-Easy, Sigma Aldrich) and incubated at 37°C with continuous shaking. OD595 nm was measured every 30 min for 16 h. Background due to medium was subtracted and growth curves were trimmed at the transition to stationary phase (6.5 h for S. aureus). AUCs were calculated and normalized by the median of the no-drug control wells present in each plate (n = 6). All experiments were done at least in 3 biological replicates.
Antidote testing in synthetic microbial communities
Checkerboard assays for synthetic microbial communities
The 7-member community was composed of B. vulgatus, B. fragilis NT, B. thetaiotaomicron, P. copri, B. ovatus, B. caccae, P. distasonis and was supplemented with E. faecalis when indicated. Monocultures were diluted to OD578nm (4x desired starting OD) with equal contribution of each member. Checkerboard assays were conducted in MGAM as described for monocultures. For enumeration of final Enterococci counts within synthetic communities, appropriate dilutions of communities were plated out on Enterococci selective medium (azide dextrose broth-based, Oxoid, CM0868) and grown under aerobic conditions. To determine the community composition for selected antidote-antibiotic concentration combinations, the reaction mixture was scaled up to 1 ml volume and the cell pellet was harvested after 24 h incubation.
DNA extraction and 16S sequencing from synthetic and human-stool derived communities
DNA was extracted in 96 deep-well plates. Cells were first washed with PBS and re-suspended in 281 μl of cell suspension solution (MP GNOME DNA kit). Cell suspension was treated with lysozyme (25 μl; 400.000U/ml) and incubated for 1 h at 37°C. Cell suspensions were then further lysed by three freeze/thaw cycles using liquid nitrogen, before the addition of 15,2 μl of cell lysis solution (MP GNOME DNA kit) and 20 μl of RNA mix (MP GNOME DNA kit). A last step of lysis was performed using glass beads (Glasperlen, Edmund Bühler) by bead beating twice for 5 min at 30 Hz in a Tissue Lyzer II (QIAGEN) and by three freeze-thaw cycles in liquid nitrogen. Lysates were then incubated for 30 min at 37°C with shaking. 12,8 μl of protease mix (MP GNOME DNA kit) was subsequently added and the lysates were incubated for 2 h at 55°C. After a 5-min centrifugation step at 3200 x g, 200 μl of supernatants were collected and mixed with 100 μl of TENP buffer43 (50 mM Tris-HCl, pH=8, 20 mM EDTA, 100 mM NaCl, 1% w/vol polyvinylpolypyrrolidone). These supernatants were then incubated for 10 min with 75 μl salt out solution (MP GNOME DNA kit) at 4°C. After a 10 min centrifugation at 3200 x g, 200 μl of supernatant were transferred to a clean plate. 500 μl of ice-cold ethanol and 70 μl of 3M NaOAc pH 5.2 were added. The solution was kept at -30°C overnight. The next day, plates were centrifuged at 4°C, 3200 x g for 45 min. The supernatant was carefully removed and the pellets were washed with 400 μl of ice-cold 70% ethanol. After 20 min centrifugation at 3200 x g at 4°C, all the supernatant was removed and plates were dried in a chemical hood. DNA was re-suspended in 70 μl water overnight at 4°C. The 16S libraries were then prepared for sequencing using a two-step PCR method according to44, using the Phire Hot Start II DNA polymerase (Thermo Scientific). Briefly, the V4 region was amplified by a first PCR. These amplicons were subsequently amplified again using barcoded primers that contain Illumina adaptors. These libraries were sequenced on a MiSeq (250 PE).
16S rRNA amplicon data processing and analysis for synthetic communities
Raw reads were quality trimmed, de-noised and filtered against chimeric PCR artifacts using DADA2 V.1.18.045. Resulting ASVs were mapped against the full-length 16S rRNA gene sequences of expected species using BLAST46 to determine species relative abundances through total sum scaling. ASVs mapping with less than 98% (maximum 2 mismatches) to any of the expected species were treated as contamination, but attracted a negligible number of reads overall. Triplicates were summarized via the median of species relative abundances and re-scaled to 100%.
Antidote testing in human-stool derived communities
EMBL Bioethics Internal Advisory Committee approved all experiments involving human-stool-derived material and informed consent was obtained from all donors (BIAC2015-009). Fresh stool samples from nine healthy volunteers were immediately placed in an anaerobic chamber, mixed 1:1 (w/v) with 40% glycerol in PBS + 0.5 g/l cysteine, stirred and aliquoted into 700 μl glycerol stocks. For each one of the donors, one aliquot was diluted in 50 ml MGAM medium, serially diluted and grown at 37°C under anaerobic conditions for 24 hours. After the 24 h incubation, 800 μl of the serially diluted cultures were mixed with 200 μl of 50% glycerol and stored at -80 °C for a maximum of 7 months. For antidote assays, microbial communities derived from the 1000-fold dilution frozen stock were inoculated into fresh MGAM overnight. Each community was diluted to reach the starting OD578 of 0.01 in deep well plates containing the indicated antibiotic-antidote combinations in fresh MGAM medium (final volume was 1 ml per well). Deep well plates were incubated at 37°C for 20 h under anaerobic conditions and cell pellets were harvested by centrifugation. DNA extraction and 16S sequencing were performed as described above. Assays were performed in two biological replicates with two technical replicates each.
16S rRNA amplicon data processing from stool-derived communities
Raw reads were quality trimmed, de-noised and filtered against chimeric PCR artefacts using DADA2 V1.8.045. The resulting exact Amplicon Sequence Variants (ASVs) were taxonomically classified and mapped to a reference set of Operational Taxonomic Units (OTUs) at 98% sequence similarity using MAPseq V1.2.347. Reads that did not confidently map to the reference were aligned to bacterial and archaeal secondary structure-aware SSU rRNA models using Infernal V1.1.248 and clustered into OTUs with 98% average linkage using hpc —clust V1.2.149, as described previously50. Sequencing experiments, which yielded less than 2000 reads, and OTUs with less than ten reads across all conditions were discarded. Combined fold changes and p-values were computed from all replicates using DESeq2 V1.32.051,52 without filtering outliers. We corrected for multiple hypothesis testing53 separately for each of the three antidotes. OTUs inhibited by erythromycin compared to untreated samples were first determined (adjusted p-value < 0.1, >2-fold reduction). For these OTUs, we computed adjusted p-values for the abundance change between treatments with erythromycin alone and with both erythromycin and the antidote under consideration. An OTU was considered to be rescued by the antidote if the adjusted p-value was below 0.1 and there was at least a two-fold increase.
Antidote testing in a gnotobiotic animal model
Animal experiments
All animal experiments were approved by the local authorities (Regierung von Oberbayern, ROB-55.2-2532.Vet_02-17-120). Gnotobiotic C57BL/6J mice that were stably colonized with the Oligo-Mouse-Microbiota bacterial consortium31, housed at 22 +/- 1.5°C, 50 +/- 5% humidity, 12-hour light/12-hour dark cycle and bred in flexible film isolators (North Kent Plastic) were used in this study. For all experiments, female and male mice between 6-12 weeks were used and animals were randomly assigned to experimental groups. During experiments, gnotobiotic mice were supplied with autoclaved ddH2O and Mouse-Breeding complete feed for mice (Ssniff) ad libitum. All animals were scored twice daily for health status. Mice were pre-colonized with B. vulgatus DSM 1447 by administration of a B. vulgatus culture 50 μl orally and 100 μl rectally, seven to ten days before drug treatment. Mice were treated by oral gavage either with a single dose of 25 mg/kg erythromycin, a combination of 25 mg/kg erythromycin plus 60 mg/kg dicumarol54 or a combination of 25 mg/kg erythromycin plus 50 mg/kg benzbromarone55. All drugs or drug combinations were applied as suspension in 100 μl sterile corn oil. Two faecal pellets per mouse were collected before drug treatment and at 6 h, 9 h, day 1, 2, 3, 4 and 7 post treatment. One pellet was used for the enumeration of B. vulgatus counts and the second pellet to determine the fecal antibiotic concentration. At day 7 post treatment, mice were sacrificed by cervical dislocation.
DNA extraction from fecal samples and enumeration of fecal B. vulgatus copy numbers
For gDNA extraction from fecal pellets the phenol/chloroform method as described in56 was used. To quantify B. vulgatus copy numbers, quantitative PCR was performed as previously described31 using B. vulgatus 16S rRNA specific primers (NT5001_fwd1: TGGATGCCAATCCCCAAA, NT5001_rev1: GTGGAGTCGGGTTGCAGACT, NT5001_probe1: CCTCTCTCAGTTCGGACTG with 5' HEX - 3' BHQ-1 modifications). qPCR standard curves were determined using linearized plasmid as DNA template.
Quantification of fecal drug concentrations
Chemicals and equipment
All chemicals for LC-MS analysis, including water and acetonitrile, (LC-MS grade) were purchased from Fisher Scientific. Standards for online mass calibration were purchased from Agilent Technologies.
Sample preparation
300 μL of solvent mixture (acetonitrile: methanol, 1:1) containing the internal standard (IS) warfarin at 640 nM and 1 Tungsten Carbide Bead, 3 mm from Qiagen were added to each faecal sample. Samples were homogenised by bead-beating on Qiagen TissueLyser II at 30 Hz for 5 min. The lysed samples were centrifuged at 10,000 RCF at 4°C for 12 min. Equal volumes (70 μL) of extraction supernatant and water were mixed in Nunc 96-well, V-shape plates. 10 μL samples were further diluted in 30 μL of water for LC-MS analysis.
LC-MS measurements
Chromatographic separation was performed using an Agilent InfinityLab Poroshell 120 HPHC-C18, 3.0 mm × 150 mm, 1.9 μm column and an Agilent 1290 Infinity II LC system coupled to a 6550 iFunnel qToF mass spectrometer. The column temperature was maintained at 45°C with a flowrate of 0.5 mL/min. The following mobile phases were used: Mobile phase A: Water with 0.1% formic acid and mobile phase B: Acetonitrile with 0.1% formic acid. 5 μL of sample were injected at 5% mobile phase B, maintained for 0.10 min, followed by a linear gradient to 95% B in 10 min and maintained at 95% B for 1 min. The column was allowed to re-equilibrate with starting conditions for 1.1 min before each sample injection. The mass spectrometer was operated in positive scanning mode (50–1,700 m/z) in positive scanning mode (50-1,700 m/z) with previously reported parameters57.
Standard curves for each compound were obtained by serial-diluting each compound in water at 2-fold from 5 μM to 4.9 nM and limits of detection for each compound were determined based on the resulting standard curves.
Quantification and data analysis
The MassHunter Qualitative Analysis Software (Agilent Technologies, version 10.0) was used to determine retention time for each compound. Peak integration was carried out using MassHunter Quantitative Analysis Software (Agilent Technologies, version 10.0) with the following setting: mass tolerance = 20 ppm, peak filter at signal-to-noise ratio = 3, and retention time tolerance of 0.2-0.5 min. Total drug amounts in each intestinal compartment were calculated using the corresponding total sample weight.
Phylogenetic analysis/phylogenetic tree construction
In order to generate a phylogenetic tree for the different isolates, the nucleotide sequences for a set of universally occurring, protein coding, single copy phylogenetic marker genes34,58 were extracted from reference genomes or genome assemblies using fetchMG V1.058 (https://motu-tool.org/fetchMG.html). Within the framework of the ete3 toolkit V3.1.159, ClustalOmega V.1.2.460 was used to create sequence alignments for each marker gene independently and all columns with more than 10% gaps were removed. The individual alignments were concatenated and finally, a phylogenetic tree was inferred from the combined alignment using IQTree V1.5.561. In Fig. 2a, tree is not shown due to space restrictions, but species are presented according to the tree order.
Extended Data
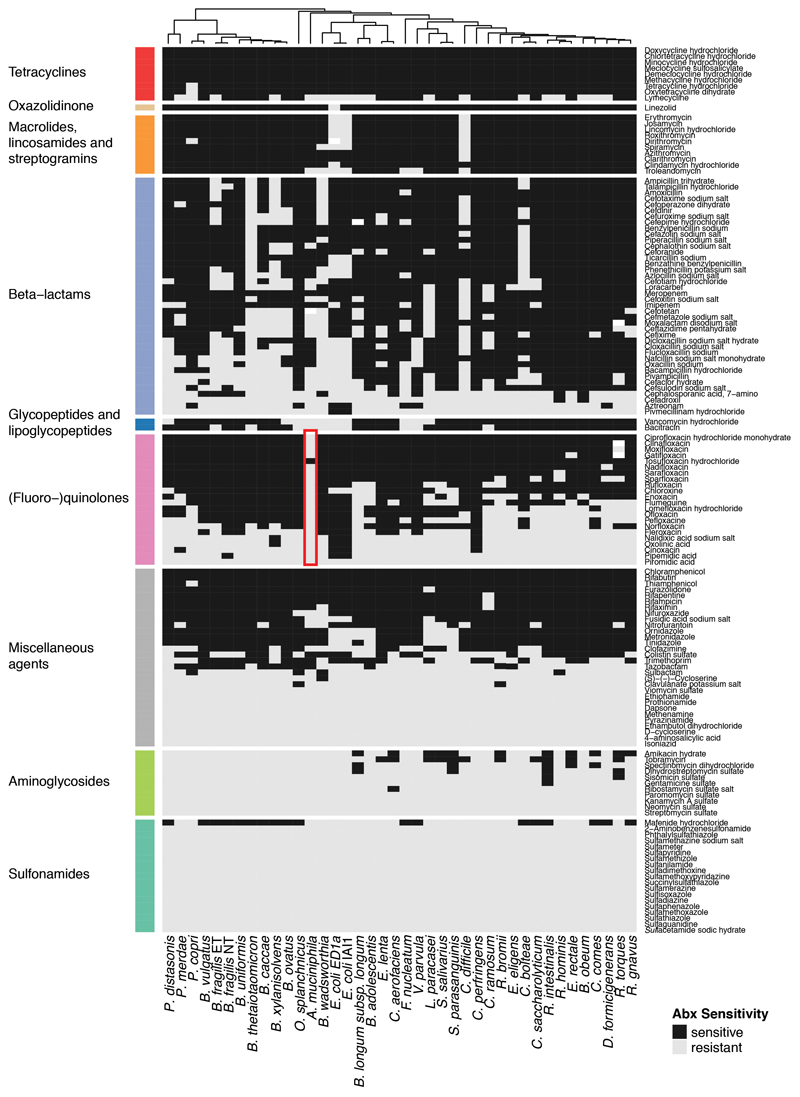
Extended Data Figure 1. Effects of 144 antibiotics on 40 human gut commensals.
Heat map according to sensitivity or resistance of each strain to the respective antibiotic at a concentration of 20 μM. Antibiotics are grouped according to drug classes and species are clustered according to their responses across the 144 antibiotics tested. Data is replotted from2. Of note, Akkermansia muciniphila, a species associated with protection against different diseases and dysbiotic states62, and even positive responses to immunotherapy63, is resistant to nearly all quinolone antibiotics (red box). We consolidated this finding by MIC determination for Ciprofloxacin (>32 μg/ml), Gatifloxacin (>32 μg/ml), Moxifloxacin (>32 μg/ml), Norfloxacin (>256 μg/ml) and Ofloxacin (>32 μg/ml).
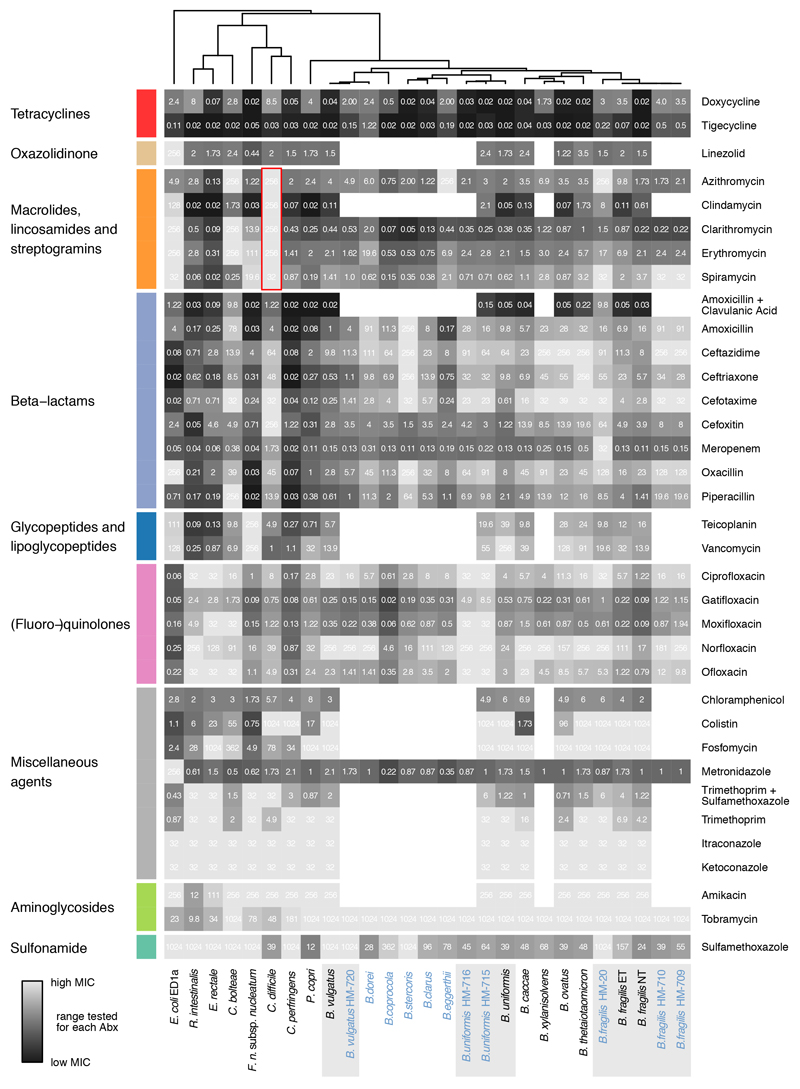
Extended Data Figure 2. MICs for 20 species/27 strains on 35 antimicrobials.
Heat map depicts MICs for each drug-strain pair in μg/ml. Heat map color gradient is adjusted to the MICs concentration range tested on the respective MIC test strip. Black depicts sensitivity and light grey resistance. Mean values across two biological replicates are shown (Suppl. Table 4). The species/strains from the screen are shown in black, additional strains to investigate intraspecies and intragenus variation within the Bacteroides genus are shown in blue. The grey background indicates that several strains per species were tested. Of note, C. difficile is particularly resistant to all tested macrolides and clindamycin (red box).
Extended Data Figure 3. MIC dataset validates antibiotic sensitivity profiles from the screen and is consistent with publically available MICs.
a. Receiver operating characteristic (ROC) curve analysis was performed to evaluate sensitivity and specificity of the screen2 using the MIC dataset. Results from the screen were considered as validated if MICs were below/above the 20 μM antibiotic concentration that was tested in the screen (allowing a two-fold error margin). N is the number of antibiotics that we tested both in the screen and determined MICs for; AUROC is the area under the characteristic ROC. TN denotes true negatives, FP false positives, TP true positives, FN false negatives.
b. Comparison including Spearman correlation coefficients of the MICs from this study to MICs from the ChEMBL19 and EUCAST16 databases. Panels in the upper row: comparison between all MICs that are shared between the two indicated datasets. Panels in the lower row: comparison of the 69 MICs that are shared across all three datasets. Despite experimental differences, our MICs correlate well with available EUCAST/ChEMBL data.
c. Number of the sum of new (this study) and already available MICs (EUCAST/ChEMBL) per drug according to antibiotic class and prevalence/virulence of the bacterial species. The new dataset expands MICs across the board and specifically fills the knowledge gap on non-pathogenic species.
Extended Data Figure 4. Antibiotic classes exhibit distinct behaviours in gut bacterial species.
a. Number of inhibited strains per antibiotic class (number of tested drugs per class in brackets). In total 40 strains were tested at a 20 μM antibiotic concentration. Boxes span the IQR and whiskers extend to the most extreme data points up to a max of 1.5 times the IQR.
b. Number of inhibited strains per (fluoro-)quinolone drug generation. Number of tested drugs per generation is indicated in brackets - boxplots as in a.
c-d. Overview of the number of drugs tested per β-lactam subclasses on Bacteroides species (spp) in screen (c) and for MICs (d).
e. Heat map of phylogenetic relationship between Bacteroides spp (upper triangular matrix) ordered by phylogeny and their resistance profiles across β-lactam antibiotics (lower triangular matrix). Colors represent the pairwise phylogenetic distance and the Euclidean distance on the log2 transformed MICs for β-lactams. Examples of strains from the same species (B. fragilis / B. uniformis) that respond differently to β-lactam antibiotics, are highlighted.
Extended Data Figure 5. Selective killing of macrolides and tetracyclines.
a. Time-kill curves. The survival of 12 abundant gut microbes was assessed over a 5 hour-treatment with either erythromycin, azithromycin or doxycycline. The graph shows the mean±SD of 3 independent experiments.
b. Live/dead staining of macrolide or tetracycline-treated E. coli ED1a and B. vulgatus. The left panel shows an overlay of phase contrast and fluorescence microscopy images of propidium iodide (PI)-stained E. coli ED1a or B. vulgatus before and 5 hours after erythromycin, azithromycin or doxycycline treatment. Cultures were concentrated before imaging; the scale bar is 10 μm. The right panel shows the corresponding quantification of live/dead-stained cells by flow cytometry with Sy to 9 on the x-axis (live cells) and PI on the y-axis (dead cells). As E. coli ED1a cells stain poorly with Sy to 9, we only quantified PI stained cells in this case. Both the total number of measured events (n) and the percentage of cells found in each region of the graph are indicated.
Extended Data Figure 6. Assessing potential confounding factors for the killing capacities of erythromycin, azithromycin and doxycycline.
a. Scatter plot of individual bacterial growth rates (μ) and percentage survival after a 5-hour treatment with 5-fold MIC of erythromycin, azithromycin or doxycycline. ris the Spearman correlation coefficient. Tested species are color-coded here and, in all panels thereafter as indicated at the bottom of this figure.
b. B. fragilis (blue), F. nucleatum (beige), P. copri (pink) and E. coli ED1a (grey) survival was assessed after a 5h erythromycin and azithromycin treatment (5-fold MIC) at 30°C (slow growth) and 37°C (fast growth) - mean±SD of three independent experiments. No monotonic trend was observed.
c. Scatter plot of MICs and % survival after a 5h treatment with 5-fold MIC of erythromycin, azithromycin or doxycycline. r is the Spearman correlation coefficient. Doxycycline exhibited a significant (p-value=0.0015) anti-correlation, i.e. more sensitive species to doxycycline (lower MIC) survived better when treated with antibiotic. Therefore, we tested further whether increasing the drug concentration in sensitive strains increased killing (panel d).
d. B. fragilis (blue) and F. nucleatum (beige) survival after a 5-hour treatment as function of increasing doxycycline concentrations (mean±SD of three independent experiments). No significant differences observed. In all cases doxycycline remained bacteriostatic. Significance calculated by unpaired two-sided t-test here and in all panels thereafter.
e. To evaluate whether outgrowth from stationary phase affected our results, we selected two slow-growing strains, E. rectale (green) and R. intestinalis (orange) and grew them for 2 or 3h after diluting from an overnight culture to an of OD578 0.01. Both strains were then treated for 5h with 5-fold MIC of erythromycin, azithromycin or doxycycline and their survival was assessed (mean±SD of three independent experiments). Although 3h grown cultures were killed slightly more effectively (difference is not statistically significant due to low number of replicates), this did not change the bactericidal or bacteriostatic characteristic of antibiotics. If anything, this means that we underestimate the killing for slow-growers, since all other experiments were performed with 2 h outgrowth. Nd: not detected (detection limit: 1 CFU/ml.)
f-g. The survival of 8 selected gut microbes was measured after treating cells in exponential phase (E – 2h after dilution from an overnight culture) or in stationary phase (S – overnight growth) with 5-fold MIC of erythromycin (f) or doxycycline (g) for 5h (mean±SD of three independent experiments). Consistent with the knowledge that antibiotic killing requires active growth, survival is higher in stationary phase for most strains (but not all – see F. nucleatum) that erythromycin or doxycycline kills. ns = non-significant; *, ** and *** denote p-value <0.05, <0.01 and <0.001, respectively. nd as in e.
h. E. coli ED1a survival was assessed after 5h treatment with 5-fold MIC of doxycycline in the presence or absence of oxygen. Killing was similar in both conditions.
Extended Data Figure 7. Identification and validation of macrolide and tetracycline antagonists (antidotes) in B. vulgatus and B. uniformis.
a. Schematic illustration of combinatorial screen concept: searching for antidote compounds that antagonize the antibacterial effect of erythromycin or doxycycline on commensal but not on pathogenic bacteria.
b. Z-scores on bacterial growth for combinatorial drug exposure with antibiotic and 1197 FDA-approved drugs of Prestwick library (2 replicates). Compounds that successfully protected B. vulgatus and/or B. uniformis in the presence of antibiotic (z-score > 3) are indicated in gray. The strongest hits (circles) were validated in concentration-dependent assays (c-d). Box plots as in Fig. 1c.
c. Validation of the strongest antagonistic interactions in independent experiments. Erythromycin and doxycycline concentrations were kept constant for each species and concentration ranges were tested for antagonist. Asterisks indicate that at least 25% of the bacterial growth (compared to no drug controls) could be rescued by the antagonist at a given concentration. Heat map depicts median growth across triplicates.
d. For 10 of the validated antagonists, 8 x 8 checkerboard assays were performed to define better the range of the antagonistic interaction. Heat maps depict bacterial growth based on normalized median of AUCs of 3-4 replicates. Antagonistic interactions are framed in red (all).
e. Percentage of surviving B. vulgatus cells were determined after 5h incubation with either erythromycin (3.25 μM) or doxycycline (0.4 μM) alone or in presence of benzbromarone (40 μM), dicumarol (20 μM), tolfenamic acid (40 μM) or diflunisal (80 μM). Data is based on three independent experiments. Boxplots are plotted as in Fig. 1c.
Extended Data Figure 8. Schematic overview of screen for microbiome-protective antibiotic antidotes.
Workflow with decision process on which erythromycin and doxycycline antagonists to move on to next evaluation step.
Extended Data Figure 9. Antidotes work on further gut commensals, but do not compromise antibiotic efficacy on relevant pathogens.
a. 8 x 8 checkerboard assays to investigate if antidote is also protective for additional gut commensals. All combinations were tested in MGAM medium under anaerobic conditions. Heat map depicts bacterial growth based on median AUCs from 2-3 independent replicates. Concentrations are stated in μM.
b. 8 x 8 checkerboard assays to evaluate antidote effects on the activity of erythromycin and doxycycline in relevant pathogenic species. The gastrointestinal pathogens E. faecalis and E. faecium were tested under anaerobic conditions. S. aureus, a cause of extra-intestinal infections, such as bacteremia and infective endocarditis, was tested under aerobic conditions. Heatmaps depict mean normalized AUCs of three biological replicates. Antidotes exhibit either neutral or even slight synergistic effects with antibiotics.
c. Dicumarol rescues commensal growth (n=2, anaerobic conditions) in a concentration-dependent manner. Erythromycin still retains its activity against pertinent pathogens such as E. faecium, E. faecalis (n=3, anaerobic conditions) and S. aureus (n=3, aerobic conditions) - see Suppl. Table 1 for strains used. 0.65 μM (~0.5 μg/ml) erythromycin is within range of the MIC breakpoints for Staphylococcus (1 μg/ml) and Streptococci groups A, B, C & G (0.25 μg/ml). Error bars depict standard deviation.
Extended Data Figure 10. The antidote benzbromarone selectively protects Bacteroides species from erythromycin in microbial communities.
a. The same7-member synthetic gut microbial community as in Fig. 3a can be protected from erythromycin by the antidote benzbromarone. Heatmaps depict median bacterial growth based on normalized AUCs of the community of three replicates.
b. Community compositions in selected erythromycin-benzbromarone concentration combinations (1-4 referring to checkerboard tiles in a) demonstrate that benzbromarone alone does not alter the community structure, but rescues some Bacteroides species and largely the community composition from erythromycin treatment. Depicted as in Fig. 3b - control and erythromycin alone experiments same as in Fig. 3b.
c. When the Bacteroidales community contains the pathogen E. faecalis, benzbromarone rescues community growth upon erythromycin treatment, but enhances the ability of erythromycin to target E. faecalis. Plotted as in Fig. 3c.
d-f. In complex human-stool derived communities from nine healthy donors (column #1 – 9), benzbromarone protects 65% of Bacteroidales OTUs from erythromycin, and at least one Bacteroidales OTU per individual (2 biological X 2 technical replicates). Plotted as in Fig. 3d. The fractions of rescued OTUs per order (e) and for Bacteroidales OTUs per genus (f) across all nine donors indicate that primarily Bacteroides species are rescued.
g. In gnotobiotic mice colonized with a defined 12-member mouse microbiome31 and B. vulgatus, administration of benzbromarone slightly (albeit not significantly, two-sided Mann-Whitney U test) mitigates the temporal decrease in fecal B. vulgatus counts that erythromycin causes. Mice received a single oral dose of erythromycin (N=9) or erythromycin + benzbromarone (N=9) in two independent experiments. Data of the erythromycin-treated group is partially overlapping with data shown in Fig. 3g as experiments were conducted in parallel. Boxes are plotted as in Fig. 1c.
h. Both groups of mice show similar fecal erythromycin concentrations over the course of the experiment shown in g.
Extended Data Figure 11. The antidote tolfenamic acid protects Bacteroides species from erythromycin in microbial communities.
a. Tolfenamic acid rescues commensal growth (based on median AUCs, N=2) at clinical relevant erythromycin concentrations in a concentration-dependent manner (anaerobic conditions). Erythromycin still retains its activity against pertinent pathogens such as E. faecium, E. faecalis (based on median AUCs, N=3, anaerobic conditions) and S. aureus ([erythromycin]=0.14 μM, N=3, aerobic conditions). Error bars depict standard deviation.
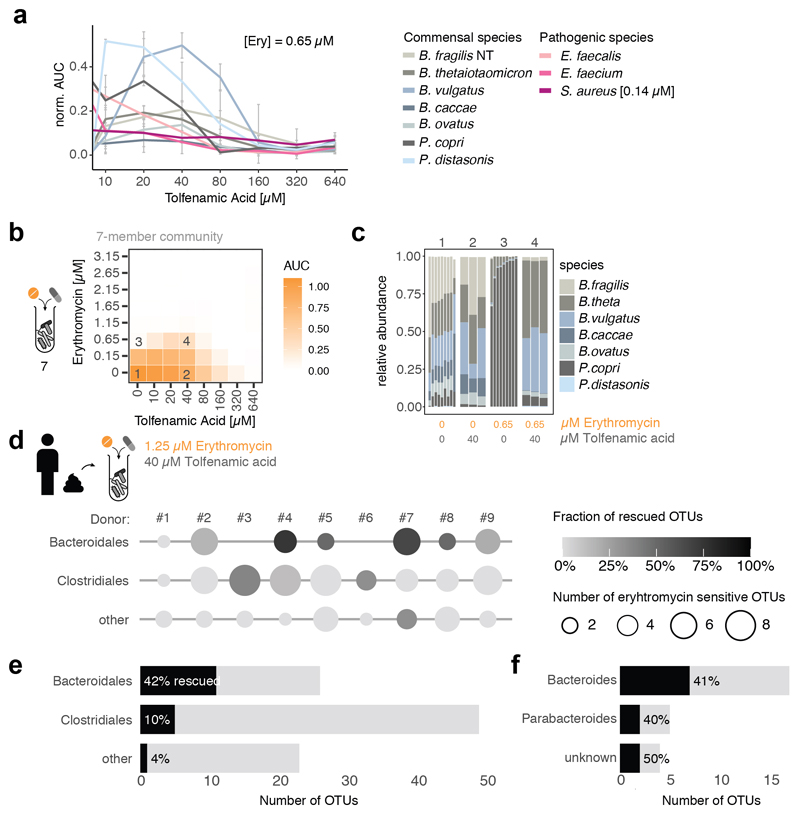
b. The same 7-member synthetic gut microbial community as in Fig. 3a can be protected from erythromycin by the tolfenamic acid. Heat maps depict median bacterial growth based on normalized AUCs of the community of 3 replicates.
c. Community compositions in selected erythromycin-tolfenamic acid concentration combinations (1-4 referring to checkerboard tiles in b) demonstrate that tolfenamic acid alone does not alter the community structure, but rescues some Bacteroides species and largely the community composition from erythromycin treatment. Depicted as in Fig. 3b – control and erythromycin alone experiments same as in Fig. 3b.
d-f. In complex human-stool derived communities from 9 healthy donors (column #1 – 9), tolfenamic acid can rescue 42% of the erythromycin-sensitive Bacteroidales OTUs (2 biological X 2 technical replicates). Data is plotted as in Fig. 3d. Bars depict the absolute numbers of erythromycin-sensitive OTUs and the percentage of rescued OTUs per order (e) or genus (f) across all nine individuals.
Supplementary Material
Acknowledgements
We thank S. Göttig & the Typas lab for feedback on the manuscript; AR Brochado for help with experimental design; EMBL GeneCore & Flow Cytometry Core Facilities for services & experimental advice. We acknowledge EMBL, JPIAMR grant Combinatorials and ERC grantu CARE (ID 819454) for funding. LM, SGS, MP were supported by the EMBL Interdisciplinary Postdoc (EIPOD) program under Marie Sklodowska Curie Actions COFUND (grant 291772 & 664726). LM is supported by the DFG (CMFI Cluster of Excellence EXC 2124 and Emmy Noether Program). CVG is recipient of an EMBO long-term postdoctoral fellowship and an add-on fellowship from the Christiane Nüsslein-Volhard-Stiftung. UL is supported by JPIAMR grant EMBARK; KRP by UK Medical Research Council (MC_UU_00025/11); BS by DFG CRC1371, ERC grant EVOGUTHEALTH (ID 865615), DZIF and CEGIMIR.
Footnotes
Author contributions
This study was conceived by KRP, PB & AT; designed by LM, CVG, MP & AT; supervised by LM, MZ, BS, GZ, PB & AT. LM, MP, TB & EEA conducted MIC measurements; CVG the bactericidal/bacteriostatic experiments; LM, CVG, CE, PM, SGS, EC, BZ & CG the antidote experiments (LM, PM, EC & CG the screen and in vitro validation; CVG, PM & SGS the community experiments; LM, CE & BZ the mice experiments). Data preprocessing, curation and comparisons to databases were performed by JW, MK, AM, UL, and SKF. Data interpretation was performed by LM, CVG, JW, MZ, BS, GZ and AT. LM, CVG and AT wrote the manuscript with feedback from all authors; LM, CVG, JW and MK designed figures with inputs from GZ and AT. All authors approved the final version for publication.
Competing interests
EMBL has filed a patent on using the antidotes identified in this study for prevention and/or treatment of dysbiosis and for microbiome protection (European patent application number EP19216548.8). LM, CVG, EC and AT are listed as inventors.
Data availability
Source data for all animal experiments are provided with the paper. All primary data generated in this study are in Figures, Supplementary Information tables and available from Zenodo: http://doi.org/10.5281/zenodo.3527540. Clinical breakpoints (Fig. 1c) were retrieved from the EUCAST database https://eucast.org/clinical_breakpoints/
Code availability
Code for analysing data and generating data figures (except Fig. 2 and Extented Data Fig. 5 & 6) is available at https://git.embl.de/maier/abxbug
References
- 1.Blaser MJ. Antibiotic use and its consequences for the normal microbiome. Science. 2016;352:544–545. doi: 10.1126/science.aad9358. [DOI] [PMC free article] [PubMed] [Google Scholar]
- 2.Maier L, et al. Extensive impact of non-antibiotic drugs on human gut bacteria. Nature. 2018;555:623–628. doi: 10.1038/nature25979. [DOI] [PMC free article] [PubMed] [Google Scholar]
- 3.Cho I, et al. Antibiotics in early life alter the murine colonic microbiome and adiposity. Nature. 2012;488:621–626. doi: 10.1038/nature11400. [DOI] [PMC free article] [PubMed] [Google Scholar]
- 4.Cox LM, et al. Altering the intestinal microbiota during a critical developmental window has lasting metabolic consequences. Cell. 2014;158:705–721. doi: 10.1016/j.cell.2014.05.052. [DOI] [PMC free article] [PubMed] [Google Scholar]
- 5.Ruiz VE, et al. A single early-in-life macrolide course has lasting effects on murine microbial network topology and immunity. Nat Commun. 2017;8:518. doi: 10.1038/s41467-017-00531-6. [DOI] [PMC free article] [PubMed] [Google Scholar]
- 6.Korpela K, et al. Intestinal microbiome is related to lifetime antibiotic use in Finnish pre-school children. Nat Commun. 2016;7:10410. doi: 10.1038/ncomms10410. [DOI] [PMC free article] [PubMed] [Google Scholar]
- 7.Parker EPK, et al. Changes in the intestinal microbiota following the administration of azithromycin in a randomised placebo-controlled trial among infants in south India. Sci Rep. 2017;7:9168. doi: 10.1038/s41598-017-06862-0. [DOI] [PMC free article] [PubMed] [Google Scholar]
- 8.Falony G, et al. Population-level analysis of gut microbiome variation. Science. 2016;352:560–564. doi: 10.1126/science.aad3503. [DOI] [PubMed] [Google Scholar]
- 9.Rothschild D, et al. Environment dominates over host genetics in shaping human gut microbiota. Nature. 2018;555:210–215. doi: 10.1038/nature25973. [DOI] [PubMed] [Google Scholar]
- 10.Zimmermann M, Patil KR, Typas A, Maier L. Towards a mechanistic understanding of reciprocal drug–microbiome interactions. Molecular Systems Biology. 2021;17:e10116. doi: 10.15252/msb.202010116. [DOI] [PMC free article] [PubMed] [Google Scholar]
- 11.Vich Vila A, et al. Impact of commonly used drugs on the composition and metabolic function of the gut microbiota. Nature Communications. 2020;11:362. doi: 10.1038/s41467-019-14177-z. [DOI] [PMC free article] [PubMed] [Google Scholar]
- 12.Kuhn M, Letunic I, Jensen LJ, Bork P. The SIDER database of drugs and side effects. Nucleic Acids Res. 2016;44:D1075–1079. doi: 10.1093/nar/gkv1075. [DOI] [PMC free article] [PubMed] [Google Scholar]
- 13.Dethlefsen L, Relman DA. Incomplete recovery and individualized responses of the human distal gut microbiota to repeated antibiotic perturbation. Proc Natl Acad Sci U S A. 2011;108(Suppl 1):4554–4561. doi: 10.1073/pnas.1000087107. [DOI] [PMC free article] [PubMed] [Google Scholar]
- 14.Uzan-Yulzari A, et al. Neonatal antibiotic exposure impairs child growth during the first six years of life by perturbing intestinal microbial colonization. Nature Communications. 2021;12:443. doi: 10.1038/s41467-020-20495-4. [DOI] [PMC free article] [PubMed] [Google Scholar]
- 15.Nagy E, Boyanova L, Justesen US, Infections E. S. G. o. A How to isolate, identify and determine antimicrobial susceptibility of anaerobic bacteria in routine laboratories. Clin Microbiol Infect. 2018;24:1139–1148. doi: 10.1016/j.cmi.2018.02.008. [DOI] [PubMed] [Google Scholar]
- 16.The European Committee on Antimicrobial Susceptibility Testing. Breakpoint tables for interpretation of MICs and zone diameters v. 2019. http://www.eucast.org/clinical_breakpoints/
- 17.Bullman S, et al. Analysis of Fusobacterium persistence and antibiotic response in colorectal cancer. Science. 2017;358:1443–1448. doi: 10.1126/science.aal5240. [DOI] [PMC free article] [PubMed] [Google Scholar]
- 18.Manfredo Vieira S, et al. Translocation of a gut pathobiont drives autoimmunity in mice and humans. Science. 2018;359:1156–1161. doi: 10.1126/science.aar7201. [DOI] [PMC free article] [PubMed] [Google Scholar]
- 19.Gaulton A, et al. The ChEMBL database in 2017. Nucleic Acids Res. 2017;45:D945–D954. doi: 10.1093/nar/gkw1074. [DOI] [PMC free article] [PubMed] [Google Scholar]
- 20.Slimings C, Riley TV. Antibiotics and hospital-acquired Clostridium difficile infection: update of systematic review and meta-analysis. J Antimicrob Chemother. 2014;69:881–891. doi: 10.1093/jac/dkt477. [DOI] [PubMed] [Google Scholar]
- 21.Baron S, Diene S, Rolain J-M. Human microbiomes and antibiotic resistance. Human Microbiome Journal. 2018 [Google Scholar]
- 22.Tramontano M, et al. Nutritional preferences of human gut bacteria reveal their metabolic idiosyncrasies. Nat Microbiol. 2018;3:514–522. doi: 10.1038/s41564-018-0123-9. [DOI] [PubMed] [Google Scholar]
- 23.Habib G, et al. 2015 ESC Guidelines for the management of infective endocarditis: The Task Force for the Management of Infective Endocarditis of the European Society of Cardiology (ESC). Endorsed by: European Association for Cardio-Thoracic Surgery (EACTS), the European Association of Nuclear Medicine (EANM) Eur Heart J. 2015;36:3075–3128. doi: 10.1093/eurheartj/ehv319. [DOI] [PubMed] [Google Scholar]
- 24.Kasper DL, F A, Hauser SL, Longo DL. Harrison's Principles of Internal Medicine, 18e. McGraw-Hill; 2012. [Google Scholar]
- 25.Lobritz MA, et al. Antibiotic efficacy is linked to bacterial cellular respiration. Proc Natl Acad Sci U S A. 2015;112:8173–8180. doi: 10.1073/pnas.1509743112. [DOI] [PMC free article] [PubMed] [Google Scholar]
- 26.French GL. Bactericidal agents in the treatment of MRSA infections--the potential role of daptomycin. J Antimicrob Chemother. 2006;58:1107–1117. doi: 10.1093/jac/dkl393. [DOI] [PubMed] [Google Scholar]
- 27.Jelic D, Antolovic R. From Erythromycin to Azithromycin and New Potential Ribosome-Binding Antimicrobials. Antibiotics (Basel) 2016;5 doi: 10.3390/antibiotics5030029. [DOI] [PMC free article] [PubMed] [Google Scholar]
- 28.Nemeth J, Oesch G, Kuster SP. Bacteriostatic versus bactericidal antibiotics for patients with serious bacterial infections: systematic review and meta-analysis. J Antimicrob Chemother. 2015;70:382–395. doi: 10.1093/jac/dku379. [DOI] [PubMed] [Google Scholar]
- 29.Wald-Dickler N, Holtom P, Spellberg B. Busting the Myth of “Static vs Cidal”: A Systemic Literature Review. Clin Infect Dis. 2018;66:1470–1474. doi: 10.1093/cid/cix1127. [DOI] [PMC free article] [PubMed] [Google Scholar]
- 30.Brochado AR, et al. Species-specific activity of antibacterial drug combinations. Nature. 2018;559:259–263. doi: 10.1038/s41586-018-0278-9. [DOI] [PMC free article] [PubMed] [Google Scholar]
- 31.Brugiroux S, et al. Genome-guided design of a defined mouse microbiota that confers colonization resistance against Salmonella enterica serovar Typhimurium. Nat Microbiol. 2016;2:16215. doi: 10.1038/nmicrobiol.2016.215. [DOI] [PubMed] [Google Scholar]
- 32.Palleja A, et al. Recovery of gut microbiota of healthy adults following antibiotic exposure. Nat Microbiol. 2018;3:1255–1265. doi: 10.1038/s41564-018-0257-9. [DOI] [PubMed] [Google Scholar]
- 33.Schmidt TSB, Raes J, Bork P. The Human Gut Microbiome: From Association to Modulation. Cell. 2018;172:1198–1215. doi: 10.1016/j.cell.2018.02.044. [DOI] [PubMed] [Google Scholar]
(Method part)
- 34.Milanese A, et al. Microbial abundance, activity and population genomic profiling with mOTUs2. Nat Commun. 2019;10:1014. doi: 10.1038/s41467-019-08844-4. [DOI] [PMC free article] [PubMed] [Google Scholar]
- 35.Feng Q, et al. Gut microbiome development along the colorectal adenoma-carcinoma sequence. Nat Commun. 2015;6:6528. doi: 10.1038/ncomms7528. [DOI] [PubMed] [Google Scholar]
- 36.Vogtmann E, et al. Colorectal Cancer and the Human Gut Microbiome: Reproducibility with Whole-Genome Shotgun Sequencing. PLoS One. 2016;11:e0155362. doi: 10.1371/journal.pone.0155362. [DOI] [PMC free article] [PubMed] [Google Scholar]
- 37.Wirbel J, et al. Meta-analysis of fecal metagenomes reveals global microbial signatures that are specific for colorectal cancer. Nat Med. 2019;25:679–689. doi: 10.1038/s41591-019-0406-6. [DOI] [PMC free article] [PubMed] [Google Scholar]
- 38.Yu J, et al. Metagenomic analysis of faecal microbiome as a tool towards targeted non-invasive biomarkers for colorectal cancer. Gut. 2017;66:70–78. doi: 10.1136/gutjnl-2015-309800. [DOI] [PubMed] [Google Scholar]
- 39.Zeller G, et al. Potential of fecal microbiota for early-stage detection of colorectal cancer. Mol Syst Biol. 2014;10:766. doi: 10.15252/msb.20145645. [DOI] [PMC free article] [PubMed] [Google Scholar]
- 40.Kultima JR, et al. MOCAT2: a metagenomic assembly, annotation and profiling framework. Bioinformatics. 2016;32:2520–2523. doi: 10.1093/bioinformatics/btw183. [DOI] [PMC free article] [PubMed] [Google Scholar]
- 41.Schneider CA, Rasband WS, Eliceiri KW. NIH Image to ImageJ: 25 years of image analysis. Nat Methods. 2012;9:671–675. doi: 10.1038/nmeth.2089. [DOI] [PMC free article] [PubMed] [Google Scholar]
- 42.Schindelin J, et al. Fiji: an open-source platform for biological-image analysis. Nat Methods. 2012;9:676–682. doi: 10.1038/nmeth.2019. [DOI] [PMC free article] [PubMed] [Google Scholar]
- 43.Frostegård A, et al. Quantification of bias related to the extraction of DNA directly from soils. Appl Environ Microbiol. 1999;65:5409–5420. doi: 10.1128/aem.65.12.5409-5420.1999. [DOI] [PMC free article] [PubMed] [Google Scholar]
- 44.Caporaso JG, et al. Global patterns of 16S rRNA diversity at a depth of millions of sequences per sample. Proceedings of the National Academy of Sciences. 2011;108:4516. doi: 10.1073/pnas.1000080107. [DOI] [PMC free article] [PubMed] [Google Scholar]
- 45.Callahan BJ, et al. DADA2: High-resolution sample inference from Illumina amplicon data. Nature Methods. 2016;13:581–583. doi: 10.1038/nmeth.3869. [DOI] [PMC free article] [PubMed] [Google Scholar]
- 46.Altschul SF, Gish W, Miller W, Myers EW, Lipman DJ. Basic local alignment search tool. Journal of Molecular Biology. 1990;215:403–410. doi: 10.1016/S0022-2836(05)80360-2. [DOI] [PubMed] [Google Scholar]
- 47.Matias Rodrigues JF, Schmidt TSB, Tackmann J, von Mering C. MAPseq: highly efficient k-mer search with confidence estimates, for rRNA sequence analysis. Bioinformatics. 2017;33:3808–3810. doi: 10.1093/bioinformatics/btx517. [DOI] [PMC free article] [PubMed] [Google Scholar]
- 48.Nawrocki EP, Eddy SR. Infernal 1.1: 100-fold faster RNA homology searches. Bioinformatics (Oxford, England) 2013;29:2933–2935. doi: 10.1093/bioinformatics/btt509. [DOI] [PMC free article] [PubMed] [Google Scholar]
- 49.Matias Rodrigues JF, von Mering C. HPC-CLUST: distributed hierarchical clustering for large sets of nucleotide sequences. Bioinformatics. 2014;30:287–288. doi: 10.1093/bioinformatics/btt657. [DOI] [PMC free article] [PubMed] [Google Scholar]
- 50.Schmidt TSB, Matias Rodrigues JF, von Mering C. Limits to robustness and reproducibility in the demarcation of operational taxonomic units. Environmental Microbiology. 2015;17:1689–1706. doi: 10.1111/1462-2920.12610. [DOI] [PubMed] [Google Scholar]
- 51.Love MI, Huber W, Anders S. Moderated estimation of fold change and dispersion for RNA-seq data with DESeq2. Genome Biology. 2014;15:550. doi: 10.1186/s13059-014-0550-8. [DOI] [PMC free article] [PubMed] [Google Scholar]
- 52.McMurdie PJ, Holmes S. Waste Not, Want Not: Why Rarefying Microbiome Data Is Inadmissible. PLOS Computational Biology. 2014;10:e1003531. doi: 10.1371/journal.pcbi.1003531. [DOI] [PMC free article] [PubMed] [Google Scholar]
- 53.Benjamini Y, Hochberg Y. Controlling the False Discovery Rate: A Practical and Powerful Approach to Multiple Testing. Journal of the Royal Statistical Society: Series B (Methodological) 1995;57:289–300. doi: 10.1111/j.2517-6161.1995.tb02031.x. [DOI] [Google Scholar]
- 54.Chen M, et al. Inhibition of renal NQO1 activity by dicoumarol suppresses nitroreduction of aristolochic acid I and attenuates its nephrotoxicity. Toxicol Sci. 2011;122:288–296. doi: 10.1093/toxsci/kfr138. [DOI] [PubMed] [Google Scholar]
- 55.Cai HY, et al. Benzbromarone, an old uricosuric drug, inhibits human fatty acid binding protein 4 in vitro and lowers the blood glucose level in db/db mice. Acta Pharmacol Sin. 2013;34:1397–1402. doi: 10.1038/aps.2013.97. [DOI] [PMC free article] [PubMed] [Google Scholar]
- 56.Herp S, et al. Mucispirillum schaedleri Antagonizes Salmonella Virulence to Protect Mice against Colitis. Cell Host & Microbe. 2019;25:681–694.:e688. doi: 10.1016/j.chom.2019.03.004. [DOI] [PubMed] [Google Scholar]
- 57.Zimmermann M, Zimmermann-Kogadeeva M, Wegmann R, Goodman AL. Mapping human microbiome drug metabolism by gut bacteria and their genes. Nature. 2019;570:462–467. doi: 10.1038/s41586-019-1291-3. [DOI] [PMC free article] [PubMed] [Google Scholar]
- 58.Sunagawa S, et al. Metagenomic species profiling using universal phylogenetic marker genes. Nat Methods. 2013;10:1196–1199. doi: 10.1038/nmeth.2693. [DOI] [PubMed] [Google Scholar]
- 59.Huerta-Cepas J, Serra F, Bork P. ETE 3: Reconstruction, Analysis, and Visualization of Phylogenomic Data. Mol Biol Evol. 2016;33:1635–1638. doi: 10.1093/molbev/msw046. [DOI] [PMC free article] [PubMed] [Google Scholar]
- 60.Sievers F, et al. Fast, scalable generation of high-quality protein multiple sequence alignments using Clustal Omega. Mol Syst Biol. 2011;7:539. doi: 10.1038/msb.2011.75. [DOI] [PMC free article] [PubMed] [Google Scholar]
- 61.Nguyen LT, Schmidt HA, von Haeseler A, Minh BQ. IQ-TREE: a fast and effective stochastic algorithm for estimating maximum-likelihood phylogenies. Mol Biol Evol. 2015;32:268–274. doi: 10.1093/molbev/msu300. [DOI] [PMC free article] [PubMed] [Google Scholar]
- 62.Cani PD, de Vos WM. Next-Generation Beneficial Microbes: The Case of Akkermansia muciniphila. Front Microbiol. 2017;8:1765. doi: 10.3389/fmicb.2017.01765. [DOI] [PMC free article] [PubMed] [Google Scholar]
- 63.Routy B, et al. Gut microbiome influences efficacy of PD-1-based immunotherapy against epithelial tumors. Science. 2018;359:91–97. doi: 10.1126/science.aan3706. [DOI] [PubMed] [Google Scholar]
Associated Data
This section collects any data citations, data availability statements, or supplementary materials included in this article.
Supplementary Materials
Data Availability Statement
Source data for all animal experiments are provided with the paper. All primary data generated in this study are in Figures, Supplementary Information tables and available from Zenodo: http://doi.org/10.5281/zenodo.3527540. Clinical breakpoints (Fig. 1c) were retrieved from the EUCAST database https://eucast.org/clinical_breakpoints/
Code for analysing data and generating data figures (except Fig. 2 and Extented Data Fig. 5 & 6) is available at https://git.embl.de/maier/abxbug


