Abstract
Evolution can repeat itself, resulting in parallel adaptations in independent lineages occupying similar environments. Moreover, parallel evolution sometimes, but not always, uses the same genes. Two main hypotheses have been put forth to explain the probability and extent of parallel evolution. First, parallel evolution is more likely when shared ecologies result in similar patterns of natural selection in different taxa. Second, parallelism is more likely when genomes are similar, because of shared standing variation and similar mutational effects in closely related genomes. Here we combine ecological, genomic, experimental, and phenotypic data with Bayesian modeling and randomization tests to quantify the degree of parallelism and its relationship with ecology and genetics. Our results show that the extent to which genomic regions associated with climate are parallel among species of Timema stick insects is shaped collectively by shared ecology and genomic background. Specifically, the extent of genomic parallelism decays with divergence in climatic conditions (i.e., habitat or ecological similarity) and genomic similarity. Moreover, we find that climate-associated loci are likely subject to selection in a field experiment, overlap with genetic regions associated with cuticular hydrocarbon traits, and are not strongly shaped by introgression between species. Our findings shed light on when evolution is most expected to repeat itself.
Introduction
To what extent is evolution predictable and repeatable? Stephen J. Gould posed this question through his famous thought experiment on whether repeatedly ‘replaying the tape of life’ would yield similar evolutionary outcomes [1]. Gould considered similar outcomes unlikely, due to chance events and historical contingency in evolution, and this thought experiment helped launch decades of research on the repeatability of evolution [2,3]. Indeed, the answer to this question is important because it is central to understanding the processes shaping biological diversification [4,5,6]. For example, instances of repeated or parallel evolution in response to similar environmental pressures can provide evidence of evolution by natural selection. In contrast, idiosyncratic outcomes can support a role for chance or contingency in evolution and indicate constraints on the power of selection. The predictability of evolution also has practical implications, for example, for forecasting organismal responses to natural and human-induced environmental change [7], the planning of breeding programs, and the design of medicines and strategies to combat disease spread [8].
It is now known that evolution can repeat itself but does not always do so [9,10]. Parallelism has been documented at the genetic level, with striking cases of parallel evolution involving single genes of major effect both within- and among species [15,16,17]. For example, the Ectodysplasin gene controlling body armor has repeatedly been used by numerous populations of stickleback fish during freshwater adaptation [11]. Likewise, the Agouti and Mc1R genes control coloration in diverse organisms [12,13,14]. In contrast to these studies of major effect genes, parallelism is less understood when evolution involves many genes of smaller effect, although studies of genome-wide variation are beginning to fill this gap [18–22]. However, evolution is not always parallel. Indeed, the probability and extent of parallelism decline as the time of divergence increases between taxa [23,24]. Although this decline is well established, its likely causes are potentially complex (i.e., time itself is not the causal agent controlling parallelism; rather factors such as climate and genetics are likely involved, as outlined below and as we test here) and remain poorly resolved, particularly beyond experimental evolution experiments in microbes [25,26]. Our goal here is to elucidate the factors shaping the extent of parallel evolution in the wild, focusing on quantifying parallelism at the genome-wide level.
In this context, two general hypotheses have been put forth, which are not mutually exclusive. First, parallel evolution is more likely when shared ecologies result in similar patterns of natural selection in different taxa such as ecotypes or divergent lineages (the ‘shared ecology’ hypothesis) [27,28,29]. Shared aspects of environmental variation can decline with time since divergence, as species (or even populations or ecotypes) come to occupy different geographic areas or as local environments change over time, thus reducing parallelism at both phenotypic and genotypic levels [29,30,31]. Second, parallelism is expected to be more likely when genomes are similar because pools of standing variation, new mutations which arise, and the effects of these mutations will tend to be more similar in closely related genomes (the ‘shared genetics’ hypothesis; we use this term to also encompass the role of gene regulation and development) [16,32–34]. Epistatic interactions might be particularly important here because the effects of new mutations are dependent on the mutations that preceded them.
Both ecological (i.e., habitat and climatic) and genetic similarity are expected to decline with time and there is support for both hypotheses [24, 35–38]. However, few studies have simultaneously examined ecology and genetics, particularly in wild populations, such that the relative contribution of the two factors remains unclear. Parsing these contributions is important because it is required to test the roles of selection (i.e., shared ecology) and constraint (i.e., shared genetics) in evolution [32,39–42]. Here, we combine ecological data, genomic analyses, a field experiment, and genetic mapping to ascertain the genomic extent and causes of parallel adaptation to climate, thus testing the shared ecology and genetics hypotheses. Rather than focusing on time per se, we conduct analyses that jointly consider the degree of climatic and genetic divergence between taxa to parse their relative contributions to explaining the degree of parallel evolution observed.
Our study system is wingless, univoltine, herbivorous stick insects in the genus Timema, many species of which are endemic to California, USA [43]. These insects are best-studied for their cryptic colours and colour-patterns, which are controlled by the same genetic region (termed Mel-Stripe) in all species studied to date [44–47]. Timema colouration thus provides a striking example of highly parallel evolution at the level of a single, largely non-recombining gene region that could be considered akin to a major effect locus. However, adaptation often involves many genes, including those with alleles of minor effect, arrayed throughout the genome [48,49], where the probability of parallel genetic evolution is less clear [20]. In this context, we study a novel ecological dimension in Timema, namely climate, motivated by the fact that adaptation to varying climatic (abiotic) conditions of the environment can be polygenic, and the genus Timema inhabits variable habitats in California. For example, the occupied habitats of Timema range from sea-level to mountainous regions, and from arid semi-deserts near the Mexican border to wet evergreen forests in northern California [50]. Moreover, there is climatic variation both within and among species, with several species being distributed along elevational gradients (ranging from 10 meters to ~2800 meters) [51]. This creates an opportunity to test the role of climatic variables, such as precipitation and temperature, in driving parallel evolution in Timema, which are known to be important determinants of selection in many organisms [52,53].
For this study we test the shared ecology and genetics hypothesis in Timema to identify climate-associated gene regions within species which show a range of divergence times of up to tens of millions of years (here, generations). We assess the contribution of shared ecology and genetics to genomic parallelism by comparing the proportions of the genome that exhibit repeated genotype-climate association. We then bolster the evidence that climate-associated gene regions are likely subject to selection by using a field experiment and genetic mapping of cuticular hydrocarbons. Our collective results yield a comprehensive evaluation of genome-wide parallel evolution in the context of an environmental pressure of high current interest (i.e., climate), and in a system where comparison can be made to parallelism seen at a single, major locus (i.e., Mel-Stripe) (Figure 1).
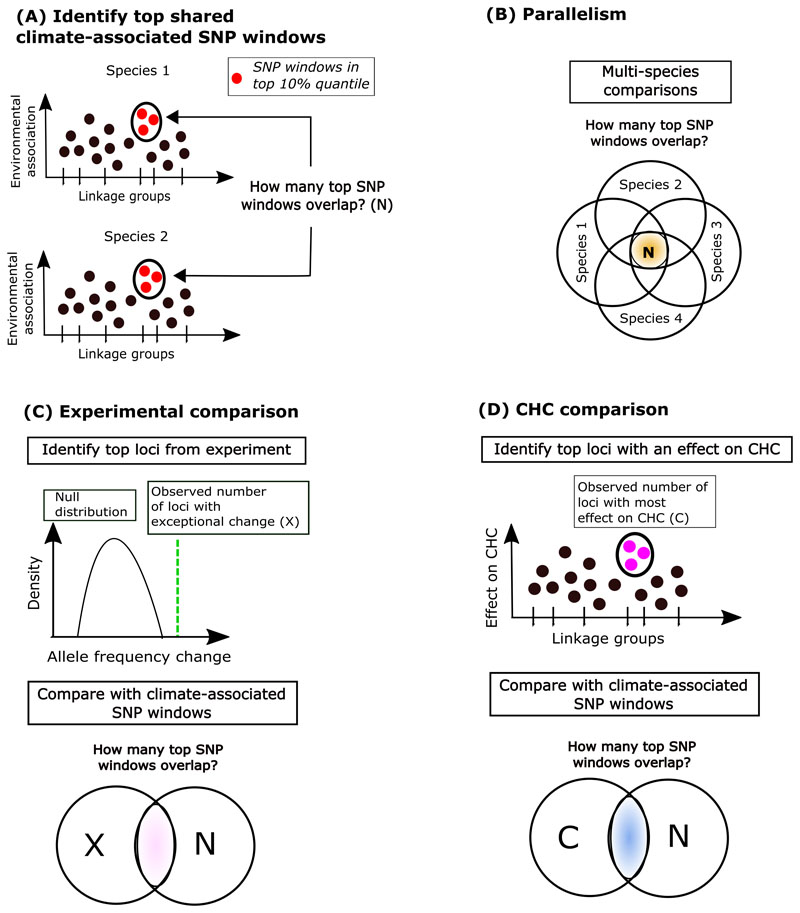
Figure 1. Conceptual figure to summarize the analyses conducted in this study.
(A) Diagram shows the approach to quantify overlap of top climate-associated SNP windows between a given pair of species (Species 1 and species 2). Here red dots denote climate-associated SNP windows for each species. We then quantify overlap in these windows between a given set of species which can “2 or more”, “3 or more”, and “4 or more” (“N”). (B) Parallelism: Diagram shows the approach to quantify excess overlap of top climate-associated SNP windows for multiple species. (C) Experimental comparison: Diagram shows two steps to identify excess overlap in climate-associated SNP windows and those that changed in an elevation-dependent manner during an experiment. Here, first we identify loci/genomic regions associated with the greatest allele-frequency change in an elevational dependent manner in an experiment as those which show exceptional change as compared to a null expectation (denoted in green line, denoted as “X”). Second, we compare if these regions (“X”) show excess overlap with the climate-associated SNP windows (“N”). (D) CHC comparison: Diagram shows two steps to identify excess overlap in climate-associated SNP windows and genomic regions associated with CHCs. First, we identify loci/genomic regions associated with greatest effect on CHC traits (denoted in green line, denoted as “C”). Second, we compare if these regions (“C”) show excess overlap with the climate-associated SNP windows (“N”).
Results
Climatic variation within- and among-species
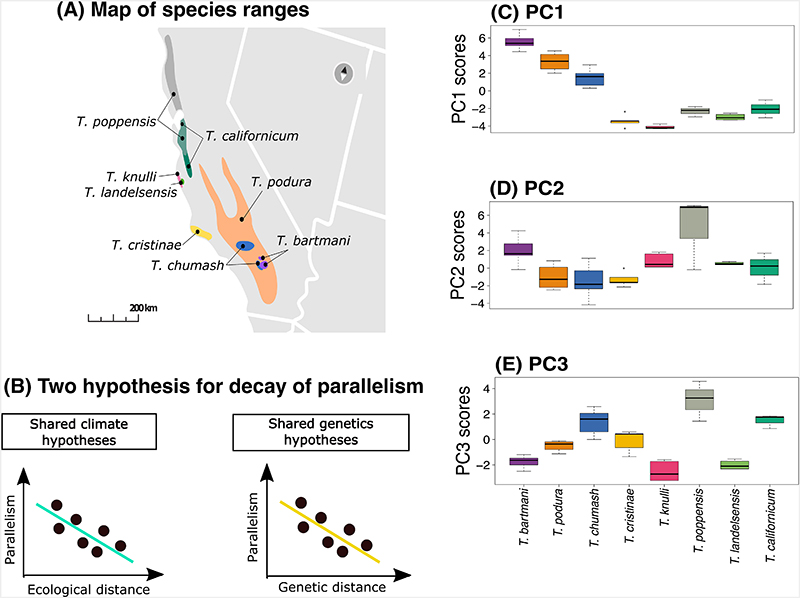
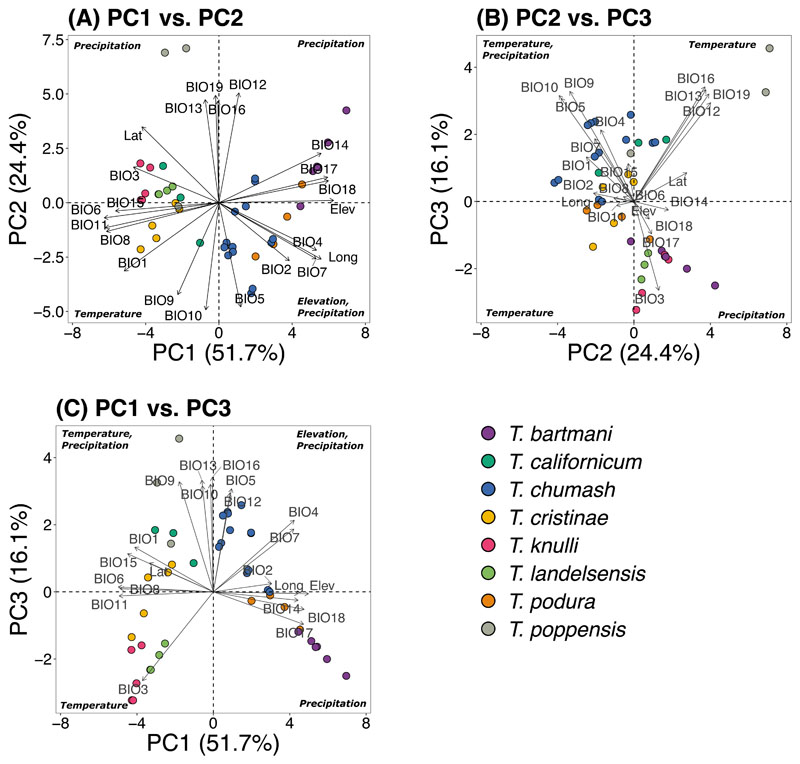
We studied eight Timema species across 53 geographic localities (n = 1420 individuals) (Figure 2, Supplementary Table 1). We used 22 bioclimatic variables describing precipitation and temperature variation which are known drivers of selection in many systems [52], including Timema [71]. Due to high correlations among the studied climate variables, we performed an ordination using principal component analysis (PCA) of the climate variables for all populations included in the study (see Figure 2A for species range map). This revealed that most of the variation in climate variables was explained by the first three principal components (PC) (Total = 92.2%, PC1 = 51.7%, PC2 = 24.4% and PC3 = 16.1%), which we hereafter focus on and refer to as PC1, PC2, and PC3 (Supplementary Table 2 for PC loadings, Extended Data Figure 1).
Figure 2. Map of species ranges and plots for within-species variation in climate PC scores.
(A) Map of the ranges of the eight species included in the study, where the coloured shapes represent the geographic ranges of each species. (B) Two hypotheses which we use to test for decay of parallelism: First diagram shows our prediction for the “shared ecology” hypothesis where we expect a decay in parallelism with an increase in climate (i.e., habitat and ecological) distance. Second diagram shows our prediction for the “shared genetics” hypothesis where we expect a decay in parallelism with an increase in genetic distance. We use these two hypotheses to study the decay of parallelism. (C-E) Box plots of PC variation for the first three principal components (PC1, PC2, PC3) for the eight species included in the study (n = 1420 individuals from 53 localities).
We saw that PC1 is a general axis of elevation and precipitation variation, with high positive values representing wet localities at high elevation (Extended Data Figure 1A, Extended Data Figure 1C, Supplementary Table 2). PC2 is a general axis of temperature variation, with high positive values representing localities experiencing high temperatures (Extended Data Figure 1A, Extended Data Figure 1B, Supplementary Table 2). Lastly, PC3 is an axis of contrasting variation in precipitation and temperature, with high positive values representing localities (often) closer to the coast experiencing greater temperature and precipitation fluctuations (Extended Data Figure 1B, Extended Data Figure 1C, Supplementary Table 2).
One way ANOVA revealed significant among-species variation for all three PCs (PC1: Variance component = 12.1%, Df = 7, F value = 104.5, P-value = < 0.0001; PC2: Variance component = 3.2%, Df = 7, F value 6.803, P-value = < 0.001; PC3: Variance component = 3.1%, Df = 7, F value = 28.07, P-value = < 0.0001). We also detected clear within-species variation (range of median PC scores values across the eight species were -3.0 and 5.8 for PC1, -2.5 to 6.5 for PC2, and -1.6 to 3.5 for PC3; Figure 2C-D). We next used these three PCs to identify genomic regions associated with climate within species, a prerequisite for testing parallelism among species.
Identifying climate-associated genomic regions
We first identified the genomic regions most strongly associated with climatic variation within each of the eight species. To do so, we analyzed single nucleotide polymorphisms (SNPs) obtained through previous genotyping-by-sequencing of natural populations [61]. Since our data included species that are considerably diverged from each other, the number and fine-scale genomic positions of SNPs called for each species were different. This could be due to different evolutionary histories of the restriction sites targeted for the sequencing and genome-level divergence of species from the genome of T. cristinae [62]. To account for this variation, we focus on 100 kilobase (Kb) SNP windows to allow subsequent comparisons among species (n = 9487 windows in each species, across the eight study species, minimum SNPs per window = 1, mean SNPs per window = 1.78).
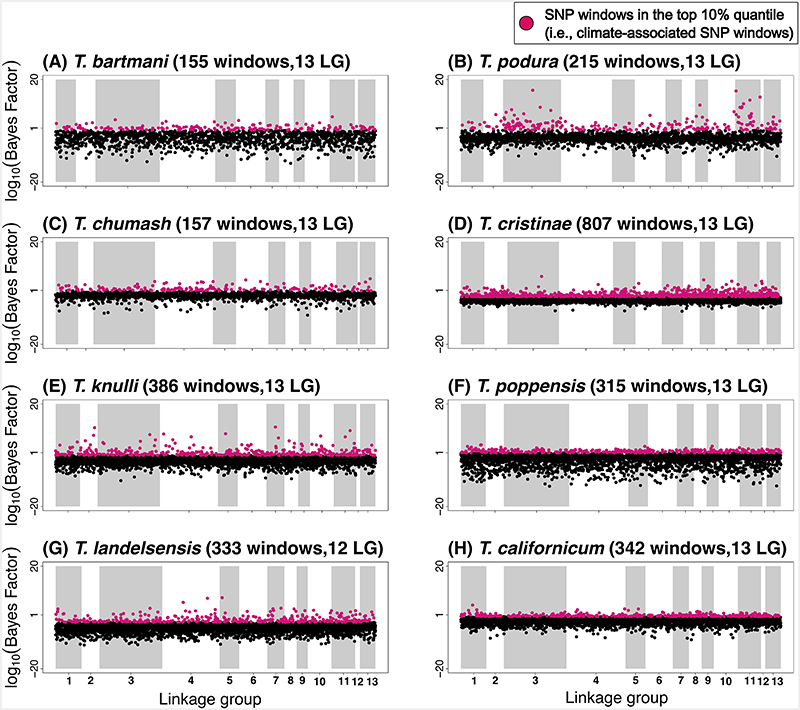
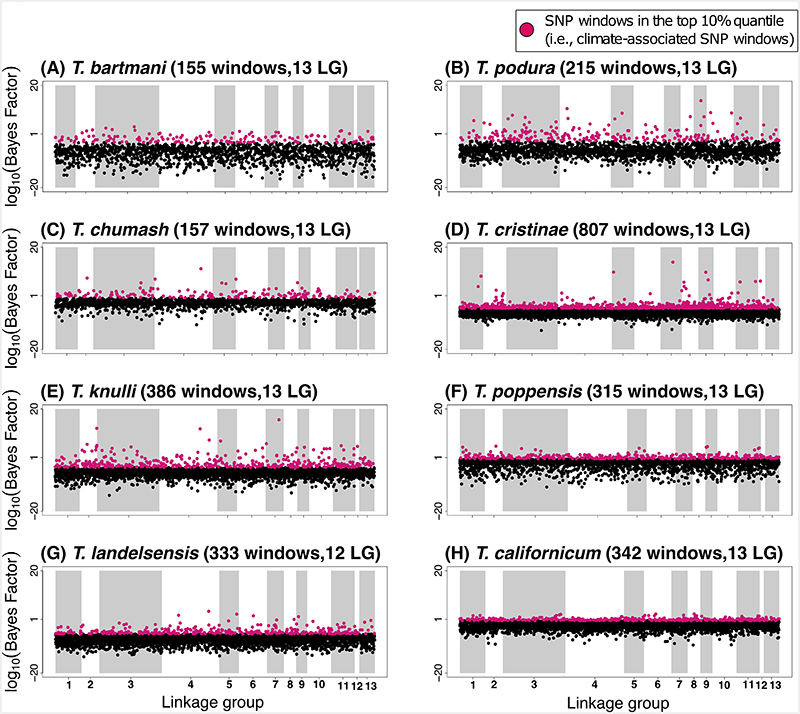
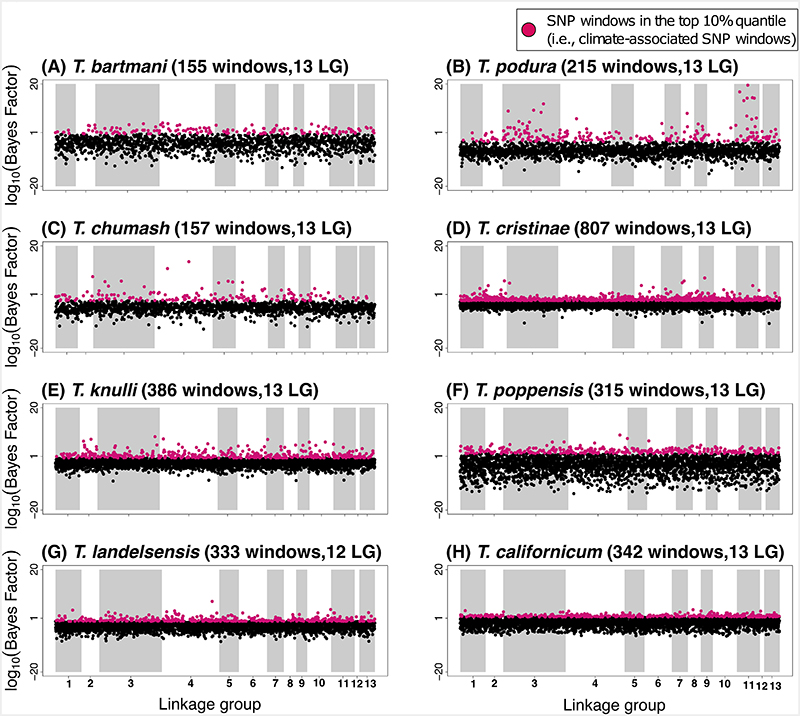
Within each species, we quantified SNP-climate associations for each of the three climate PCs using BayPass (version 1.2). The association of each SNP with population-specific PC variables was assessed using Bayes Factors (BF), which for a given SNP compares the marginal likelihoods of models with zero versus non-zero regression coefficients. For each species, we then calculated the median of logarithmic BF values for all the SNPs in the 100 Kb window to identify SNP windows with medians in the top 10% empirical quantile and then used these for all downstream analyses (“climate-associated SNP windows” hereafter). We do not assume that all 100 Kb windows with the largest (top 10%) BF contribute to climatic adaptation, but rather we expect such windows to be enriched for SNPs contributing to climatic adaptation relative to other parts of the genome. In all species, the top 10% climate-associated SNP windows were widely distributed across the genome and found on all 13 linkage groups (LGs) (Figure 3, Extended Data Figure 2, Extended Data Figure 3).
Figure 3.
Manhattan plots showing the strength of evidence for association (measured here using the Bayes factor from the software BayPass [82]) between a SNP window and climate (in this case, PC3, see extended data figures 4 and 5 for analogous results for PC1 and PC2). Results are shown along the 13 linkage groups. In each panel title, the two values in parentheses are the number of SNP windows in the top 10% quantile (“windows”), followed by the number of linkage groups with at least 1 SNP window in the top 10% quantile (“LGs”).
Parallel evolution of climate-associated genomic regions
We next quantified the extent to which climate-associated SNP windows were parallel (i.e., the same) across the eight species of Timema that we studied. Here we are interested in identifying and quantifying genomic parallelism based on the 100 Kb SNP windows spread across the genome (“genomic parallelism” hereafter) [15,24,63–65].
Critically, we tested if windows exhibited excess overlap across species relative to that expected by chance, that is, if the same SNP windows show association with climate PCs between 3, 4, 5, 6, 7 or 8 species (Figure 1B). To do so, we conducted randomisation tests to quantify excess overlap of windows relative to expectations for multi-species comparisons (Figure 1A). As an example, an x-fold enrichment of 2.0 in the genomic parallelism analyses would indicate that the evidence for overlap of climate-associated SNP windows for a given comparison was two times higher than expected by chance based on the mean of the null. For this, we focused on windows with the greatest (top 10%) climate association in nature for all three climate PCs. Notably, these approaches randomise the data after results from BayPass have been obtained. We discuss in a subsequent section below further results where environmental (i.e., climatic) data were permuted before running BayPass.
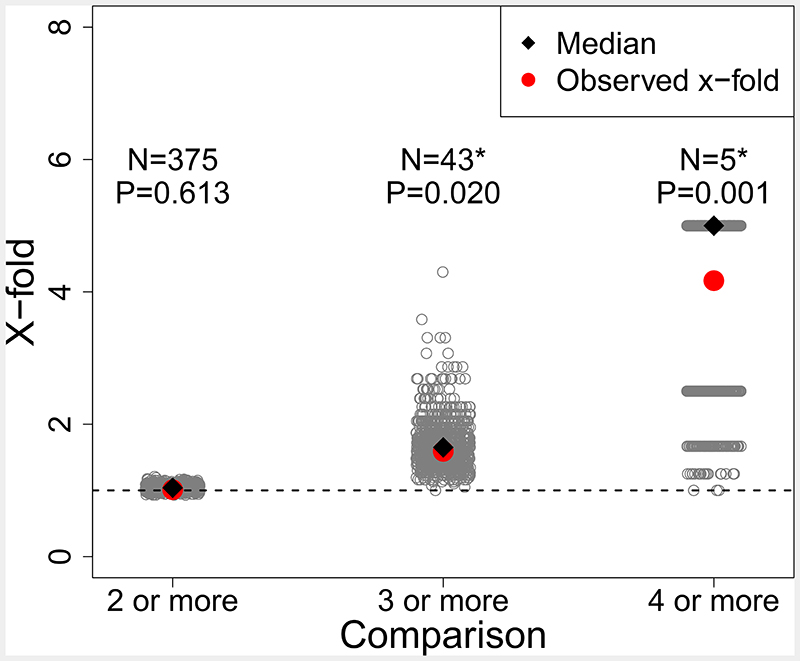
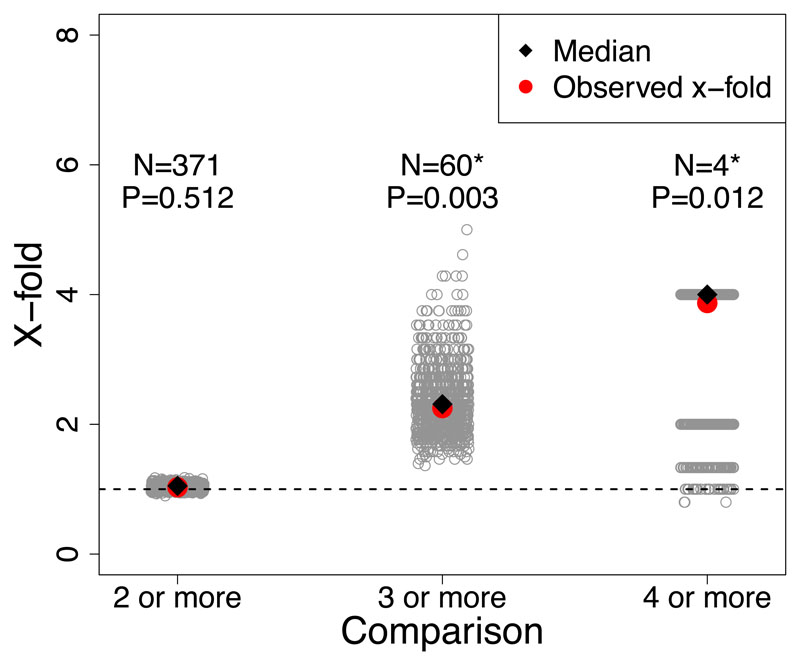
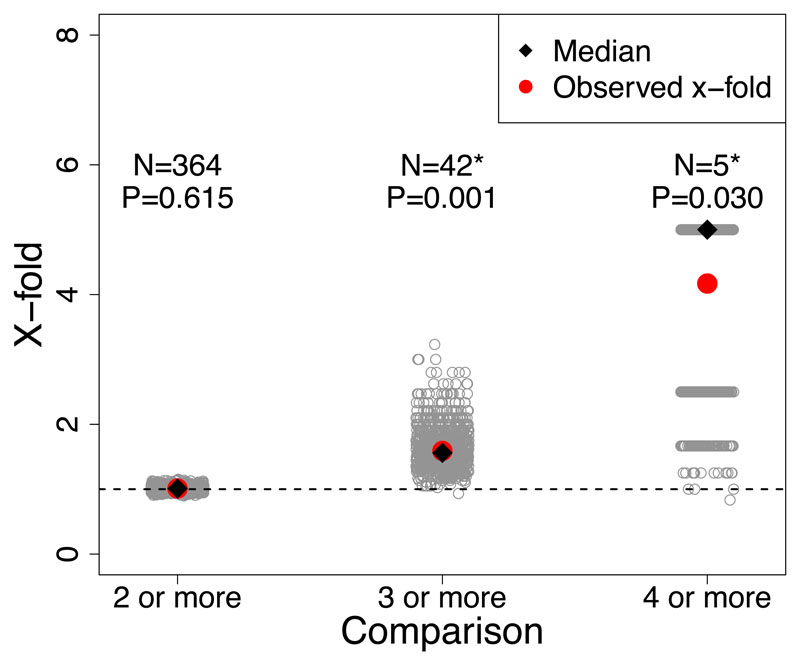
These analyses revealed evidence for genomic parallelism across species. For PC1, excess overlap of SNP windows with the largest median BF among three or more species was ~2x more than expected by chance (observed = 60, expected = 26.77, x-fold enrichment = 2.25, P-value < 0.01; Extended Data Figure 4), and for four or more species excess overlap was ~4x more than expected by chance (observed = 4, expected = 1.03, x-fold enrichment = 3.87, P-value 0.02; Extended Data Figure 4). For PC2, excess overlap of SNP windows with largest median BF among three or more species was about ~1.5x more than expected by chance (observed = 42, expected = 26.41, x-fold enrichment = 1.59, P-value <0.01; Extended Data Figure 5), and for four or more species excess overlap was about ~4x more than expected by chance (observed = 5, expected = 1.19, x-fold enrichment = 4.17, P-value = 0.007; Extended Data Figure 5). Lastly, for PC3 there excess overlap of climate-associated SNP windows among three or more species that was ~1.6x more than expected by chance (observed = 43, expected = 26, x-fold enrichment = 1.63, P-value < 0.01; Figure 4) and almost 5x for four or more species (observed = 5, expected = 1.10, x-fold enrichment = 4.53, P-value = 0.006; Figure 4). Additional tests for historical and contemporary gene flow revealed that introgression and gene flow were not largely responsible for this parallelism (see Supplementary Results and Methods; Figure 5A, Supplementary Figures 7-9).
Figure 4.
Tests for parallel climate-associated SNP windows between species of Timema stick insects (all plots are for the top 10% empirical quantile). In this case, PC3, see Supplementary Figures 4 and Supplementary Figure 5 for analogous results for PC1 and PC2. Barplot shows x-fold enrichments for number of overlapping climate-associated SNP windows for PC3 for comparisons between multiple species, i.e., beyond pairs of species (e.g., 2 or more species, 3 or more species, 4 or more species). Gray dots denote x-fold values expected under 1000 randomizations for a null distribution. Black dot denotes median of the x-fold values expected under 1000 randomizations for a null distribution. Red dot and N value above each group indicates the observed number of overlapping climate-associated SNP windows for each comparison. P-value above each group denotes whether the overlap is greater than expected by chance from a one-sided randomization test. * Indicates x-fold enrichments with P-value ≤ 0.05.
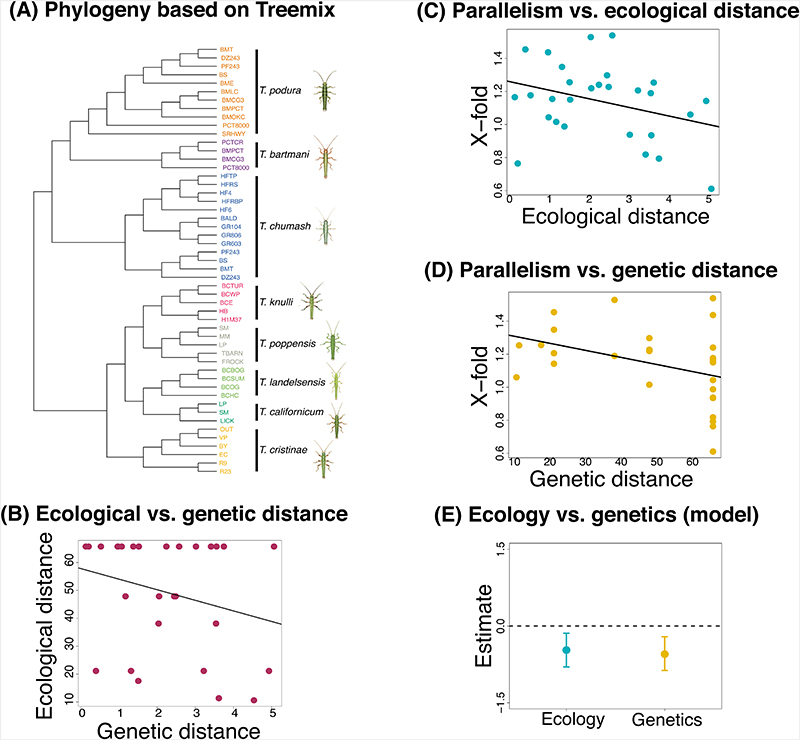
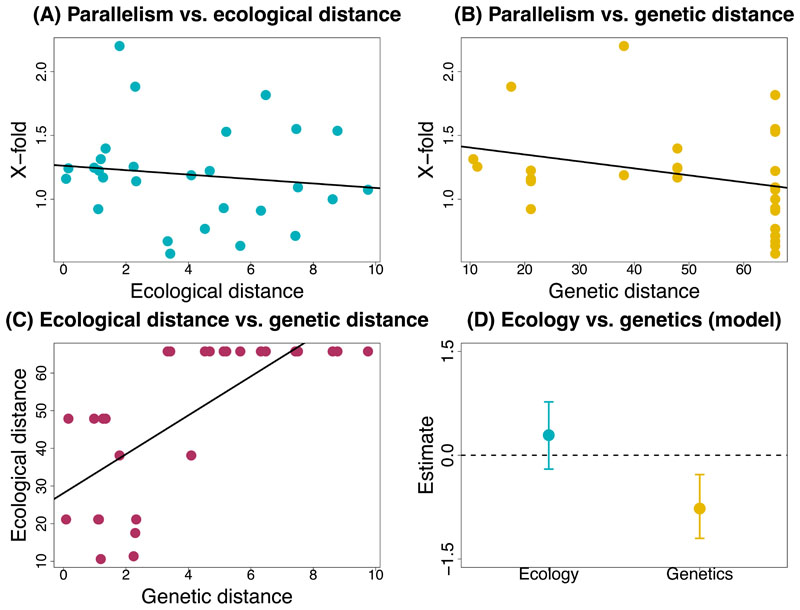
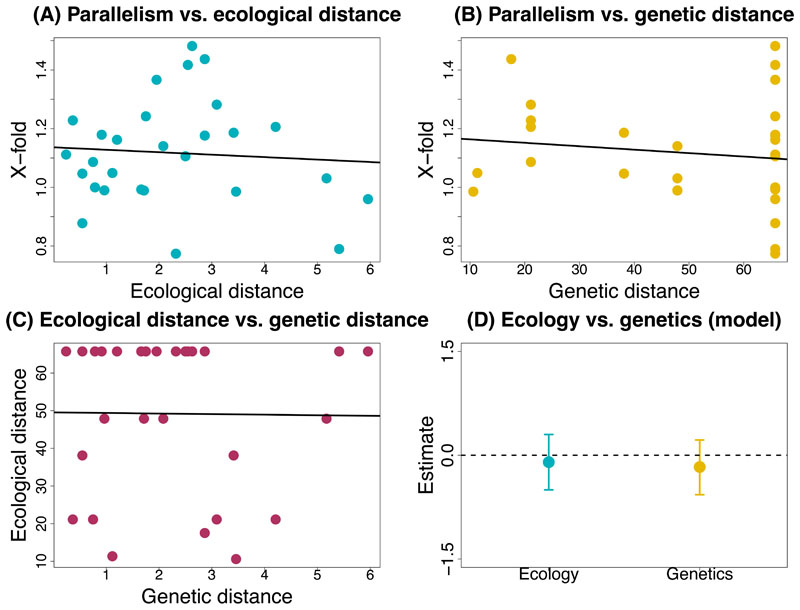
Figure 5. Tests for introgression and “shared ecology” and “shared genetics” hypotheses.
(A) Population graph from TREEMIX for all Timema populations used in this study (N = 53), allowing no migration or admixture event (the actual migration edge is not shown due to the extremely high proportion of variation explained from the admixture model as shown in Supplementary Table 9). Terminal nodes are labelled by abbreviations for locations from where samples were collected and coloured according to species. (B) Scatterplot shows the relationship between climatic distance (measured as distance in PC3 scores and as distance in climate variables) and genetic distance (measured as pairwise phylogenetic distance) based on a one-way linear model. (C) Scatterplot shows the relationship between x-fold enrichment (measure for parallelism) and ecological ie climatic distance (measured as distance in PC3 scores) based on a single-factor linear model. (D) Scatterplot shows the relationship between X-fold enrichment (measure for parallelism) and genetic distance (measured as pairwise phylogenetic distance) based on a one-way linear model. (E) Plot shows parameter estimates with standardized coefficients for the full model for PC3. Error bars indicate 95% equal-tail probability intervals (ETPIs). Estimates diverging from zero indicate a positive or negative effect of ecology or genetics on parallelism. This test was implemented for all eight species and 56 species pairs. Results analogous to those for (B)- (E) but for PC1 and PC2 are shown in extended figures 6 and 7, respectively. A negative or positive estimate which deviates from zero is indicative of an effect on parallelism.
Genomic parallelism declines predictably between species
We next tested the extent to which the shared ecology and shared genetics hypotheses could account for the degree of genomic parallelism observed with climate across Timema species (Figure 2B). Shared ecology would cause a higher degree of parallelism due to similar selective pressures from similar climate conditions experienced by taxa (i.e., PCs 1-3) (Figure 2B, “shared ecology hypothesis”). On the other hand, shared genetics would cause a higher degree of parallelism due to a higher extent of gene reuse associated with variation retained from a common ancestor (Figure 2B, “shared genetics hypothesis”). Here, we quantified genomic parallelism as the degree of excess overlap of climate-associated SNP windows relative to null expectations for pairwise comparisons. We estimated climatic similarity between pairs of species using climatic data and genetic similarity based on a previously published genome-level phylogeny [61]. We then fit Bayesian linear mixed models to explicitly compare models where the degree of parallelism is determined by climatic similarity, genetic similarity, or both. Notably, this mixed model approach accounts for the non-independence of pairwise distances [65 for details]. Specifically, for each climatic PC variable, we modeled parallelism as the x-fold excess in shared top climate-associated SNP windows as a function of climatic distance, which was calculated as the average difference in climate PC scores between a given pair of species (hereafter referred to as ecology, indicating “climatic divergence”), genetic distance, which was pairwise phylogenetic distances for a given pair of Timema species (hereafter referred to as genes indicating “genome-wide divergence”), or both. The fit of models with or without ecology or genetics was compared using deviance information criterion (DIC) (Figure 5B, Extended Data Figure 6B, Extended Data Figure 7B), which is a metric of predictive performance [66].
Our analyses revealed evidence for the effects of both ecology and genes on the extent of genomic parallelism, with details that varied among the climate PCs (Figure 5C-D for PC3, Extended Data Figure 6A-C for PC1, Extended Data Figure 7A-C for PC2). For PC3, the best fit was obtained for the full model (ecology and genes), with similar, negative effects on parallelism observed for ecology (standardized β = -0.47, 95% CI = -0.80 to -0.14) and genes (standardized beta = -0.55, 95% CI = -0.87 to -0.21; Figure 5E; Supplementary Table 3). For PC1, the genes-only model was the best model (standardized β = -0.55, 95% CI = -0.8 to -0.25; Extended Data Figure 6D, Supplementary Table 3). The second-best model was the full model, but this included a positive rather than negative effect of climatic distance on parallelism. Lastly, for PC2 the best model was a null model of no effect of genes or ecology on parallelism (Extended Data Figure 7D, Supplementary Table 9). The results thus provide variable support for both the shared ecology and shared genetics hypotheses, dependent on the climate PC, with the association being strongest for PC3.
Comparison of parallelism results with permuted data sets
We next conducted permutation analyses that randomised the climatic data before implementing BayPass. We did so to ask whether the patterns of observed genomic parallelism and its decay could have been inflated by unaccounted aspects of the genetic data, such as shared SNP density in specific genomic regions, allele frequency distributions, or linkage disequilibrium, affecting some genomic regions more than others. To generate null expected distributions for climate-associated SNP windows, we therefore initially permuted PC climatic values across populations within species, thereby randomizing the relation between the environmental variables and any potential unaccounted-for feature(s) in gene regions affecting parallelism. We generated 10 such permuted data sets hereafter referred to as “permuted data sets”. We then redid the analysis for each of the 10 permuted data sets, for each species separately, exactly as described for the observed data set. First, we reran BayPass using each of the permuted data sets and for each species. Second, we quantified the degree of genomic parallelism by making multispecies comparisons. Third, we conducted our Bayesian linear mixed models to test for the effect of ecology and genetics on the decay of genomic parallelism.
For all three PCs, the ten permuted data sets showed no evidence for the decay in parallelism seen in the actual data set with increased ecological or genetic distance (Supplementary Figures 1-3). However, the permuted data sets indicate significant x-fold enrichments of multiple-species sharing climate-associated SNP windows (Supplementary Figures 4-6). In certain instances, the parallelism extended to involving 4 or more species, as we found significant x-fold excesses in 3 of the 10 permuted data sets for PC1, 6 of 10 for PC2, and 4 of 10 for PC3 (Supplementary Figures 4-6). These results suggest that aspects of the genetic data could generate apparent parallelisms of gene regions responding to environmental variables across species. However, for PC3 which displayed the strongest association of climate and genetics with parallelism, the x-fold excesses in the 4 or more species comparisons in the 10 permuted data sets did not approach the level observed in the original data (Supplementary Figure 6). And most importantly, as noted above, for the 10 permuted data sets, the pattern of excess parallelism was random across species with respect to its relationship with climatic and genome-wide divergence. Our core test of the shared ecology and shared genetic hypotheses thus appears highly robust. Having tested these hypotheses, we next tested for additional evidence, beyond genomic parallelism, that the climate-associated SNP windows have been affected by natural selection.
Climate-associated regions experience natural selection
To bolster the evidence that climate-associated SNP windows are enriched for genetic variants experiencing natural selection, we tested whether these windows exhibited exceptional patterns of allele-frequency change in a published transplant-and-sequence field experiment (Figure 1C).
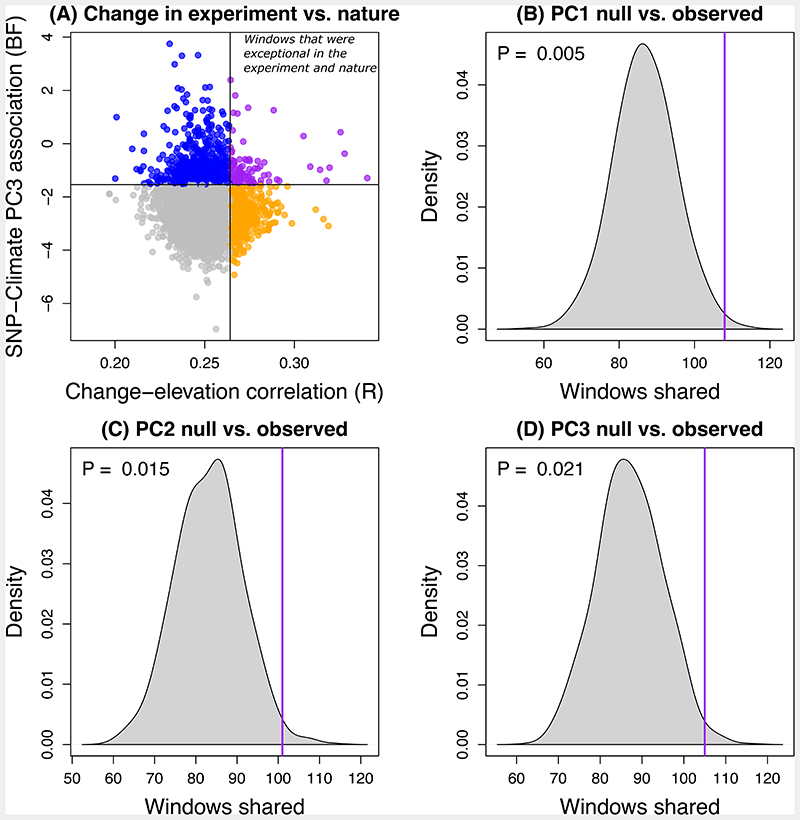
The transplant experiment used a block design to measure 8-day survival and associated genome-wide allele frequency change during this period in 500 T. cristinae transplanted to 10 experimental bushes comprising two host plants occurring along a gradient of higher elevations than the source population for the experiment [67 for further details]. Distances between plants within block ranged from 6 – 10m and distances between blocks ranged from 12 – 30m. A previous analysis of this experiment documented evidence of selection associated with elevation, which is relevant as the sample of species analyzed for the current study of parallelism were distributed along elevational gradients ranging from 10m to ~2800m [67]. Here, as a metric of possible elevation (environment)-dependent selection, we calculated the Pearson correlation between transplant elevation and allele frequency change caused by mortality during the transplant experiment. We found that the 100 Kb windows exhibiting patterns of allele frequency change most strongly associated with elevation in the transplant experiment coincided modestly but significantly with climate-associated SNP windows. Specifically, when focusing on the windows with the greatest (top 10%) correlation between change and elevation in the experiment and with the greatest (top 10%) climate association in nature, windows associated with all three climate PCs corresponded with those where change was most strongly associated with elevation ~1.2-1.3 times more than expected under the null hypothesis of independence (constrained randomization test controlling for SNP density within windows based on 1000 randomizations; PC1: observed = 108 shared windows, P = 0.005; PC2: observed = 101 shared windows, P = 0.015; PC3: observed = 105 shared windows, P = 0.021) (Figure 6). Similar patterns were observed when more extreme top percentiles were considered, and when using an unconstrained randomization test (Supplementary Table 4). These patterns are consistent with the hypothesis that multiple genetic variants in these windows are subject to selection in nature.
Figure 6. Evidence for excess overlap between 100Kb windows associated with climate in nature and those that changed in an elevation-dependent manner during an experiment.
(A) The scatterplot shows the mean correlation between change and elevation during an experiment versus the median Bayes factor measuring SNP-climate (PC3) association in nature for T. cristinae for 100 Kb windows. Points denoting windows in the top 10% for change-elevation correlations are shown in orange, those in the top 10% for SNP-climate associations are shown in blue, and those in the top 10% for both are in purple (other windows are shown with gray points). We are interested in the top right corner of the plot, that is the purple points denoting windows were exceptional (top 10%) in the experiment and nature, and we used a randomization test to ask whether more windows fall in this category than expected by chance. Panels (B), (C) and (D) show null expectations for the number of windows in the top 10% for the experiment and nature based on climate PCs 1, 2 and 3, respectively. The null distribution from the constrained randomization test in each case is denoted by the gray density plot, whereas the observed value is shown with a vertical purple line. The P-value for the null hypothesis of no association between SNP-climate and change-elevation correlations is reported in each panel as well.
Additionally, we found that climate-associated SNP windows overlapped more than expected with regions associated with phenotypic variation in genetic mapping analyses of cuticular hydrocarbons (CHCs), specifically pentacosane in females (Supplementary Methods and Results; Figure 1D, Supplementary Tables 5-8), which studies of insects have shown can contribute to climate adaptation [54,55]. This combined with the results presented above suggests a polygenic basis for climatic adaptation in T. cristinae, with at least a modest correspondence between our top climate-associated windows and the actual loci involved in climate adaptation.
Discussion and Conclusion
We used GBS data from 1420 individuals across eight species combined with data from field transplant and GWAS for cuticular hydrocarbons to show that adaptation to climate occurs in parallel across species but as a function of the climatic and genomic divergence between species. Our results inform five fundamental issues in biology, namely the repeatability of evolution, variation in the degree of parallelism based on the climate variables considered, the effect of ecology and genetics on parallelism, technical aspects pertaining to the study of parallelism, and the processes promoting parallelism. We treat these issues in turn below.
First, we show that evolution in response to climate occurs in parallel among eight species and that parallelism likely involves multiple SNPs. These findings fill a gap in our knowledge of parallel evolution because many studies, including past work in Timema, have mostly focused on parallelism driven by single genes or specific regions of the genome [11,12, 47]. These results agree with other cases of parallel or convergent climate adaptation that are also driven by polygenic interactions [21,68–70]. Overall, our study demonstrates that repeatability of evolution can be driven by numerous genetic paths, but the magnitude of repeatability can be highly variable, specifically when considering inter-species comparisons.
Second, our results reveal notable variation in the degree of parallelism across the three PCs, which we use as composite climate variables. We attribute the variation in the degree of parallelism to Timema species occupying variable environmental niches in their geographic distributions, which can cause environmentally heterogeneous selection. Furthermore, each PC is composed of different climatic variables. Therefore, the level of genomic association and in turn parallelism would vary based on the PC (and climatic variables) being considered. For example, precipitation (which is one of the top loading variables on PC1 and PC2) can affect variability in selection in space [52] and has also been shown to drive thermoregulatory evolution in Timema [71]. Other unaccounted factors can influence response to climate such as microclimate variation on the spatial scale that Timema species occupy, and nonlinear gene–climate associations [72]. All these factors together contribute to the variable degree of parallelism observed across the three PCs, emphasizing that the genomic basis of adaptation to climate in Timema is predictable to some extent yet complex.
Third, our results reveal that parallelism decays with climatic and genome-wide divergence, suggesting that both shared ecology and shared genetics can affect parallel evolution. Thus, the parallelism we observe in Timema can be partly attributed to selection pressures exerted on insects inhabiting similar niches [28]. In addition, genetic similarity increases the chances for shared standing genetic variation in closely related taxa to allow for gene reuse in response to similar environmental pressures [73]. Similar gene modules can also drive convergent adaptation to climate, where genes or SNPs that collectively serve a similar functional role are tightly integrated by strong pleiotropic effects and are relatively independent of other such units [21,68]. Our study demonstrates that both these aspects can affect parallelism, with a perhaps more consistent effect of genetics, due to patterns of ecological variation being more complex among species compared to genetics.
Fourth, our approach involving permuted data sets highlights important issues concerning analytical aspects of parallelism tests. We found no evidence of the observed decay in parallelism with climatic or genome-wide divergence in permuted data sets conducted prior to or following analysis with BayPass. Overall, these findings in combination with the experiment and CHC results provide support that the documented parallelism in genomic association with climate reflects a contribution from selection. However, we also note that our analyses using permuted data sets generated instances where ‘significant’ x-fold excesses in the numbers of gene regions displaying parallelism above null expectations. Our findings thus concur with previous studies using simulation-based approaches showing that false positives can be detected due to unaccounted aspects of the genetic data [74–76]. Therefore, we suggest that these associations should be interpreted with caution, and studies identifying genomic association with climatic variables warrant additional cross-validation of findings, as performed here.
Fifth, our collective results inform how two core evolutionary processes, namely introgression/gene flow, and selection, might affect parallelism. We show that parallel evolution and adaptation to climate occurs despite limited or minimal gene flow among Timema species. While introgression can facilitate parallel adaptation to similar environmental pressures through the sharing of novel genetic material [33,56–60,77], a lack of introgression or gene flow demonstrates independent instances of adaptation and the role of selection in driving parallel evolution at the genomic level [78]. Ancestral genetic variation can also underlie parallelism due to similar selection pressures driving phenological similarity not just for newly formed and partially reproductively isolated host races, but also for distantly related sibling species [3]. Additionally, while a study on divergent conifers has indicated that conserved genomic regions can drive convergent adaptation to climate [21] another study on distinct genetic clusters of Arabidopsis lyrata (two lineages) shows that parallelism in genomic association to climate is detectable at the gene but not the SNP level [68]. Both these systems also have minimal gene flow. In comparison, a study on replicate pairs of threespine stickelbacks implies a significant role for the environment and gene flow in affecting parallelism [28]. In summary, our study shows how local adaptation among species with minimal between-species gene flow can occur and consequently be crucial for predicting evolution in response to rapidly changing environments and climate. Furthermore, our results bolster evidence for selection beyond a correlational genome scan because we found that the genomic regions which underlie parallelism also were associated with allele-frequency changes in a manipulative field experiment [like 79] and climatically relevant CHC traits. Thus, together these results suggest that allele reuse through standing genetic variation, new mutations, and selection can all be powerful drivers of parallel local adaptation.
Methods
Below we describe details of our methods and analyses, and we provide a graphic summary in Figure 1 of the main text.
Samples and DNA sequences from natural populations
For this study, we analyzed genotyping-by-sequencing (GBS) data from 1420 Timema stick insects from 53 localities from eight species: 6 T. bartmani populations (N = 195 individuals), 3 T. californicum populations (N = 77 individuals), 12 T. chumash populations (N = 358 individuals), 6 T. cristinae populations (N = 205 individuals), 5 T. knulli populations (N = 89 individuals), 4 T. landenlsensis populations (N = 125 individuals), 12 T. podura populations (N = 255 individuals) and 5 T. poppensis populations (N = 116 individuals) (Supplementary Table 1). GBS data for this study has been previously published in a study of the speciation continuum in Timema [61]. DNA sequence data, the reference genome, experimental data, and CHC data used in this study are associated with the previously published studies [61,67]. The associated DNA sequence data have been archived on NCBIs SRA (Accession: PRJNA356405 ID: 356405). The genomic data in the transplant experiment and used for genetic mapping of cuticular hydrocarbons is independent from these data and is described in detail below.
Sequence alignment and variant calling
To incorporate variants typed for individuals of each species, we built a consensus reference sequence for each species [similar to 44,47]. To do this, we first aligned all reads from all our samples to the T. cristinae reference genome (draft version 0.3) using the MEM algorithm of BWA (Version: 0.7.17-r1188) [61]. We ran BWA MEM with a minimum seed length of 15 (-k), internal seeds of longer than 20 bp, and only output alignments with a quality score of ≥ 30 (-T). We then used SAMTOOLS (version 1.5) to view, sort and index the alignments [80]. We called variants using SAMTOOLS and BCFTOOLS (version 1.6) [80,81]. For variant calling, we used the mapping quality adjustment of 50 (-C), skipped alignments with mapping quality 0, skipped bases with base quality <13, and ignored insertion-deletion polymorphisms. We then set the prior on single nucleotide polymorphisms (SNPs) to 0.001 (-P) and called SNPs when the posterior probability that the nucleotide was invariant was <0.01 (-p). We then performed two rounds of filtering to retain final sets of SNPs. In the first round, we filtered the initial set of SNPs to retain only those with sequence data for at least 80% of the individuals, a mean sequence depth of two per individual, at least four reads of the alternative allele, a minimum quality score of 30, a minimum (overall) minor allele frequency of at least 5%, and no more than 0.01% of the reads in the reverse orientation. In the second round of filtering, we removed SNPs with excessive coverage (2 standard deviations above the mean) or that were tightly clustered (within 5 base pairs (bp) of each other). This left us with the following number of SNPs for each species: 10,036 SNPs for T. bartmani, 14,955 SNPs for T. californicum, 20,478 SNPs for T. chumash, 3,43,746 SNPs for T. cristinae, 25,835 SNPs for T. knulli, 21,314 SNPs for T. landelsensis, 21,986 SNPs for T. podura, and 18,237 SNPs for T. poppensis.
We used these filtered variants for each species to construct consensus reference sequences for each species using the CONSENSUS algorithm of BCFTOOLS (version 1.6) [81]. We then used the consensus reference of each species to redo alignments for GBS sequences of individuals for each species separately. Following this, we repeated variant calling and two rounds of variant filtering as described above. This left us with the following number of SNPs for each species: 3074 SNPs for T. bartmani, 7858 SNPs for T. californicum, 4172 SNPs for T. chumash, 1,96,252 SNPs for T. cristinae, 11,139 SNPs for T. knulli, 8548 SNPs for T. landelsensis, 6000 SNPs for T. podura, and 7157 SNPs for T. poppensis. We used this second set of SNPs noted directly above for all downstream analyses.
Climate variables and SNP by climate associations
We used 22 climate variables associated with our 53 study localities (Supplementary Table 2), which were extracted from the WorldClim database version 1.4 (https://www.worldclim.org/data/v1.4/worldclim14.html; climate data for 1960-1990). Since the first three PC scores explained the overwhelming majority (92.4%) of variation in the climate variables (Supplementary Table 2, Extended Data Figure 1), we used these three PCs to study genomic associations with climate in all further analyses.
We used BayPass version 2.1 [82] to identify genomic regions associated with the three sets of PC scores for the climate variables. The BayPass software controls for background population structure and is based on the BAYENV method introduced by Gunther and Coop [83]. This software controls for background population structure by using a population covariance matrix for populations within each species, and then quantifies the association of each SNP with an environmental variable (in our case, a PC axis). We ran this program separately for each species and for each PC (eight species by three PCs). We treated each PC score as the environmental covariate and ran the standard covariate model. For each data set, we ran four Markov chain Monte Carlo (MCMC) simulations, each with a 20,000-iteration burn-in and 50,000 sampling iterations with a thinning interval of 100. We used the default option of importance sampling to calculate the regression coefficient (βi), which describes the association of each SNP with climate PC scores. For a given SNP, the BF compares the marginal likelihoods of models with zero versus non-zero regression coefficients (i.e., values of βi); this is like a likelihood ratio except the marginal likelihood of the model with non-zero regression coefficients are integrated over the prior distribution. Finally, since we had a different number of focal SNPs for each species, we calculated median of logarithmic BF for 100 kilobase (Kb) non-overlapping SNP windows (i.e., the same window boundaries were used in every species, facilitating comparisons among them). For a given species, we had the following number of SNP windows: 1771 windows with an average of 1.73 SNPs per window for T. bartmani, 3852 windows with an average of 2.04 SNPs per window for T. californicum, 1806 windows with an average of 2.31 SNPs per window for T. chumash, 9754 windows with an average of 20.76 SNPs per window for T. cristinae, 4426 windows with an average of 2.55 SNPs per window for T. knulli, 3799 windows with an average of 2.25 SNPs per window for T. landelsensis, 2443 windows with an average of 2.45 SNPs per window for T. podura, and 3609 windows with an average of 1.98 SNPs for T. poppensis. Our downstream analyses described below focus on these windows. We delimited climate-associated SNP windows as those with greatest association with the three climate PCs, specifically as the windows in the top 10% quantile. We refer to such windows as “climate-associated SNP windows” hereafter.
Quantifying parallel genomic associations with climate
We quantified parallel genomic associations with climate across species (using the results described above from BayPass) and used randomization tests to measure the extent to which the observed parallelism exceeded that expected by chance. We report this excess as ‘x-fold’ enrichments, relative to null expectations, also reporting associated P-values for statistical significance.
We quantified overlap in climate-associated SNP windows between multiple species (“multispecies comparisons”) i.e., we tested if the same SNP windows show association with climate PCs between or among 3, 4, 5, 6, 7 or 8 species. We did this for each of the three climate PCs. To do this, we used randomization tests (10,000 randomizations per test) to generate null expectations for the proportion of top climate-associated SNP windows shared between a given pair of species and tested whether this was significantly more than expected by chance (x-fold enrichments and P-values). As an example, an x-fold enrichment of 2.0 would indicate that twice as many climate-associated SNP windows showed overlap between a given set of species than was expected by chance (based on the mean of the null). With our approach, we assess coarse-grain (100 Kb) genomic parallelism by analyzing multiple SNPs spread across the genome, rather than focusing on parallelism at the level of specific mutations or genes. Nonetheless, we suspect that parallelism at this scale will often involve the same genes, as only a modest number of genes occur in most 100 Kb windows (e.g., mean number of genes per window = 1 gene).
We note that our approach is not a direct test of whether the same variants or alleles per se are responsible for climate adaptation in different species. Rather, we assess the degree to which the same gene regions associated with climatic variation within species are shared among species, and the extent to which such parallelism can be accounted for by taxa being more similar in the environmental conditions they experience and/or how closely they are related to one another in their overall levels of genomic divergence. Our focus on genomic regions as the unit for quantifying parallelism also means that it is not necessarily the case that the exact same gene(s) are involved in climatic adaptation between species. However, the size of the windows we use to define genomic regions for the analysis (100 Kb) is such that given the gene density in Timema on average only 1.78 SNPs will be present in each region. Thus, it can be inferred that shared genetic responses of gene regions across species generally equate to the involvement of the same loci or genetic basis for climate adaptation.
Testing the shared ecology and shared genetics hypotheses
We tested the contribution of shared ecology versus shared genetics to the observed degree of parallelism. We expect both shared ecology and genetics to influence the extent of parallelism. To do so, we fit Bayesian linear mixed models (BLMMs) to explicitly compare models where parallelism is determined by climatic similarity, genetic similarity, or both. This Bayesian regression analysis is based on the mixed model framework proposed by [84] and extended by [65]. Our method accounts for the correlated error structure inherent in pairwise covariates and response variables (e.g., climatic or genetic distances). In this analysis, our response variable was the x-fold excess in shared top climate-associated SNP windows for a given PC (we did analyses separately for each climate PC). Our independent variables were climatic and genetic distances, estimated as follows. Climatic distance was calculated as pairwise absolute mean difference of PC scores of each species. We calculated genetic (i.e., phylogenetic) distances based on the previously published phylogeny described in [61]. Briefly, we used the data from this previous phylogeny (based on genome-wide SNP data) constructed using Bayesian phylogenetic inference with BEAST (version 2.1.387) for 11 Timema species based on GBS data of curated dataset of 19,556 single-nucleotide variants. For our current study, we used pairwise phylogenetic distances for the eight Timema species as our metrics of genetic distances for this analysis. All variables were standardized (given mean 0 and standard deviation of 1) before analysis.
We then considered four alternative models: (i) a null model without covariates, (ii) a model including only phylogenetic distance, (iii) a model with only climatic distance, and (iv) a model with both climate and phylogenetic distance. We fit the models in R using the rjags (version 4.8) interface with Jags (version 4.3.0). We used minimally informative priors for the regression coefficients (i.e., normal with μ = 0 and precision τ = 0.001) and for the population random effects and residual errors, all gamma (1, 0.01). Deviance information criterion was used for model comparison. Parameter estimates and DIC estimates were obtained via MCMC. For each analysis and model, we ran three chains each comprising 10,000 sampling iterations, a 2000-iteration burn-in, and a thinning interval of 5.
Comparison of parallelism results to permuted datasets
We next asked whether the patterns of observed genomic parallelism and its decay could have been inflated (unexpectedly high numbers) due to unaccounted aspects of the genetic data. We did this by permuting environmental variables (i.e., PC scores) before running BayPass rather than just permuting BF across species. Our expectation was that a high number of false positives with the permuted environmental variables would raise a warning against the results obtained from the observed data. We did this by generating and analyzing 10 permuted data sets identical to our own, but with each PC score randomized across populations within each species (10 permutations x 3 PCs x 8 species = 240 combinations). We limited our analyses to 10 permuted data sets because of the very large computational burden of running these analyses. Hereafter, we refer to this data as “permuted data sets”. We then performed analysis for each of the 10 permuted data sets, for each species separately, exactly as described for the real data set. First, we ran BayPass using each of the permuted data sets and for each species. Second, we quantified the degree of genomic parallelism by making pairwise and multi-species comparisons exactly as we did for the real data set (i.e., including the permutations to test for excess overlap). Thirdly, we fit Bayesian linear mixed models to test for the effect of ecology (i.e., the permuted climatic PC variables) and genetics on the decay of genomic parallelism.
Climate-associated SNP windows and field-experiment associated genetic regions
We quantified overlap between climate-associated SNP windows and windows that exhibited elevation-dependent allele-frequency change in a previously published release-recapture field experiment. We then tested if this overlap was greater than expected by chance. Full details of the experiment can be found in the original publications [67,71] but those relevant for the current study are as follows. The experiment involved releasing 500 T. cristinae (from which a tissue sample was taken) onto 10 experimental bushes (five blocks, each with one plant of Adenostoma fasciculatum and one of Ceanothus spinosus). Survivors were recaptured eight days later. Whole-genome sequence data, which we analyze here, was obtained from 491 of the 500 stick insects [71].
For the current study, we estimated allele frequencies in the released and recaptured stick insects at the 6,175,495 bi-allelic SNPs identified by [71]. This was done using an expectation-maximization (EM) algorithm as implemented in the program estpEM (version 0.1) with tolerance of 0.001 and a maximum of 50 EM iterations [85]. We then used these estimates to compute allele-frequency change between the start and end of the experiment. Then, for each SNP we calculated the Pearson correlation between allele frequency change and the elevation at each of the ten transplant sites. Finally, we determined the average correlation between change and elevation for the 100 Kb windows across the genome. Windows with fewer than four SNPs were ignored. These steps were done using R (version 3.4).
We then calculated the number of 100Kb windows that were among the top 10% for both elevation-dependent change during the experiment (highest average absolute correlation) and for climate-association (highest average BF for each climate PC). We used a constrained randomization procedure to generate null expectations for such concordance between change and climate-association windows, using a separate randomization for each PC. Specifically, we randomized mean change metrics across windows, but only among windows with similar SNP densities (10 equally sized bins were used for this). This was done because we observed a positive correlation between SNP density and mean change-elevation correlations per window (Pearson R = 0.069, 95% CI = 0.047-0.091, P < 0.001), and we wanted to control for this. Null distributions and P-values were based on 1000 randomizations and are reported for each climate PC.
Extended Data
Extended Data Figure 1.
Ordination of climate variation (22 variables, see Table S2 for code descriptions) via principal component analysis (PCA). Points denote the study populations, colour-coded by species.
Extended Data Figure 2.
Manhattan plots showing the strength of evidence for association (measured here using the Bayes factor from the software BayPass) between a SNP window and climate for PC1. Results are shown along the 13 linkage groups. In each panel title, the two values in parentheses are the number of SNP windows in the top 10% quantile (“windows”), followed by the number of linkage groups with at least 1 SNP window in the top 10% quantile (“LG”).
Extended Data Figure 3.
Manhattan plots showing the strength of evidence for association (measured here using the Bayes factor from the software BayPass) between a SNP window and climate for PC2. Results are shown along the 13 linkage groups. In each panel title, the two values in parentheses are the number of SNP windows in the top 10% quantile (“windows”), followed by the number of linkage groups with at least 1 SNP window in the top 10% quantile (“LG”).
Extended Data Figure 4.
Tests for parallel climate-associated SNP windows between species of Timema stick insects (all plots are for the top 10% empirical quantile) for PC1. Plot shows x-fold enrichments for the number of overlapping climate-associated SNP windows for PC1 for comparisons between multiple species, i.e., beyond pairs of species (e.g., 2 or more species, 3 or more species, 4 or more species). Gray dots denote x-fold values expected under 1000 randomizations for a null distribution. Black diamond denotes median of the x-fold values expected under 1000 randomizations for a null distribution. Red dot and N value above each group indicates the observed number of overlapping climate-associated SNP windows for each comparison. P-value above each group denotes whether the overlap is greater than expected by chance from a one-sided randomization test. * Indicates x-fold enrichments with P-value = 0.05.
Extended Data Figure 5.
Tests for parallel climate-associated SNP windows between species of Timema stick insects (all plots are for the top 10% empirical quantile) for PC2. Plot shows x-fold enrichments for the number of overlapping climate-associated SNP windows for PC2 for comparisons between multiple species, i.e., beyond pairs of species (e.g., 2 or more species, 3 or more species, 4 or more species). Gray dots denote x-fold values expected under 1000 randomizations for a null distribution. Black diamond denotes median of the x-fold values expected under 1000 randomizations for a null distribution. Red dot and N value above each group indicates the observed number of overlapping climate-associated SNP windows for each comparison. P-value above each group denotes whether the overlap is greater than expected by chance from a one-sided randomization test. * Indicates x-fold enrichments with P-value = 0.05.
Extended Data Figure 6.
Test results of the “shared ecology” versus “shared genetics” hypotheses for PC1. (A) Scatterplot shows the relationship between X-fold enrichment (measure for parallelism) and climatic distance (measured as the distance in PC1 scores) based on a single-factor linear model. (B) Scatterplot shows the relationship between X-fold enrichment (measure for parallelism) and genetic distance (measured as pairwise phylogenetic distance) based on a single-factor linear model. (C) Scatterplot shows the relationship between climatic distance (measured as the distance in PC1 scores and is the distance in climate variables) and genetic distance (calculated as pairwise phylogenetic distance) based on a single-factor linear model. (D) Plot shows parameter estimates with standardized coefficients for the full model for PC1. This test was implemented for all eight species and 56 species pairs. Error bars indicate 95% equal-tail probability intervals (ETPIs). A negative or positive estimate that deviates from zero indicates the effect on parallelism.
Extended Data Figure 7.
Test results of the “shared ecology” versus “shared genetics” hypotheses for PC2. (A) Scatterplot shows the relationship between X-fold enrichment (measure for parallelism) and climatic distance (measured as the distance in PC2 scores) based on a single-factor linear model. (B) Scatterplot shows the relationship between X-fold enrichment (measure for parallelism) and genetic distance (measured as pairwise phylogenetic distance) based on a single-factor linear model. (C) Scatterplot shows the relationship between climatic distance (measured as the distance in PC2 scores and is the distance in climate variables) and genetic distance (calculated as pairwise phylogenetic distance) based on a single-factor linear model. (D) Plot shows parameter estimates with standardized coefficients for the full model only for PC2. This test was implemented for all eight species and 56 species pairs. Error bars indicate 95% equal-tail probability intervals (ETPIs). A negative or positive estimate that deviates from zero indicates the effect on parallelism.
Supplementary Material
Acknowledgements
SC was supported by the Utah State University College of Science and School of Graduate Studies. MM was supported by Swiss National Science Foundation Postdoc Mobility grants PBBSP3_141367 and P300P3_147888. ZG was supported by the US NSF (DEB 1844941). This study is part of a project that has received funding from the European Research Council (ERC) to PN, under the European Union’s Horizon 2020 research and innovation program (Grant agreement No. 770826 EE-Dynamics). JFF was supported by NSF Dimensions in Biodiversity grant (1638997). The support and resources from the Center for High-Performance Computing at the University of Utah are gratefully acknowledged. We thank Landells-Hill Big Creek Reserve (DOI: 10.21973/N3NH24) where part of the samples included in this study were collected.
Footnotes
Author Contributions
PN, MM, OGO, ZG, JLF, and SC designed the study. PN, MM, RR and VS-C collected data.
ZG, OGO, and SC analyzed the data. SC wrote the manuscript with feedback from all co-authors.
Competing Interests
The authors declare no competing interests.
Data Availability Statement
The genetic data used in this paper are associated with previous studies and are archived in the National Center for Biotechnology Information (NCBI) Short Read Archive under the following BioProject Accession Number: PRJNA356405. The genome draft 0.3 is available on the Nosil Lab of Evolutionary Biology website (http://nosil-lab.group.shef.ac.uk/?page_id=25). The climate data and PCA scores used for analyses, a list of accession numbers of sequences used in this study, genotype likelihood files, variant calling format files and associated scripts, input file and scripts for programs such as Entropy, BayPass, and Treemix are available on DRYAD repository (https://doi.org/10.5061/dryad.51c59zwbr).
Code Availability
Computer code is available on https://github.com/karwaan/Timema_climate_adaptation_genomics. All associated data files and scripts for specific analyses are archived on DRYAD (https://doi.org/10.5061/dryad.51c59zwbr). Correspondence for materials (data, scripts, or samples) should be addressed to Samridhi Chaturvedi (samridhi.chaturvedi@gmail.com) or Zachariah Gompert (zach.gompert@usu.edu) or Patrik Nosil (patrik.nosil@cefe.crns.fr).
References
- 1.Gould StephenJay. Wonderful Life. Radius; London, England: 1990. [Google Scholar]
- 2.Blount Zachary D, Borland Christina Z, Lenski Richard E. Historical Contingency and the Evolution of a Key Innovation in an Experimental Population of Escherichia Coli. Proceedings of the National Academy of Sciences of the United States of America. 2008;105(23):7899–7906. doi: 10.1073/pnas.0803151105. [DOI] [PMC free article] [PubMed] [Google Scholar]
- 3.Meyers Peter J, Doellman Meredith M, Ragland Gregory J, Hood Glen R, Egan Scott P, Powell Thomas HQ, Nosil Patrik, Feder Jeffrey L. Can the Genomics of Ecological Speciation Be Predicted across the Divergence Continuum from Host Races to Species? A Case Study in Rhagoletis. Philosophical Transactions of the Royal Society of London Series B, Biological Sciences. 2020;375(1806):20190534. doi: 10.1098/rstb.2019.0534. [DOI] [PMC free article] [PubMed] [Google Scholar]
- 4.Stern DavidL, Orgogozo Virginie. Is Genetic Evolution Predictable? Science (New York, NY) 2009;323(5915):746–51. doi: 10.1126/science.1158997. [DOI] [PMC free article] [PubMed] [Google Scholar]
- 5.Langerhans R Brian. Predicting Evolution with Generalized Models of Divergent Selection: A Case Study with Poeciliid Fish. Integrative and Comparative Biology. 2010;50(6):1167–84. doi: 10.1093/icb/icq117. [DOI] [PubMed] [Google Scholar]
- 6.Losos Jonathan B. Convergence, Adaptation, and Constraint. Evolution; International Journal of Organic Evolution. 2011;65(7):1827–40. doi: 10.1111/j.1558-5646.2011.01289.x. [DOI] [PubMed] [Google Scholar]
- 7.Waldvogel Ann-Marie, Feldmeyer Barbara, Rolshausen Gregor, Exposito-Alonso Moises, Rellstab Christian, Kofler Robert, Mock Thomas, et al. Evolutionary Genomics Can Improve Prediction of Species’ Responses to Climate Change. Evolution Letters. 2020;4(1):4–18. doi: 10.1002/evl3.154. [DOI] [PMC free article] [PubMed] [Google Scholar]
- 8.Lieberman Tami D, Michel Jean-Baptiste, Aingaran Mythili, Potter-Bynoe Gail, Roux Damien, Davis Michael R, Jr, Skurnik David, et al. Parallel Bacterial Evolution within Multiple Patients Identifies Candidate Pathogenicity Genes. Nature Genetics. 2011;43(12):1275–80. doi: 10.1038/ng.997. [DOI] [PMC free article] [PubMed] [Google Scholar]
- 9.Grant Peter R, Grant B Rosemary. Unpredictable Evolution in a 30-Year Study of Darwin’s Finches. Science (New York, NY) 2002;296(5568):707–11. doi: 10.1126/science.1070315. [DOI] [PubMed] [Google Scholar]
- 10.Bolnick Daniel I, Barrett Rowan DH, Oke Krista B, Rennison Diana J, Stuart YoelE. (Non)Parallel Evolution. Annual Review of Ecology, Evolution, and Systematics. 2018;49(1):303–30. [Google Scholar]
- 11.Colosimo Pamela F, Hosemann Kim E, Balabhadra Sarita, Villarreal Guadalupe, Jr, Dickson Mark, Grimwood Jane, Schmutz Jeremy, Myers RichardM, Schluter Dolph, Kingsley David M. Widespread Parallel Evolution in Sticklebacks by Repeated Fixation of Ectodysplasin Alleles. Science (New York, NY) 2005;307(5717):1928–33. doi: 10.1126/science.1107239. [DOI] [PubMed] [Google Scholar]
- 12.Kingsley Evan P, Manceau Marie, Wiley Christopher D, Hoekstra Hopi E. Melanism in Peromyscus Is Caused by Independent Mutations in Agouti. PloS One. 2009;4(7):e6435. doi: 10.1371/journal.pone.0006435. [DOI] [PMC free article] [PubMed] [Google Scholar]
- 13.Manceau Marie, Domingues Vera S, Linnen Catherine R, Rosenblum Erica Bree, Hoekstra Hopi E. Convergence in Pigmentation at Multiple Levels: Mutations, Genes and Function. Philosophical Transactions of the Royal Society of London Series B, Biological Sciences. 2010;365(1552):2439–50. doi: 10.1098/rstb.2010.0104. [DOI] [PMC free article] [PubMed] [Google Scholar]
- 14.Linnen Catherine R, Poh Yu-Ping, Peterson Brant K, Barrett Rowan DH, Larson Joanna G, Jensen Jeffrey D, Hoekstra Hopi E. Adaptive Evolution of Multiple Traits through Multiple Mutations at a Single Gene. Science (New York, NY) 2013;339(6125):1312–16. doi: 10.1126/science.1233213. [DOI] [PMC free article] [PubMed] [Google Scholar]
- 15.Elmer Kathryn R, Meyer Axel. Adaptation in the Age of Ecological Genomics: Insights from Parallelism and Convergence. Trends in Ecology & Evolution. 2011;26(6):298–306. doi: 10.1016/j.tree.2011.02.008. [DOI] [PubMed] [Google Scholar]
- 16.Stern David L. The Genetic Causes of Convergent Evolution. Nature Reviews Genetics. 2013;14(11):751–64. doi: 10.1038/nrg3483. [DOI] [PubMed] [Google Scholar]
- 17.Greenway Ryan, Barts Nick, Henpita Chathurika, Brown Anthony P, Rodriguez Lenin Arias, Rodríguez Peña CarlosM, Arndt Sabine, et al. Convergent Evolution of Conserved Mitochondrial Pathways Underlies Repeated Adaptation to Extreme Environments. Proceedings of the National Academy of Sciences of the United States of America. 2020;117(28):16424–30. doi: 10.1073/pnas.2004223117. [DOI] [PMC free article] [PubMed] [Google Scholar]
- 18.Barrett Rowan DH, Schluter Dolph. Adaptation from Standing Genetic Variation. Trends in Ecology & Evolution. 2008;23(1):38–44. doi: 10.1016/j.tree.2007.09.008. [DOI] [PubMed] [Google Scholar]
- 19.Papadopulos Alexander ST, Helmstetter Andrew J, Osborne Owen G, Comeault AaronA, Wood Daniel P, Straw Edward A, Mason Laurence, et al. Rapid Parallel Adaptation to Anthropogenic Pollution Heavy Metal. Molecular Biology and Evolution. 2021;38(9):3724–36. doi: 10.1093/molbev/msab141. [DOI] [PMC free article] [PubMed] [Google Scholar]
- 20.Yeaman Sam. Local Adaptation by Alleles of Small Effect. The American Naturalist. 2015;186 Suppl 1(S1):S74-89. doi: 10.1086/682405. [DOI] [PubMed] [Google Scholar]
- 21.Yeaman Sam, Hodgins Kathryn A, Lotterhos Katie E, Suren Haktan, Nadeau Simon, Degner Jon C, Nurkowski Kristin A, et al. Convergent Local Adaptation to Climate in Distantly Related Conifers. Science (New York, NY) 2016;353(6306):1431–33. doi: 10.1126/science.aaf7812. [DOI] [PubMed] [Google Scholar]
- 22.Chaturvedi Samridhi, Lucas Lauren K, Nice Chris C, Fordyce James A, Forister Matthew L, Gompert Zachariah. The Predictability of Genomic Changes Underlying a Recent Host Shift in Melissa Blue Butterflies. Molecular Ecology. 2018;27(12):2651–66. doi: 10.1111/mec.14578. [DOI] [PubMed] [Google Scholar]
- 23.Arendt Jeff, Reznick David. Convergence and Parallelism Reconsidered: What Have We Learned about the Genetics of Adaptation? Trends in Ecology & Evolution. 2008;23(1):26–32. doi: 10.1016/j.tree.2007.09.011. [DOI] [PubMed] [Google Scholar]
- 24.Conte Gina L, Arnegard Matthew E, Peichel Catherine L, Schluter Dolph. The Probability of Genetic Parallelism and Convergence in Natural Populations. Proceedings Biological Sciences. 2012;279(1749):5039–47. doi: 10.1098/rspb.2012.2146. [DOI] [PMC free article] [PubMed] [Google Scholar]
- 25.Bailey Susan F, Rodrigue Nicolas, Kassen Rees. The Effect of Selection Environment on the Probability of Evolution Parallel. Molecular Biology and Evolution. 2015;32(6):1436–48. doi: 10.1093/molbev/msv033. [DOI] [PubMed] [Google Scholar]
- 26.Lenski RichardE. Experimental Evolution and the Dynamics of Adaptation and Genome Evolution in Microbial Populations. The ISME Journal. 2017;11(10):2181–94. doi: 10.1038/ismej.2017.69. [DOI] [PMC free article] [PubMed] [Google Scholar]
- 27.Roda Federico, Liu Huanle, Wilkinson Melanie J, Walter Gregory M, James Maddie E, Bernal Diana M, Melo Maria C, et al. Convergence and Divergence during the Adaptation to Similar Environments by an Australian Groundsel. Evolution; International Journal of Organic Evolution. 2013;67(9):2515–29. doi: 10.1111/evo.12136. [DOI] [PubMed] [Google Scholar]
- 28.Stuart Yoel E, Veen Thor, Weber Jesse N, Hanson Dieta, Ravinet Mark, Lohman Brian K, Thompson Cole J, et al. Contrasting Effects of Environment and Genetics Generate a Continuum of Parallel Evolution. Nature Ecology & Evolution. 2017;1(6):158. doi: 10.1038/s41559-017-0158. [DOI] [PubMed] [Google Scholar]
- 29.Morales Hernán E, Faria Rui, Johannesson Kerstin, Larsson Tomas, Panova Marina, Westram Anja M, Butlin Roger K. Genomic Architecture of Parallel Ecological Divergence: Beyond a Single Environmental Contrast. Science Advances. 2019;5(12):eaav9963. doi: 10.1126/sciadv.aav9963. [DOI] [PMC free article] [PubMed] [Google Scholar]
- 30.Manousaki Tereza, Hull Pincelli M, Kusche Henrik, Machado-Schiaffino Gonzalo, Franchini Paolo, Harrod Chris, Elmer Kathryn R, Meyer Axel. Parsing Parallel Evolution: Ecological Divergence and Differential Gene Expression in the Adaptive Radiations of Thick-Lipped Midas Cichlid Fishes from Nicaragua. Molecular Ecology. 2013;22(3):650–69. doi: 10.1111/mec.12034. [DOI] [PubMed] [Google Scholar]
- 31.Rennison Diana J, Delmore Kira E, Samuk Kieran, Owens Gregory L, Miller Sara E. Shared Patterns of Genome-Wide Differentiation Are More Strongly Predicted by Geography than by Ecology. The American Naturalist. 2020;195(2):192–200. doi: 10.1086/706476. [DOI] [PubMed] [Google Scholar]
- 32.Schluter Dolph, Clifford Elizabeth A, Nemethy Maria, McKinnon Jeffrey S. Parallel Evolution and Inheritance of Quantitative Traits. The American Naturalist. 2004;163(6):809–22. doi: 10.1086/383621. [DOI] [PubMed] [Google Scholar]
- 33.Roesti Marius, Gavrilets Sergey, Hendry Andrew P, Salzburger Walter, Berner Daniel. The Genomic Signature of Parallel Adaptation from Shared Genetic Variation. Molecular Ecology. 2014;23(16):3944–56. doi: 10.1111/mec.12720. [DOI] [PMC free article] [PubMed] [Google Scholar]
- 34.Meyers Peter J, Doellman Meredith M, Ragland Gregory J, Hood Glen R, Egan Scott P, Powell Thomas HQ, Nosil Patrik, Feder Jeffrey L. Can the genomics of ecological speciation be predicted across the divergence continuum from host races to species? A case study in Rhagoletis. Philosophical Transactions of the Royal Society B. 2020;375(1806):20190534. doi: 10.1098/rstb.2019.0534. [DOI] [PMC free article] [PubMed] [Google Scholar]
- 35.Matos Margarida, Simões Pedro, Santos MartaA, Seabra SofiaG, Faria GonçaloS, Vala Filipa, Santos Josiane, Fragata Inês. History, Chance and Selection during Phenotypic and Genomic Experimental Evolution: Replaying the Tape of Life at Different Levels. Frontiers in Genetics. 2015 February;6:71. doi: 10.3389/fgene.2015.00071. [DOI] [PMC free article] [PubMed] [Google Scholar]
- 36.Good Benjamin H, McDonald Michael J, Barrick Jeffrey E, Lenski Richard E, Desai Michael M. The Dynamics of Molecular Evolution over 60,000 Generations. Nature. 2017;551(7678):45–50. doi: 10.1038/nature24287. [DOI] [PMC free article] [PubMed] [Google Scholar]
- 37.Storz Jay F. Causes of Molecular Convergence and Parallelism in Protein Evolution. Nature Reviews Genetics. 2016;17(4):239–50. doi: 10.1038/nrg.2016.11. [DOI] [PMC free article] [PubMed] [Google Scholar]
- 38.Kohler Annegret, Kuo Alan, Nagy Laszlo G, Morin Emmanuelle, Barry Kerrie W, Buscot Francois, Canbäck Björn, et al. Convergent Losses of Decay Mechanisms and Rapid Turnover of Symbiosis Genes in Mycorrhizal Mutualists. Nature Genetics. 2015;47(4):410–15. doi: 10.1038/ng.3223. [DOI] [PubMed] [Google Scholar]
- 39.Haldane John Burdon. The Causes of Evolution Princeton Science Library 5. Princeton University Press; Princeton, NJ: 1990. [Google Scholar]
- 40.Gompel Nicolas, Carroll Sean B. Genetic Mechanisms and Constraints Governing the Evolution of Correlated Traits in Drosophilid Flies. Nature. 2003;424(6951):931–35. doi: 10.1038/nature01787. [DOI] [PubMed] [Google Scholar]
- 41.Orgogozo Virginie. Replaying the Tape of Life in the Twenty-First Century. Interface Focus. 2015;5(6):20150057. doi: 10.1098/rsfs.2015.0057. [DOI] [PMC free article] [PubMed] [Google Scholar]
- 42.Blount Zachary D, Lenski Richard E, Losos Jonathan B. Contingency and Determinism in Evolution: Replaying Life’s Tape. Science (New York, NY) 2018;362(6415):eaam5979. doi: 10.1126/science.aam5979. [DOI] [PubMed] [Google Scholar]
- 43.Nosil Patrik. Divergent Host Plant Adaptation and Reproductive Isolation between Ecotypes of Timema cristinae Walking Sticks. The American Naturalist. 2007;169(2):151–62. doi: 10.1086/510634. [DOI] [PubMed] [Google Scholar]
- 44.Comeault Aaron A, Carvalho Clarissa F, Dennis Stuart, Soria-Carrasco Víctor, Nosil Patrik. Color Phenotypes Are under Similar Genetic Control in Two Distantly Related Species of Timema stick Insect. Evolution; International Journal of Organic Evolution. 2016;70(6):1283–96. doi: 10.1111/evo.12931. [DOI] [PubMed] [Google Scholar]
- 45.Comeault Aaron A, Flaxman Samuel M, Riesch Rüdiger, Curran Emma, Soria-Carrasco Victor, Gompert Zachariah, Farkas Timothy E, et al. Selection on a Genetic Polymorphism Counteracts Ecological Speciation in a Stick Insect. Current Biology: CB. 2015;25(15):1975–81. doi: 10.1016/j.cub.2015.05.058. [DOI] [PubMed] [Google Scholar]
- 46.Lindtke Dorothea, Lucek Kay, Soria-Carrasco Víctor, Villoutreix Romain, Farkas Timothy E, Riesch Rüdiger, Dennis Stuart R, Gompert Zach, Nosil Patrik. LongTerm Balancing Selection on Chromosomal Variants Associated with Crypsis in a Stick Insect. Molecular Ecology. 2017;26(22):6189–6205. doi: 10.1111/mec.14280. [DOI] [PubMed] [Google Scholar]
- 47.Villoutreix Romain, de Carvalho Clarissa F, Soria-Carrasco Víctor, Lindtke Dorothea, De-la-Mora Marisol, Muschick Moritz, Feder Jeffrey L, Parchman Thomas L, Gompert Zach, Nosil Patrik. Large-Scale Mutation in the Evolution of a Gene Complex for Cryptic Coloration. Science (New York, NY) 2020;369(6502):460–66. doi: 10.1126/science.aaz4351. [DOI] [PubMed] [Google Scholar]
- 48.Barghi Neda, Hermisson Joachim, Schlötterer Christian. Polygenic Adaptation: A Unifying Framework to Understand Positive Selection. Nature Reviews Genetics. 2020;21(12):769–81. doi: 10.1038/s41576-020-0250-z. [DOI] [PubMed] [Google Scholar]
- 49.Rockman Matthew V. The QTN Program and the Alleles That Matter for Evolution: All That’s Gold Does Not Glitter. Evolution; International Journal of Organic Evolution. 2012;66(1):1–17. doi: 10.1111/j.1558-5646.2011.01486.x. [DOI] [PMC free article] [PubMed] [Google Scholar]
- 50.Law Jennifer H, Crespi Bernard J. The Evolution of Geographic Parthenogenesis in Timema Walking-Sticks. Molecular Ecology. 2002;11(8):1471–89. doi: 10.1046/j.1365-294x.2002.01547.x. [DOI] [PubMed] [Google Scholar]
- 51.Nosil Patrik, Villoutreix Romain, de Carvalho Clarissa F, Feder Jeffrey L, Parchman Thomas L, Gompert Zach. Ecology Shapes Epistasis in a Genotype-Phenotype-Fitness Map for Stick Insect Colour. Nature Ecology & Evolution. 2020;4(12):1673–84. doi: 10.1038/s41559-020-01305-y. [DOI] [PubMed] [Google Scholar]
- 52.Siepielski Adam M, Morrissey Michael B, Buoro Mathieu, Carlson Stephanie M, Caruso Christina M, Clegg Sonya M, Coulson Tim, et al. Precipitation Drives Global Variation in Natural Selection. Science (New York, NY) 2017;355(6328):959–62. doi: 10.1126/science.aag2773. [DOI] [PubMed] [Google Scholar]
- 53.De La Torre Amanda R, Wilhite Benjamin, Neale David B. Environmental Genome-Wide Association Reveals Climate Adaptation Is Shaped by Subtle to Moderate Allele Frequency Shifts in Loblolly Pine. Genome Biology and Evolution. 2019;11(10):2976–89. doi: 10.1093/gbe/evz220. [DOI] [PMC free article] [PubMed] [Google Scholar]
- 54.Sprenger Philipp P, Burkert Lars H, Abou Bérengère, Federle Walter, Menzel Florian. Coping with the Climate: Cuticular Hydrocarbon Acclimation of Ants under Constant and Fluctuating Conditions. The Journal of Experimental Biology. 2018;221(9):jeb171488. doi: 10.1242/jeb.171488. [DOI] [PubMed] [Google Scholar]
- 55.Botella-Cruz María, Velasco Josefa, Millán Andrés, Hetz Stefan, Pallarés Susana. Cuticle Hydrocarbons Show Plastic Variation under Desiccation in Saline Aquatic Beetles. Insects. 2021;12(4):285. doi: 10.3390/insects12040285. [DOI] [PMC free article] [PubMed] [Google Scholar]
- 56.Heliconius Genome Consortium. Butterfly Genome Reveals Promiscuous Exchange of Mimicry Adaptations among Species. Nature. 2012;487(7405):94–98. doi: 10.1038/nature11041. [DOI] [PMC free article] [PubMed] [Google Scholar]
- 57.Henning Frederico, Meyer Axel. The Evolutionary Genomics of Cichlid Fishes: Explosive Speciation and Adaptation in the Postgenomic Era. Annual Review of Genomics and Human Genetics. 2014;15(1):417–41. doi: 10.1146/annurev-genom-090413-025412. [DOI] [PubMed] [Google Scholar]
- 58.Marburger Sarah, Monnahan Patrick, Seear Paul J, Martin Simon H, Koch Jordan, Paajanen Pirita, Bohutínská Magdalena, Higgins James D, Schmickl Roswitha, Yant Levi. Interspecific Introgression Mediates Adaptation to Whole Genome Duplication. Nature Communications. 2019;10(1):5218. doi: 10.1038/s41467-019-13159-5. [DOI] [PMC free article] [PubMed] [Google Scholar]
- 59.Giska Iwona, Farelo Liliana, Pimenta João, Seixas Fernando A, Ferreira Mafalda S, Marques João P, Miranda Inês, et al. Introgression Drives Repeated Evolution of Winter Coat Color Polymorphism in Hares. Proceedings of the National Academy of Sciences of the United States of America. 2019;116(48):24150–56. doi: 10.1073/pnas.1910471116. [DOI] [PMC free article] [PubMed] [Google Scholar]
- 60.Menon Mitra, Bagley Justin C, MPage Gerald F, Whipple Amy V, Schoettle Anna W, Still Christopher J, Wehenkel Christian, et al. Adaptive Evolution in a Conifer Hybrid Zone Is Driven by a Mosaic of Recently Introgressed and Background Genetic Variants. Communications Biology. 2021;4(1):160. doi: 10.1038/s42003-020-01632-7. [DOI] [PMC free article] [PubMed] [Google Scholar]
- 61.Riesch Rüdiger, Muschick Moritz, Lindtke Dorothea, Villoutreix Romain, Comeault Aaron A, Farkas Timothy E, Lucek Kay, et al. Transitions between Phases of Genomic Differentiation during Stick-Insect Speciation. Nature Ecology & Evolution. 2017;1(4):82. doi: 10.1038/s41559-017-0082. [DOI] [PubMed] [Google Scholar]
- 62.Harvey Michael G, Smith Brian Tilston, Glenn Travis C, Faircloth Brant C, Brumfield Robb T. Sequence capture versus restriction site associated DNA sequencing for shallow systematics. Systematic biology. 2016;65(5):910–924. doi: 10.1093/sysbio/syw036. [DOI] [PubMed] [Google Scholar]
- 63.Schluter Dolph, Conte Gina L. Genetics and ecological speciation. Proceedings of the National Academy of Sciences. 2009;106(Supplement 1):9955–9962. doi: 10.1073/pnas.0901264106. [DOI] [PMC free article] [PubMed] [Google Scholar]
- 64.Liu Shenglin, Ferchaud Anne-Laure, Grønkjær Peter, Nygaard Rasmus, Hansen Michael M. Genomic parallelism and lack thereof in contrasting systems of three-spined sticklebacks. Molecular ecology. 2018;27(23):4725–4743. doi: 10.1111/mec.14782. [DOI] [PubMed] [Google Scholar]
- 65.Gompert Zachariah, Lucas Lauren K, Buerkle C Alex, Forister Matthew L, Fordyce James A, Nice Chris C. Admixture and the Organization of Genetic Diversity in a Butterfly Species Complex Revealed through Common and Rare Genetic Variants. Molecular Ecology. 2014;23(18):4555–73. doi: 10.1111/mec.12811. [DOI] [PubMed] [Google Scholar]
- 66.Spiegelhalter David J, Best Nicola G, Carlin Bradley P, van der Linde Angelika. Bayesian Measures of Model Complexity and Fit. Journal of the Royal Statistical Society Series B, Statistical Methodology. 2002;64(4):583–639. [Google Scholar]
- 67.Gompert Zachariah, Comeault Aaron A, Farkas Timothy E, Feder Jeffrey L, Parchman Thomas L, Buerkle C Alex, Nosil Patrik. Experimental Evidence for Ecological Selection on Genome Variation in the Wild. Ecology Letters. 2014;17(3):369–79. doi: 10.1111/ele.12238. [DOI] [PMC free article] [PubMed] [Google Scholar]
- 68.Walden Nora, Lucek Kay, Willi Yvonne. Lineage-Specific Adaptation to Climate Involves Flowering Time in North American Arabidopsis Lyrata. Molecular Ecology. 2020;29(8):1436–51. doi: 10.1111/mec.15338. [DOI] [PubMed] [Google Scholar]
- 69.Rose Noah H, Bay Rachael A, Morikawa Megan K, Palumbi Stephen R. Polygenic Evolution Drives Species Divergence and Climate Adaptation in Corals. Evolution; International Journal of Organic Evolution. 2018;72(1):82–94. doi: 10.1111/evo.13385. [DOI] [PubMed] [Google Scholar]
- 70.Blanco-Pastor JoséLuis, Liberal Isabel M, Sakiroglu Muhammet, Wei Yanling, Brummer ECharles, Andrew RoseL, Pfeil Bernard E. Annual and Perennial Medicago Show Signatures of Parallel Adaptation to Climate and Soil in Highly Conserved Genes. Molecular Ecology. 2021 July;:mec.16061. doi: 10.1111/mec.16061. [DOI] [PubMed] [Google Scholar]
- 71.Nosil Patrik, Villoutreix Romain, de Carvalho Clarissa F, Farkas Timothy E, Soria-Carrasco Víctor, Feder Jeffrey L, Crespi Bernard J, Gompert Zach. Natural Selection and the Predictability of Evolution in Timema Stick Insects. Science. 2018 February; doi: 10.1126/science.aap9125. https://science.sciencemag.org/content/359/6377/765 . [DOI] [PubMed] [Google Scholar]
- 72.Wang Li, Josephs Emily B, Lee Kristin M, Roberts Lucas M, Rellán-Álvarez Rubén, Ross-Ibarra Jeffrey, Hufford Matthew B. Molecular parallelism underlies convergent highland adaptation of maize landraces. Molecular biology and evolution. 2021;38(9):3567–3580. doi: 10.1093/molbev/msab119. [DOI] [PMC free article] [PubMed] [Google Scholar]
- 73.Bohutínská Magdalena, Vlček Jakub, Yair Sivan, Laenen Benjamin, Konečná Veronika, Fracassetti Marco, Slotte Tanja, Kolář Filip. Genomic Basis of Parallel Adaptation Varies with Divergence in Arabidopsis and Its Relatives. Proceedings of the National Academy of Sciences of the United States of America. 2021;118(21):e2022713118. doi: 10.1073/pnas.2022713118. [DOI] [PMC free article] [PubMed] [Google Scholar]
- 74.Lobréaux Stéphane, Melodelima Christelle. Detection of genomic loci associated with environmental variables using generalized linear mixed models. Genomics. 2015;105(2):69–75. doi: 10.1016/j.ygeno.2014.12.001. [DOI] [PubMed] [Google Scholar]
- 75.Frachon Léa, Bartoli Claudia, Carrère Sébastien, Bouchez Olivier, Chaubet Adeline, Gautier Mathieu, Roby Dominique, Roux Fabrice. A genomic map of climate adaptation in Arabidopsis thaliana at a micro-geographic scale. Frontiers in plant science. 2018;9:967. doi: 10.3389/fpls.2018.00967. [DOI] [PMC free article] [PubMed] [Google Scholar]
- 76.Contreras-Moreira Bruno, Serrano-Notivoli Roberto, Mohammed Naheif E, Cantalapiedra Carlos P, Beguería Santiago, Casas Ana M, Igartua Ernesto. Genetic Association with High-Resolution Climate Data Reveals Selection Footprints in the Genomes of Barley Landraces across the Iberian Peninsula. Molecular Ecology. 2019;28(8):1994–2012. doi: 10.1111/mec.15009. [DOI] [PMC free article] [PubMed] [Google Scholar]
- 77.Bay Rachael A, Taylor Eric B, Schluter Dolph. Parallel Introgression and Selection on Introduced Alleles in a Native Species. Molecular Ecology. 2019;28(11):280213. doi: 10.1111/mec.15097. [DOI] [PubMed] [Google Scholar]
- 78.Zhang Xiao, Rayner Jack G, Blaxter Mark, Bailey Nathan W. Rapid Parallel Adaptation despite Gene Flow in Silent Crickets. Nature Communications. 2021;12(1):50. doi: 10.1038/s41467-020-20263-4. [DOI] [PMC free article] [PubMed] [Google Scholar]
- 79.Marques David A, Jones Felicity C, Di Palma Federica, Kingsley David M, Reimchen Thomas E. Experimental evidence for rapid genomic adaptation to a new niche in an adaptive radiation. Nature ecology & evolution. 2018;2(7):1128–1138. doi: 10.1038/s41559-018-0581-8. [DOI] [PMC free article] [PubMed] [Google Scholar]
- 80.Li Heng, Handsaker Bob, Wysoker Alec, Fennell Tim, Ruan Jue, Homer Nils, Marth Gabor, Abecasis Goncalo, Durbin Richard, 1000 Genome Project Data ProcessingSubgroup The Sequence Alignment/Map Format and SAMtools. Bioinformatics (Oxford, England) 2009;25(16):2078–79. doi: 10.1093/bioinformatics/btp352. [DOI] [PMC free article] [PubMed] [Google Scholar]
- 81.Danecek Petr, Bonfield James K, Liddle Jennifer, Marshall John, Ohan Valeriu, Pollard Martin O, Whitwham Andrew, et al. Twelve Years of SAMtools and BCFtools. GigaScience. 2021;10(2) doi: 10.1093/gigascience/giab008. [DOI] [PMC free article] [PubMed] [Google Scholar]
- 82.Gautier Mathieu. Genome-Wide Scan for Adaptive Divergence and Association with Population-Specific Covariates. Genetics. 2015;201(4):1555–79. doi: 10.1534/genetics.115.181453. [DOI] [PMC free article] [PubMed] [Google Scholar]
- 83.Günther Torsten, Coop Graham. Robust Identification of Local Adaptation from Allele Frequencies. Genetics. 2013;195(1):205–20. doi: 10.1534/genetics.113.152462. [DOI] [PMC free article] [PubMed] [Google Scholar]
- 84.Clarke Ralph T, Rothery Peter, Raybould Alan F. Confidence Limits for Regression Relationships between Distance Matrices: Estimating Gene Flow with Distance. Journal of Agricultural, Biological, and Environmental Statistics. 2002;7(3):361–72. [Google Scholar]
- 85.Soria-Carrasco Víctor, Gompert Zachariah, Comeault Aaron A, Farkas Timothy E, Parchman Thomas L, Johnston J Spencer, Buerkle C Alex, et al. Stick Insect Genomes Reveal Natural Selection’s Role in Parallel Speciation. Science (New York, NY) 2014;344(6185):738–42. doi: 10.1126/science.1252136. [DOI] [PubMed] [Google Scholar]
Associated Data
This section collects any data citations, data availability statements, or supplementary materials included in this article.
Supplementary Materials
Data Availability Statement
The genetic data used in this paper are associated with previous studies and are archived in the National Center for Biotechnology Information (NCBI) Short Read Archive under the following BioProject Accession Number: PRJNA356405. The genome draft 0.3 is available on the Nosil Lab of Evolutionary Biology website (http://nosil-lab.group.shef.ac.uk/?page_id=25). The climate data and PCA scores used for analyses, a list of accession numbers of sequences used in this study, genotype likelihood files, variant calling format files and associated scripts, input file and scripts for programs such as Entropy, BayPass, and Treemix are available on DRYAD repository (https://doi.org/10.5061/dryad.51c59zwbr).
Computer code is available on https://github.com/karwaan/Timema_climate_adaptation_genomics. All associated data files and scripts for specific analyses are archived on DRYAD (https://doi.org/10.5061/dryad.51c59zwbr). Correspondence for materials (data, scripts, or samples) should be addressed to Samridhi Chaturvedi (samridhi.chaturvedi@gmail.com) or Zachariah Gompert (zach.gompert@usu.edu) or Patrik Nosil (patrik.nosil@cefe.crns.fr).


