

Summary
Background
Treatment of cardiovascular risk factors based on disease risk requires valid risk prediction equations. Our aim was to develop, and to apply in example countries, a cardiovascular disease (CVD consisting here of coronary heart disease or stroke) risk prediction equation that can be recalibrated and updated for application in different countries using routinely available information.
Methods
We used data from 8 cohort studies to estimate coefficients of the risk score using proportional hazards regressions. The risk equation included smoking, blood pressure, diabetes, and total cholesterol and allowed the effects of sex and age on CVD to vary across cohorts or countries. We developed risk equations for fatal CVD and for fatal-plus-non-fatal CVD. We then used the risk prediction equation, and data from recent national health surveys, to generate risk charts and estimate the proportion of population at different levels of CVD risk in 11 countries from different regions.
Findings
The risk score discriminated well in internal and external validations with C statistics generally ≥70%. At any age and risk factor level, the estimated 10-year fatal CVD risk varied substantially across countries, being lowest in South Korea, Spain, Japan and Denmark, and highest in Czech Republic, China, Iran and Mexico. The prevalence of people at high fatal CVD risk was lowest in South Korea, Spain and Denmark where only 5-10% of men and women had >10% risk, and 62-77% of men and 79-82% of women had <3% risk. Conversely, the proportion of people at high risk was largest in China and Mexico: 33% of Chinese men and 28% of women had a 10-year fatal CVD risk of ≥10%. In Mexico the prevalence of high-risk was 16% for men and 11% for women.
Interpretation
We developed a CVD risk model that can be recalibrated for application in different countries using routinely available information. The estimated percentage of people at high fatal CVD risk was higher in low- and middle-income countries than in high-income countries.
Introduction
It is now widely accepted that treatment for cardiometabolic risk factors like blood pressure and cholesterol should be based on disease risk, as opposed to the levels of individual risk factors.1–3 Risk-based treatment is included in clinical guidelines in many countries,4, 5 although debate continues on the appropriate threshold for treatment. Risk-based multidrug treatment and counselling has also been evaluated as a cost-effective intervention for reducing the burden of non-communicable diseases (NCDs) globally.6 As a part of the global response to NCDs, countries have agreed to a target of 50% coverage of multidrug treatment and counselling for people aged 40 years and older who are at high risk of cardiovascular disease (CVD), including coronary heart disease (CHD) and stroke.7
Risk-based treatment requires predicting CVD risk for each individual, which is most accurately done using risk prediction equations (often via risk charts or web-based risk calculators).3, 8, 9 Measuring progress towards the global NCD treatment target needs information on how many people in each country who are at high risk of CVD, which also requires an appropriate risk prediction equation as well as nationally representative data on risk factors. Risk prediction equations developed in one population cannot be satisfactorily applied to other populations, or even used in the same country years after they were originally developed due to changes in both risk factor levels and average disease risks.10, 11 This problem is dealt with by recalibrating the model, which involves resetting the average risk factor and disease risks to the levels observed in the target population. For example, the Framingham risk score has been updated several times and recalibrated for application in different countries with mixed results.12–16 The SCORE (Systematic Coronary Risk Evaluation) risk score, whose coefficients were estimated from European cohorts9, has also been recalibrated and applied to various European populations with variable results.11, 17, 18 The World Health Organization (WHO) developed a series of regional CVD risk charts in 2007.3 However, the coefficients of the risk prediction equation used to develop these charts were taken from epidemiological studies on one risk factor at a time, i.e., the coefficients for different risk factors were not derived from the same regression model or even from a consistent set of cohorts.19 Further, the risk charts were only produced at the regional and not country level even though the determinants of CVD and mortality vary across countries in the same region.
In this paper, we develop and present a risk prediction equation that can be recalibrated and updated for use in different countries using routinely available information. We estimate the coefficients of the risk prediction equation from pooled analysis of prospective cohort studies. We then recalibrate and apply the risk equation to nationally representative data on risk factors in countries from different regions to generate risk charts and estimate the distributions of 10-year fatal CVD risk.
Methods
Overview
A risk prediction equation (or risk score) estimates a person’s risk of CVD over a specific period (e.g., 10 years) based on the person’s levels of risk factors and the average CVD risk in the population. The risk score has a set of coefficients, usually hazard ratios (HRs), each of which quantify the proportional effect of the risk factor on CVD risk. There is strong evidence from cohort pooling and multi-country studies that HRs for major CVD risk factors are similar in at least Western and Asian populations as well as over time in the same population,20–22 although more data are needed from Africa and Latin America. Average CVD risk, on the other hand, differs substantially across populations and over time due to differences in both mean risk factor levels and other determinants of CVD including access to and quality of healthcare, and environmental, genetic, psychosocial and foetal and early childhood factors. In other words, the same levels of risk factors are associated with different CVD risks in populations with low vs. high event rates. Therefore, when applying a risk score to a new population, the two components of the risk score (i.e., the average risk factor levels and the average CVD risk) need to be replaced by the corresponding numbers from the target population, a process referred to as recalibration.8 Below, we describe a risk prediction equation that can be recalibrated and updated for use in different countries. In addition, our risk prediction equation allows the age-pattern of CVD risk to vary by sex and across populations and further allows the proportional effect of risk factors to vary by age; neither of these features was included in previous risk scores.
Data
To estimate the coefficients of the risk prediction equation, we pooled individual-level data from 8 prospective cohorts (Atherosclerosis Risk in Communities, Cardiovascular Health Study, Framingham Heart Study original cohort, Framingham Heart Study offspring cohort, Honolulu Heart Program, Multiple Risk Factor Intervention Trial, Puerto Rico Heart Health Program, and Women’s Health Initiative Clinical Trial). Information on these cohorts including additional references is summarized in the Appendix (page 5). We pooled data from multiple cohorts because it enhances statistical power which in turn allows including interaction terms between age or sex and risk factors, and because pooling reduces the influence of between-cohort variation on coefficients. We included participants who at baseline were 40 years of age or older (as there were few events in younger participants); did not have a history of CHD or stroke; were not missing data on the selected risk factors; and did not have biologically implausible risk factor levels as defined in Figure 1.
Figure 1. Flowchart of inclusion and exclusion of cohort participants*.

* HHP, MRFIT, and PRHHP include only men, and WHICT only women. † Only a subset of WHICT participants had cholesterol and fasting glucose measurements by design. ‡ Implausible data were considered as total cholesterol <1.75 or >20 mmol/L, systolic blood pressure <70 or >270 mmHg, and body mass index >80 kg/m2.
In our primary analysis, we developed a risk score for fatal CVD only. Although both fatal and non-fatal CVD are important for clinical and public health applications, national data on average death rates are much more reliable than those on disease incidence, even in high-income countries. Therefore a risk score based on mortality can be more easily recalibrated than one that includes both fatal and non-fatal CVD, an approach also used for SCORE.9 We also present risk scores for fatal plus non-fatal CVD for application in countries with high-quality data on total CVD incidence. We used event data as defined by each cohort’s event adjudication committee. Fatal CVD was defined as death from ischaemic heart disease or sudden cardiac death (ICD10 codes I20 to I25) or death from stroke (ICD10 codes I60 to I69); fatal plus non-fatal CVD was defined as fatal CVD or non-fatal myocardial infarction (ICD10 codes I21-I22) or stroke.
Statistical Analysis
We used Cox proportional hazards regression to estimate the coefficients of the risk scores. The models were stratified by cohort and sex because the age and sex patterns of CVD incidence and mortality may differ across populations, e.g., with events generally happening at younger ages in low- and middle-income countries than in high-income nations.23 Importantly, this formulation of the risk prediction equation, described in detail in the Appendix (pp 2-4), also allows recalibration of the risk equation for each age and sex group in any country by using age-and-sex-specific mean risk factor levels and age-and-sex-specific CVD death rates. Some of the cohorts have a very long follow-up time (e.g., > 50 years in the original Framingham cohort); after such a long time, baseline risk factor data may have little value in predicting CVD events. Therefore, we used data from a maximum follow-up of 15 years, after which we considered all participants administratively censored.
The risk factors in the model were systolic blood pressure, serum total cholesterol (TC), diabetes, and smoking (age and sex were included in the risk score as a part of event rate as described above and in the Appendix). We defined diabetes using fasting (FPG), casual (CPG), or postprandial plasma glucose (PPG), depending on the available data in each cohort (FPG ≥ 126, CPG ≥ 200, or 1-hour PPG ≥ 225 mg/dL24 plus those participants using insulin or oral hypoglycaemic medications). We used TC because it can be measured more easily and with less cost than HDL or LDL cholesterol, and is therefore measured more commonly in low- and middle-income countries.25 We considered the use of body mass index (BMI) in addition to the above risk factors but did not include it in the final model as it did not improve risk prediction. We allowed the coefficients of all risk factors to vary by age by including interaction terms because prospective studies have shown that CVD hazard ratios often decline with age.20, 26, 27 We also included interaction terms between sex and diabetes as well as sex and smoking because there is evidence of sex differences in the proportional effects of these risk factors on CVD.28, 29
Validation of the risk score
In our validation, we used Harrell’s C statistic,30 which measures the ability of the risk score to assign a higher risk to subjects with shorter time to event, a property known as discrimination. We also assessed the calibration of the risk score using the Hosmer-Lemeshow Chi-square test to compare the predicted number of events over 10 years of follow-up with the observed number of events (corrected for loss to follow-up using the Kaplan-Meier estimator) by deciles of risk. We validated the model in three different ways. First, we conducted internal validation in the pooled cohorts used for estimating the risk factor coefficient. Second, we iteratively withheld each one of the eight cohorts from the Cox model and used the other seven cohorts to estimate the coefficients; we then validated the obtained model against the withheld cohort. Finally, we validated the model against three cohorts that had not been used in the estimation: the Scottish Heart Health Extended Cohort (SHHEC), the Tehran Lipid and Glucose Study (TLGS), and the Australian Diabetes, Obesity and Lifestyle (AusDiab) study. Characteristics of these three cohorts are shown in the Appendix (page 7). The validation analysis was done for participants who were 40-80 years old at baseline.
Application of the risk score in national populations
We used the risk score to estimate the 10-year risk of fatal CVD in eleven countries with recent nationally representative health examination surveys in different world regions (China, Czech Republic, Denmark, England, Iran, Japan, Malawi, Mexico, South Korea, Spain, and the USA) (Appendix page 6). We first recalibrated the risk score for each country by replacing the age-and-sex-specific average risk factor levels from the cohorts with those observed in the country’s health examination survey, and replacing the age-sex-specific hazard of CVD with CVD death rates from WHO (Appendix page 8)31. The detailed recalibration procedure for country application is described in the Appendix (pp 2-4), and shown in Figure 2.
Figure 2. Procedure for recalibration and application of the (fatal) CVD risk score.

The figure shows the steps for applying the risk prediction equation for fatal CVD to individuals in different countries through recalibration. The figure uses the example of a 60-year-old man in the USA in 2011 with risk factor levels as shown in the figure. For recalibration of the fatal plus non-fatal CVD risk score, coefficients from the corresponding model in Table 1 and rates for total CVD events should be used.
We used the recalibrated risk scores to generate country-specific risk charts for the eight countries where the health examination surveys covered the full 40-84-years age range. We used the recalibrated risk scores and individual-level data from the health examination surveys to estimate the distributions of 10-year risk of fatal CVD in each country. For presentation purposes, we used risk groups of <3%, 3-6%, 7-9%, 10-14% and ≥15% that are nearly equivalent to <10%, 10-20%, 20-30%, 30-45% and ≥45% for fatal-plus-non-fatal CVD if one third of CVD events are fatal, as is in many high-income countries.32–34 If case-fatality is higher, e.g., in low-income countries with limited access to treatment, the fatal CVD cut-offs correspond to lower risks of fatal-plus-non-fatal CVD. Country results account for complex survey design by using sample weights if they were available.
All analyses were done with Stata 11.0. The study protocol was approved by the institutional review board at the Harvard School of Public Health (Boston, USA). The risk prediction tool will be available online at www.globorisk.org in 2015.
Role of the funding source
The sponsors of the study had no role in study design, data collection, data analysis, interpretation of the data, or in the writing of the report. KH, PU, MDC, BZ and GD had access to the data. The corresponding author had the final responsibility to submit for publication.
Results
After applying eligibility criteria, 50,129 participants were included in the estimation of the proportional hazards models (Figure 1). One-third of eligible participants were women, and the mean (SD) of age at baseline was 55 (9) years (Figure 1 and Appendix page 5). During 15 years of follow-up, 4,228 men (12.7% of participants) and 1,814 women (10.8%) had a first CVD event; of these 1,703 CVD events in men and 562 in women were fatal. Women had a lower risk of fatal CVD (10-year risk was 2.3% in women vs. 3.9% in men, p<0.0001). Smoking, diabetes, and higher blood pressure and cholesterol were associated with increased risk of fatal CVD as well as fatal plus non-fatal CVD. The magnitude of the association for all risk factors declined with age in both models (Table 1), and the associations of diabetes and smoking with CVD were stronger in women. The age and sex results are consistent with findings of previous pooled analyses of prospective cohorts.20, 26–29
Table 1. Coefficients and hazard ratios (HR) from the Cox proportional hazard model used to parameterize the risk scores for fatal CVD and fatal plus non-fatal CVD.
| Coefficient (logHR) | HR (95% CI) † | ||
|---|---|---|---|
| Main effect (SE) | Age interaction term (SE)* | ||
| Fatal CVD | |||
| Systolic blood pressure (per 10 mmHg) | 0.3412 (<0.001) | -0.0024 (0.002) | 1.20 (1.18-1.22) |
| Total cholesterol (per 1 mmol/L) | 0.5776 (<0.001) | -0.0063 (<0.001) | 1.18 (1.13-1.22) |
| Diabetes | 1.4557 (<0.001) | -0.0101 (0.048) | 2.21 (1.93-2.52) |
| Diabetes*female sex | 0.4430(<0.001) | - | 1.56 (1.22-1.99) |
| Smoking | 1.7657 (<0.001) | -0.0174 (0.001) | 1.85 (1.66-2.06) |
| Smoking*female sex | 0.2649 (0.034) | - | 1.30 (1.02-1.67) |
| Fatal plus non-fatal CVD | |||
| Systolic blood pressure (per 10 mmHg) | 0.1077 (0.004) | 0.0002 (0.668) | 1.13 (1.12-1.14) |
| Total cholesterol (per 1 mmol/L) | 0.5533 (<0.001) | -0.0059 (<0.001) | 1.19 (1.17-1.22) |
| Diabetes | 1.0721 (<0.001) | -0.0078 (0.029) | 1.77 (1.61-1.94) |
| Diabetes*female sex | 0.3902 (<0.001) | - | 1.48 (1.27-1.72) |
| Smoking | 2.0872 (<0.001) | -0.0250 (<0.001) | 1.63 (1.52-1.74) |
| Smoking*female sex | 0.3384 (<0.001) | - | 1.40 (1.23-1.60) |
We included an interaction term between age and all risk factors because the HRs for effects on CVD decline with age. 20, 26, 27 Therefore the HR at any age depends on the main and interaction terms.
The HRs for systolic blood pressure, total cholesterol, diabetes, and smoking are shown here at the median age of event, which is 66 years for fatal CVD and 64 years for fatal plus non-fatal CVD in the selected cohorts. HRs for diabetes and smoking are for men, and its interaction with sex shows the additional risk among women.
Validation of the risk score
Our fatal CVD risk score performed well in internal validation, with a C statistic of 71% (95% CI 70-73) and calibration Chi-square of 8.2 (p=0.51). Median C statistics was 73.5% with a range of 60-78% when data from different cohorts were held back and used for validation. Predicted and observed risks of fatal CVD were similar across different cohorts and deciles of risk (Figure 3), and the median Chi-square was 10.0 (p=0.35) with a range of 6.1 (p=0.73) to 24.7 (p=0.0034) across the eight cohorts (Appendix page 7). When applied in SHHEC, C statistics for the fatal CVD risk score was 74% (71-77) and calibration Chi-square 8.2 (p=0.52). The corresponding values for TLGS were 83% (79-86) and 9.0 (p=0.44); and for AusDiab, 84% (82-87) and 35.4 (0.0001). The poor calibration of AusDiab occurs predominantly in the highest decile of predicted risk (average observed risk of 13.1% and average predicted risk of 22.4%). Chi-square was 12.8 (p=0.12) when we excluded this category.
Figure 3. Observed and predicted 10-year risk of fatal CVD event in risk score validation, by cohort and deciles of risk.

Application of the risk score in national populations
At any age and risk factor level, the estimated 10-year risk of fatal CVD varied substantially across countries being lowest in Japan, South Korea, Spain, Denmark and England, and highest in China and Mexico for both sexes (as well as in Czech Republic and Iran for which risk charts are not shown because their surveys only included participants aged ≤ 65 years) (Figure 4). For example, a non-smoking 65 year-old man with diabetes and a SBP of 140 mmHg and a TC of 6 mmol/L would have an estimated 10-year risk of fatal CVD of 5% in Japan vs. 24% in China; the corresponding risks would be 9% and 36% if he smoked. Similarly, the 10-year risk of fatal CVD for a 65 year-old woman with the same risk factor profile would be 3% in Japan and Spain versus 33% in China if she does not smoke; and 6% versus 58% if she smoked.
Figure 4. Country risk charts for 10-year risk of fatal CVD.
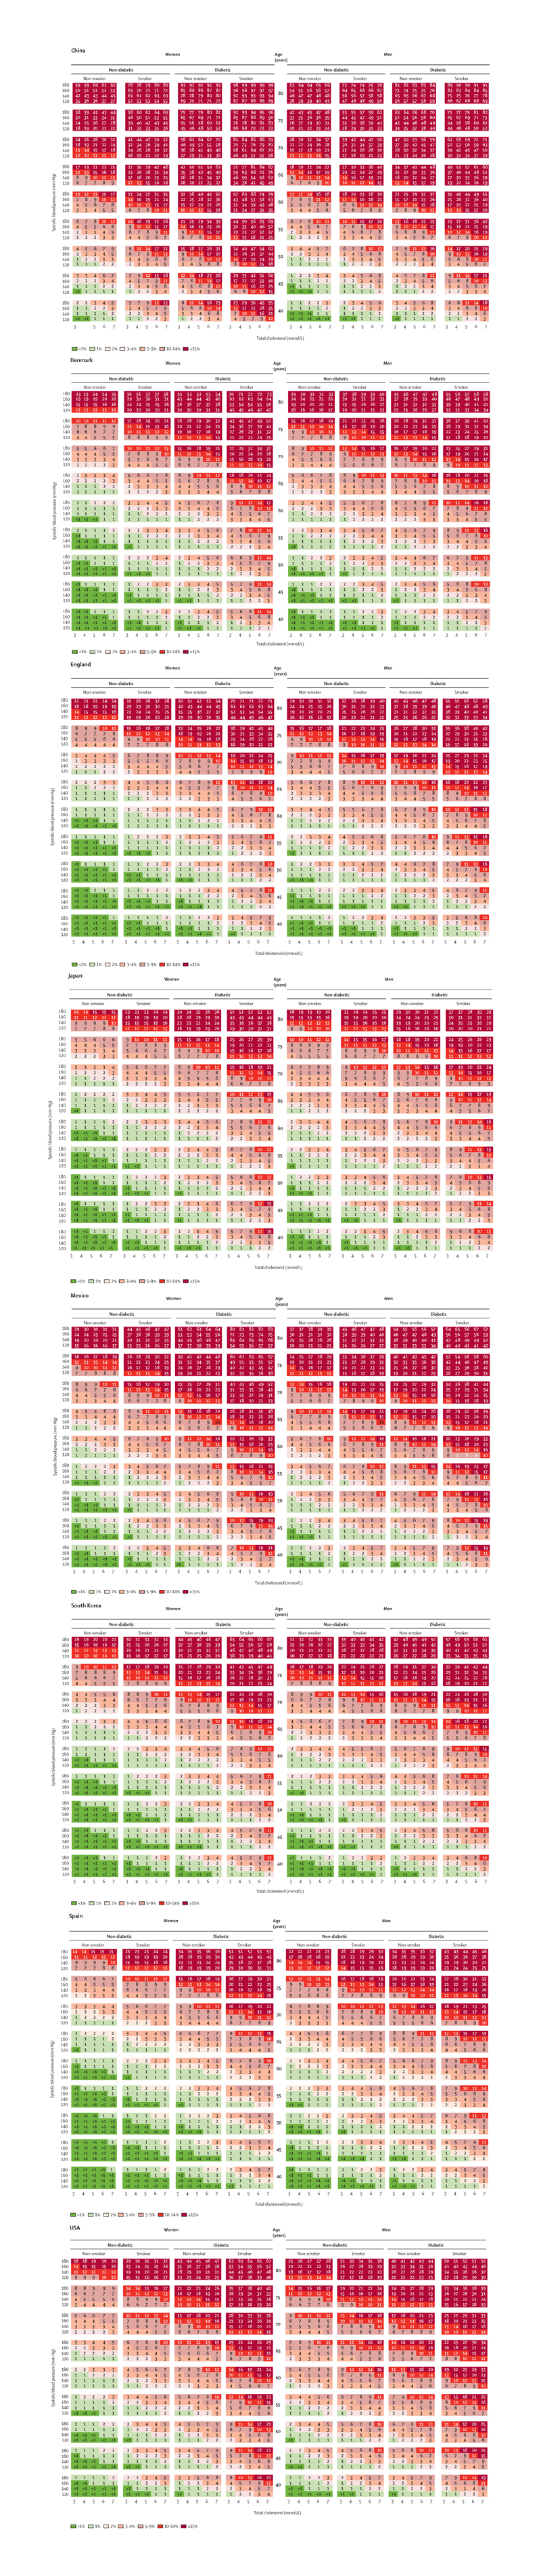
* To establish a person’s risk, first the column representing the person’s sex, smoking, and diabetes status should be found. Then the cell representing the person’s age, total cholesterol and systolic blood pressure levels should be located.
Total (fatal or non-fatal) 10-year CVD risk would be higher than those seen in the figure by the ratio of total-to-fatal CVD event rates. For example, total risk for a person aged 60 years old and living in a high-income country, where about a third of all CVD events are fatal, would be three times higher. Total-to-fatal CVD ratio tends to go down with age, i.e. more fatal CVD events in older ages.32,35–37 Total-to-fatal CVD ratio is likely lower in low- and middle-income countries where more CVD events are fatal due to lower healthcare and treatment access, and may be closer to 2.
Risk charts are not shown for Czech Republic, Iran, and Malawi because their health examination surveys did not include older participants.
We found substantial differences in fatal CVD risk distributions across countries (Figure 5). In South Korea, 77% of men aged 40-84 years had a predicted 10-year risk of fatal CVD of <3%, and only 7% had a predicted risk of ≥10%. South Korea was followed by Spain (67% with <3% fatal CVD risk, and 9% with ≥10% risk) and Denmark (62% and 10%) in terms of having a large proportion of men in low-risk groups. The same three countries also had the largest proportions of women in the low-risk group: South Korea had 82% with <3% fatal CVD risk and 7% with ≥10% risk; Spain had 80% and 6%; and Denmark had 79% and 5%. More people in Japan were in the medium-high risk groups than in these three countries, because Japan has an older population. A larger proportion of men and women in the USA were at ≥10% risk of fatal CVD than those of Denmark, South Korea, and Spain; in fact, the prevalence of high-risk women in the USA (11%) and England (10%) were more similar to Mexico (11%) than to other high-income countries. At the other extreme, the proportion of people at high risk of fatal CVD was largest in China, where 33% of men and 28% of women had a predicted 10-year risk of ≥10%. These proportions translate to nearly170 million Chinese men and women between 40 and 84 years of age who are at high risk of fatal CVD. China was followed by Mexico (16% for men and 11% for women).
Figure 5. Distributions of 10-year risks of fatal CVD by country, sex, and age group.

Results for Czech Republic, Iran, and Malawi are shown only for 40-64 years of age because older individuals were not enrolled in the national health examination surveys.
When we separately analysed the risk distributions for people <65 years and those ≥65 years of age (which allowed the inclusion of three additional countries with data only available for individual <65 years of age) the prevalence of high fatal CVD risk was consistently highest in low- and middle-income countries and in the Czech Republic (Figure 5). More than 90% of the 65-84 year old Chinese men and women had a 10-year fatal CVD risk ≥10%; over 80% of men and 70% of Chinese women had a ≥15% risk. In contrast, the proportion of older Japanese with 10-year fatal CVD risk ≥10% was 28% for men and 17% for women, and in Spain, the proportions were 29% for men and 17% for women.
Discussion
We analysed pooled data from prospective cohorts to develop a CVD risk prediction equation which can be recalibrated and updated for use in different countries and years using routinely available information. Our risk score, and the risk charts that can be generated from it, have clinical as well as public health applications, for identifying individual patients who are at high risk of CVD and thus need treatment, and for estimating the number of such people in the country which is needed to measure progress towards the global NCD treatment goal. In addition to the risk score and risk charts, our results suggested a substantially higher prevalence of people at high CVD risk (e.g., ≥ 10% 10-year risk of fatal CVD) in low- and middle-income countries compared with high-income countries. Our findings are supported by the recent report from the Prospective Urban and Rural Epidemiological study showing that at any level of risk factor exposure the rates of major CVD events were higher in low- and middle-income countries than in high income countries.38
Methodologically, our risk score is consistent with the derivations and recalibrations of the Framingham risk score, SCORE and the American College of Cardiology/American Heart Association Pooled Cohort Risk Equations,11–18, 39 including the use of fatal CVD in SCORE to allow recalibration in different countries (panel). Nonetheless, we also developed a risk score for fatal-plus-non-fatal CVD, for use in countries with data on CVD incidence. Our reformulation of the risk model to include age- and sex-specific death rates, while epidemiologically well-established 40 allows taking into account the fact that the age and sex patterns of CVD vary across countries and over time. Our risk score also overcomes the methodological limitation of the current WHO risk charts,3 whose coefficients are based on separate analyses of individual risk factors versus using coefficients that are estimated in a regression model that includes all the risk factors together.41 Other strengths of our study are the use of multiple high-quality prospective cohorts; good performance in external validation; and application to individual-level nationally representative data from countries in different world regions to estimate the prevalence of high-risk individuals, as opposed to summary statistics used in a previous global analysis.3 The use of individual-level data accounts for the fact that the correlations among risk factors vary across countries and time.42
Our study also has some limitations. First, although using multiple cohorts is an improvement compared to a single cohort in some other risk prediction equations, our cohorts were all from the USA. Nonetheless these cohorts included diverse ethnic groups. Further, there is abundant evidence from multi-country studies that the proportional effects of cardiovascular risk factors are similar across Western and Asian populations.20–22 It would be ideal to replicate our analysis with a larger number of cohorts, including cohorts from different world regions, to re-confirm this similarity. Second, although we developed risk scores for both fatal CVD and for fatal-plus-non-fatal CVD, our country applications necessarily had to estimate the risk of fatal CVD because for most countries CVD incidence rates are not available. This shortage of data on non-fatal CVD demonstrates the need for monitoring CVD incidence, for example through data linkage or through sentinel sites, as has been done for cancer registries. Third, in addition to people with hazardous risk factor profiles, CVD risk is also high in people who have had a previous cardiovascular event, e.g., a prior coronary event or stroke. There is a need to have information on individual patients with such disease histories and on their prevalence in the population. For example, 9% of American men and 7% of American women in the 2011-2012 NHANES survey had a history of CHD or stroke. Fourth, although WHO uses demographic and epidemiological methods to make valid and comparable estimates of death rates by underlying cause31, there is potential for inconsistent or incomparable assignment of underlying cause of death at the time of certification. Further, in countries without vital registration, CVD death rates are necessarily estimated using partial information and demographic and epidemiological methods. Finally, lifetime risk can be an alternative relevant measure of risk for young individuals who may be assigned a low 10-year risk of CVD despite having elevated risk factors.46
Randomized trials have established the benefits of risk factor treatment in people with high absolute disease risk, leading to multidrug therapy as a corner stone of CVD prevention, and included in clinical guidelines in many countries. With many antihypertensive drugs and some statins becoming off-patent and available at relatively low cost, these treatments are considered essential medicines for NCD prevention worldwide.47 Yet, access to these treatments remains low in low- and middle-income countries.48 The obstacles to large scale risk-based prevention are both technical, i.e., a lack of guidelines for risk estimation and treatment, as well as those related to health systems including financial, infrastructure and health personnel barriers to primary care access. Our risk prediction equation helps overcome the technical barrier for global application of risk stratification and will engender a debate about health systems needs by allowing the calculation of the coverage of risk-based treatment in different countries.
Supplementary Material
Panel. Research in context.
Systematic review
We assessed risk scores for cardiovascular diseases reported in a recent overview article43 and a systematic review of 102 models from 84 studies published between January 1, 1999 and February 24, 2009.44 We then searched Pubmed for articles published between February 25, 2009 and September 10 2014 using combinations of the terms “risk score” or “risk scores” or “risk prediction” and “cardiovascular disease”, “coronary heart disease” or “stroke” in the publication title. We identified studies published in English that developed a risk score for a healthy adult population free from cardiovascular disease at baseline; the study outcome was fatal or non-fatal coronary heart disease or stroke; and a risk score model was developed and validated in the population. We also searched the reference lists of the identified studies.
We reviewed the identified articles and assessed the generalizability of the risk scores across populations. A large number of the reviewed articles aimed at improving prediction by adding new risk factor(s) to the model; recalibrating a risk score for validation in a new population; or developing a new risk score for a specific population. A few risk scores were devised for use across different populations. The SCORE model predicts risk of death from cardiovascular diseases and provides separate risk scores for higher risk and lower risk countries of Europe.9 The American College of Cardiology/American Heart Association Pooled Cohort Risk Equations provide race-and sex-specific risk scores for the US.39 The World Health Organization has developed risk charts for each specific WHO subregion, although cardiovascular risk patterns may differ between countries within the same subregion and the coefficients for the risk factors in the model were not derived from the same regression model or even the same set of epidemiological studies.3 Finally, the INTERHEART Modifiable Risk score was developed from a multi-country case-control study of myocardial infraction, in contrast to other models that are based on prospective cohorts.45
Interpretation
We have developed a novel risk score for cardiovascular disease which can be recalibrated and updated for use in different countries and years using routinely available information. The risk equation was specified such that the effects of sex and age on cardiovascular risk are allowed to vary across countries and performed well in external validation. When the risk score was recalibrated and applied to a number of example countries, low- and middle income countries had a higher prevalence of people with high 10 year risk of fatal cardiovascular disease compared to high income countries. Our prediction equation can be used as a unified risk score across countries.
Acknowledgements
Data for prospective cohorts were obtained from the National Heart Lung and Blood Institute (NHLBI) Biologic Specimen and Data Repository Information Coordinating Center. This study does not necessarily reflect the opinions or views of the cohorts used in the analysis, or the NHLBI. This research also uses data from China Health and Nutrition Survey (CHNS). We thank the National Institute of Nutrition and Food Safety, China Center for Disease Control and Prevention, Carolina Population Center (5 R24 HD050924), the University of North Carolina at Chapel Hill, the NIH (R01-HD30880, DK056350, R24 HD050924, and R01-HD38700) and the Fogarty International Center, NIH for financial support for the CHNS data collection and analysis files from 1989 to 2011 and future surveys, and the China-Japan Friendship Hospital, Ministry of Health for support for CHNS 2009. Access to individual records of the National Health and Nutrition Survey was obtained under the Grant-in-Aid for Scientific Research from the Japan Society for the Promotion of Science (grant number: 24590785). We thank Pablo Perel and Rod Jackson for comments on an earlier version of the manuscript.
Funding
US National Institutes of Health (NIDDK: 1R01-DK090435), UK Medical Research Council, Wellcome Trust
Footnotes
Contributions
GD, ME, and MW conceived the study. AA, CAAS, FA, RC, MD, LE, FF, NI, DK, YHK, VL, LLM, DM, KPM, KO, FRA, RRM, JES, GS, JT, BZ collected and managed risk factor survey or external cohort data. KH, PU, and YL analysed cohort and survey data and prepared results. KH, PU, ME, and GD wrote the manuscript with input from all other co-authors. GD and ME oversaw the research. GD is the study guarantor.
Conflict of interest
Authors declare no conflicts of interest.
References
- 1.Jackson R, Lawes CM, Bennett DA, Milne RJ, Rodgers A. Treatment with drugs to lower blood pressure and blood cholesterol based on an individual’s absolute cardiovascular risk. Lancet. 2005;365(9457):434–41. doi: 10.1016/S0140-6736(05)17833-7. [DOI] [PubMed] [Google Scholar]
- 2.Joint British Societies’ consensus recommendations for the prevention of cardiovascular disease (JBS3) Heart. 2014;100(Suppl 2):ii1–ii67. doi: 10.1136/heartjnl-2014-305693. [DOI] [PubMed] [Google Scholar]
- 3.World Health Organization. Prevention of cardiovascular disease: guidelines for assessment and management of cardiovascular risk. Geneva: 2007. [Google Scholar]
- 4.Stone NJ, Robinson J, Lichtenstein AH, Bairey Merz CN, Lloyd-Jones DM, Blum CB, et al. 2013 ACC/AHA Guideline on the Treatment of Blood Cholesterol to Reduce Atherosclerotic Cardiovascular Risk in Adults: A Report of the American College of Cardiology/American Heart Association Task Force on Practice Guidelines. J Am Coll Cardiol. 2013 doi: 10.1016/j.jacc.2013.11.002. [DOI] [PubMed] [Google Scholar]
- 5.National Institute for Health and Care Excellence. Lipid modification: cardiovascular risk assessment and the modification of blood lipids for the primary and secondary prevention of cardiovascular disease. London: 2014. [PubMed] [Google Scholar]
- 6.Lim SS, Gaziano TA, Gakidou E, Reddy KS, Farzadfar F, Lozano R, et al. Prevention of cardiovascular disease in high-risk individuals in low-income and middle-income countries: health effects and costs. Lancet. 2007;370(9604):2054–62. doi: 10.1016/S0140-6736(07)61699-7. [DOI] [PubMed] [Google Scholar]
- 7.World Health Organization. Global action plan for the prevention and control of noncommunicable diseases 2013-2020. Geneva: 2013. [Google Scholar]
- 8.D’Agostino RB, Grundy S, Sullivan LM, Wilson P. Validation of the Framingham coronary heart disease prediction scores: results of a multiple ethnic groups investigation. JAMA. 2001;286(2):180–7. doi: 10.1001/jama.286.2.180. [DOI] [PubMed] [Google Scholar]
- 9.Conroy RM, Pyorala K, Fitzgerald AP, Sans S, Menotti A, De Backer G, et al. Estimation of ten-year risk of fatal cardiovascular disease in Europe: the SCORE project. Eur Heart J. 2003;24(11):987–1003. doi: 10.1016/s0195-668x(03)00114-3. [DOI] [PubMed] [Google Scholar]
- 10.Cook NR, Paynter NP, Eaton CB, Manson JE, Martin LW, Robinson JG, et al. Comparison of the Framingham and Reynolds Risk scores for global cardiovascular risk prediction in the multiethnic Women’s Health Initiative. Circulation. 2012;125(14):1748–56. doi: 10.1161/CIRCULATIONAHA.111.075929. S1-11. [DOI] [PMC free article] [PubMed] [Google Scholar]
- 11.Neuhauser HK, Ellert U, Kurth BM. A comparison of Framingham and SCORE-based cardiovascular risk estimates in participants of the German National Health Interview and Examination Survey 1998. Eur J Cardiovasc Prev Rehabil. 2005;12(5):442–50. doi: 10.1097/01.hjr.0000183909.52118.9f. [DOI] [PubMed] [Google Scholar]
- 12.Liu J, Hong Y, D’Agostino RB, Wu Z, Wang W, Sun J, et al. Predictive value for the Chinese population of the Framingham CHD risk assessment tool compared with the Chinese Multi-Provincial Cohort Study. JAMA. 2004;291(21):2591–9. doi: 10.1001/jama.291.21.2591. [DOI] [PubMed] [Google Scholar]
- 13.Khalili D, Hadaegh F, Soori H, Steyerberg EW, Bozorgmanesh M, Azizi F. Clinical usefulness of the Framingham cardiovascular risk profile beyond its statistical performance: the Tehran Lipid and Glucose Study. Am J Epidemiol. 2012;176(3):177–86. doi: 10.1093/aje/kws204. [DOI] [PubMed] [Google Scholar]
- 14.Wu Y, Liu X, Li X, Li Y, Zhao L, Chen Z, et al. Estimation of 10-year risk of fatal and nonfatal ischemic cardiovascular diseases in Chinese adults. Circulation. 2006;114(21):2217–25. doi: 10.1161/CIRCULATIONAHA.105.607499. [DOI] [PubMed] [Google Scholar]
- 15.Suka M, Sugimori H, Yoshida K. Application of the updated Framingham risk score to Japanese men. Hypertens Res. 2001;24(6):685–9. doi: 10.1291/hypres.24.685. [DOI] [PubMed] [Google Scholar]
- 16.Bhopal R, Fischbacher C, Vartiainen E, Unwin N, White M, Alberti G. Predicted and observed cardiovascular disease in South Asians: application of FINRISK, Framingham and SCORE models to Newcastle Heart Project data. J Public Health (Oxf) 2005;27(1):93–100. doi: 10.1093/pubmed/fdh202. [DOI] [PubMed] [Google Scholar]
- 17.Sans S, Fitzgerald AP, Royo D, Conroy R, Graham I. Calibrating the SCORE Cardiovascular Risk Chart for Use in Spain. Rev Esp Cardiol (Engl Ed) 2007;60(5):476–85. [PubMed] [Google Scholar]
- 18.Simmonds MC, Wald NJ. Risk estimation versus screening performance: a comparison of six risk algorithms for cardiovascular disease. Journal of medical screening. 2012;19(4):201–5. doi: 10.1258/jms.2012.012076. [DOI] [PubMed] [Google Scholar]
- 19.Mendis S, Lindholm LH, Mancia G, Whitworth J, Alderman M, Lim S, et al. World Health Organization (WHO) and International Society of Hypertension (ISH) risk prediction charts: assessment of cardiovascular risk for prevention and control of cardiovascular disease in low and middle-income countries. J Hypertens. 2007;25(8):1578–82. doi: 10.1097/HJH.0b013e3282861fd3. [DOI] [PubMed] [Google Scholar]
- 20.Singh GM, Danaei G, Farzadfar F, Stevens GA, Woodward M, Wormser D, et al. The age-specific quantitative effects of metabolic risk factors on cardiovascular diseases and diabetes: a pooled analysis. PLoS One. 2013;8(7):e65174. doi: 10.1371/journal.pone.0065174. [DOI] [PMC free article] [PubMed] [Google Scholar]
- 21.Woodward M, Huxley H, Lam TH, Barzi F, Lawes CM, Ueshima H. A comparison of the associations between risk factors and cardiovascular disease in Asia and Australasia. EurJ CardiovascPrevRehabil. 2005;12(5):484–91. doi: 10.1097/01.hjr.0000170264.84820.8e. [DOI] [PubMed] [Google Scholar]
- 22.Yusuf S, Hawken S, Ounpuu S, Dans T, Avezum A, Lanas F, et al. Effect of potentially modifiable risk factors associated with myocardial infarction in 52 countries (the INTERHEART study): case-control study. Lancet. 2004;364(9438):937–52. doi: 10.1016/S0140-6736(04)17018-9. [DOI] [PubMed] [Google Scholar]
- 23.Moran AE, Forouzanfar MH, Roth GA, Mensah GA, Ezzati M, Flaxman A, et al. The global burden of ischemic heart disease in 1990 and 2010: the global burden of disease 2010 study. Circulation. 2014;129(14):1493–501. doi: 10.1161/CIRCULATIONAHA.113.004046. [DOI] [PMC free article] [PubMed] [Google Scholar]
- 24.Yano K, Kagan A, McGee D, Rhoads GG. Glucose intolerance and nine-year mortality in Japanese men in Hawaii. Am J Med. 1982;72(1):71–80. doi: 10.1016/0002-9343(82)90580-0. [DOI] [PubMed] [Google Scholar]
- 25.Farzadfar F, Finucane MM, Danaei G, Pelizzari PM, Cowan MJ, Paciorek CJ, et al. National, regional, and global trends in serum total cholesterol since 1980: systematic analysis of health examination surveys and epidemiological studies with 321 country-years and 3.0 million participants. Lancet. 2011;377(9765):578–86. doi: 10.1016/S0140-6736(10)62038-7. [DOI] [PubMed] [Google Scholar]
- 26.Lewington S, Whitlock G, Clarke R, Sherliker P, Emberson J, Halsey J, et al. Blood cholesterol and vascular mortality by age, sex, and blood pressure: a meta-analysis of individual data from 61 prospective studies with 55,000 vascular deaths. Lancet. 2007;370(9602):1829–39. doi: 10.1016/S0140-6736(07)61778-4. [DOI] [PubMed] [Google Scholar]
- 27.Lawes CM, Bennett DA, Parag V, Woodward M, Whitlock G, Lam TH, et al. Blood pressure indices and cardiovascular disease in the Asia Pacific region: a pooled analysis. Hypertension. 2003;42(1):69–75. doi: 10.1161/01.HYP.0000075083.04415.4B. [DOI] [PubMed] [Google Scholar]
- 28.Peters SA, Huxley RR, Woodward M. Diabetes as a risk factor for stroke in women compared with men: a systematic review and meta-analysis of 64 cohorts, including 775,385 individuals and 12,539 strokes. Lancet. 2014;383(9933):1973–80. doi: 10.1016/S0140-6736(14)60040-4. [DOI] [PubMed] [Google Scholar]
- 29.Huxley RR, Woodward M. Cigarette smoking as a risk factor for coronary heart disease in women compared with men: a systematic review and meta-analysis of prospective cohort studies. Lancet. 2011;378(9799):1297–305. doi: 10.1016/S0140-6736(11)60781-2. [DOI] [PubMed] [Google Scholar]
- 30.Harrell FE, Jr., Lee KL, Mark DB. Multivariable prognostic models: issues in developing models, evaluating assumptions and adequacy, and measuring and reducing errors. Statistics in medicine. 1996;15(4):361–87. doi: 10.1002/(SICI)1097-0258(19960229)15:4<361::AID-SIM168>3.0.CO;2-4. [DOI] [PubMed] [Google Scholar]
- 31.World Health Organization. WHO methods and data sources for global causes of death 2000-2011. Geneva: 2013. [Google Scholar]
- 32.Smolina K, Wright FL, Rayner M, Goldacre MJ. Incidence and 30-day case fatality for acute myocardial infarction in England in 2010: national-linked database study. Eur J Public Health. 2012;22(6):848–53. doi: 10.1093/eurpub/ckr196. [DOI] [PMC free article] [PubMed] [Google Scholar]
- 33.Degano IR, Elosua R, Marrugat J. Epidemiology of acute coronary syndromes in Spain: estimation of the number of cases and trends from 2005 to 2049. Rev Esp Cardiol. 2013;66(6):472–81. doi: 10.1016/j.rec.2013.01.018. [DOI] [PubMed] [Google Scholar]
- 34.Feigin VL, Lawes CM, Bennett DA, Barker-Collo SL, Parag V. Worldwide stroke incidence and early case fatality reported in 56 population-based studies: a systematic review. Lancet neurology. 2009;8(4):355–69. doi: 10.1016/S1474-4422(09)70025-0. [DOI] [PubMed] [Google Scholar]
- 35.Mathers C, Truelsen T, Begg S, Satoh T. Global burden of ischaemic heart disease in the year 2000. Global Burden of Disease 2000. 2004 [Google Scholar]
- 36.Hammar N, Alfredsson L, Rosen M, Spetz CL, Kahan T, Ysberg AS. A national record linkage to study acute myocardial infarction incidence and case fatality in Sweden. International journal of epidemiology. 2001;30(Suppl 1):S30–4. doi: 10.1093/ije/30.suppl_1.s30. [DOI] [PubMed] [Google Scholar]
- 37.Krumholz HM, Normand SL, Wang Y. Trends in hospitalizations and outcomes for acute cardiovascular disease and stroke, 1999-2011. Circulation. 2014;130(12):966–75. doi: 10.1161/CIRCULATIONAHA.113.007787. [DOI] [PMC free article] [PubMed] [Google Scholar]
- 38.Yusuf S, Rangarajan S, Teo K, Islam S, Li W, Liu L, et al. Cardiovascular risk and events in 17 low-, middle-, and high-income countries. N Engl J Med. 2014;371(9):818–27. doi: 10.1056/NEJMoa1311890. [DOI] [PubMed] [Google Scholar]
- 39.Goff DC, Jr., Lloyd-Jones DM, Bennett G, Coady S, D’Agostino RB, Gibbons R, et al. 2013 ACC/AHA guideline on the assessment of cardiovascular risk: a report of the American College of Cardiology/American Heart Association Task Force on Practice Guidelines. Circulation. 2014;129(25 Suppl 2):S49–73. doi: 10.1161/01.cir.0000437741.48606.98. [DOI] [PubMed] [Google Scholar]
- 40.Fibrinogen Studies Collaboration. Measures to assess the prognostic ability of the stratified Cox proportional hazards model. Stat Med. 2009;28(3):389–411. doi: 10.1002/sim.3378. [DOI] [PubMed] [Google Scholar]
- 41.Ezzati M, Lopez AD, Rodgers A, Murray CJL. Comparative Quantification of Health Risks: Global and Regional Burden of Diseases Attributable to Selected Major Risk Factors. World Health Organization; Geneva: 2004. [Google Scholar]
- 42.Gregg EW, Cheng YJ, Cadwell BL, Imperatore G, Williams DE, Flegal KM, et al. Secular trends in cardiovascular disease risk factors according to body mass index in US adults. JAMA. 2005;293(15):1868–74. doi: 10.1001/jama.293.15.1868. [DOI] [PubMed] [Google Scholar]
- 43.Cooney MT, Dudina A, D’Agostino R, Graham IM. Cardiovascular risk-estimation systems in primary prevention: do they differ? Do they make a difference? Can we see the future? Circulation. 2010;122(3):300–10. doi: 10.1161/CIRCULATIONAHA.109.852756. [DOI] [PubMed] [Google Scholar]
- 44.Matheny M, McPheeters ML, Glasser A, Mercaldo N, Weaver RB, Jerome RN, et al. Systematic Review of Cardiovascular Disease Risk Assessment Tools. Rockville (MD): 2011. [PubMed] [Google Scholar]
- 45.McGorrian C, Yusuf S, Islam S, Jung H, Rangarajan S, Avezum A, et al. Estimating modifiable coronary heart disease risk in multiple regions of the world: the INTERHEART Modifiable Risk Score. Eur Heart J. 2011;32(5):581–9. doi: 10.1093/eurheartj/ehq448. [DOI] [PubMed] [Google Scholar]
- 46.Berry JD, Dyer A, Cai X, Garside DB, Ning H, Thomas A, et al. Lifetime risks of cardiovascular disease. N Engl J Med. 2012;366(4):321–9. doi: 10.1056/NEJMoa1012848. [DOI] [PMC free article] [PubMed] [Google Scholar]
- 47.Hogerzeil HV, Liberman J, Wirtz VJ, Kishore SP, Selvaraj S, Kiddell-Monroe R, et al. Promotion of access to essential medicines for non-communicable diseases: practical implications of the UN political declaration. Lancet. 2013;381(9867):680–9. doi: 10.1016/S0140-6736(12)62128-X. [DOI] [PubMed] [Google Scholar]
- 48.Yusuf S, Islam S, Chow CK, Rangarajan S, Dagenais G, Diaz R, et al. Use of secondary prevention drugs for cardiovascular disease in the community in high-income, middle-income, and low-income countries (the PURE Study): a prospective epidemiological survey. Lancet. 2011;378(9798):1231–43. doi: 10.1016/S0140-6736(11)61215-4. [DOI] [PubMed] [Google Scholar]
Associated Data
This section collects any data citations, data availability statements, or supplementary materials included in this article.