Abstract
Adaptor protein (AP) complexes are evolutionarily conserved vesicle transport regulators that recruit coat proteins, membrane cargos and coated vesicle accessory proteins. Since in plants endocytic and post-Golgi trafficking intersect at the trans-Golgi network, unique mechanisms for sorting cargos of overlapping vesicular routes are anticipated. The plant AP complexes are part of the sorting machinery, but despite some functional information, their cargoes, accessory proteins, and regulation remain largely unknown. Here, by means of various proteomics approaches, we generated the overall interactome of the five AP and the TPLATE complexes in Arabidopsis thaliana. The interactome converged on a number of hub proteins, including the thus far unknown adaptin binding-like protein, designated P34. P34 interacted with the clathrin-associated AP complexes, controlled their stability and, subsequently, influenced clathrin-mediated endocytosis and various post-Golgi trafficking routes. Altogether, the AP interactome network offers substantial resources for further discoveries of unknown endomembrane trafficking regulators in plant cells.
The transport of integral membrane proteins from one compartment to another subcellular destination within the endomembrane system is essential for all living eukaryotic cells. This transport is mostly mediated by coated vesicles that are formed by the recruitment of coat proteins onto a particular membrane compartment where they bind adaptors, and other accessory molecules to promote membrane curvature and collect the vesicle cargo1. Critical for this process is the fine-tuned control of intracellular cargo sorting, which relies on signals within the cargo proteins and on the specific adaptor proteins (AP) complexes-mediated cargo recognition. Five AP complexes, designated AP-1 to AP-5, each involved in a distinct vesicle trafficking pathway have been identified in higher eukaryotes2. The five AP complexes are heterotetrameric proteins that contain two large subunits (β1 to β5 and γ, α, δ, ε, ζ), a medium subunit (μ1 to μ5) and a small subunit (σ1 to σ5)3. Whereas in mammalian cells, AP-1, AP-2 and AP-3 operate in concert with the scoffing molecule clathrin to generate clathrin-coated vesicles (CCVs), AP-4 and AP-5 function independently of clathrin3.
In plant cells, the major membrane trafficking, including secretory, endocytic and vacuolar pathways intersect at the trans-Golgi network (TGN)/early endosome (EE)4. Over the last decade, some functions of AP-1 to AP-4 have been characterized in the model plant Arabidopsis thaliana5. Although, sequence-based homology searches have predicted a partial AP-5 in plant genomes2, the AP-5 function and composition remain undetermined6. Plant AP-1 associates with TGN/EE and transports cargos to the plasma membrane (PM), cell plates or vacuoles, and loss of the AP-1 function leads to impeded growth, cytokinesis defects, and male and female sterility7–10. Plant AP-2 facilitates clathrin-mediated endocytosis (CME) of various PM proteins, such as the PIN-FORMED11 proteins, BR INSENSITIVE1 (BRI1)12,13 receptor and the boron transporter REQUIRES HIGH BORON1 (BOR1)14, and is important for reproductive organ development15,16. AP-3 enables the vacuolar targeting of the SUCROSE TRANSPORTER4 (SUC4) and the R-SNARE subfamily members VAMP713, and loss of AP-3 function reduces germination and affects gravitropic responses17–20. AP-4 mediates vacuolar protein sorting and the recruitment of the ENTH domain protein, MODIFIED TRANSPORT TO THE VACUOLE1 (MTV1) at the TGN/EE, and AP-4 deficiency causes growth defects and abolishes hypersensitive cell death upon infection with avirulent bacteria21–24. Alongside AP-2, an ancient heterooctameric adaptor complex, designated the TPLATE complex (TPC), also is required for CME at PM in plant cells25,26. Knockout of single subunits of TPC caused male sterility, whereas silencing triggered seedling lethality25,27 and abolished the endocytic flux, as also observed upon conditional inactivation of the complex28.
In addition to the coat proteins and the tetrameric AP complexes, CME in mammalian and yeast cells requires the activity of more than 60 endocytic accessory proteins (EAPs) that function as scaffolds, cargo recruiters, membrane curvature generators and sensors, as well as CME regulators29,30. Such EAPs have been found either by comparative proteomics of CCVs31,32 or by affinity purification coupled to mass spectrometry (AP-MS) as binding partners of the C-terminal appendages or EAR domains of the large subunits of AP complexes33,34. Although, some EAPs have been identified based on sequence homology4,6 and recently by proteomic analysis of Arabidopsis CCVs35, their involvement in vesicle formation in plant cells remains largely uncharacterized.
Here, using AP-MS and proximity labelling (PL) coupled to MS (PL-MS), we generated a comprehensive interactome of the six adaptor protein complexes in Arabidopsis, thereby providing informative resources and links between vesicle transports and their regulators. We identified the AP-5 complex and its associated core subunits, spatacsin (SPG11) and spastizin (SPG15 also known as ZFYVE26), in Arabidopsis cells. The interactomes of the clathrin-associated AP complexes in Arabidopsis, AP-1, AP-2 and AP-435, converged on several hub proteins, of which the adaptin binding-like protein, designated P34, was functionally characterized. The P34 gene is essential for Arabidopsis because a loss-of-function mutation led to embryogenesis defects. We showed that P34 controls the stability of the AP-1, AP-2 and AP-4, but not of AP-3 and as such, influences CME and various post-Golgi trafficking routes.
Results
The AP interactome reveals two interconnected networks
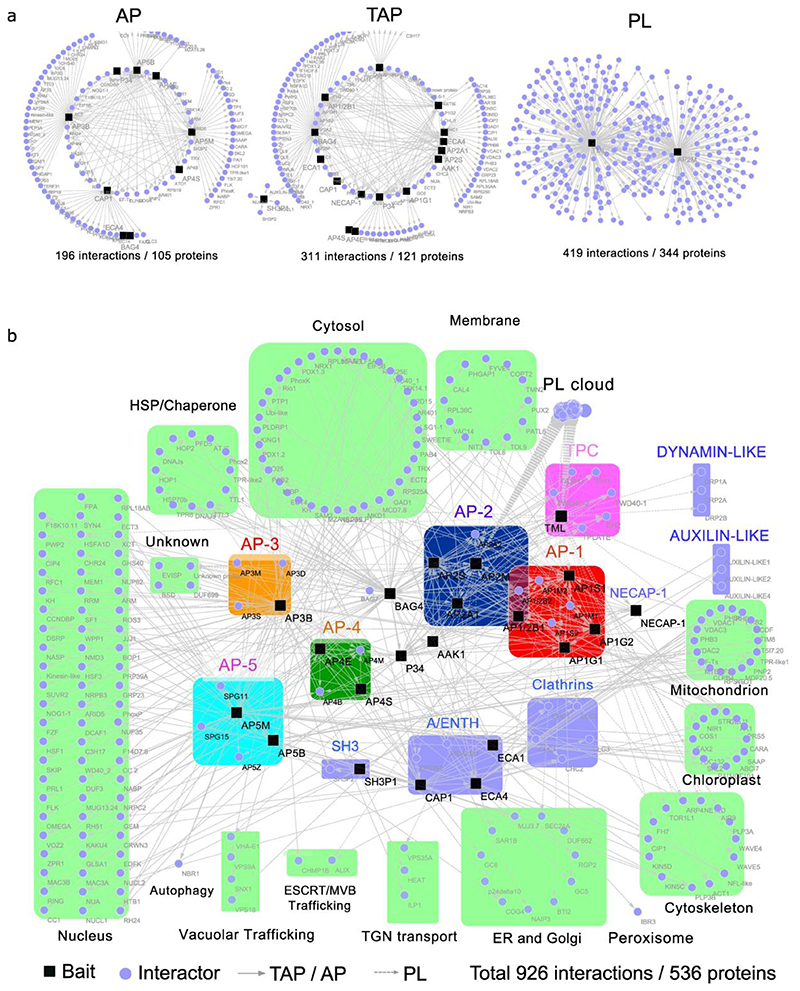
To gain further insight into the function of the five AP complexes and TPC in plants, we performed a targeted interaction screen in Arabidopsis cell suspension cultures (PSB-D). Hereto, we applied a series of tandem affinity purification (TAP), single-step AP-MS and PL-MS experiments (see Methods for more details). Previously, those interactome analyses were successfully used for the identification of the core AP-2 and TPC in Arabidopsis12,25,36. Upon integrating all interactome analyses including further network extension through a selection of reciprocal (T)AP-MS experiments (see below), we generated a comprehensive network of 926 interactions among 536 proteins (Fig. 1 and Supplementary Table 1).
Fig. 1. Integrative interaction network of six multimeric adaptor complexes and their accessory proteins.
a, Thirteen proteins (AP1G1, AP1G2, AP1S1, AP2A1, AP2B1, AP2S, BAG4, P34, AAK1, NECAP-1, AtECA1, AtECA4 and SH3P1) were used as baits for TAP-MS, six proteins (AP3B, AP4E, AP4S, AP5B, AP5M and CAP1) for AP-MS, and two proteins (AP2M and TML) for PL-MS. b, Visualization of the protein interactions. Rounded rectangles in different colours represent the components of different complexes, including AP-1 (red), AP-2 (blue), AP-3 (orange), AP-4 (green), AP-5 (cyan), TPC (magenta) and other accessory proteins (light purple). The PL cloud indicates a group of proteins identified by PL-MS without direct link to vesicle trafficking. The proteins copurified with the baits are annotated by their known or predicted subcellular localizations or trafficking pathways as indicated (light green rectangles). AP, affinity purification; TAP, tandem affinity purification; PL, proximity labelling.
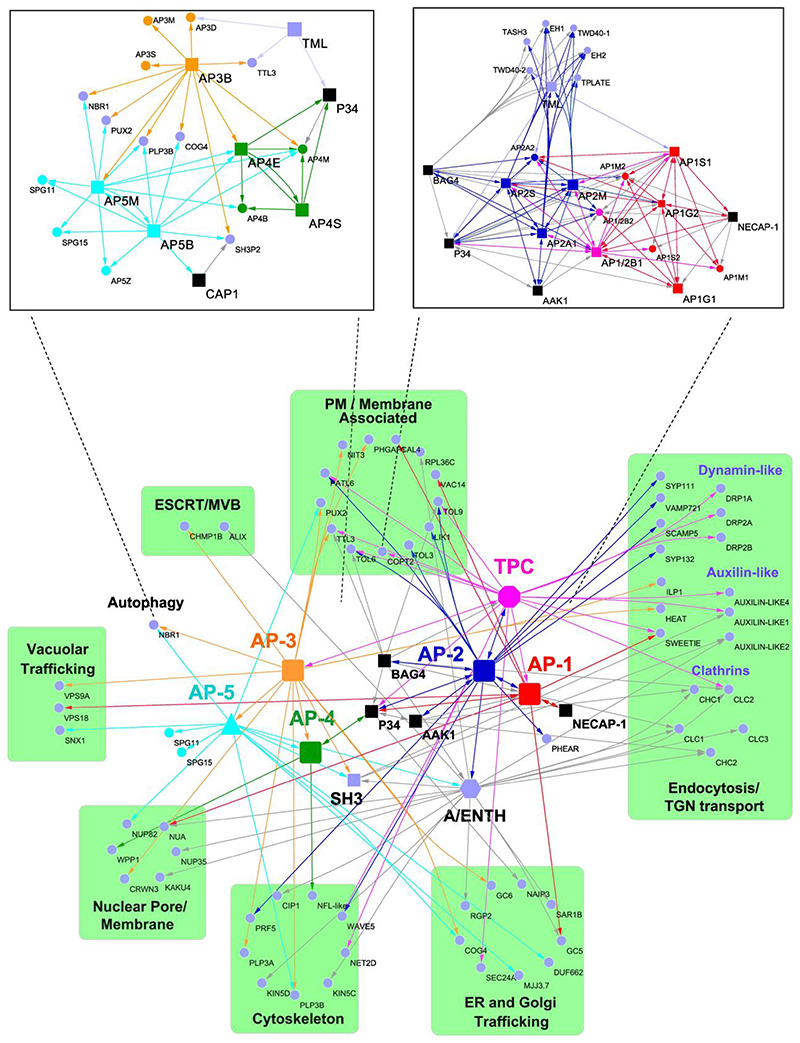
First, we analysed AP-1 and AP-2 using AP1G1, AP1G2, AP1S1, AP1/2B1, AP2A1 and AP2S as baits for TAP-MS, retrieving 110 interactions among 52 proteins (Fig. 1a and Supplementary Table 1). As a complementary approach, we mapped proximal interactors of the AP-2 and the TPC with PL using AP2M and the TPC subunit TML as bait proteins fused to the biotin ligase TurboID tag, revealing 419 interactions among 344 proteins (Fig. 1a and Supplementary Table 1). Both the TAP and PL approaches were successful, because all the core subunits of AP-1, AP-2 and TPC (except for the smaller LOLITA protein) were identified (Fig. 1b and Extended Data Fig. 1). Consistent with the fact that AP-2 functions in endocytosis and shares the β subunit with AP-1, AP-2 was found to associate both with the AP-1 and TPC (Fig. 2), because AP1M2, AP1S1 and all TPC subunits, except for the LOLITA, were found with AP-2 subunits as baits (Fig. 2, right inset). When the AP-1 subunits were used as baits, all AP-2 subunits, except AP2A1, were identified in these experiments, demonstrating the interconnection between AP-1 and AP-2. Besides the core AP-1, AP-2 and TPC subunits, several known accessory proteins linked to endocytosis and vesicle trafficking were detected through PL, such as the clathrin light chain subunit 2 (CLC2), four dynamin-related proteins (DRP1A, DRP1E, DRP2A, and DRP2B), the clathrin uncoating factors AUXILIN-LIKE1 and AUXILIN-LIKE437, the R-SNARE protein VESICLE-ASSOCIATED MEMBRANE PROTEIN 721 (VAMP721)38, and six ENTH/ANTH/VHS accessory proteins (ECA4, PICALM3, EPSIN2, EPSIN3, TOL6, TOL9)39. Their specific PL identification concurs with the fact that PL enhances the detection of membrane-related protein interactions, when compared to protein complex analysis by (T)AP-MS36. Nonetheless, the TAP-MS analysis on the core AP-1, AP-2 and TPC subunits retrieved also additional proteins that can be linked to endocytosis, as witnessed by the co-purification of an Arabidopsis homolog (AT3G58600) of the human ADAPTIN EAR-BINDING COAT-ASSOCIATED PROTEIN-1 (NECAP-1)40 with three AP-1 subunits in TAP-MS. The interaction between NECAP-1 and AP-1 was confirmed in reciprocal TAP-MS experiments with NECAP-1 as a bait, in which all AP-1 subunits but none of the AP-2 subunits were detected (Fig. 1b and Supplementary Table 1).
Fig. 2. Selection from the AP interactome of putative regulators and their crosstalk in vesicle trafficking.
Interactors related to membrane and protein transport were selected. The subunits of each AP complex are combined and shown as individual units (nodes) in colours (AP-1, red; AP-2, blue; AP-3, orange; AP-4, green; AP-5, cyan; TPC, magenta). The purple hexagon and square nodes represent the protein members of A/ENTH and SH3, respectively. P34, BAG4 and AAK1 proteins are shown in black squares. The purple round nodes are the interactors that are functionally linked with protein transport. Source and target nodes of the arrows indicate the baits and the targets, respectively. Insets, detailed interaction networks of the individual subunits of AP-3, AP-4 and AP-5 (left) and of AP-1, AP-2 and TPC (right).
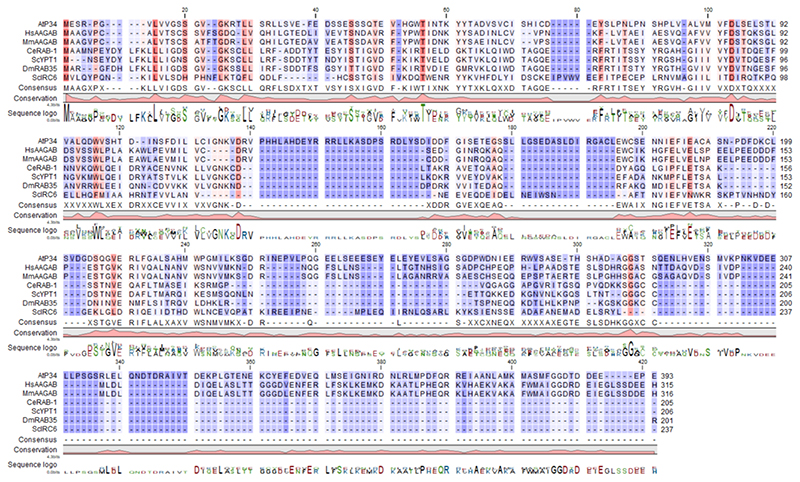
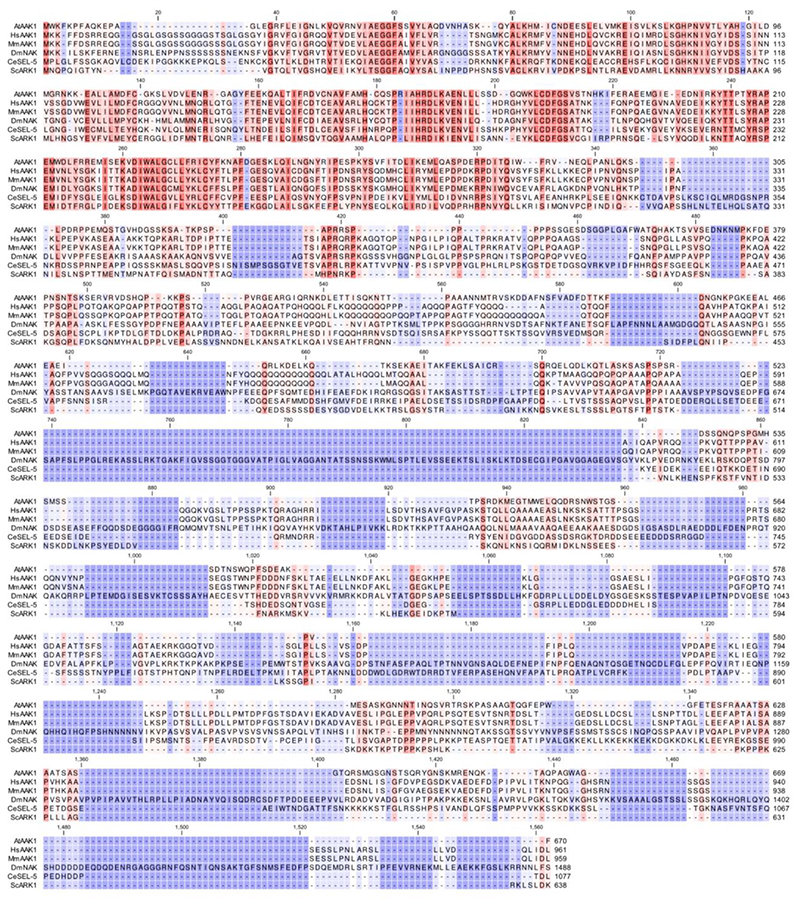
These TAP and PL analyses clearly demonstrate the robustness of the interactome data, not only providing valuable insight into the functioning of the core AP-1, AP-2, and TPC, but potentially also revealing unknown accessory proteins. Notably, three proteins with previously undetermined functions in plant endomembrane trafficking, a GTP-binding protein (AT5G65960), a protein kinase superfamily protein (AT2G32850) and the BCL-2-ASSOCIATED ATHANOGENE4 (BAG4) protein41 (AT3G51780), were identified with multiple AP-2 subunits and TML as bait proteins, highlighting them as novel candidate accessory proteins. Sequence homology analysis revealed that the GTP-binding protein is a putative plant homolog of the human α- and γ-adaptin binding protein (AAGAB) P3442,43, with 23% identity and 38% similarity (Extended Data Fig. 2), whereas the uncharacterized protein kinase is a plant homolog of the human AP2-ASSOCIATED PROTEIN KINASE1 (AAK1) 44,45, with 43% identity and 62% similarity (Extended Data Fig. 3). The BAG family protein BAG4 is a member of an evolutionarily conserved group of co-chaperones found in yeasts, animals and plants, linked mainly to apoptosis41. To further consolidate the predicted role of P34, BAG4 and AAK1 in plant vesicle trafficking based on sequence similarity to their mammalian orthologues41,42,45, reciprocal TAP-MS analyses using these three proteins as baits identified 87 interactions among 73 proteins (Fig. 1 and Supplementary Table 1). The reciprocal TAP-MS analyses indicated that also in plants, P34, AAK1 and BAG4 are linked with vesicle trafficking, because numerous AP-1, AP-2, AP-4, and TPC subunits, clathrin, and ENTH/ANTH/VHS proteins were retrieved. The TAP-MS experiments with AAK1 confirmed its interaction with AP-2 and clathrin heavy chains (CHCs). Intriguingly, highly stable and stoichiometric interactions were found between P34 and multiple AP-2 and AP-1 subunits, while also interacting with the AP-4 subunit, AP4M although this interaction was less prevalent. Also with BAG4, multiple members of both the AP-2 and AP-1 were co-purified, in addition to five subunits of the TPC, two CLCs and multiple ENTH/ANTH/VHS proteins. To further extend our endocytosis-related network, the three AP180-amino-terminal-homology (ANTH)-domain containing proteins ECA1, ECA4 and CAP1, which were isolated with BAG4 as a bait and are involved in membrane budding processes39, were selected for reciprocal TAP-MS (ECA1 and ECA4) or AP-MS (CAP1). These analyses support that ECA4 and CAP1 function is associated with CCV, as CLCs and CHCs were isolated with these baits. Moreover, ECA4 and CAP1 seem to function in one protein complex, as both proteins were abundantly co-purified which each other. Similarly, also P34, AAK1 and BAG4 were isolated with each other. Therefore, our interactome analyses implies that AP-1, AP-2 and TPC are intrinsically connected to each other, and that P34, BAG4 and AAK1 function as accessory proteins that link these complexes.
Next, we built the interactome network of AP-3 and AP-4 by means of their large subunits AP3B and AP4E and the small AP-4 subunit (AP4S) as baits for single-step AP-MS. The resulting AP-3 and AP-4 network consisted of 77 interactions among 54 proteins, demonstrating that, in addition to the interactions between core subunits within each complex, AP-3, AP-4 and AP-5 were linked with each other (Fig. 2), because AP4E, AP4M and AP5M were identified with AP3B as a bait (Fig. 2, left inset). Markedly, P34 was also detected with both AP-4 subunits, in agreement with the identification of the AP4M subunit in the TAP-MS with P34 as a bait.
Identification of the Arabidopsis AP-5 complex
Although sequence homology searches have identified three putative genes encoding AP-5 subunits in Arabidopsis, AP5B (AT3G19870), AP5Z (AT3G15160), and AP5M (AT2G20790)2, it is still unclear whether they function together as a bona fide complex in plant cells. To discover the core complex and the accessory proteins of AP-5, we used AP5B and AP5M as baits for single-step AP-MS. In total, 102 interactions among 59 proteins were present in the AP-5 network (Fig. 1 and Supplementary Table 1) and all three AP-5 subunits were identified together with the thus far uncharacterized proteins in plants ZINC FINGER FYVE DOMAIN-CONTAINING PROTEIN (ZFYVE) (AT2G25730) and SPATACSIN CARBOXY-TERMINUS PROTEIN (AT4G39420). Further sequence alignments revealed the homology of the SPATACSIN CARBOXY-TERMINUS PROTEIN and the ZFYVE protein to the mammalian SPG11 (with 60% similarity and 22.83% identity) and SPG15 (with 49% similarity and 22.57 identity) proteins, respectively, the two known accessory proteins of the AP-5 complex in mammalian cells2,46. Consistent with the AP-4 interactome analyses, AP5M co-purified with three AP-4 subunits (Fig. 2, left inset). Taken together, these findings imply that next to the sub-clustering of the AP-1, AP-2 and TPC, there is a crosstalk between the vesicle trafficking pathways regulated by AP-5, AP-3 and AP-4. Indeed, the accessory adaptor protein SH3P2 was detected using AP3B, AP5B and CAP1 as baits. Interestingly, SH3P2 was also found by means of TAP-MS with its homolog, SH3P1 as a bait, despite previous reports that SH3P1 and SH3P2 function in different trafficking pathways47, 48.
Functional diversity of the AP complexes in Arabidopsis
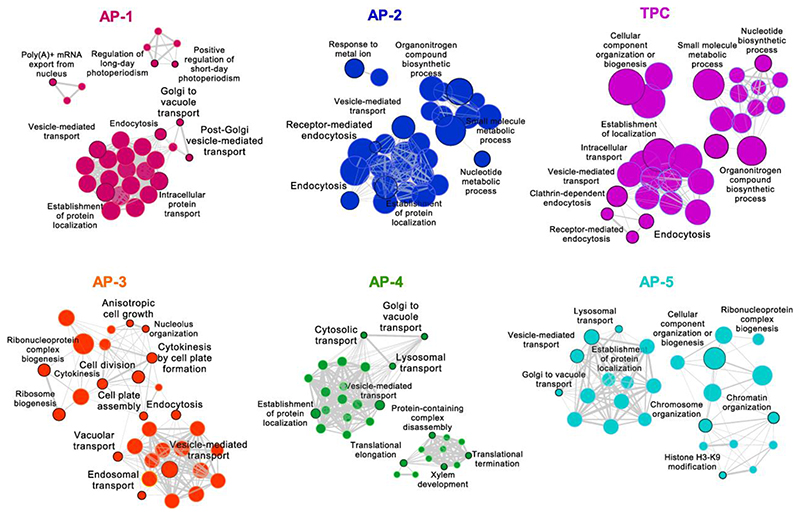
To gain insight into the function of the AP complex-interacting partners, we analysed the Gene Ontology (GO) enrichment. All identified proteins were enriched in GO terms linked to protein transport and molecule metabolic process (Fig. 3 and Supplementary Table 2), including “vesicle-mediated transport” and “establishment of protein localization”. The GO analysis of an individual AP complex revealed that the proteins associated with AP-1, AP-2, AP-3 and TPC were present in the “endocytosis”, whereas those of AP-4 and AP-5 were enriched in “lysosomal transport”. The proteins concomitant with the accessory proteins P34, BAG4, AAK1, ECA1, ECA4 and CAP1 were paired with the terms “CME” and “clathrin coat assembly”. Additionally, the GO term “Golgi to vacuole transport” was shared by the AP-1, AP-4 and AP-5 interactors and the term “vacuolar transport” was associated with AP-3. Interestingly, specific AP complexes were coupled with some GO terms without direct links to vesicle trafficking. For example, some AP-1 interactors were connected with the terms “photoperiodism” and “mRNA export”. AP-2 and TPC shared the GO terms related to metabolic processes, whereas the term “response to metal ion” occurred only in AP-2. Specifically, AP-3 interactors were enriched in “cytokinesis” and “ribosome biogenesis”. By contrast, a cluster of terms related to “translation”, “protein complex disassembly” and “xylem development” were associated with AP-4 interactome. Proteins co-purifying with AP-5 were enriched, on the one side, in “lysosomal transport” and “Golgi to vacuole transport” and, on the other side, in “chromosome organization” and “histone modifications”. Altogether, the GO analysis revealed putative roles of AP complexes in different physiological pathways, seemingly not connected to endomembrane functions.
Fig. 3. GO term enrichment analysis of the AP-associated proteins.
Hierarchical clustering trees show the enriched gene sets associated with different AP complexes and accessory proteins. Each node indicates a significantly enriched GO term (FDR<0.05). The size and colour of the node represent the number of genes in the gene set and different complexes, respectively. The colour hue corresponds to the proportion of each cluster associated with the term. Two terms (nodes) are connected, when they share 20% or more genes. The line thickness indicates the number of shared genes between two terms. Selected GO terms (black outlines) are annotated.
Validation of the AP interactomes
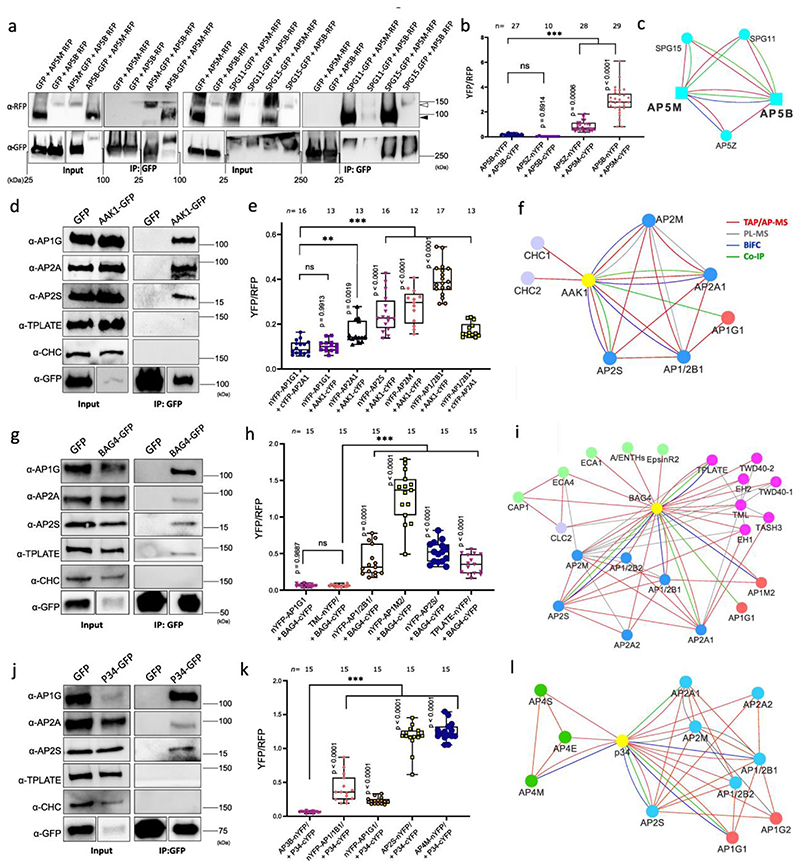
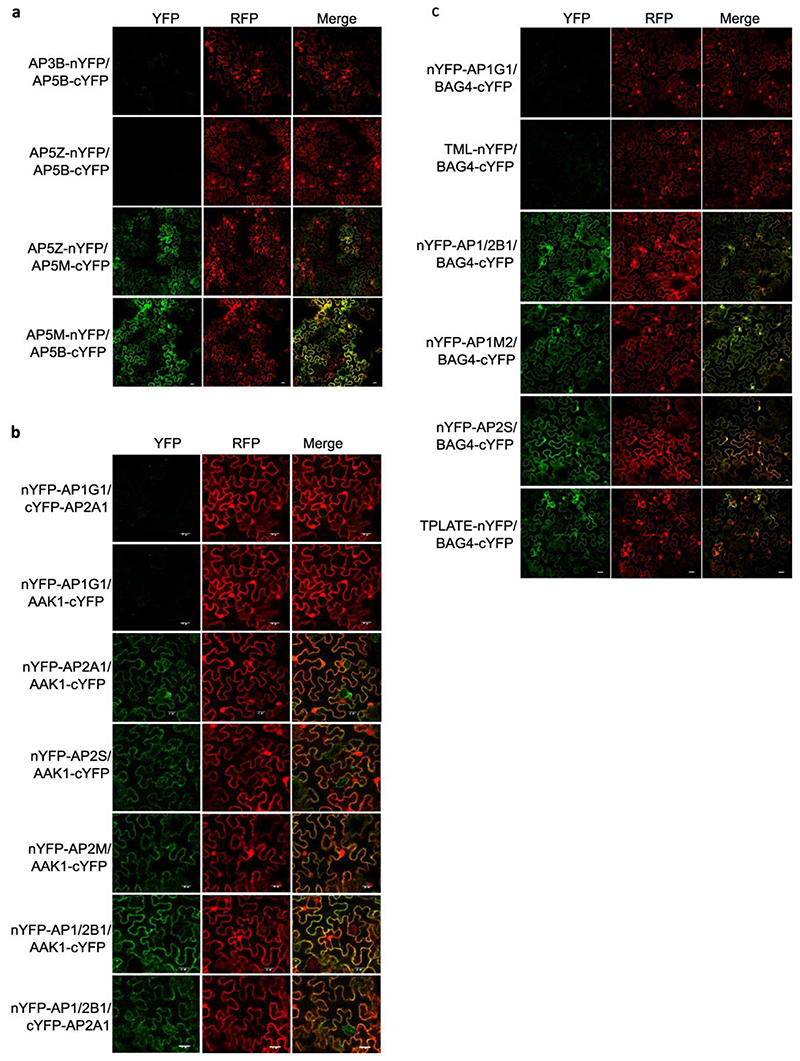
Since AP-5 had not been characterized in plants, we validated the interactions between the AP-5 subunits with co-immunoprecipitation (co-IP) and ratiometric bimolecular fluorescence complementation (rBiFC) (Fig. 4a-c and Extended Data Fig. 4a and Supplementary Table 3). As predicted, AP5B and AP5M reciprocally co-immunoprecipitated when transiently co-expressed in tobacco (Nicotiana benthamiana) leaves (Fig. 4a). Similarly, AP5M co-immunoprecipitated with SPG11 and SPG15, whereas AP5B co-immunoprecipitated with SPG15 (Fig. 4a). In the rBiFC assay, co-expression of AP5M-nYFP (nYFP, the N-terminal fragments of YFP) with AP5B-cYFP (cYFP, the C-terminal fragments of YFP) and AP5Z-nYFP with AP5M-cYFP, but not with AP5B-cYFP, or nYFP-AP3B with AP5M-cYFP, resulted in fluorescence recovery in tobacco epidermal cells (Fig. 4b and Extended Data Fig. 4a). These data confirmed the interactions between AP-5 subunits and SPG proteins, supporting that AP-5 functions as a complex with SPG11 and SPG15 (Fig. 4c) in plant cells, similarly as in mammalian cells46.
Fig. 4. Validation of AP-5, AAK1, BAG4 and P34 protein interaction networks.
a, Co-immunoprecipitation (co-IP) assays in tobacco leaves co-expressing different construct combinations. Free GFP was used as a negative control. White and black arrow heads indicate AP5B-RFP and AP5M-RFP, respectively. b, Quantification of rBiFC (YFP/RFP) between AP5M, AP5B and AP5Z. The interaction between AP5B and AP3B was used as a negative control. c, Cytoscape model of the AP-5 interactome. Edge colours represent the analysis methods used. d,g,j, co-IP assays in Arabidopsis plants expressing p35S:AAK1-GFP, p35S:BAG4-GFP, p35S:P34-GFP and p35S:GFP. AP-1, AP-2, TPC and clathrin were detected with α-AP1G, α-AP2A, α-AP2S, α-TPLATE and α-CHC antibodies. Free GFP was used as a negative control. Experiments were repeated 3 times independently and one representative experiment is presented. e,h,k, Quantification of rBiFC (YFP/RFP) between AAK1, BAG4, P34 and different AP subunits. The interactions between AP1G1 and AP3B, and between AP1/2B1 and AP2A1 were used as negative and positive controls, respectively. Experiments were repeated twice and one representative experiment is shown. n, number of cells. Significant differences were determined by one-way Brown-Forsythe and Welch ANOVA tests with Dunnett T3 multiple comparisons test(b,e,h,k). **P≤0.01 (e); ***P≤0.001 (b,e,h,k). ns, not significant (b,e,h). The bounds of boxes represents the 25th to 75th percentiles, the centre line indicates the median and the whiskers indicate the minimum and the maximum values. All individual values are plotted, f,i,l, Cytoscape models of AP-5, AAK1, BAG4 and P34 protein interaction networks. Edge colours represent the analysis methods used. Node colours represent the different complexes and protein families: AP-1, red; AP-2, blue; AP-4, green; clathrin proteins, magenta; A/ENTH proteins, light green.
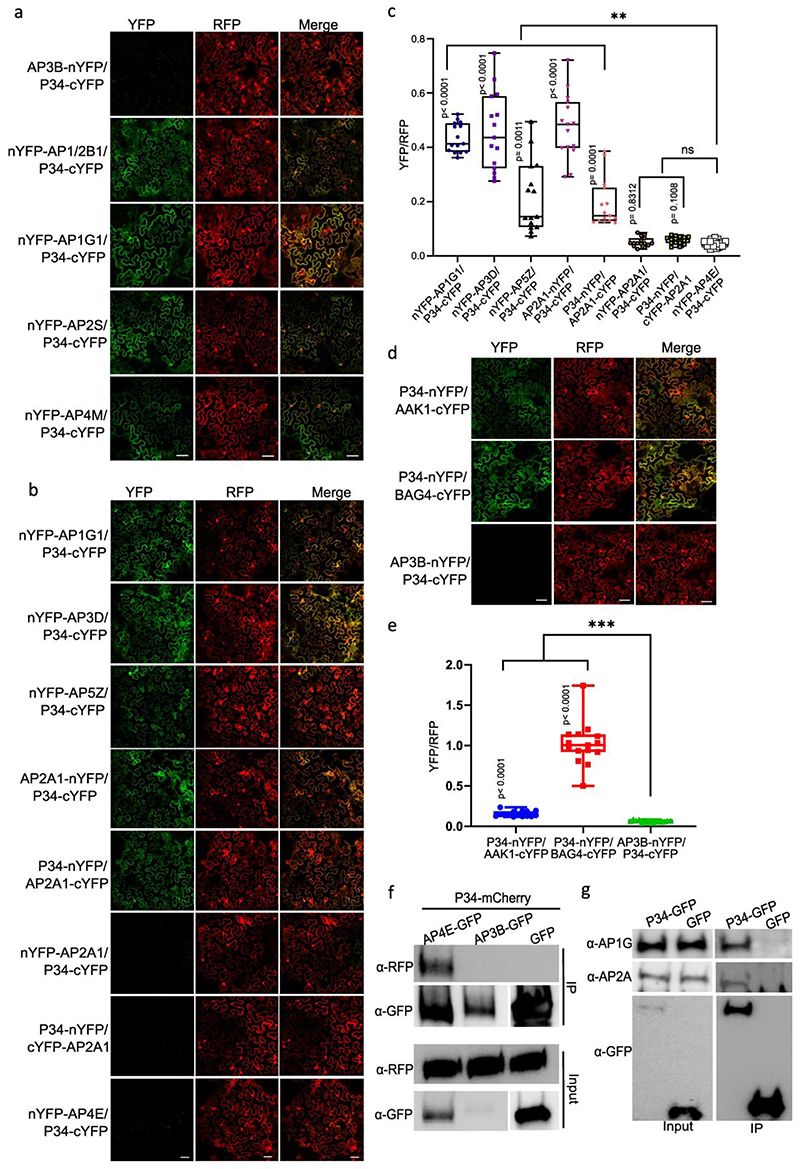
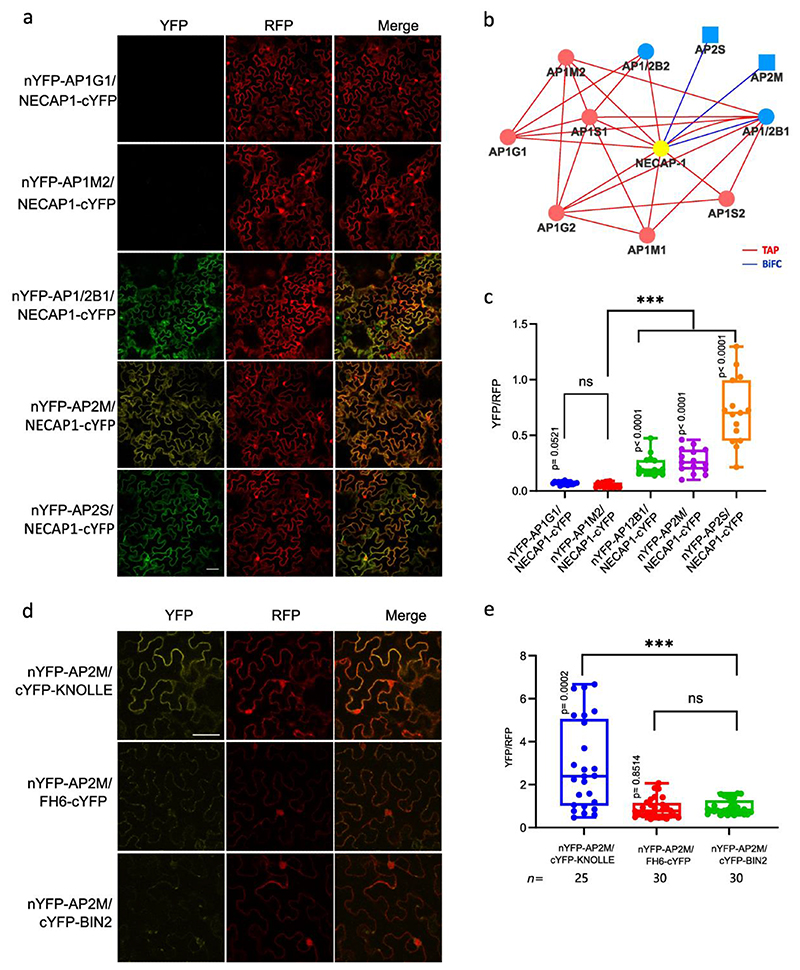
Interactions between the accessory proteins AAK1, BAG4 and P34 and the AP subunits were also validated by co-IP using transgenic Arabidopsis plants expressing p35S:AAK1-GFP, p35S:BAG4-GFP, p35S:P34-GFP and p35S:GFP constructs and by rBiFC in tobacco leaf epidermal cells (Fig. 4d-l, Extended Data Fig. 4b,c, Extended Data Fig. 5 and Supplementary Table 3). AAK1 co-immunoprecipitated with subunits of AP-1and AP-2 but not with TPLATE and CHC (Fig. 4d). In the rBiFC assay, co-expression of AAK1-cYFP with AP2A1-nYFP, nYFP-AP2M, nYFP-AP2S or nYFP-AP1/2B1 resulted in fluorescence signals (Fig. 4e and Extended Data Fig. 4b). Because AAK1 most likely interacted directly with AP-2 (Fig. 4f), the recovery of the AP1G subunit in the co-IP of AAK1-GFP might result from the interaction with the shared AP1/2B1 subunit. Subsequently, co-IP experiments in Arabidopsis and rBiFC confirmed that BAG4 is a hub protein associated with AP-1, AP-2 and TPC (Fig. 4g-i and Extended Data Fig. 4c), whereas P34 interacted with subunits of AP-1, AP-2 and AP-4 (Fig. 4j-l and Extended Data Fig. 5a,f). Interestingly, in the rBiFC assays, P34 also interacted with AP3D and AP5Z subunits (Extended Data Fig. 5b,c), suggesting that P34 binds to various AP complexes in rBiFC (Fig. 4l). However, co-IP in tobacco did not identify an association between P34 and AP3B (Extended Data Fig. 5f). We also checked whether a mutation in one AP complex would affect the interaction between P34 and another AP complex. Subsequent co-IP revealed that P34 was still associated with AP1G and AP2A in the ap4m-2 mutant (Extended Data Fig. 5g). Furthermore, interactions between P34, BAG4 and AAK1 were also observed in rBiFC (Extended Data Fig. 5d,e). Interestingly, even though the Arabidopsis NECAP-1 was identified in TAP-MS experiments with AP-1, rBiFC analysis revealed an interaction with subunits of both the AP-1 and AP-2 complexes (Extended Data Fig. 6a-c), similarly to the NECAP-1 in mammals40. The PL analysis with AP2M discovered several unknown PM-associated putative endocytic cargos and rBiFC (Extended Data Fig. 6d,e) confirmed the interactions between AP2M and the cytokinesis-specific syntaxin KNOLLE49 and the FORMIN-LIKE6 (FH6) protein50. Collectively, we generated a highly reliable AP interaction network, including the composition of the AP-5, several AP complex accessory proteins, and revealed a number of regulatory proteins and putative cargoes associated with various AP complexes.
P34 regulates the stability of AP-1, AP-2 and AP-4
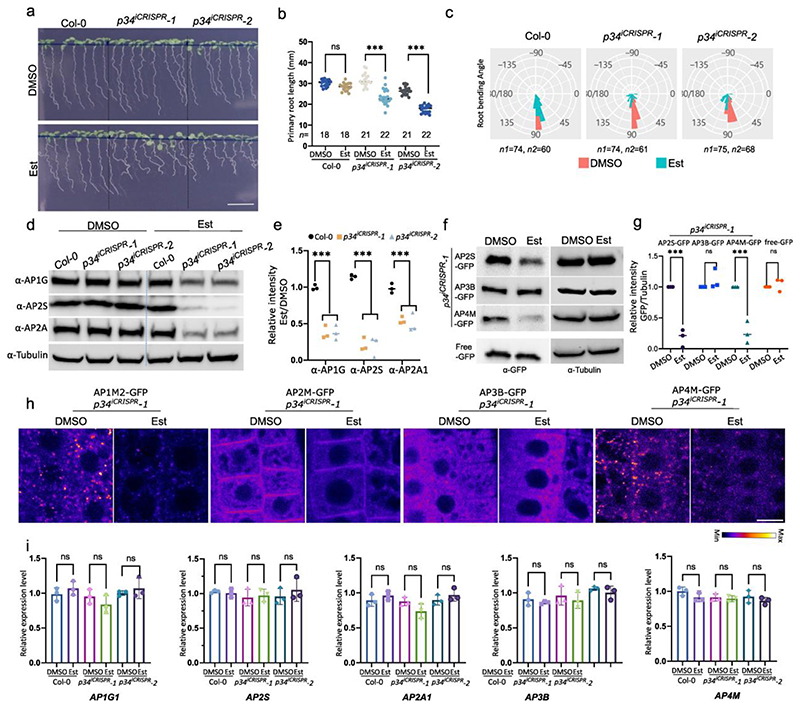
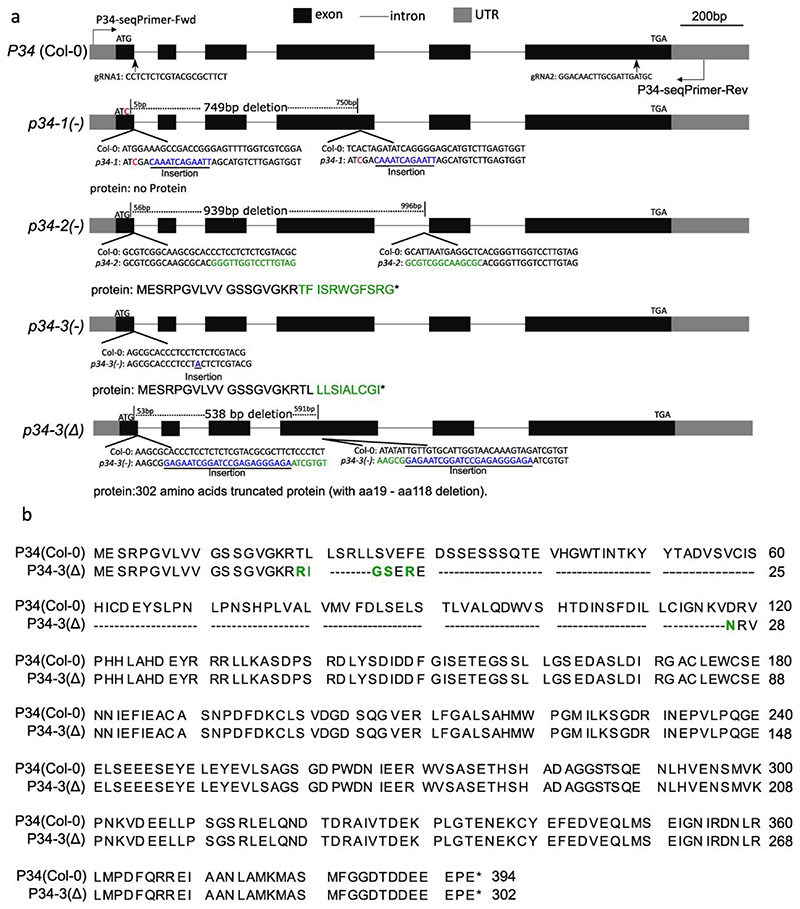
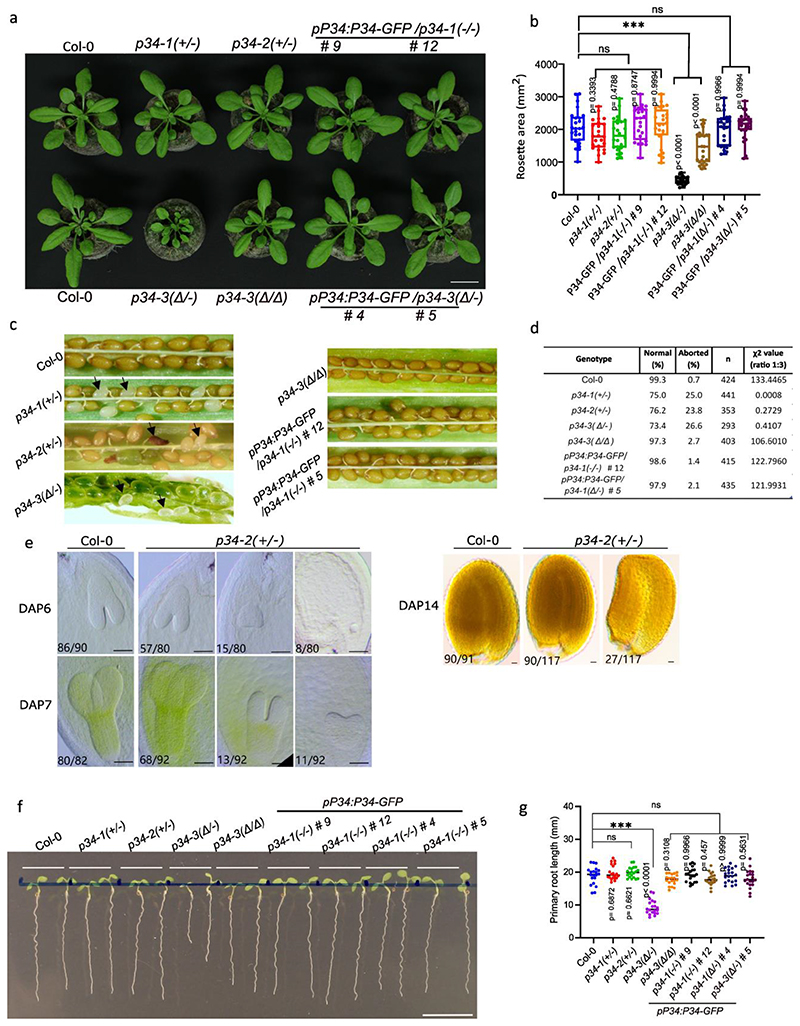
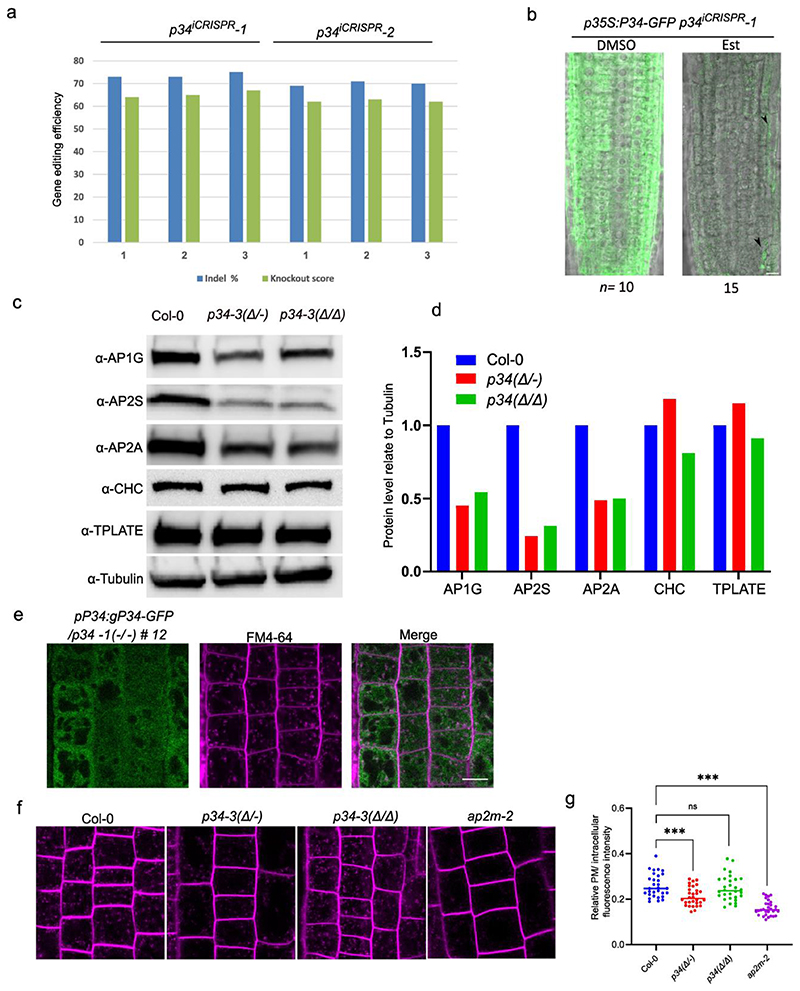
As the AP network had identified P34 as a hub protein interacting with several AP complexes, we investigated its function in Arabidopsis. Homozygous knockout p34 mutants generated with the CRISPR/Cas9 technology (Extended Data Fig. 7a,b) could not be detected in the T1 generation nor in the offspring of two independent heterozygous lines, p34-1(+/-) and p34-2(+/-). When grown in soil for 4 weeks, the rosette area of the heterozygous p34-1(+/-) and p34-2(+/-) mutants did not differ from the wild type (Extended Data Fig. 8a,b), but the siliques of the mature plants contained on average 25% abnormal seeds per silique, whereas only 0.5% of the seeds in the wild type siliques were abnormal (Extended Data Fig. 8c,d). The absence of homozygous p34 mutant plants and the observed 25% seed abortion suggest that the P34 gene is essential for embryogenesis. Furthermore, we examined the embryogenesis in the p34-2(+/-) and found that embryo development is delayed in the p34-2(-/-) mutant seed (Extended Data Fig. 9e). At 14 days after pollination (DAP), approximately one quarter of the seeds in the p34-2(+/-) mutant silique showed shrinkage, indicating that P34 likely plays an important role in embryogenesis and embryo maturation (Extended Data Fig. 8e). Screening the CRISPR/Cas9 population revealed one biallelic p34 mutant, designed p34-3(Δ/-). The p34-3(Δ/-) mutant contained one allele with a nucleotide inserted 63 bp after the start codon, leading to a stop after the 30th amino acid and a second allele containing a 538 bp deletion and a 23 bp insertion, resulting in an in-frame translation of P34 with a deletion of 100 amino acids, from the 19th to the 118th amino acid (indicated as Δ) (Extended Data Fig. 7a,b). In contrast to the wild type and the two heterozygous p34-1(+/-) and p34-2(+/-) mutants, the p34-3(Δ/Δ) and p34-3(Δ/-) plants had smaller rosette areas when grown in soil (Extended Data Fig. 8a,b). The p34-3(Δ/-) mutant exhibited seed abortion rates similar to those of the heterozygous p34-1(+/-) and p34-2(+/-) alleles, whereas the p34-3(Δ/Δ) mutant behaved as the wild type (Extended Data Fig. 8c,d), suggesting that p34-3(-) and p34-3(Δ) are full knock-out and hypomorphic alleles, respectively. Examination of the primary root length of seedlings grown in vitro for 7 days revealed that it was significantly reduced for the p34-3(Δ/-) mutant only (Extended Data Fig. 8f,g). Further complementation analysis of the p34-1(+/-) and p34-3(Δ/-) mutants with the pP34:gP34:GFP construct were carried out and transgenic plants were recovered that resembled the wild type plants in terms of rosettes size, seed set and primary root length with the genotypes pP34:gP34-GFP/p34-1(-/-) and pP34:gP34-GFP/p34-3(Δ/-) (Extended Data Fig. 8a-g). As no homozygous p34 mutant had been obtained and the biallelic p34-3(Δ/-) mutant did not allow genetic crossing, we generated β-estradiol-inducible ipRPS5A>>CAS9-tagRFP-P34 knockout transgenic Arabidopsis plants (Fig. 5). Inference of CRISPR Edits (ICE) analysis of two independent T2 lines, ipRPS5A>>CAS9-tagRFP-P34 #1-16 and ipRPS5A>>CAS9-tagRFP-P34 #5-12, hereafter designated p34iCRISPR-1 and p34iCRISPR-2, respectively, showed high genome editing on P34 (Extended Data Fig. 9a). In addition, the P34-GFP signal in the p35S:gP34-GFP/p34iCRISPR-1 was almost eliminated after 5 days of β-estradiol treatment (Extended Data Fig. 9b). When grown on agar medium containing 10 μM β-estradiol for 9 days, the primary root length of p34iCRISPR-1 and p34iCRISPR-2 plants were shorter than those of the DMSO controls and of the β-estradiol-treated wild type (Fig. 5a,b). Strikingly, the p34iCRISPR mutants also exhibited an agravitropic root growth after induction (Fig. 5c).
Fig. 5. P34 regulates the stability of AP-1, AP-2 and AP-4.
a, Wild type (Col-0), p34iCRISPR-1 and p34iCRISPR-2 seedlings grown on media containing DMSO (mock)) or 10 μM β-estradiol (Est) for 9 days. Scale bar, 10 mm. b, Primary root length of seedlings shown in (a). n, number of roots. c, Root gravitropic bending of Col-0, p34iCRISPR-1 and p34iCRISPR-2 seedlings. Seven-day-old seedling grown as in (a) were gravistimulated by rotating 90° in two independent experiments. n1 and n2 indicate the number of roots treated with DMSO and Est, respectively. d,e, Protein levels of AP2S, AP2A1, AP1G and tubulin of seedlings in (a) analysed by immunoblotting. Relative quantities of target proteins were normalized to tubulin for each sample. The values were further normalised to the mock control for each genotype. Experiments were repeated three times. One representative experiment is shown. The quantification in (e) combines three independent experiments. f,g, Protein levels of AP2S-GFP, AP3B-GFP and AP4M-GFP in p34iCRISPR-1 mutant analysed in 9-day-old Arabidopsis seedlings grown as in (a) by immunoblotting with α-GFP and α-Tubulin. 35Sp:GFP was used as a control. Relative protein levels of AP2S-GFP, AP3B-GFP and AP4M-GFP were normalised to tubulin. The quantification in (g) combines three independent experiments. h, Subcellular localization of AP1M2-GFP, AP2M-GFP, AP3B-GFP and AP4M-GFP in p34iCRISPR-1 mutant analysed in root epidermis of 5-day-old Arabidopsis seedlings grown as in (a). Scale bar, 10 μm. i, Expression levels of AP1G1, AP2S, AP2A1, AP3B and AP4M in 9-day-old seedlings grown as in (a). RT-qPCR analysis were done in three independent experiments each with three technical replicas. Transcript levels were normalised to ACTIN2. The significant differences were determined by one-way ANOVA test (b,i) and two-way ANOVA test (e,g). ***P ≤ 0.001; ns, not significant. The P value versus the mock (b) for the Est-treated Col-0 = 0.2207, p34iCRISPR-1 <0.0001 and the Est-treated p34iCRISPR-2 <0.0001. The P values versus Col-0 (e) are all <0.0001. The P values versus the mock for different proteins in Est-treated p34iCRISPR-1 (g) are: AP2S-GFP <0.0001, AP3B-GFP = 0.5996, AP4M-GFP <0.0001 and free GFP = 0.9745.
Recently, the human P34/AAGAB has been reported to control the assembly and stability of AP-242. To establish whether this is the case in plants, we assessed the protein levels of AP-1 and AP-2 in the inducible p34iCRISPR-1 and p34iCRISPR-2 mutants by immunoblots with α-AP1G, α-AP2A and α-AP2S antibodies (Fig. 5d-e). As anticipated, the AP1G, AP2A and AP2S protein levels were dramatically reduced in p34iCRISPR mutants. Similar results were obtained in the biallelic p34-3(Δ/-) mutant but the protein levels of CHC and TPLATE in p34-3(Δ/-) were similar to those of the wild type (Extended Data Fig. 9c-d). We further tested whether the protein levels of AP-3 and AP-4 were also affected in the p34 mutants. To this end, we crossed the p34iCRISPR-1 mutant with pAP1M2:AP1M2-GFP/ap1m2-1, pAP2S:AP2S-GFP/ap2s, pAP2M:AP2M-GFP/ap2m-2, pAP3B:AP3B-GFP/pat2-1, and pAP4M:AP4M-GFP/ap4m-2 and used the p35S-GFP/Col-0 plants as control. F2 seeds carrying the CRISRP/Cas9 construct were selected by seed fluorescence51 and used for further experiments. Immunoblot analysis indicated that the levels of AP2S-GFP and AP4M-GFP, but not of AP3B-GFP and GFP, were reduced after β-estradiol induction (Fig. 5f-g). In agreement, the protein abundance but not the subcellular localization of AP-1, AP-2 and AP-4 was altered in the p34iCRISPR-1 mutant (Fig. 5h). No significant difference in AP1G1, AP2S, AP2A1, AP3B and AP4M transcript levels were detected by RT-qPCR analysis in the p34iCRISPR-1 mutant (Fig. 5i). Overall, our data show that P34 is an essential protein that controls the stability and possibly the assembly of AP-1, AP-2 and AP-4 but not of AP-3.
P34 modulates various vesicle trafficking pathways
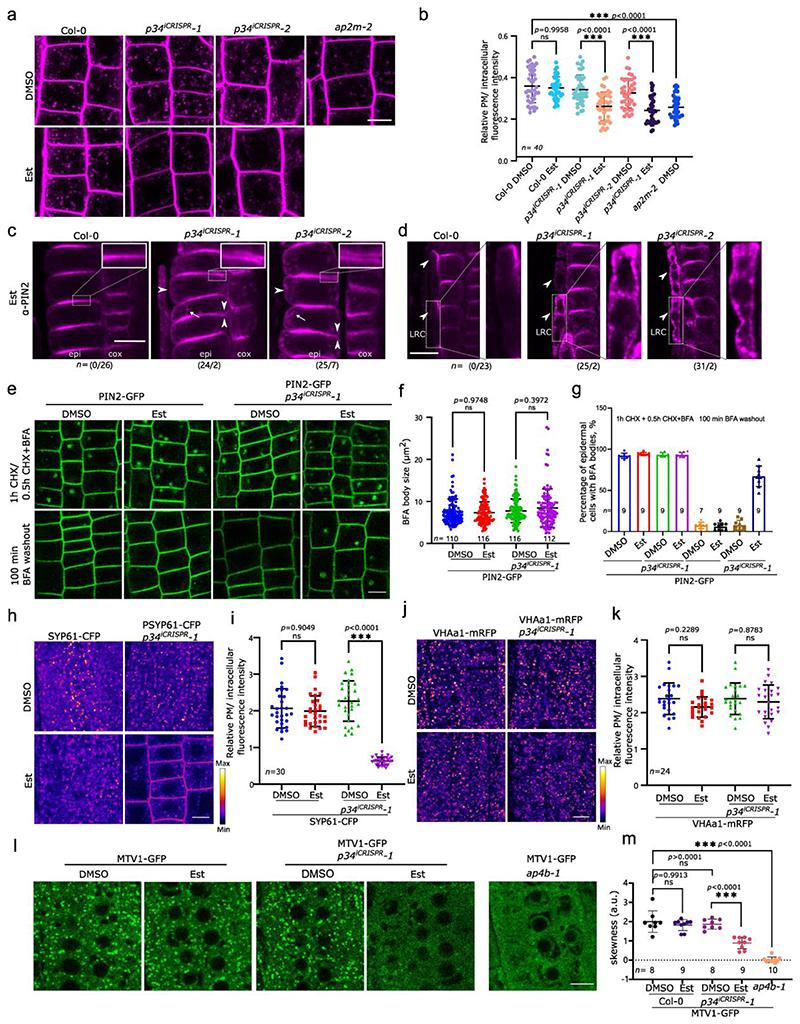
We next examined whether P34 modulates the trafficking pathways mediated by AP-1, AP-2 and AP-4 as their abundance was affected when the P34 function was impaired. Consistent with previous studies in mammalian cells42, 43, P34-GFP mainly localized to the cytoplasm in the root cells and was not visibly associated with membranes or organelles (Extended Data Fig. 9e).First, we followed the general endocytosis by the FM4-64 uptake in p34iCRISPR-1 and p34iCRISPR-2 seedlings after β-estradiol induction and in the p34-3 mutants. The ap2m-2 mutant was used as a reference. As expected, the internalization of FM4-64 in the root cells was significantly reduced in the p34iCRISPR mutants (Fig. 6a,b). In addition, p34-3(Δ/-) also showed a decreased internalization of FM4-64 when compared to the wild type (Extended Data Fig. 9f-g).
Fig. 6. P34 regulates vesicle trafficking depending on AP-1, AP2 and AP-4.
a, Root epidermis of 5-day-old Col-0, p34iCRISPR-1, p34iCRISPR-2 and ap2m-2 seedlings grown on media containing DMSO (mock) or 10 μM β-estradiol (Est) were imaged after staining with FM4-64 (2 μM, 15 min). b, Relative plasma membrane (PM) to intracellular fluorescence intensity ratio of FM4-64 of images in (a). Ten roots were analysed. c,d, Immunolocalization of PIN2 in epidermal (epi) and cortex (cox) cells in (c) and in lateral root cap (LRC) cells in (d) of 7-day-old Col-0, p34iCRISPR-1 and p34iCRISPR-2 roots treated with Est. Arrow heads and arrows indicate the PM-localized PIN2 and endosomal PIN2, respectively. The insets show the polarity of PIN2 in the epidermis. The ratio of PIN2 abnormal/normal localization in roots is indicated for three independent experiments. e, Brefeldin A (BFA) washout experiment of PIN2-GFP in 5-day-old wild type and p34iCRISPR-1 roots grown as in (a). CHX, cycloheximide. f, BFA body sizes before the washout. n, number of BFA bodies. At least seven roots were measured. g, Percentage of BFA body-containing cells in PIN2-GFP seedlings before and after BFA washout in (e). h, Fluorescence intensity images of SYP61-CFP in the root cells of 5-day-old Col-0 and p34iCRISPR-1 grown as in (a). i, PM/intracellular fluorescence intensity ratios of SYP61-CFP in one representative experiment. At least five roots were measured. j, Fluorescence intensity images of VHAa1-mRFP in the root cells of 5-day-old Col-0 and p34iCRISPR-1 grown as in (a). k, PM/intracellular fluorescence intensity ratios of VHAa1-mRFP in one experiment. l, Localization of MTV1-GFP in the root cells of 5-day-old Col-0, p34iCRISPR-1 and ap4b-1 grown as in (a). m, Quantification of the presence of defined MTV1-GFP punctate signals by analysis of the skewness of the signal intensity from at least seven roots. Higher skewness indicates more diffuse signals. Experiments were repeated three times. One representative experiment is shown. Data are presented as mean values (centre line). Error bars represent SD. ***P≤0.001 [one-way ANOVA (b,f,i,k,m)], n, number of roots (g,m) or cell (i,k) analysed. ns, not significant. a.u., arbitrary units. Scale bars, 10 μm (a,c,d,e,h,j,l).
Subsequently, the localization of the known CME cargo PIN211,37 in root cells of the p34iCRISPR mutants was studied by whole-mount immunofluorescence labelling (Fig. 6c,d). The polar localization of PIN2 was severely disrupted, whereas its endosomal localization was more pronounced in the epidermal and lateral root cap cells. We also examined the accumulation of PIN2-GFP in Brefeldin A (BFA)-induced endosomal aggregates (so-called BFA bodies). No significant differences in PIN2-GFP BFA body size was observed between the wild type and the p34iCRISPR mutants after a 1-h BFA treatment (50 μM) (Fig. 6e,f). In contrast, the dissipation of BFA bodies was significantly slower in the p34iCRISPR mutant than in the wild type, as indicated by the retention of abundant BFA bodies in the p34iCRISPR mutant after a 100-min BFA washout (Fig. 6e,g). These data indicate that P34 is essential for endocytosis, recycling, BFA-sensitive endosomal aggregation and polarity establishment of PIN2, probably through regulation of the AP-2 and AP-1 stability in the cytoplasm.
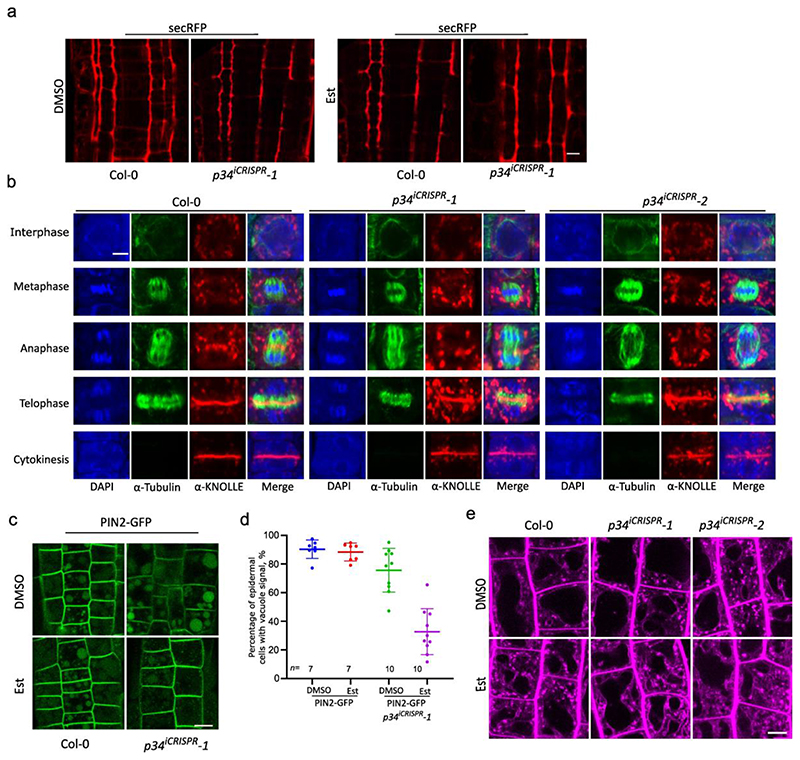
As AP-1 affects exocytosis, endocytosis and vacuolar trafficking52, we investigated whether impairing the P34 function influences the trafficking of the secretory marker, secRFP53, the PIN237 and KNOLLE7,49 proteins, and the localization of the TGN/EE-resident proteins, SYNTAXIN 61 (SYP61)52 and VACUOLAR ATPASE SUBUNIT a1 (VHAa1)52. To this aim, we assessed the secretion of secRFP to the apoplast in p34iCRISPR-1. The localization of secRFP in the p34 mutants after β-estradiol induction remained apoplastic (Extended Data Fig. 10a), indicating that the secRFP secretion to the apoplast was not affected. By means of whole-mount immunofluorescence labelling, we determined the localization of KNOLLE during cytokinesis. In the wild type, KNOLLE is recruited to the developing cell plate via the secretory pathway7, is targeted for vacuolar degradation once cytokinesis is completed54 and is retrieved from the cell plate insertion site by endocytosis25,55. Although in the p34iCRISPR-1 plants some KNOLLE reached the cell plate during and post-cytokinesis, much more KNOLLE was detected in endosomes, possibly reflecting partial defects in its secretion and/or vacuolar trafficking (Extended Fig. 10b). Visualization of PIN2-GFP signals after dark treatment revealed that the PIN2-GFP accumulation in the vacuole was strongly reduced in the β-estradiol-treated p34 mutant similarly to the ap1m2-1 mutant7 (Extended Data Fig. 10c,d), further indicating that besides secretion, vacuolar trafficking was also affected in the p34. Furthermore, when grown on DMSO, SYP61-CFP mainly localized to the TGN/EE in both wild type and p34iCRISPR-1 root cells (Fig. 6h-i). However, after β-estradiol induction SYP61-CFP was mislocalized to the PM in p34iCRISPR-1 line (Fig. 6h-i), likewise as when SYP61 was examined in the ap1m2 mutant52. Moreover, the localization of VHAa1-RFP in p34iCRISPR-1 after β-estradiol induction was not significantly altered (Fig. 6j-k) thus resembling the VHAa1 localization in the ap1m2 mutant52. Taken together, these results suggest that in the p34iCRISPR mutants some but not all, aspects of AP-1-mediated trafficking are affected.
Since impairment of the P34 function had an impact on the AP-4 stability, we studied the localization of the Epsin-like protein MODIFIED TRANSPORT TO THE VACUOLE1 (MTV1), previously shown to localize to the TGN/EE in AP-4-dependent manner23, in the p34iCRISPR-1 line (Fig. 6m,n). Similarly to its expression in the ap4b-1 mutant, the punctate pattern localization of MTV1-GFP in the p34iCRISPR-1 mutant was reduced after β-estradiol induction (Fig. 6l-m). Notably, in contrast to that in the ap3 mutant18, the vacuolar morphology remained unaffected and PIN2-GFP did not accumulate abnormally in the vacuole in p34iCRISPR-1 under normal light conditions (Fig. 6c, Extended Data Fig. 10e), suggesting that the AP-3-depnedent pathway is functional.
All in all, our data demonstrate that P34 regulates CME to some extent, but had a more pronounced impact on the trafficking to the vacuole, the localization of a subset of TGN/EE proteins, such as SYP61 and the AP-4 cargo MTV1, but not on the default secretion to the apoplast. We hypothesise that these results are achieved through maintenance of the correct protein levels of AP-1, AP-2 and AP-4 and possibly of their complex assembly.
Discussion
AP complexes are key regulators of the intracellular protein transport. AP dysfunction in mammalian cells disturbs many cellular processes, including organelle dynamics, tissue homeostasis and signal transductions, and provokes various heritable diseases and neurological disorders3. In plants, AP complexes also play critical roles in protein sorting and regulate several physiological processes56. Despite many similarities between plants and mammals, some structural differences make plant vesicle trafficking fundamentally distinct4. Firstly, the secretory, but the endocytic pathway as well, converge at the plant TGN/EE. Secondly, although plant cells rarely contain lysosomes, they possess large vacuoles with multiple functions. Thirdly, supposedly aiding to overcome the high-turgor pressures, an actin-independent endocytic pathway combined with an additional membrane bending machinery, such as TPC, is evolutionarily retained in plants4,26. These differences imply plant-specific adaptations to control the vesicle trafficking mechanisms. (T)AP-MS and PL-MS methods have been routinely used for large-scale detection of protein-protein interaction in plants28, 36, 57. Both methods allow identification of protein interactions under the near physiological conditions within a cell. Whereas (T)AP-MS reveals the binding partners in a stable protein complex, PL-MS identifies proteins that are in close proximity to the bait. The key advantage of (T)AP-MS is that it can be used to identified the core subunits and the accessory proteins of a complex. However, weak and transient interactors are often missing in the analysis. PL-MS is therefore developed as an alternative approach allowing the capture of weak and transient interactions. Since previous studies12, 25 have already identified strong binders of AP-2 and TPL, performing PL-MS with AP2M and TML allowed for the discovery of possible CME cargos. In addition, proteomic approach using purified CCVs coupled with tandem MS analysis was also a powerful tool for identifying core and accessory machinery involved in CCV formation35.
Mammalian AP-1, AP-2 and AP-3 interact with clathrin, whereas AP-4 and AP-5 do not3. However, only AP-1 and AP-2 are enriched in the mammalian CCVs and participate in their formation3. Although AP-3 can interact with clathrin, this interaction is currently viewed as non-essential under physiological conditions58. AP-5 does not require clathrin and, instead associates with SPG11 and SPG15, which have been predicted to have α-solenoid structures similar to those of CHC, TPC and coatomer protein complex (COPI) subunits59. On the contrary, all subunits of AP-1, AP2 and AP-4, but not those of AP-3 or AP-5, are enriched in plant CCVs35. The PL with TML identified CLC2 that, in agreement with previous reports, connects TPC with clathrin25. In our interactome, however, no clathrin associated with any of the five AP complexes. Conversely, the TAP-MS detected CHC1 and CHC2 associated with the AP-2 binding partner, AAK1, whereas CLC1 and CLC2 associated with the AP-1 and AP-2 binding partner, BAG4. Nevertheless, these interactions were not confirmed by the co-IP experiments.
Human AAK1 regulates CME by phosphorylating the medium subunit of AP-2, which promotes binding of AP-2 to cargo proteins during CCV formation44,60. This kinase modulates several pathways, including NOTCH and WNT signalling44,45,61. The AP-2 network showed that the Arabidopsis AAK1 binds specifically to AP-2, indicating that AAK1 might regulate AP-2 functions and CME in plant cells. AAK1 also interacted with BAG4, which had been identified as a hub protein associated with AP-1, AP-2 and TPC. The BAG family is evolutionarily conserved in eukaryotes, and the human BAG proteins act as co-chaperones of the heat shock protein (HSP70) family. BAG4 proteins are involved in multiple functions, such as apoptosis, autophagy, proteasomal and lysosomal degradation, neurogenesis and tumorigenesis62. Arabidopsis contains seven BAG family members and BAG4 was shown to be involved in salt responses and stomatal movement41. Consistent with the obtained protein-protein interaction data, BAG4 also associated with clathrin, TOM1-LIKE (TOL) ESCRT-0 proteins63,64, two ANTH-type clathrin adaptors, ECA4 and CAP125 and a group of heat shock proteins41, suggesting a role for the Arabidopsis BAG4 in protein degradation either linked to autophagy, the ubiquitin-mediated proteasomal degradation pathway or endocytosis64,65.Taken together, our data uncover an intimate network of the AP-1, AP-2, TPC, AAK1, BAG4 and the A/ENTH proteins that are involved in clathrin-dependent protein trafficking. The AP interactome revealed that in Arabidopsis AP-3, AP-4 and AP-5 are more closely related to each other, not only because they share several interacting components but also because some of their subunits co-purified. Instead of acting in a clathrin-dependent manner, the human AP-5 cooperates with SPG11 and SPG15 as a scaffold and a docking site, respectively46. We discovered that Arabidopsis AP-5 also associates with the plant homologues of the human SPG11 and SPG15, AT2G25730 and AT4G39420, respectively, of which the functions in plants are still not elucidated. In spite of the high probability that the Arabidopsis AP-5 also acts together with SPG11 and SPG15 in plants, we could not exclude that AP-5 might utilize or share subunits with AP-3 and/or AP-4, because the AP5S subunit gene is absent in the Arabidopsis genome and the three AP complexes crosstalk during the trafficking between TGN and late endosomes in plant cells. In addition, our interactome identified significant but weak interactions between subunits of different AP complexes (Extended Data Fig. 1). Such interconnections are typically represented by sub-stoichiometric interactions, whereas interactions within the core AP complexes were much more abundant and stoichiometric. Whether the interactions between subunits of different AP complexes are physiologically relevant remains unclear. AP subunits share similar structural folds, which might provide an affinity for one another. Therefore, it is possible that overexpression of one subunit as a bait can generate an imbalance with respect to other endogenous subunits, which would allow for artificial interactions between complementary AP subunits.
Furthermore, we discovered one important regulatory protein that links the functions of AP-1, AP-2 and AP-4 in plant, the Arabidopsis P34. In humans, P34/AAGAB controls the sequential assembly of AP-1 and AP-2, but not that of AP-342, and it is still unclear whether P34 regulates AP-4 or AP-5. The Arabidopsis P34 positively regulated the stability of AP-1 and AP-2, whereas the AP-3 stability remained unchanged in the p34 knockout mutants, consistently with the results in human cells. In Arabidopsis, P34 also interacted with the AP-4 subunits (AP4E, AP4M and AP4S) and the AP4M protein was significantly reduced in the p34 mutant. In contrast, P34 did not co-purify with TPC, implying that in plants it directly regulates the protein stability of the three clathrin-associated AP complexes, AP-1, AP-2 and AP-435 but not that of AP-3 and TPC. Therefore, P34 might be a regulator of multiple clathrin-mediated vesicle trafficking pathways in Arabidopsis. Although debatable, some evidence exists that the activities of clathrin-dependent post-Golgi trafficking and CME are highly coordinated in plant cells52,66. Recently, the recruitment of several endocytic components to the PM, including CLC1, CHC1, AP2M, AP2S, TPLATE and TML, was shown to be reduced in the ap1m2 mutant, but their protein levels to remain unchanged52.
Similarly, in mutants defective in AP-2 and TPC-dependent CME, the clathrin and AP-1 recruitment to the TGN/EE as well as exocytosis are significantly impaired52. As the impaired P34 function strongly affected the protein levels of the AP-1, AP-2, AP-4 subunits and probably other CME components we hypothesized that multiple trafficking pathways would be affected in the p34 mutant. Indeed, as predicted, the internalization of the lipophilic PM tracer dye FM4-64 was significantly delayed in the p34 mutant and the localization of the TGN/EE-resident protein SYP61 was altered similarly to that in ap1m252, suggesting that P34 regulates the trafficking pathways controlled by the AP-1 and AP-2. Why SYP61 is mistargeted to the PM when the AP-1 function is impaired remains to be determined, but in absence of degradation, SYP61might be assumed to be targeted by default to the PM. PIN2 polarization and recycling from BFA-sensitive endosomes was also defective in p34. Previously, modification of the PIN2 polar localization in the cells of staminal filaments of ap2m-111, and decrease in the recycling of PIN2 from the BFA-sensitive endosome in mutants of AP-1 and AP-2 subunits have been shown9,52. In addition, a more diffuse endosomal KNOLLE signal was observed in p34, reminiscent of KNOLLE localization in ap1m2-18. The lack of ectopic KNOLLE localization at the post-cytokinetic cell wall insertion site indicates that p34 is a weaker mutant than ap1m2, without impact on sterol- and TPC-dependent endocytosis53,67. Consistently, the secretory marker secRFP was correctly transported to the apoplast in p34, but was impaired in the ap1m2 mutants7,52. Previously, AP-1 and AP-4 have been reported to localize in different subdomains of TGN/EE23, and to initiate secretory and vacuolar trafficking from different subregions of TGN/EE5. P34 directly regulated the function of AP-4, because the TGN/EE-resident protein MTV1 that requires AP-4 function for its loclaization23, was mislocalized and mostly remained cytosolic in p34. The differences between the p34 and ap1 mutants might therefore be linked to the TGN integrity that might be more affected in ap1 than in p34.
In summary, the generated AP interactome provides useful resources to discover unknown regulators or co-operators of the AP complexes that might be unique to plant cells or have a common function in all eukaryotic cells, such as AAK1, P34, SPG11, and SPG15. Our findings identified P34 as a regulator of clathrin-mediated post-Golgi transport and CME by abundance maintenance of the AP-1, AP-2 and AP-4 complexes in plant cells. Which factors regulate the stability and possibly the assembly of TPC, AP-3 and AP-5 in Arabidopsis remains to be determined.
Methods
Plant material and growth conditions
Arabidopsis thaliana (L.) Heynh., accession Columbia-0, plants were used for all experiments. Arabidopsis seeds were sown on half-strength Murashige and Skoog (½MS) agar plates without sucrose or in liquid ½MS without sucrose and vernalized at 4°C under dark conditions for 3 days. Seeds were germinated and grown at 22°C and a 16-h light/8-h dark photoperiod for 5, 7 or 9 days, according to the experimental purposes. For P34-inducible CRISPR editing experiments, seeds were germinated and grown directly on ½MS containing either DMSO or 10 μM β-estradiol at 22°C and a 16-h light/8-h dark photoperiod for 5, 7 or 9 days. Transgenic Arabidopsis lines expressing p35S:GFP/Col-068, pAP1M2:AP1M2-GFP/ap1m2-169, pAP2S:AP2S-GFP/ap2s15, pAP2M:AP2M-GFP/ap2m-216, pMTV1:MTV1-GFP/Col-023, pMTV1:MTV1-GFP/ap4b-123, pAP4M:AP4M-GFP/ap4m-270, pAP3B:AP3B-GFP/pat2-118, pSYP61:SYP61-CFP71, pVHAa1-VHAa1-mRFP72, p35S:secRFP51, pPIN2:PIN2-GFP37, ap2m-216 and ap4m-270 have been previously described. Wild type tobacco (Nicotiana benthamiana) plants were grown in the greenhouse under a normal 14-h light/10-h dark regime at 25°C.
Rosette area measurements
Four-week-old plants grown in soil in multipot trays were imaged. The total leaf area of individual plants was selected by means of the ImageJ colour threshold tool. Per genotype, 8-9 seedlings were planted randomly to exclude position effects. The experiments were repeated three times independently. The rosette area from a total of 24-25 plants per genotype was measured.
Generation of constructs and transformation
For the entry clones, genomic DNA of Arabidopsis AP1G1, AP1G2, AP1S1, AP2S, AP3B, AP4E, AP4S, AP5B, AP5M, P34, BAG4, AAK1, SH3P1, NECAP-1, ECA1, ECA4 and CAP1 were cloned into a Gateway entry vector pDONR221 with a BP reaction. For the TAP-MS and AP-MS constructs, the above genes were fused N-terminally or C-terminally to the GSTEV or GSrhino TAP tag under control of the 35S promoter by subcloning the entry clones into pKCTAP or pKNGSrhino/pKNGSTAP73 with a Gateway LR reaction. For p35S:AAK1-GFP, p35S:BAG4-GFP, p35S:P34-GFP transgenic Arabidopsis, the genomic DNA of AAK1 and P34 and the cDNA of BAG4 were first cloned into pDONR221, then subcloned into the binary vector pK7FWG273 by a LR reaction and finally transformed into Arabidopsis Col-0 by floral dip. For the co-IP experiments, entry clones of AP3B, AP4E, AP5B and AP5M were subcloned into pK7FWG273 to generate the p35S:AP3B-GFP, p35S:AP4E-GFP, p35S:AP5B-GFP and p35S:AP5M-GFP constructs or subcloned into pH7RWG273 to generate the p35S:AP5B-RFP and p35S:AP5M-RFP constructs. Genomic DNA of SPG11 and SPG15 were cloned into p35S:GFP-pGGK vector by Gibson assembly using SalI cutting site to generate the p35S:SPG11-GFP and p35S:SPG15-GFP constructs. p35S:GFP-pGGK was created by the Golden Gate system with pGG-A-35SP-B, pGG-B-Linker-C, pGG-C-GFP-D, pGG-D-35ST-G and pGGK-AG. For the p35S:P34-mCherry construct, cDNA of P34 was cloned into pGGB000 and subcloned into the backbone vector pFASTRK-AG and pGG-AG-KmR by the Golden Gate system with pGG-A-35SP-B, pGG-C-mCherry-D or pGG-C-GFP-D and pGG-D-35ST-G74. To generate the pP34:gP34-GFP construct, the promoter (1812 bp) and genomic DNA (2035 bp) of P34 were cloned into the pDONR P4-P1r and pDONR221 vectors, respectively, and then subcloned into pH7m34GW vector with pDONR P2R-P3-EGFP by means of the MultiSite Gateway system. The rescued lines were generated by transforming the pP34:gP34-GFP construct into p34-1(-/+) and p34-3(Δ/-) plants by floral dip.
For the CRISPR/Cas9 constructs, two gRNAs that targeted the first and the last exon of P34 were designed with the ‘CCtop’ software (https://cctop.cos.uni-heidelberg.de:8043/)75. The two gRNAs (Supplementary Table 4) were cloned into the entry vectors pGG-C-AtU6-26-BbsI-ccdB-BbsI-D and pGG-D-AtU6-26-BbsI-ccdB-BbsI-E74. The CRISPR/Cas9 expression construct was generated by assembling the entry clones with pGG-A-linkerIII-C, pGG-E-linker-G76, into the backbone vector pFASTRK-Atcas9-AG49 with the Golden Gate reaction. For the inducible CRISPR construct, the entry clones of the gRNAs and pGG-A-linkerIII-C, pGG-E-linker-G were first cloned into the pEN-R2-AG-L377 with the Golden Gate reaction. The resulting pEN-R2L3-gRNA constructs were then subcloned with pEN-R4-RPS5A-XVE-L165 and p221z-CAS9p-tagRFP into the pK8m43GW binary vector by a Multisite Gateway reaction. The CRISPR and inducible CRISPR expression constructs were then transformed into Col-0 by floral dip. For genotyping, the genomic DNA sequence of P34 of the transgenic plants were amplified by PCR with the primers listed in the Supplementary Table 4.
For the rBiFC assay78, cDNA of BAG4, P34, AAK1, AP1M2, AP4M, AP5M, AP5Z, AP5B, FH6, KNOLLE and BIN2 were first cloned into pDONR-p3p2 or pDONR-p1p4 to generate the entry clones. The entry clones were then subcloned with pDONR-p3p2-AP2S, pDONR-p3p2-AP1G1 or pDONR-p3p2-AP2A1, pDONR-p3p2-AP12B1 and pDONRp3p2-AP2M13 d pBiFC-2in1-NN, pBiFC-2in1-CN, pBiFC-2in1-NC or pBiFC-2in1-CC78 by Multisite Gateway cloning. All primers used for cloning are listed in the Supplementary Table 4.
Chemical Treatments
β-estradiol (Sigma-Aldrich, 20 Mm stock in DMSO), BFA (Sigma-Aldrich, 50 mM stock in DMSO), CHX (Merck, 50 mM stock in DMSO), and FM4-64 (Invitrogen, 2 Mm stock in water), were used at the concentrations indicated. For the BFA washout, seedlings were first treated with cycloheximide (CHX) (50 μM, 1 h) and then with CHX (50 μM) and Brefeldin A (BFA) (50 μM) for 30 min. Seedlings were washed with media containing CHX (50 μM) and imaged 100 min after the wash.
rBiFC analysis and quantification
For rBiFC assay, the Agrobacterium tumefaciens strain C58 carrying the 2in1 constructs78 were co-infiltrated with a p19-carrying strain into Nicotiana benthamiana leaves and incubated in the greenhouse for 2 days. Afterwards, infiltrated leaves were observed either with an SP8 (Leica) or Fluoview1000 (Olympus) confocal microscope. The rBiFC analysis was quantified by means of 8-bit greyscale images containing fewer than 1% saturated pixels. The PM was outlined with the selection brush tool in Fiji and the mean intensity of the selected region of interest was calculated in both channels to generate an YFP/RFP ratio per cell. All rBiFC combinations tested are listed in Supplementary Table 2.
Tandem affinity purification, single-step affinity purification and proximity labelling experiments
All GSTEV and GSrhino TAP tag fusion constructs were transferred to the Agrobacterium tumefaciens C58C1 strain pMP90 for transformation into the PSB-D Arabidopsis cell culture. The transformed Arabidopsis cells were cultured and harvested, followed by protein complex purification and LC-MS/MS identification of the purified proteins57. For proximity biotinylation experiments36, AP2M and TML were combined C-terminally with TurboID and a 65-amino-acid linker sequence in between36. Arabidopsis cells were transformed according to the procedure for the TAP purifications. Biotinylated proteins were purified and identified by growing the cell cultures at 28°C, incubating them for 24 h with 50 μM exogenous biotin, extracting the proteins under very harsh conditions (100 mM Tris [pH 7.5], 2% [w/v] SDS and 8 M Urea) and a two-step elution, followed by LC-MS/MS analysis on a Q Exactive (Thermo Fisher Scientific). Protein sequences were aligned with CLC (Qiagen CLC Main Workbench 8.1) software and gene accession numbers are listed in Supplementary Table 5.
TAP-MS, AP-MS and PL-MS analysis and background filtering
Two and three replicates were done for TAP and single-step AP, respectively. After each set of two TAP or three AP purifications, the identified protein list was filtered versus a list of nonspecific proteins, assembled from a large dataset of TAP-MS or AP-MS experiments72. All proteins appearing with three or more bait groups in the large dataset were included in a list of nonspecific proteins. For each TAP-MS set of two experiments to be analysed, the background was marked in the list of the copurified proteins. To prevent that true interactors were filtered out because of their presence in the list of nonspecific proteins, the ratio was calculated of the average normalized spectral abundance factors (NSAFs) of the identified proteins in the bait pull-downs versus the corresponding average NSAFs in a large control set of pull-downs. Proteins identified with at least two peptides in at least two experiments, which did not occur in the background list, or showed a high (at least 20-fold) enrichment versus the large dataset of TAP experiments, were retained. Identifications without high enrichment versus the large dataset were removed, unless they were present in one of the other TAP-MS experiment sets. For each AP-MS set of three experiments to be analysed, the same approach was followed, additionally with a Student’s t test. Identifications with a high (NSAF ratio ≥ 10) and significant (-log(P value) ≥ 10) enrichment versus the large control AP-MS dataset were retained. The PL-MS data were filtered by comparison with a PL-MS control dataset built from experiments done under the same conditions. Identifications with enrichment score ≥ 20 were considered enriched, namely enrichment score (ES) = NSAF ratio x -log(P value). Protein interactions were visualized in networks with the Cytoscape v3.7.2 software using the input in Supplementary Table 1 or in a dot plot matrix with ProHits-viz79.
Gene set enrichment analysis
Gene set enrichment was analysed with ShinyGO v0.741:Gene Ontology Enrichment Analysis + more (http://bioinformatics.sdstate.edu/go/)80 in Arabidopsis with a P value cut-off (false discovery ratio [FDR]) = 0.05 and the top 30 pathways. The networks of enriched GO terms were visualized with the Cytoscape v3.7.2 software. Two terms were connected when they shared 20% or more genes. The fold change of each term was indicated by the size of the nodes and the number of shared genes between two terms was indicated by the line thickness.
Immunohistochemistry
Immunolocalizations were carried out on 7-day-old or 9-day-old seedlings grown on ½MS medium containing 10 μM β-estradiol by means of the immuno-robot InsituPro Vsi II (Intavis)81. In brief, the samples were fixed by paraformaldehyde (4% [v/v]) in phosphate-buffered saline (PBS) for 1 h in vacuum. After fixation, the samples were transferred to the robot and subsequently subjected to 6 washes (3 times in PBS, pH 7.4, and 0.1% [v/v] Triton X-100 [PBS-T] and 3 times in distilled water with 0.1% [v/v] Triton X-100; 5 min each), cell wall digestion (1.5% [w/v] driselase in PBS, for 30 min at 37°C), 3 washes (PBS-T, for 5 min), permeabilization (3% [v/v] NP-40, 10% [v/v] DMSO in PBS; for 30 min at room temperature), 3 washes (PBS-T, for 5 min), blocking solution (3% [w/v] bovine serum albumin in PBS, for 1 h at 37°C), primary antibody solution (primary antibodies diluted in blocking solution, for 4 h at 37°C), 5 washes (PBS-T, for 5 min), secondary antibody solution (secondary antibodies diluted in blocking solution, for 3 h at 37°C), 5 washes (PBS-T, for 5 min); when 4′, 6-diamidino-2-phenylindole (DAPI) staining was needed, samples were incubated in 1 μl DAPI in stock with 5 ml distilled water for 15 min, followed by 5 washes with distilled water for 5 min. The dilutions of the primary antibodies were: rabbit α-PIN2 (1:600)82, mouse α-Tubulin (Sigma-Aldrich, T5168) (1:1000), rabbit α-Knolle (1:1000)49 (kind gift from Dr. Gerd Jürgens) and of the secondary antibodies: AlexaFluor488 goat α-mouse (1:600) (A-11001, Thermo Fisher Scientific) and AlexaFluor555 donkey α-rabbit (1:600) (A-31572, Thermo Fisher Scientific). The DAPI (D9542, Sigma-Aldrich) stock concentration was 1 mg/ml.
Gravitropic responses
Five-day-old Col-0, p34iCRISPR-1 and p34iCRISPR-2 seedlings, light-grown vertically on medium supplemented with DMSO or 10 μM β-estradiol, were gravistimulated by a 90° rotation. The angle of the root tips deviating from the vertical plane was measured with the ImageJ (http://rsb.info.nih.gov/ij/) software 24 h after gravistimulation. Gravicurvature was quantified in two independent experiments with in total 61 to 74 roots. All gravitropically stimulated roots were assigned to a gravitropism diagram by an online tool (https://rmtrane.shinyapps.io/RootNav/).
Quantitative RT-PCR
RNA was extracted from 9-day-old seedlings with the ReliaPrep™ RNA Miniprep Systems (Promega). Of purified RNA, 1 μg was amplified in a reverse transcriptase reaction with the qScript XLT 1-Step RT-PCR Kit (Quantabio). Subsequently, qPCR was run with the SYBR Green master mix (Roche) with gene-specific primers designed to amplify AP1G1, AP2S, AP2A1, AP3B and AP4M. ACTIN2 was used as the normalization reference. Primers are listed in the Supplementary Table 4.
Embryo analysis
Observation of embryogenesis was performed as previously described83. In brief, flowers of Col-0 and p34-2(+/-) plants were self-pollinated. Fresh ovules were dissected from siliques at 6, 7, and 14 DAP and cleared in Hoyer's solution (24 g of chloral hydrate with 9 ml ultrapure water and 3 ml of glycerol). The cleared ovules were observed under Olympus BX51 microscope with differential interference contrast (DIC) optics.
Protoplast isolation and transfection
Arabidopsis protoplasts were isolated from 14-day-old seedlings as previously described84. Briefly, ap4m-2 mutant seedlings were cut into strips in the TVL buffer (50 mM CaCl2 and 0.3 M sorbitol) and then digested in the enzyme buffer (0.5 M sucrose, 20 mM CaCl2, 40 mM KCl, 1% [w/v] Cellulase R-10, 1% [w/v] Macerozyme R-10, and 10 mM MES at pH 5.7) with gentle shaking for 16 h in the dark. The protoplasts were harvested by centrifugation at 100 × g for 7 min and washed twice with W5 buffer (0.1% [w/v] glucose, 0.08% [w/v] KCl, 0.9% [w/v] NaCl, 1.84% [w/v] CaCl2, and 2 mM MES at pH 5.7). Then the protoplasts were transfected with p35S:p34-GFP or p35S:GFP using PEG solution (40% [w/v] PEG 4000, 0.2 M mannitol and 0.1 M CaCl2) and then incubated at room temperature for 15 min in the dark. The transfection was stopped by adding W5 buffer. The protoplasts were pelleted by centrifugation at 100 × g for 3 min and resuspended gently in W5 buffer. The protoplasts were then transferred into multi-well plates and incubated in the dark overnight at room temperature.
Co-IP assay
For co-IP, seven-day-old Arabidopsis seedlings were harvested and ground into powder with liquid nitrogen. The powder was resuspended in extraction buffer (50 mM Tris-HCl, pH 7.5, 150 mM NaCl, 0.5% [v/v] NP-40, and complete EDTA-free protease inhibitor cocktail [Roche]).
For co-IP in tobacco, Agrobacterium cultures carrying the indicated constructs were resuspended in infiltration buffer (10 mM MgCl2, 10 mM methyl ethyl sulfide, pH 5.6, 100 μM acetosyringone) and incubated at room temperature for 2 h. The bacterial cultures were adjusted to a final OD600 = 0.5 for each construct and infiltrated into tobacco leaves. Tobacco leaves were harvested 3 days after inoculation and ground into powder with liquid nitrogen and then resuspended in extraction buffer (150 mM Tris-HCl, pH 7.5, 150 mM NaCl, 10% [v/v] glycerol, 10 mM EDTA, 1% [v/v] NP-40, and complete EDTA-free protease inhibitor cocktail [Roche]). The extracts were centrifuged at 20,000 × g at 4°C for 15 min twice. The supernatants were incubated with GFP-trap magnetic agarose (Chromotek) at 4°C for 2 h. Beads were washed three times with 1 ml wash buffer (20 mM Tris-HCl, pH 7.5, 150 mM NaCl, 0.25% [v/v] NP-40] followed by SDS-PAGE analysis.
SDS-PAGE and immunoblotting
Total protein extracts were obtained by grinding the plant materials into a fine powder with liquid nitrogen. The powder was resuspended in extraction buffer (50 mM Tris-HCl, pH 7.5, 150 mM NaCl, 0.5% [v/v] NP-40, and complete EDTA-free protease inhibitor cocktail [Roche]). The extracts were centrifuged at 20,000 × g at 4°C for 15 min twice. The protein extracts were boiled in sample buffer (1× NuPAGE™ LDS sample buffer, 1× NuPAGE® Reducing Agent [Thermo Fisher Scientific]) for 10 min at 90°C and loaded on a 4–20% (w/v) Mini-PROTEAN® TGX™ Precast Protein Gels (Bio-Rad). The proteins were separated by electrophoresis and blotted onto a membrane with trans-Blot Turbo Mini 0.2 μm Nitrocellulose Transfer Packs (Bio-Rad). Membranes were blocked overnight at 4°C in 3% (w/v) skimmed milk dissolved in 25 mM Tris-HCl (pH 8), 150 mM NaCl and 0.05% (v/v) Tween20. The blots were then incubated at room temperature with the monoclonal α-GFP antibody (1:5000) (Miltenyi Biotec, 130-091-833), α-RFP antibody (1:5000) (ChromoTek, α-RFP antibody [6G6]), α-AP2S antibody85 (1:500), α-AP2A antibody86 (1:2000), α-AP1G antibody87 (1:2000), α-tubulin antibody (Sigma-Aldrich, T5168) (1:2000), α-CHC antibody (1:2000) (Santa Cruz, sc-57684) and α-TPLATE antibody (1:500)88. The secondary antibodies are ECL α-Rabbit IgG (Amersham, NA934V) (1:10000), ECL α-Mouse IgG (Amersham, NXA931V) (1:10000). The blots were imaged and analysed by Image Lab Software 3.0 (Bio-RAD).
ICE analysis
The Sanger trace data of 9-day-old p34iCRISPR-1 and p34iCRISPR-2 plants were analysed with the online ICE Analysis Tool v3.0 (https://ice.synthego.com/). The percentage of genomic DNA sequences that contain an insertion or deletion in the sample is represented by indel %, whereas the knockout score corresponds with the proportion of sequences that will probably result in a functional protein knockout.
Confocal microscopy and image quantification
All the confocal images, except Extended Data Fig. 7, were acquired with a Leica SP8X confocal microscope with application of the gating system (0.3 – 6 ns) for autofluorescence removal. GFP, YFP, RFP and FM4-64 were excited by white laser. The excitation and detection window settings were: GFP, 488/500-530 nm; YFP, 514/525-555 nm; RFP; 561/600-650 nm; and FM4-64; 515/570–670 nm. CFP was excited by diode at 405 nm and collected at 460-500 nm. Confocal images in Extended Data Fig. 6d were acquired with an inverted Olympus Fluoview1000 confocal by means of line sequential imaging at a resolution of 512×512 pixels, 8 μs/pixel scan speed, 4× line averaging, one-way scan direction, and an UPSLAPO 60x water immersion corrected lens (numerical aperture =1.20). The YFP and RFP channels were imaged with a 515-nm laser line from an argon laser (85% intensity) and a 559-nm solid state laser (10% intensity) and emission windows between 530 nm and 548 nm and between 580 nm and 615 nm, respectively. Confocal images in Fig. 6c,d and Extended Data Fig. 10b were acquired with a Zeiss LSM710 confocal laser scanning microscope equipped with a 40× water-corrected objective for detection of Alexa488 (488/500-545 nm), Alexa555 (561/555-610 nm) and DAPI (358/461 nm). For BFA body size and BFA body number analyses (Fig. 6e) and for visualization of PIN2-GFP in vacuoles after dark treatment (Extended Data Fig. 10c) four images of root epidermal cells each with a 2.5-μm Z axis distance, were taken and stacked together before quantification89. The fluorescent PM intensity and intracellular space were measured with ImageJ for the quantification of the FM4-64 uptake and the SYP61-CFP and VHAa-RFP signals. The relative fluorescent cytoplasm/PM intensity was calculated. The MTV1 signal was quantified by measurement of the skewness of the signal distribution23. Images were analysed by means of Fiji90 that was used to rotate and crop images.
Statistical analysis
All statistical analyses were done with the GraphPad Prism v.8 software. The rBiFC data statistics were done with Brown-Forsythe and Welch analysis of variance (ANOVA) tests with Dunnett T3 multiple comparisons. For the statistical analysis of the protein levels, two-way ANOVA was utilized and followed by Sidak multiple comparison test in the comparison procedure. The other multiple comparisons were done by one-way ANOVA with Dunnett’s multiple comparisons test.
Extended Data
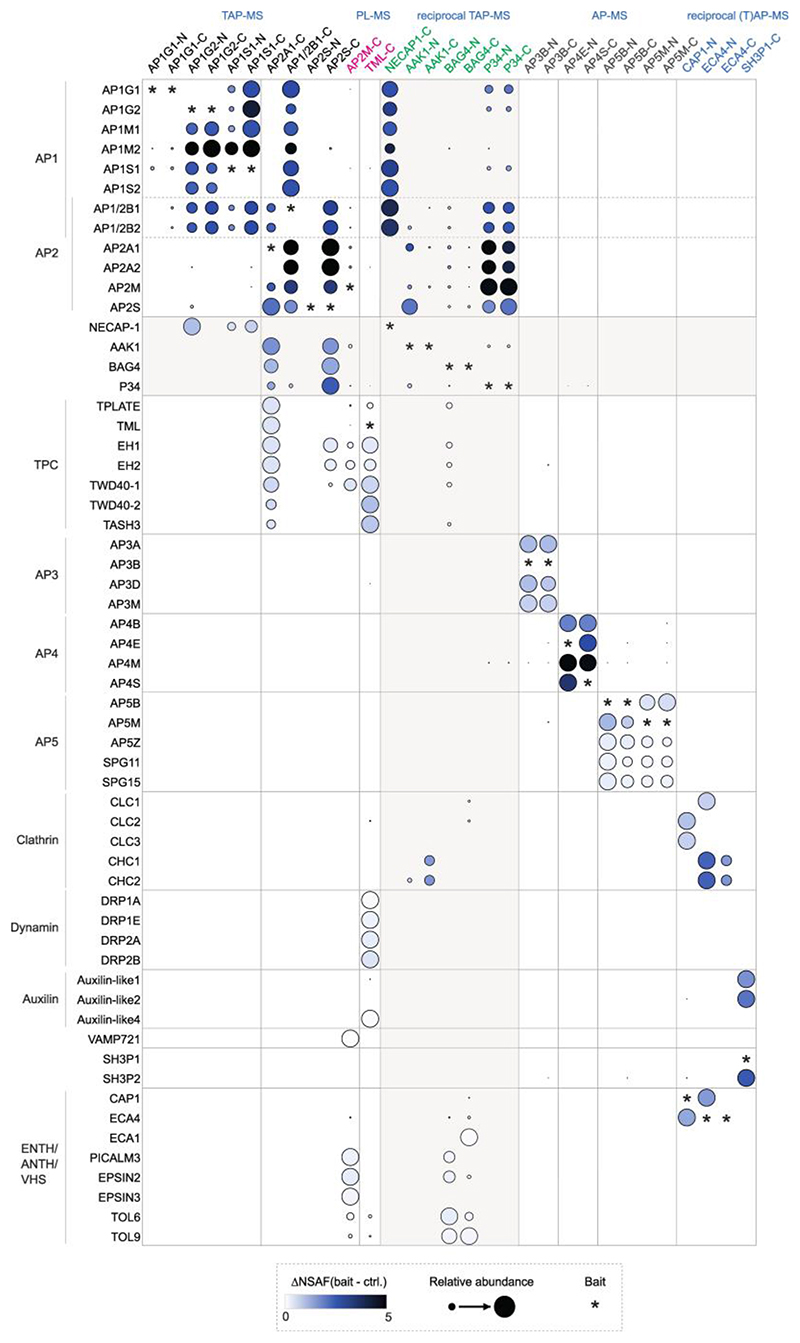
Extended Data Fig. 1. Dot plot matrix of selected proteins from the AP/TPC interactome.
Quantitative dot plot matrix covering core AP/TPC subunits and a selection of proteins linked to endocytosis/vesicle trafficking. The colour hue of the nodes corresponds with the abundance of each prey in a given experiment, calculated by subtracting the average normalized spectral abundance factor (NSAF) in the control dataset from the average NSAF (bait) of each prey [NSAF (bait - ctrl.)]. The size of the dots reflects the relative abundance of each prey over the different experiments. The identification of each bait protein is shown by an asterisk.
Extended Data Fig. 2. Protein sequence alignment of P34 in eukaryotes.
Amino acid sequence alignment of the P34/AAGAB family in At, Arabidopsis thaliana; Hs, Homo sapiens; Mm, Mus musculus; Ce, Caenorhabditis elegans; Sc, Saccharomyces cerevisiae; Dm, Drosophila melanogaster. The sequences were aligned with the CLC Main Workbench (Qiagen). The colour intensity reflects how conserved a particular position is in the alignment. Dark orange and dark purple represents 100% and 0% identity, respectively.
Extended Data Fig. 3. Protein sequence alignment of AAK1 in eukaryotes.
Amino acid sequence alignment of the NAK family in At, Arabidopsis thaliana; Hs, Homo sapiens; Mm, Mus musculus; Dm, Drosophila melanogaster; Ce, Caenorhabditis elegans, and Sc, Saccharomyces cerevisiae. The sequences were aligned with CLC Main Workbench (Qiagen). The colour intensity reflects how conserved the particular position is in the alignment. Dark orange and dark purple represent 100% and 0% identity, respectively.
Extended Data Fig. 4. rBiFC analysis of AP-5, AAK1 and BAG4.
rBiFC assay of AP-5 subunits (a), AAK1 (b) and BAG4 (c) with different AP subunits quantified in Fig. 4b,e,h, respectively. Scale bars, 20 μm.
Extended Data Fig. 5. rBiFC and co-immunoprecipitation (co-IP) analyses of P34.
rBiFC assays of P34 with different AP subunits (quantified in Fig. 4k) (a,b), with AAK1 and BAG4 (d). c,e, Quantification of rBiFC (YFP/RFP) in (b) and (d), respectively. n = 15, n, number of cells analysed. The significant differences were determined by one way Brown-Forsythe and Welch ANOVA tests combined with Dunnett T3 multiple comparisons test. **P ≤ 0.01, ***P ≤ 0.001; ns, not significant. The bounds of the boxes represent the 25th to 75th percentiles, the center line of the box and the whiskers indicate the median, the minimum and the maximum values, respectively. All individual values were plotted. rBiFC experiments were repeated twice and one representative experiment is shown. Scale bars, 50 μm. f, Validation of the interactions between P34, AP3B, and AP4E by co-IP in tobacco leaves transiently expressing the p35S:P34-mCherry, p35S:AP3B-GFP and p35S:AP4E-GFP constructs. g, co-IP analysis in ap4m-2 protoplasts transiently expressing p35S:P34-GFP. P34-GFP was pulled down with a GFP-trap and AP1G and AP2A were detected with the α-AP1G and α-AP2A antibodies.
The p35S:GFP construct was used as a negative control (f,g), The two western blots were repeated two times. One representative experiment is shown.
Extended Data Fig. 6. BiFC analysis of NECAP-1 and the putative AP2M cargos discovered by PL-MS.
a, rBiFC assay of NECAP-1 with different AP-1 and AP-2 subunits. Scale bars, 50 μm. b, Cytoscape model summarizing the interactions between various subunits and NECAP-1. Edge colours indicate the analysis method. Node colours correspond to the different complexes and protein families, red and blue, for AP-1 and AP-2, respectively. c, Quantification of rBiFC (YFP/RFP) in (a). rBiFC experiments were repeated twice and one representative experiment is shown. n = 15. d, rBIFC assay of AP2M interaction with KNOLLE and FORMIN-LIKE PROTEIN 6 (FH6), observed by PL-MS with AP2M as bait. The SHAGGY-like kinase BIN2 was used as negative control. Whereas AP2M interacts with KNOLLE evenly along the plasma membrane, the interaction between AP2M and FH6 is less intense and concentrated in plasma membrane-associated punctate. AP2M and BIN2 do not visually interact and only background and chlorophyll fluorescence are observed. e, Quantification of rBiFC (YFP/RFP PM intensity ratio) in (d) clearly shows significant differences between AP2M-KNOLLE and AP2M-BIN2. The punctate signal in the AP2M-FH6 combination is not sufficiently strong to yield a statistical difference compared to the control. n, number of cells analysed (c,e). The significant differences (c,e) were determined by one way Brown-Forsythe and Welch ANOVA tests with Dunnett T3 multiple comparisons test. ***P < 0.001; ns, not significant. The bounds of the boxes represent the 25th to 75th percentiles, the center line of the box indicates and the whiskers indicate the median, the minimum and the maximum values, respectively. All individual values were plotted. Scale bar, 50 μm.
Extended Data Fig. 7. Genotype of the P34-CRISPR lines.
a, Schematic representation of the CRISPR editing on the P34 gene in the p34 CRISPR mutants. Blue, red, and green indicate insertion, nucleotide exchange, and mutated amino acids, respectively. The arrows mark the sites of the guide RNA (gRNA) sequences. b, Protein sequence alignment of P34 (wild type, Col-0) and P34(Δ) by means of the CLC Main Workbench (Qiagen). Hyphen and green letters indicate deletion and mutated amino acids, respectively. Asterisks mark the stop codons.
Extended Data Fig. 8. Phenotype of the P34-CRISPR lines.
a, Rosettes of wild type (Col-0), p34-1(+/-), p34-2(+/-),p34-3(Δ/-), p34-3(Δ/Δ) mutants, and p34-1(-/-) (lines #9 and #12) and p34-3(Δ/-) (lines #4 and #5) mutants complemented with the pP34:gP34-GFP construct grown in the soil for 4 weeks. Scale bar, 20 mm. b, Quantification the rosette leaf area of each genotype show in (a). Three independent experiments were combined, each with 8-9 plants per genotype. ***P ≤ 0.001 (one-way ANOVA test); ns, not significant. The bounds of the boxes represent the 25th to 75th percentiles, the center line of the box and the whiskers indicate the median, the minimum and the maximum values, respectively. All individual values were plotted. c, Aborted seeds in the siliques of genotypes in (b). Arrows indicate the aborted seeds. d, Quantification of the aborted seeds in (c). χ2 values were calculated with the χ2 test. n number of seeds analysed. e, Embryogenesis of the wild type and the p34-2(+/-) mutant. Differential interference contrast (DIC) microscopy of cleared whole-mount seeds at 6, 7 and 14 DAP (days after pollination). The ratio indicates the ratio of observed embryo stage/total embryos. Scale bars, 20 μm. The quantification data are combined from two experiments. Representative images from one experiment are shown. f, Phenotype of 7-day-old seedlings grown on ½MS. Scale bar, 10 mm. g, Primary root length of seedlings shown in (f). All the individual values were plotted and the center line represents the median. Twenty roots per genotype were measured. ***P ≤ 0.001 (one-way ANOVA test).
Extended Data Fig. 9. CRISPR efficiency and different phenotypes of the p34 mutants.
a, Gene editing efficiency analysis of three random 9-day-old plants of p34iCRISPR-1 and p34iCRISPR-2 after induction with 10 μM β-oestradiol (Est). The sequencing results were analysed with the online software Inference of CRISPR Edits (ICE) (https://ice.synthego.com/#/). b, P34-GFP localization in roots of 5-day-old p35S:gP34-GFP/p34iCRISPR-1 plants grown on DMSO and 10 μM Est. Arrows indicate the remaining P34-GFP signal. Scale bar, 10 μm. c, Protein levels of AP1G, AP2A and AP2S in p34-3 mutants analysed by immunoblotting with α-AP1G, α-AP2S, α-AP2A, α-CHC, α-TPLATE and α-Tubulin, The experiments were repeated three times. One representative experiment is shown. d, Quantification of protein levels shown in (c). The protein level was normalized to tubulin. e, Confocal images of the 5-day-old pP34:gP34-GFP/p34-1(-/-) (line #12) root cells stained with FM4-64 (2 μM, 40 min). Scale bar, 10 μm. The imaging was repeated three times. One representative experiment is shown. f, FM4-64 uptake in the p34-3 mutants. g, Fluorescence intensity ratio of the relative intracellular-to-plasma membrane (PM) FM4-64 signal. All the individual value were plotted and the center line represents the median. ***P ≤ 0.001 (one-way ANOVA test); ns, not significant. The P values versus the Col-0 control for p34(Δ/-) = 0.0004, p34(Δ/Δ) = 0.6980 and ap2m-2 < 0.0001. n = 30, n number of cells analysed, Scale bar, 10 μm.
Extended Data Fig. 10. Vesicular trafficking pathways affected in the p34 mutants.
a, secRFP localization in roots of 5-day-old Col-0 and p34iCRISPR-1 plants grown on DMSO and 10 μM β-oestradiol (Est). b, Immunofluorescence staining of KNOLLE in the root meristem of Col-0, p34iCRISPR-1 and p34iCRISPR-2 plants treated with 10 μM Est. c, PIN2-GFP localization in the roots of 5-day-old Col-0 and p34iCRISPR-1 plants grown on DMSO and 10 μM Est in the dark. d, Percentage of epidermal cells with GFP signals in the vacuoles as shown in (c), Error bars represent SD. e, Morphology of the lytic vacuoles in root cells of 7-day-old Col-0, p34iCRISPR-1 and p34iCRISPR-2 plants grown on DMSO and 10 μM Est. Images were taken after 2 h of staining with 4 μM FM4-64. Scale bars, 10 μm (a-c,e), The imaging of all genotypes was repeated three times. One representative experiment is shown.
Supplementary Material
Acknowledgements
We thank I. Hwang, G. Jürgens and J. Pan for the kind gift of α-AP1G and α-AP2A, α-KNOLLE and α-AP2S antibodies, respectively, M. Sauer, S. Schneider, J. Friml, J. Lin and I. Hara-Nishimura for providing published materials, T. Jacobs for useful discussions and M. De Cock for help in preparing the manuscript. This work was supported by the Research Foundation-Flanders projects (G008416N, G0E5718N and 3G038020 to E.R.), the Belgian Science Policy Office for a postdoctoral fellowship (R.K.), the China Scholarship Council for predoctoral fellowships (P.W., X.Z. and R.W.), and the European Research Council T-Rex (project number 682436 to D.V.D.).
This work was funded by European Research Council (T-Rex project 682436).
Footnotes
Author contributions
W.S., P.W. X.Z. and E.R. initiated the project and designed experiments. W.S., X.Z., R.K., A.H. and N.D.W. did cloning for TAP-MS and AP-MS. D.E., J.V.L., K.G. and G.D.J performed the MS work and analysed data. W.S. and P.W. did the interactome validation. P.W. performed all the P34 work. E.M. did microscopy. R.A.K. and C.T. contributed materials. D.A., M.V. and D.V.D did the proximity labelling. R.W and S.V. performed the PIN2 immunolabelling. W.S., P.W. and E.R. wrote the manuscript. All authors revised the manuscript.
Competing interests
The authors declare no competing interests.
Availability of data and materials
The mass spectrometry proteomics data have been deposited to the ProteomeXchange Consortium via the PRIDE partner repository with the dataset identifier PXD035454 and 10.6019/PXD035454.
Data availability.
The mass spectrometry proteomics data have been deposited to the ProteomeXchange Consortium via the PRIDE partner repository with the dataset identifier PXD035454 and 10.6019/PXD035454.
References
- 1.Kirchhausen T, Owen D, Harrison SC. Molecular structure, function, and dynamics of clathrin-mediated membrane traffic. Cold Spring Harb Perspect Biol. 2014;6:a016725. doi: 10.1101/cshperspect.a016725. [DOI] [PMC free article] [PubMed] [Google Scholar]
- 2.Hirst J, et al. The fifth adaptor protein complex. PLoS Biol. 2011;9:e1001170. doi: 10.1371/journal.pbio.1001170. [DOI] [PMC free article] [PubMed] [Google Scholar]
- 3.Sanger A, Hirst J, Davies AK, Robinson MS. Adaptor protein complexes and disease at a glance. J Cell Sci. 2019;132:jcs222992. doi: 10.1242/jcs.222992. [DOI] [PubMed] [Google Scholar]
- 4.Aniento F, Sánchez de Medina Hernández V, Dagdas Y, Rojas-Pierce M, Russinova E. Molecular mechanisms of endomembrane trafficking in plants. Plant Cell. 2022;34:146–173. doi: 10.1093/plcell/koab235. [DOI] [PMC free article] [PubMed] [Google Scholar]
- 5.Shimizu Y, et al. Cargo sorting zones in the trans-Golgi network visualized by super-resolution confocal live imaging microscopy in plants. Nat Commun. 2021;12:1901. doi: 10.1038/s41467-021-22267-0. [DOI] [PMC free article] [PubMed] [Google Scholar]
- 6.Arora D, Van Damme D. Motif-based endomembrane trafficking. Plant Physiol. 2021;186:221–238. doi: 10.1093/plphys/kiab077. [DOI] [PMC free article] [PubMed] [Google Scholar]
- 7.Park M, et al. Arabidopsis μ-adaptin subunit AP1M of adaptor protein complex 1 mediates late secretory and vacuolar traffic and is required for growth. Proc Natl Acad Sci USA. 2013;110:10318–10323. doi: 10.1073/pnas.1300460110. [DOI] [PMC free article] [PubMed] [Google Scholar]
- 8.Teh O-K, et al. The AP-1 μ adaptin is required for KNOLLE localization at the cell plate to mediate cytokinesis in Arabidopsis. Plant Cell Physiol. 2013;54:838–847. doi: 10.1093/pcp/pct048. [DOI] [PubMed] [Google Scholar]
- 9.Wang J-G, et al. HAPLESS13, the Arabidopsis μ1 adaptin, is essential for protein sorting at the trans-Golgi network/early endosome. Plant Physiol. 2013;162:1897–1910. doi: 10.1104/pp.113.221051. [DOI] [PMC free article] [PubMed] [Google Scholar]
- 10.Xu M, et al. ADAPTOR PROTEIN-1 complex-mediated post-Golgi trafficking is critical for pollen wall development in Arabidopsis. New Phytol. 2022;235:472–487. doi: 10.1111/nph.18170. [DOI] [PMC free article] [PubMed] [Google Scholar]
- 11.Kim SY, et al. Adaptor protein complex 2-mediated endocytosis is crucial for male reproductive organ development in Arabidopsis. Plant Cell. 2013;25:2970–2985. doi: 10.1105/tpc.113.114264. [DOI] [PMC free article] [PubMed] [Google Scholar]
- 12.Di Rubbo S, et al. The clathrin adaptor complex AP-2 mediates endocytosis of BRASSINOSTEROID INSENSITIVE1 in Arabidopsis. Plant Cell. 2013;25:2986–2997. doi: 10.1105/tpc.113.114058. [DOI] [PMC free article] [PubMed] [Google Scholar]
- 13.Liu D, et al. Endocytosis of BRASSINOSTEROID INSENSITIVE1 Is partly driven by a canonical Tyr-based motif. Plant Cell. 2020;32:3598–3612. doi: 10.1105/tpc.20.00384. [DOI] [PMC free article] [PubMed] [Google Scholar]
- 14.Yoshinari A, et al. Polar localization of the borate exporter BOR1 requires AP2-dependent endocytosis. Plant Physiol. 2019;179:1569–1580. doi: 10.1104/pp.18.01017. [DOI] [PMC free article] [PubMed] [Google Scholar]
- 15.Fan L, et al. Dynamic analysis of Arabidopsis AP2 σ subunit reveals a key role in clathrin-mediated endocytosis and plant development. Development. 2013;140:3826–3837. doi: 10.1242/dev.095711. [DOI] [PubMed] [Google Scholar]
- 16.Yamaoka S, et al. Identification and dynamics of Arabidopsis adaptor protein-2 complex and its involvement in floral organ development. Plant Cell. 2013;25:2958–2969. doi: 10.1105/tpc.113.114082. [DOI] [PMC free article] [PubMed] [Google Scholar]
- 17.Feng Q-N, Liang X, Li S, Zhang Y. The ADAPTOR PROTEIN-3 complex mediates pollen tube growth by coordinating vacuolar targeting and organization. Plant Physiol. 2018;177:216–225. doi: 10.1104/pp.17.01722. [DOI] [PMC free article] [PubMed] [Google Scholar]
- 18.Feraru E, et al. The AP-3 β adaptin mediates the biogenesis and function of lytic vacuoles in Arabidopsis. Plant Cell. 2010;22:2812–2824. doi: 10.1105/tpc.110.075424. [DOI] [PMC free article] [PubMed] [Google Scholar]
- 19.Wolfenstetter S, Wirsching P, Dotzauer D, Schneider S, Sauer N. Routes to the tonoplast: the sorting of tonoplast transporters in Arabidopsis mesophyll protoplasts. Plant Cell. 2012;24:215–232. doi: 10.1105/tpc.111.090415. [DOI] [PMC free article] [PubMed] [Google Scholar]
- 20.Zwiewka M, et al. The AP-3 adaptor complex is required for vacuolar function in Arabidopsis. Cell Res. 2011;21:1711–1722. doi: 10.1038/cr.2011.99. [DOI] [PMC free article] [PubMed] [Google Scholar]
- 21.Fuji K, et al. The adaptor complex AP-4 regulates vacuolar protein sorting at the trans-Golgi network by interacting with VACUOLAR SORTING RECEPTOR1. Plant Physiol. 2016;170:211–219. doi: 10.1104/pp.15.00869. [DOI] [PMC free article] [PubMed] [Google Scholar]
- 22.Hatsugai N, et al. Involvement of adapter protein complex 4 in hypersensitive cell death induced by avirulent bacteria. Plant Physiol. 2017;176:1824–1834. doi: 10.1104/pp.17.01610. [DOI] [PMC free article] [PubMed] [Google Scholar]
- 23.Heinze L, et al. EPSIN1 and MTV1 define functionally overlapping but molecularly distinct trans-Golgi network subdomains in Arabidopsis. Proc Natl Acad Sci USA. 2020;117:25880–25889. doi: 10.1073/pnas.2004822117. [DOI] [PMC free article] [PubMed] [Google Scholar]
- 24.Pertl-Obermeyer H, et al. Identification of cargo for adaptor protein (AP) complexes 3 and 4 by sucrose gradient profiling. Mol Cell Proteomics. 2016;15:2877–2889. doi: 10.1074/mcp.M116.060129. [DOI] [PMC free article] [PubMed] [Google Scholar]
- 25.Gadeyne A, et al. The TPLATE adaptor complex drives clathrin-mediated endocytosis in plants. Cell. 2014;156:691–704. doi: 10.1016/j.cell.2014.01.039. [DOI] [PubMed] [Google Scholar]
- 26.Johnson A, et al. The TPLATE complex mediates membrane bending during plant clathrin–mediated endocytosis. Proc Natl Acad Sci USA. 2021;118:e2113046118. doi: 10.1073/pnas.2113046118. [DOI] [PMC free article] [PubMed] [Google Scholar]
- 27.Van Damme D, et al. Somatic cytokinesis and pollen maturation in Arabidopsis depend on TPLATE, which has domains similar to coat proteins. Plant Cell. 2006;18:3502–3518. doi: 10.1105/tpc.106.040923. [DOI] [PMC free article] [PubMed] [Google Scholar]
- 28.Wang J, et al. Conditional destabilization of the TPLATE complex impairs endocytic internalization. Proc Natl Acad Sci USA. 2021;118:e2023456118. doi: 10.1073/pnas.2023456118. [DOI] [PMC free article] [PubMed] [Google Scholar]
- 29.McMahon HT, Boucrot E. Molecular mechanism and physiological functions of clathrin-mediated endocytosis. Nat Rev Mol Cell Biol. 2011;12:517–533. doi: 10.1038/nrm3151. [DOI] [PubMed] [Google Scholar]
- 30.Merrifield CJ, Kaksonen M. Endocytic accessory factors and regulation of clathrin-mediated endocytosis. Cold Spring Harb Perspect Biol. 2014;6:a016733. doi: 10.1101/cshperspect.a016733. [DOI] [PMC free article] [PubMed] [Google Scholar]
- 31.Borner GHH, Harbour M, Hester S, Lilley KS, Robinson MS. Comparative proteomics of clathrin-coated vesicles. J Cell Biol. 2006;175:571–578. doi: 10.1083/jcb.200607164. [DOI] [PMC free article] [PubMed] [Google Scholar]
- 32.Borner GHH, et al. Multivariate proteomic profiling identifies novel accessory proteins of coated vesicles. J Cell Biol. 2012;197:141–160. doi: 10.1083/jcb.201111049. [DOI] [PMC free article] [PubMed] [Google Scholar]
- 33.Praefcke GJK, et al. Evolving nature of the AP2 α-appendage hub during clathrin-coated vesicle endocytosis. EMBO J. 2004;23:4371–4383. doi: 10.1038/sj.emboj.7600445. [DOI] [PMC free article] [PubMed] [Google Scholar]
- 34.Schmid EM, et al. Role of the AP2 β-appendage hub in recruiting partners for clathrin-coated vesicle assembly. PLoS Biol. 2006;4:e262. doi: 10.1371/journal.pbio.0040262. [DOI] [PMC free article] [PubMed] [Google Scholar]
- 35.Dahhan DA, et al. Proteomic characterization of isolated Arabidopsis clathrin-coated vesicles reveals evolutionarily conserved and plant-specific components. Plant Cell. 2022;34:2150–2173. doi: 10.1093/plcell/koac071. [DOI] [PMC free article] [PubMed] [Google Scholar]
- 36.Arora D, et al. Establishment of proximity-dependent biotinylation approaches in different plant model systems. Plant Cell. 2020;32:3388–3407. doi: 10.1105/tpc.20.00235. [DOI] [PMC free article] [PubMed] [Google Scholar]
- 37.Adamowski M, et al. A functional study of AUXILIN-LIKE1 and 2, two putative clathrin uncoating factors in Arabidopsis. Plant Cell. 2018;30:700–716. doi: 10.1105/tpc.17.00785. [DOI] [PMC free article] [PubMed] [Google Scholar]
- 38.Zhang L, et al. SNARE proteins VAMP721 and VAMP722 mediate the post-Golgi trafficking required for auxin-mediated development in Arabidopsis. Plant J. 2021;108:426–440. doi: 10.1111/tpj.15450. [DOI] [PubMed] [Google Scholar]
- 39.Zouhar J, Sauer M. Helping hands for budding prospects: ENTH/ANTH/VHS accessory proteins in endocytosis, vacuolar transport, and secretion. Plant Cell. 2014;26:4232–4244. doi: 10.1105/tpc.114.131680. [DOI] [PMC free article] [PubMed] [Google Scholar]
- 40.Ritter B, et al. NECAP 1 regulates AP-2 interactions to control vesicle size, number, and cargo during clathrin-mediated endocytosis. PLoS Biol. 2013;11:e1001670. doi: 10.1371/journal.pbio.1001670. [DOI] [PMC free article] [PubMed] [Google Scholar]
- 41.Kabbage M, Kessens R, Bartholomay LC, Williams B. The life and death of a plant cell. Annu Rev Plant Biol. 2017;68:375–404. doi: 10.1146/annurev-arplant-043015-111655. [DOI] [PubMed] [Google Scholar]
- 42.Gulbranson DR, et al. AAGAB controls AP2 adaptor assembly in clathrin-mediated endocytosis. Dev Cell. 2019;50:436–446. doi: 10.1016/j.devcel.2019.06.013. [DOI] [PMC free article] [PubMed] [Google Scholar]
- 43.Pohler E, et al. Haploinsufficiency for AAGAB causes clinically heterogeneous forms of punctate palmoplantar keratoderma. Nat Genet. 2012;44:1272–1276. doi: 10.1038/ng.2444. [DOI] [PMC free article] [PubMed] [Google Scholar]
- 44.Conner SD, Schmid SL. Identification of an adaptor-associated kinase, AAK1, as a regulator of clathrin-mediated endocytosis. J Cell Biol. 2002;156:921–929. doi: 10.1083/jcb.200108123. [DOI] [PMC free article] [PubMed] [Google Scholar]
- 45.Agajanian MJ, et al. WNT activates the AAK1 kinase to promote clathrin-mediated endocytosis of LRP6 and establish a negative feedback loop. Cell Reports. 2019;26:79–93. doi: 10.1016/j.celrep.2018.12.023. [DOI] [PMC free article] [PubMed] [Google Scholar]
- 46.Hirst J, et al. Interaction between AP-5 and the hereditary spastic paraplegia proteins SPG11 and SPG15. Mol Biol Cell. 2013;24:2558–2569. doi: 10.1091/mbc.E13-03-0170. [DOI] [PMC free article] [PubMed] [Google Scholar]
- 47.Zhuang X, et al. A BAR-domain protein SH3P2, which binds to phosphatidylinositol 3-phosphate and ATG8, regulates autophagosome formation in Arabidopsis. The Plant Cell. 2013;25:4596–4615. doi: 10.1105/tpc.113.118307. [DOI] [PMC free article] [PubMed] [Google Scholar]
- 48.Lam BCH, et al. Regulation of ADL6 activity by its associated molecular network. The Plant Journal. 2002;31:565–576. doi: 10.1046/j.1365-313x.2002.01377.x. [DOI] [PubMed] [Google Scholar]
- 49.Lauber MH, et al. The Arabidopsis KNOLLE protein is a cytokinesis-specific syntaxin. J Cell Biol. 1997;139:1485–1493. doi: 10.1083/jcb.139.6.1485. [DOI] [PMC free article] [PubMed] [Google Scholar]
- 50.Favery B, et al. Arabidopsis formin AtFH6 is a plasma membrane–associated protein upregulated in giant cells induced by parasitic nematodes. Plant Cell. 2004;16:2529–2540. doi: 10.1105/tpc.104.024372. [DOI] [PMC free article] [PubMed] [Google Scholar]
- 51.Blomme J, et al. The heat is on: a simple method to increase genome editing efficiency in plants. BMC Plant Biol. 2022;22:142. doi: 10.1186/s12870-022-03519-7. [DOI] [PMC free article] [PubMed] [Google Scholar]
- 52.Yan X, et al. Cross-talk between clathrin-dependent post-Golgi trafficking and clathrin-mediated endocytosis in Arabidopsis root cells. Plant Cell. 2021;33:3057–3075. doi: 10.1093/plcell/koab180. [DOI] [PMC free article] [PubMed] [Google Scholar]
- 53.Samalova M, Fricker M, Moore I. Ratiometric fluorescence-imaging assays of plant membrane traffic using polyproteins. Traffic. 2006;7:1701–1723. doi: 10.1111/j.1600-0854.2006.00502.x. [DOI] [PubMed] [Google Scholar]
- 54.Reichardt I, et al. Plant cytokinesis requires de novo secretory trafficking but not endocytosis. Curr Biol. 2007;17:2047–2053. doi: 10.1016/j.cub.2007.10.040. [DOI] [PubMed] [Google Scholar]
- 55.Boutté Y, et al. Endocytosis restricts Arabidopsis KNOLLE syntaxin to the cell division plane during late cytokinesis. EMBO J. 2010;29:546–558. doi: 10.1038/emboj.2009.363. [DOI] [PMC free article] [PubMed] [Google Scholar]
- 56.Law KC, Chung KK, Zhuang X. An update on coat protein complexes for vesicle formation in plant post-Golgi trafficking. Front Plant Sci. 2022;13:826007. doi: 10.3389/fpls.2022.826007. [DOI] [PMC free article] [PubMed] [Google Scholar]
- 57.Van Leene J, et al. An improved toolbox to unravel the plant cellular machinery by tandem affinity purification of Arabidopsis protein complexes. Nat Protoc. 2015;10:169–187. doi: 10.1038/nprot.2014.199. [DOI] [PubMed] [Google Scholar]
- 58.Peden AA, Rudge RE, Lui WWY, Robinson MS. Assembly and function of AP-3 complexes in cells expressing mutant subunits. J Cell Biol. 2002;156:327–336. doi: 10.1083/jcb.200107140. [DOI] [PMC free article] [PubMed] [Google Scholar]
- 59.Rout MP, Field MC. The evolution of organellar coat complexes and organization of the eukaryotic cell. Annu Rev Biochem. 2017;86:637–657. doi: 10.1146/annurev-biochem-061516-044643. [DOI] [PubMed] [Google Scholar]
- 60.Ricotta D, Conner SD, Schmid SL, von Figura K, Höning S. Phosphorylation of the AP2 μ subunit by AAK1 mediates high affinity binding to membrane protein sorting signals. J Cell Biol. 2002;156:791–795. doi: 10.1083/jcb.200111068. [DOI] [PMC free article] [PubMed] [Google Scholar]
- 61.Gupta-Rossi N, et al. The adaptor-associated kinase 1, AAK1, is a positive regulator of the Notch pathway. J Biol Chem. 2011;286:18720–18730. doi: 10.1074/jbc.M110.190769. [DOI] [PMC free article] [PubMed] [Google Scholar]
- 62.Behl C. Breaking BAG: The co-chaperone BAG3 in health and disease. Trends Pharmacol Sci. 2016;37:672–688. doi: 10.1016/j.tips.2016.04.007. [DOI] [PubMed] [Google Scholar]
- 63.Korbei B, et al. Arabidopsis TOL proteins act as gatekeepers for vacuolar sorting of PIN2 plasma membrane protein. Curr Biol. 2013;23:2500–2505. doi: 10.1016/j.cub.2013.10.036. [DOI] [PubMed] [Google Scholar]
- 64.Moulinier-Anzola J, et al. TOLs function as ubiquitin receptors in the early steps of the ESCRT pathway in higher plants. Mol Plant. 2020;13:717–731. doi: 10.1016/j.molp.2020.02.012. [DOI] [PubMed] [Google Scholar]
- 65.Wang P, et al. Plant AtEH/Pan1 proteins drive autophagosome formation at ER-PM contact sites with actin and endocytic machinery. Nat Commun. 2019;10:5132. doi: 10.1038/s41467-019-12782-6. [DOI] [PMC free article] [PubMed] [Google Scholar]
- 66.Adamowski M, Matijević I, Friml J. The role of clathrin in exocytosis and the mutual regulation of endo-and exocytosis in plant cells. bioRxiv. 2021:2021.2011.2017.468992 [Google Scholar]
- 67.Van Damme D, et al. Adaptin-like protein TPLATE and clathrin recruitment during plant somatic cytokinesis occurs via two distinct pathways. Proc Natl Acad Sci USA. 2011;108:615–620. doi: 10.1073/pnas.1017890108. [DOI] [PMC free article] [PubMed] [Google Scholar]
- 68.Zhang C, et al. ROPGAP-dependent interaction between brassinosteroid and ROP2-GTPase signaling controls paveme1nt cell shape in Arabidopsis. Curr Biol. 2022;32:518–531. doi: 10.1016/j.cub.2021.12.043. [DOI] [PubMed] [Google Scholar]
- 69.Shimada T, et al. The AP-1 complex is required for proper mucilage formation in Arabidopsis seeds. Plant and Cell Physiology. 2018;59:2331–2338. doi: 10.1093/pcp/pcy158. [DOI] [PubMed] [Google Scholar]
- 70.Müdsam C, Wollschläger P, Sauer N, Schneider S. Sorting of Arabidopsis NRAMP3 and NRAMP4 depends on adaptor protein complex AP4 and a dileucine-based motif. Traffic. 2018;19:503–521. doi: 10.1111/tra.12567. [DOI] [PubMed] [Google Scholar]
- 71.Robert S, et al. Endosidin1 defines a compartment involved in endocytosis of the brassinosteroid receptor BRI1 and the auxin transporters PIN2 and AUX1. Proc Natl Acad Sci USA. 2008;105:8464–8469. doi: 10.1073/pnas.0711650105. [DOI] [PMC free article] [PubMed] [Google Scholar]
- 72.Dettmer J, Hong-Hermesdorf A, Stierhof Y-D, Schumacher K. Vacuolar H+-ATPase activity is required for endocytic and secretory trafficking in Arabidopsis. Plant Cell. 2006;18:715–730. doi: 10.1105/tpc.105.037978. [DOI] [PMC free article] [PubMed] [Google Scholar]
- 73.Karimi M, Inzé D, Depicker A. GATEWAY™ vectors for Agrobacterium-mediated plant transformation. Trends Plant Sci. 2002;7:193–195. doi: 10.1016/s1360-1385(02)02251-3. [DOI] [PubMed] [Google Scholar]
- 74.Decaestecker W, et al. CRISPR-TSKO: a technique for efficient mutagenesis in specific cell types, tissues, or organs in Arabidopsis. Plant Cell. 2019;31:2868–2887. doi: 10.1105/tpc.19.00454. [DOI] [PMC free article] [PubMed] [Google Scholar]
- 75.Stemmer M, Thumberger T, del Sol Keyer M, Wittbrodt J, Mateo JL. CCTop: an intuitive, flexible and reliable CRISPR/Cas9 target prediction tool. PLoS ONE. 2015;10:e0124633. doi: 10.1371/journal.pone.0124633. [DOI] [PMC free article] [PubMed] [Google Scholar]
- 76.Houbaert A, et al. POLAR-guided signalling complex assembly and localization drive asymmetric cell division. Nature. 2018;563:574–578. doi: 10.1038/s41586-018-0714-x. [DOI] [PubMed] [Google Scholar]
- 77.Hu Z, et al. Genome editing-based engineering of CESA3 dual cellulose-inhibitor-resistant plants. Plant Physiol. 2019;180:827–836. doi: 10.1104/pp.18.01486. [DOI] [PMC free article] [PubMed] [Google Scholar]
- 78.Grefen C, Blatt MR. A 2in1 cloning system enables ratiometric bimolecular fluorescence complementation (rBiFC) Biotechniques. 2012;53:311–314. doi: 10.2144/000113941. [DOI] [PubMed] [Google Scholar]
- 79.Knight JDR, et al. ProHits-viz: a suite of web tools for visualizing interaction proteomics data. Nat Methods. 2017;14:645–646. doi: 10.1038/nmeth.4330. [DOI] [PMC free article] [PubMed] [Google Scholar]
- 80.Ge SX, Jung D, Yao R. ShinyGO: a graphical gene-set enrichment tool for animals and plants. Bioinformatics. 2020;36:2628–2629. doi: 10.1093/bioinformatics/btz931. [DOI] [PMC free article] [PubMed] [Google Scholar]
- 81.Sauer M, Paciorek T, Benková E, Friml J. Immunocytochemical techniques for whole-mount in situ protein localization in plants. Nat Protoc. 2006;1:98–103. doi: 10.1038/nprot.2006.15. [DOI] [PubMed] [Google Scholar]
- 82.Abas L, et al. Intracellular trafficking and proteolysis of the Arabidopsis auxin-efflux facilitator PIN2 are involved in root gravitropism. Nature cell biology. 2006;8:249–256. doi: 10.1038/ncb1369. [DOI] [PubMed] [Google Scholar]
- 83.Feng J, Ma L. A method for characterizing embryogenesis in Arabidopsis. JoVE. 2017;126:e55969. doi: 10.3791/55969. [DOI] [PMC free article] [PubMed] [Google Scholar]
- 84.Zhai Z, Jung HI, Vatamaniuk OK. Isolation of protoplasts from tissues of 14-day-old seedlings of Arabidopsis thaliana. JoVE. 2009;30:e1149. doi: 10.3791/1149. [DOI] [PMC free article] [PubMed] [Google Scholar]
- 85.Wang C, et al. Differential regulation of clathrin and its adaptor proteins during membrane recruitment for endocytosis. Plant Physiol. 2016;171:215–229. doi: 10.1104/pp.15.01716. [DOI] [PMC free article] [PubMed] [Google Scholar]
- 86.Song K, et al. An A/ENTH domain-containing protein functions as an adaptor for clathrin-coated vesicles on the growing cell plate in Arabidopsis root cells. Plant Physiol. 2012;159:1013–1025. doi: 10.1104/pp.112.199380. [DOI] [PMC free article] [PubMed] [Google Scholar]
- 87.Kim Y-W, et al. Arabidopsis dynamin-like 2 that binds specifically to phosphatidylinositol 4-phosphate assembles into a high-molecular weight complex in vivo and in vitro. Plant Physiol. 2001;127:1243–1255. [PMC free article] [PubMed] [Google Scholar]
- 88.Dejonghe W, et al. Disruption of endocytosis through chemical inhibition of clathrin heavy chain function. Nat Chem Biol. 2019;15:641–649. doi: 10.1038/s41589-019-0262-1. [DOI] [PMC free article] [PubMed] [Google Scholar]
- 89.Luo Y, et al. V-ATPase activity in the TGN/EE is required for exocytosis and recycling in Arabidopsis. Nat Plants. 2015;1:15094. doi: 10.1038/nplants.2015.94. [DOI] [PMC free article] [PubMed] [Google Scholar]
- 90.Schindelin J, Rueden CT, Hiner MC, Eliceiri KW. The ImageJ ecosystem: an open platform for biomedical image analysis. Mol Reprod Dev. 2015;82:518–529. doi: 10.1002/mrd.22489. [DOI] [PMC free article] [PubMed] [Google Scholar]
Associated Data
This section collects any data citations, data availability statements, or supplementary materials included in this article.
Supplementary Materials
Data Availability Statement
The mass spectrometry proteomics data have been deposited to the ProteomeXchange Consortium via the PRIDE partner repository with the dataset identifier PXD035454 and 10.6019/PXD035454.
The mass spectrometry proteomics data have been deposited to the ProteomeXchange Consortium via the PRIDE partner repository with the dataset identifier PXD035454 and 10.6019/PXD035454.


