

Abstract
Background.
In mammals, multiciliated cells (MCCs) line the lumen of the trachea, oviduct, and brain ventricles, where they drive fluid flow across the epithelium. Each MCC population experiences vastly different local environments that may dictate differences in their lifetime and turnover rates. However, with the exception of MCCs in the trachea, the turnover rates of these multiciliated epithelial populations at extended time scales are not well described.
Results.
Here, using genetic lineage-labeling techniques we provide a direct comparison of turnover rates of MCCs in these three different tissues.
Conclusion.
We find that oviduct turnover is similar to that in the airway (~6 months), while multiciliated ependymal cells turnover more slowly.
Introduction.
The turnover rate of cell populations in different tissues is relevant to our understanding of stem cell biology, cellular response to environment and injury, and cellular function during homeostasis and disease. Multiciliated cells (MCCs) are a terminally differentiated cell type that partially comprise the epithelial lining of the trachea, oviduct, and brain ventricles (Brooks and Wallingford, 2014; Spassky and Meunier, 2017). At their apical surface, MCCs contain dozens of motile cilia, which beat synchronously to drive fluid flow across an epithelium (Brooks and Wallingford, 2014; Spassky and Meunier, 2017). Specifically, MCCs in the trachea are responsible for mucociliary clearance whereby mucus and debris are driven out of the respiratory system, preventing chronic airway infections (Knowles and Boucher, 2002). In the oviducts, MCCs are potentially important for female fertility, although the exact role for these cells is still being defined (Afzelius, 1976; Vanaken et al., 2017). Finally, MCCs in the brain (termed ependymal cells) create local flows of cerebrospinal fluid (CSF) in the ventricular system that are critical for development and homeostasis (Sawamoto et al., 2006).
While MCCs drive fluid flow in all three tissues, each population of MCCs experience vastly different local environments that may affect their function and lifetime. In the trachea, MCCs are exposed to inhaled chemicals like cigarette smoke, environmental pollutants, and airborne pathogens which are known to injure tracheal MCCs (Abdi et al., 1990). Oviduct MCCs are enriched in the infundibulum (the portion of the oviduct closest to the ovary), where they experience repeated ovulations and inflammatory ovulatory fluid (Duffy et al., 2019). Ependymal cells experience contact with the peptides and molecules in the CSF thought to be important for neuroproliferation, differentiation, and homeostasis (Zappaterra and Lehtinen, 2012). Such differences in local environments might be expected to drive variation in MCC turnover time for each cell population.
In addition, each of these multiciliated populations arise from a progenitor either during development or homeostasis. From previous lineage-tracing studies in the trachea, we know that Krt5-positive basal cells are the progenitors of secretory cells, which in turn give rise to MCCs (Rock et al., 2009). Lineage-tracing during embryogenesis demonstrated that radial glial cells are the progenitors of ependymal cells (Spassky et al., 2005). Finally, mouse oviduct MCCs arise from secretory cells, and while the underlying potential progenitor cell in humans is Krt5-positive, the underlying progenitor cell in mice remains unclear (Paik et al., 2012; Ghosh et al., 2017). While each MCC population is known to arise from a progenitor cell, the lifespan of MCCs has only been quantified in trachea (Rawlins and Hogan, 2008; Pardo-Saganta et al., 2015), leaving an important gap in our knowledge.
Using genetic lineage tracing, we have performed a comparative analysis of MCC epithelial turnover rates in the trachea, oviduct, and brain of the mouse. As expected, our data concerning trachea MCCs recapitulate the previously published lifespan (Rawlins and Hogan, 2008; Pardo-Saganta et al., 2015). We find that the oviduct MCCs – despite a vastly different local environment and an as yet unidentified population of dedicated stem cells – display a lifespan similar to the trachea MCCs. Finally, we demonstrate that ependymal cells are longer lived compared to the trachea and oviduct MCCs.
Results and Discussion.
Experimental set-up.
To determine the turnover rate of MCCs, a genetic pulse-chase experiment was conducted, similar to that previously described for the trachea (Rawlins and Hogan, 2008). We used the FOXJ1CreER allele which is specifically expressed in MCCs (Rawlins et al., 2007) and the Rosa26mTmG reporter allele, which upon Cre recombination switches from membrane-TdTomato to membrane-GFP (mGFP) expression (Muzumdar et al., 2007). FOXJ1CreER/+; Rosa26mTmG/+ animals were injected five times over two weeks with a low dose of tamoxifen (tmx) to mosaically label a subset of MCCs with mGFP (Fig. 1A). Littermate control cohorts were injected with corn oil over the same time frame. Animals (n=3–4 experimental animals per timepoint) were euthanized at various time points spanning ~1 year after the last tmx injection: 1 week to determine the maximum mGFP labeling and then 4 weeks, 12 weeks, 24 weeks, 36 weeks, and 48 weeks to assess turnover (Fig. 1A). All three tissues were dissected from each animal, and the turnover of each population was determined based on loss of lineage labeled, mGFP+, MCCs (Fig. 1B–D). As mGFP is enriched in MCC cilia, we used this to quantify the percentage of ciliated luminal surface covered by mGFP+ cilia over time (Fig. 1E).
Figure 1. Experimental set-up to perform a comparative analysis of MCC turnover rates.
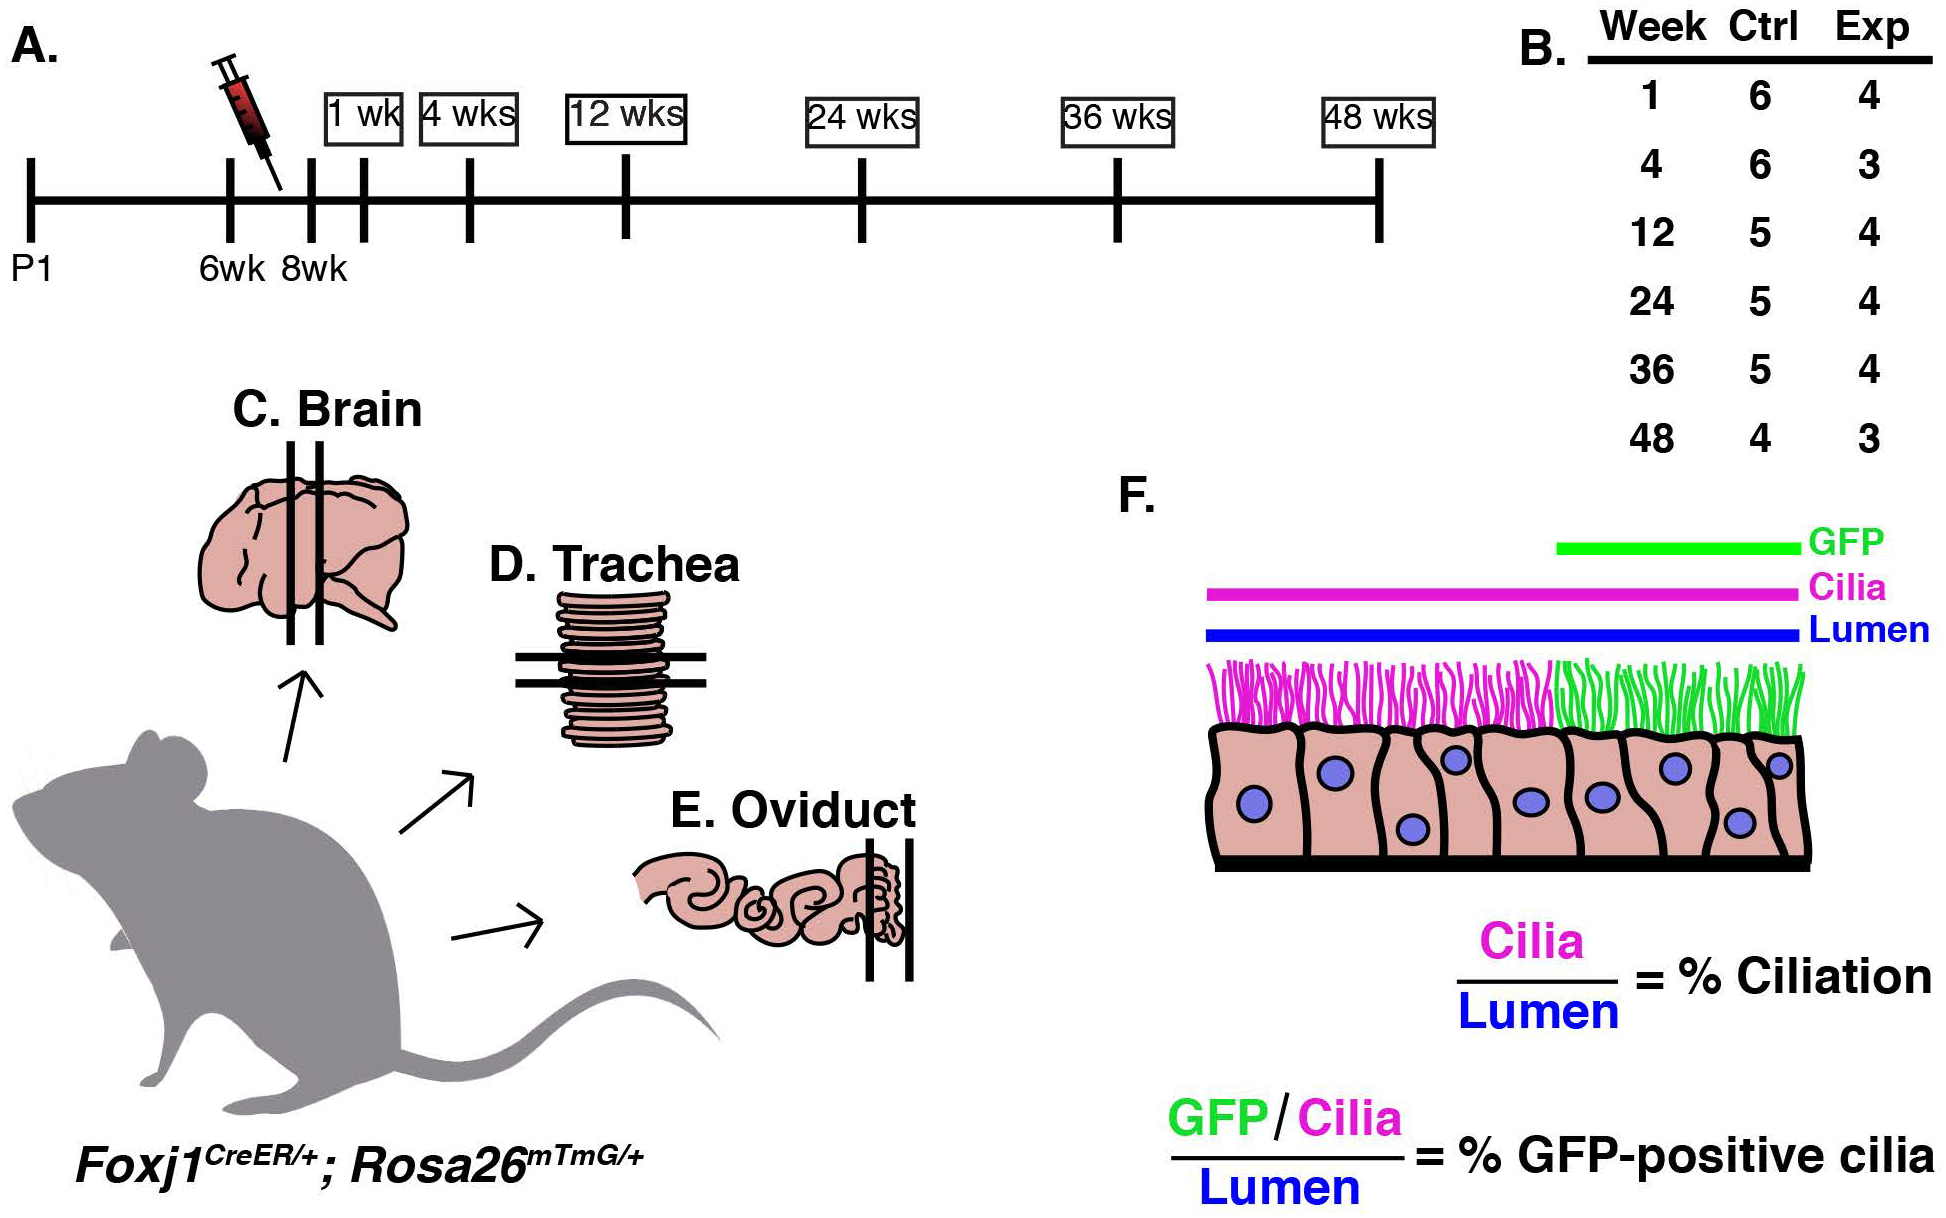
A) Timeline of experiment. Foxj1CreER; Rosa26mTmG female mice between 6–8 weeks old were injected five times over two weeks with a low dose of tamoxifen (tmx, red needle). Mice were euthanized at various time points after the last tmx injection: 1 week (wk), 4wks, 12wks, 24wks, 36wks, and 48wks. B) There were at least 3, and usually 4, experimental animals dissected at each timepoint. Three tissues were dissected from each animal, the C) brain, D) trachea, and E) oviduct. F) Tissue was analyzed at each timepoint by calculating both the % ciliation and the % GFP-positive cilia lining the lumen. In FIJI, the length of the lumen (blue line), TubAc (magenta line), and the GFP-positive cilia (green line) was calculated so that % ciliation and % GFP-positive cilia could be calculated.
Trachea MCCs.
Trachea sections from each animal were probed for acetylated tubulin (TubAc) to label cilia (Fig. 2A,C) and GFP to mark the genetically labeled MCCs (Fig. 2B,C). At 1 week, ~38% of cilia were mGFP+, while at 48 weeks, ~2.9% of cilia were mGFP+ (Fig. 2A–C, E). Because, we injected mice at 6–8wks, we wanted to ensure that any change in mGFP+ cilia was not due to an increase in tissue growth. Therefore, we quantified TubAc+ cells, which revealed that the overall percentage of ciliated cells in the trachea did not change over the course of the experiment (Fig. 2D). From this dataset, we calculated that the turnover rate of tracheal MCCs is 21.18 weeks, or ~5.3mo (Fig. 2E).
Figure 2. The MCCs of the trachea display a half-life of 5.5 months.
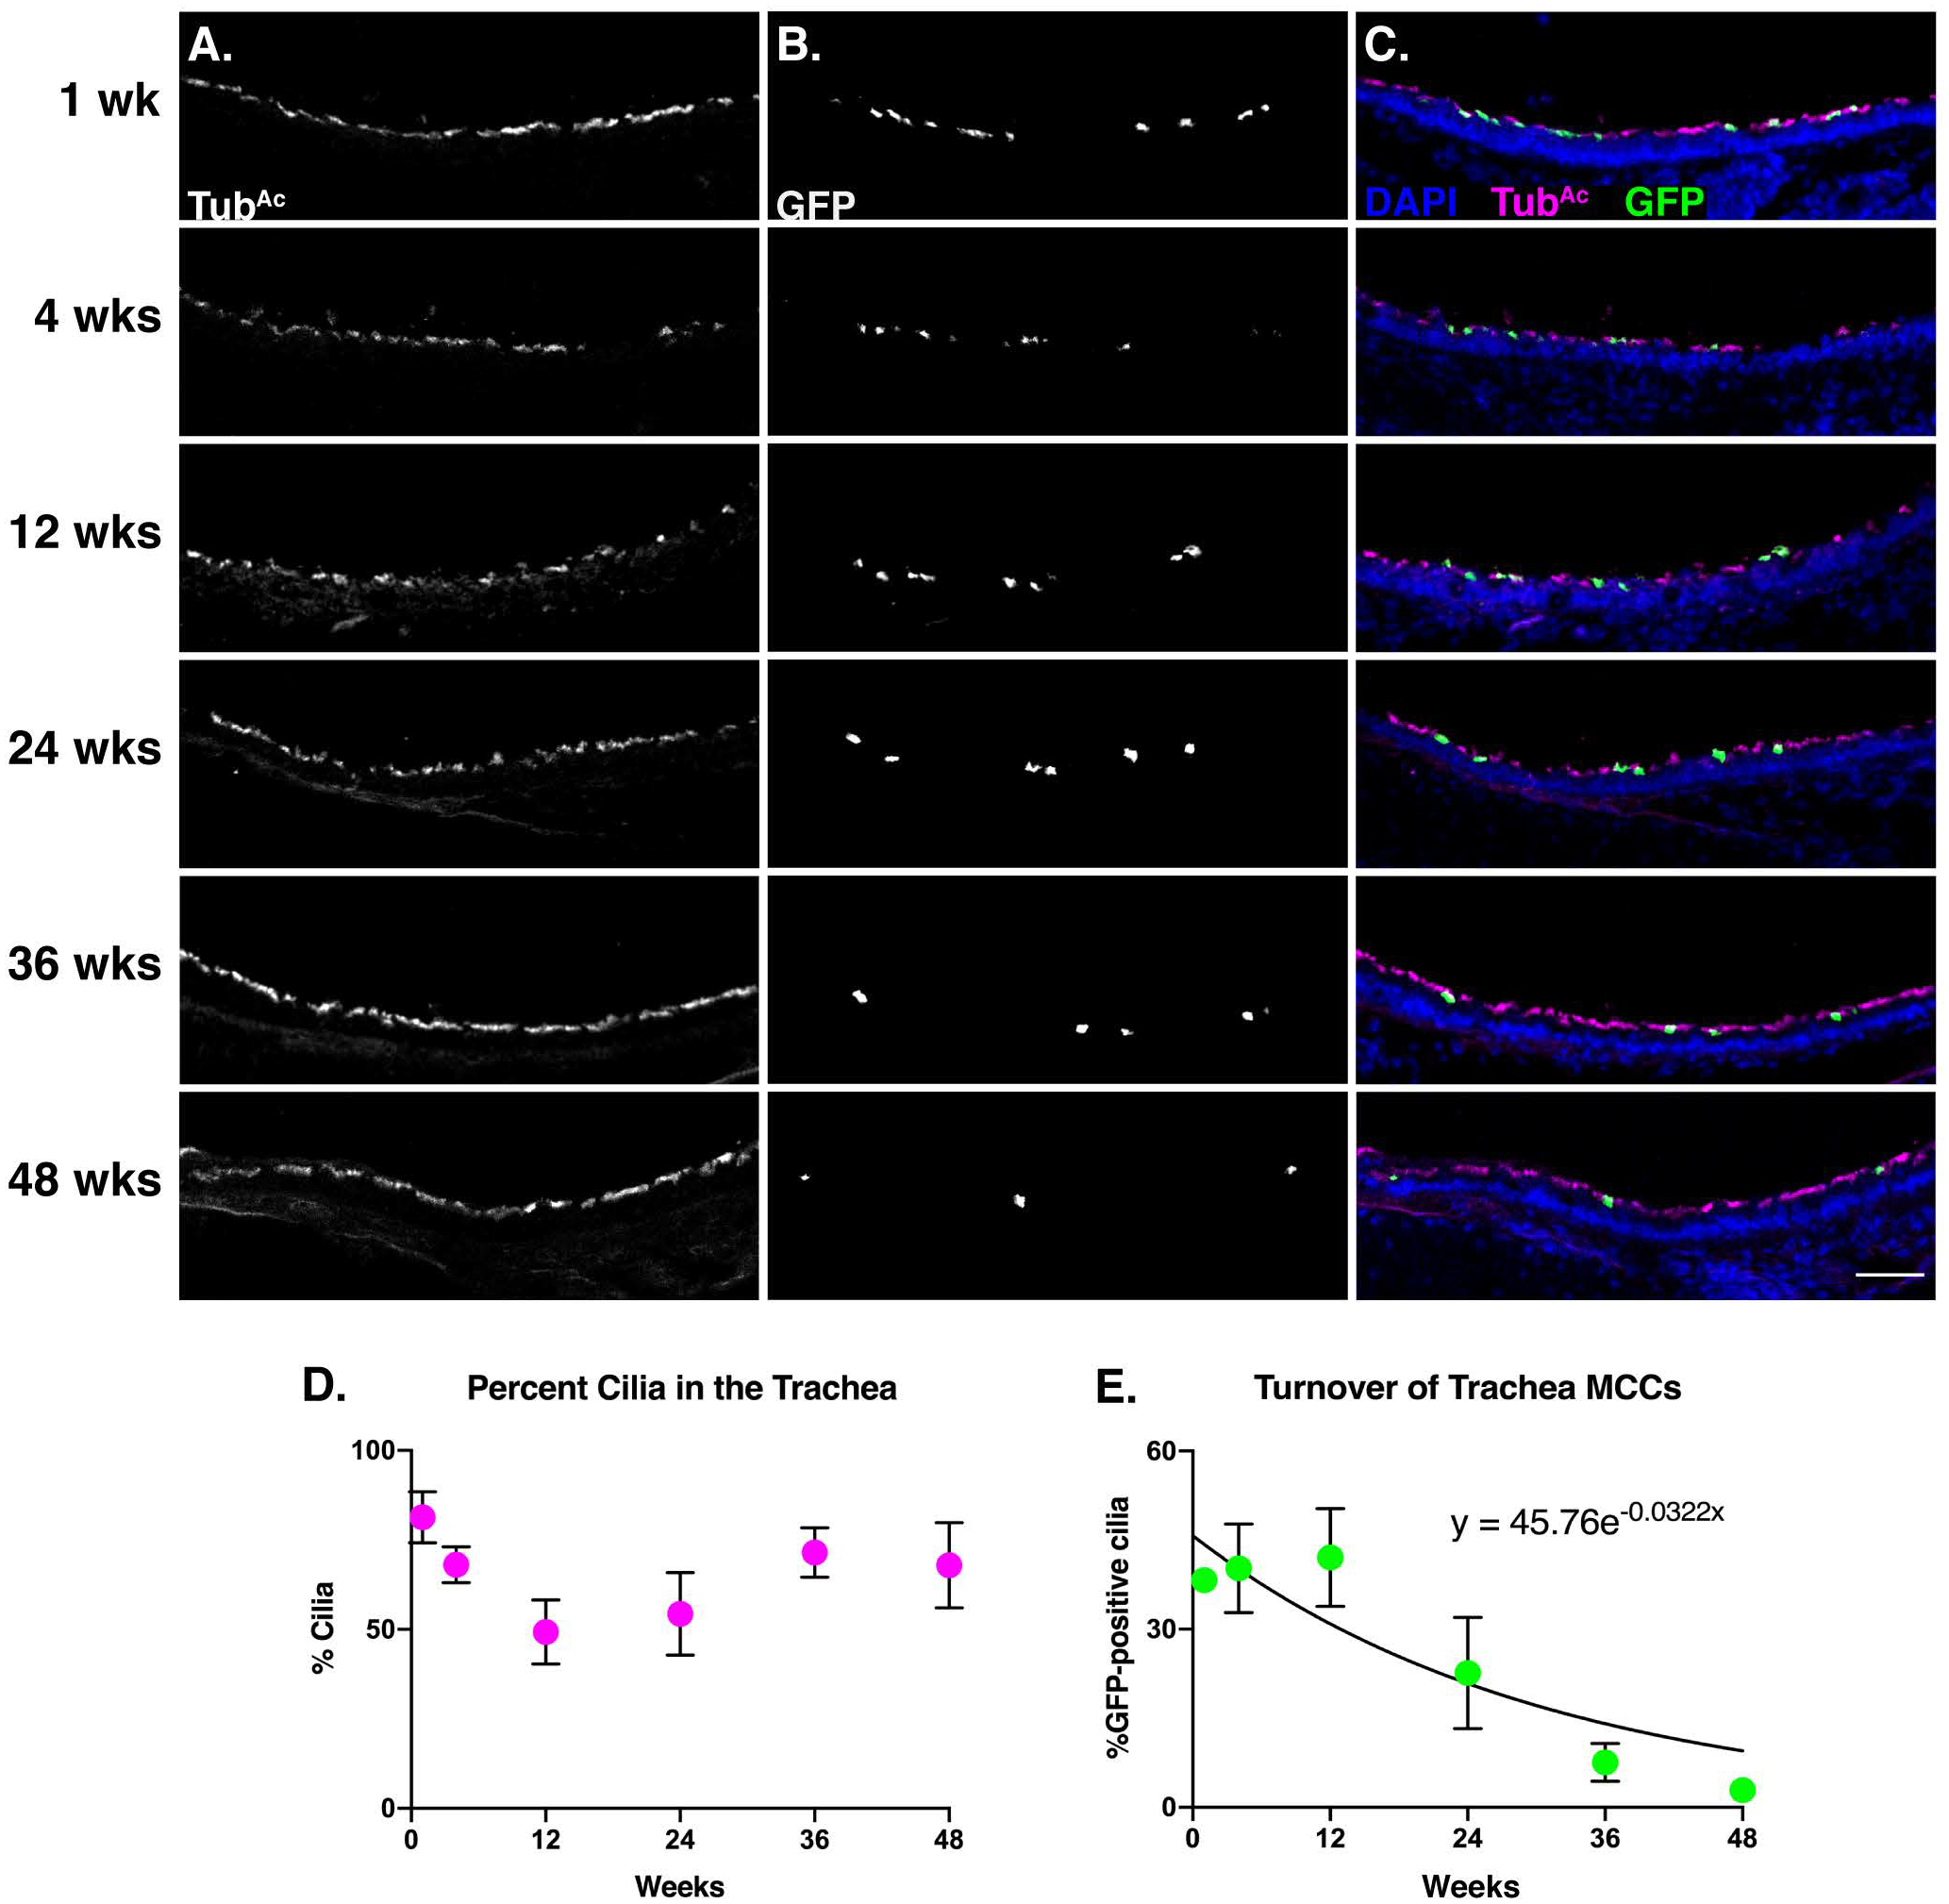
Trachea sections from each timepoint were stained for A) cilia (TubAc, magenta), B) lineage labeled, mGFP+, cells (GFP, green), and nuclei (DAPI, blue). Images were taken at 10x. A-B) Grey scale of TubAc and GFP to more clearly show both channels. Scale bar = 50μm. C) Merge of cilia, GFP, and DAPI. D) Quantitation of cilia in the trachea at each timepoint shows little change over time. E) Quantitation of mGFP+ cells over time, fitted to an exponential decay, whose equation is shown on the graph. This equation was solved to determine that the turnover rate of tracheal MCCs is approximately 5.5 months. All error bars represent the standard deviation. It is important to note that in some instances, the error bars are too small to be seen.
This result is in accordance with two previously published turnover rates of trachea MCCs as ~6mo during homeostasis and post-ablation (Rawlins and Hogan, 2008; Pardo-Saganta et al., 2015). Importantly, though we also examined homeostatic turnover, we used a slightly different analysis method from the Rawlins and Hogan paper, yet reached a very similar conclusion. The previously published dataset had labeled a higher percentage of MCCs (~72% compared to our ~38%), because of a higher concentration of injected tmx (Rawlins and Hogan, 2008). As tmx is a weak estrogen analog, our experiment used a lower dose to circumvent the impact of tmx on the female reproductive tract (i.e. the oviduct) and estrous cyclicity (Martin and Middleton, 1978). In addition, the previous work quantified turnover rates by manually counting the number of discrete YFP+ MCCs over time based on co-expression of the lineage tracer (YFP) and a cilia marker (β-tubulin). To avoid mis-calling labelled or unlabeled cells, we instead quantified the percentage of ciliated luminal surface covered in mGFP+ cilia (Fig. 1E). Nonetheless, we observe that our labeling scheme was effective and further, we are the third group to show that the turnover rate of trachea MCCs is ~6mo (Rawlins and Hogan, 2008; Pardo-Saganta et al., 2015).
Oviduct MCCs.
Similar to the trachea, oviduct sections were probed with TubAc to mark cilia and GFP to mark the lineage-labeled cells (Fig. 3A–C). We focused our quantitation on the anterior of the oviduct, as we found this region to be enriched for lineage-labeled MCCs. At 1 week, ~32% of cilia are mGFP+, while at 48 weeks ~ 6.8% of cilia are mGFP+ (Fig. 3A–C, E). Again, TubAc staining revealed that the total percentage of MCCs in the oviduct remained constant across the experiment (Fig. 3D). From this dataset, we determined that the oviduct MCC turnover rate is ~6mo (Fig. 3E).
Figure 3. Oviduct MCCs display a half-life of ~6 months.
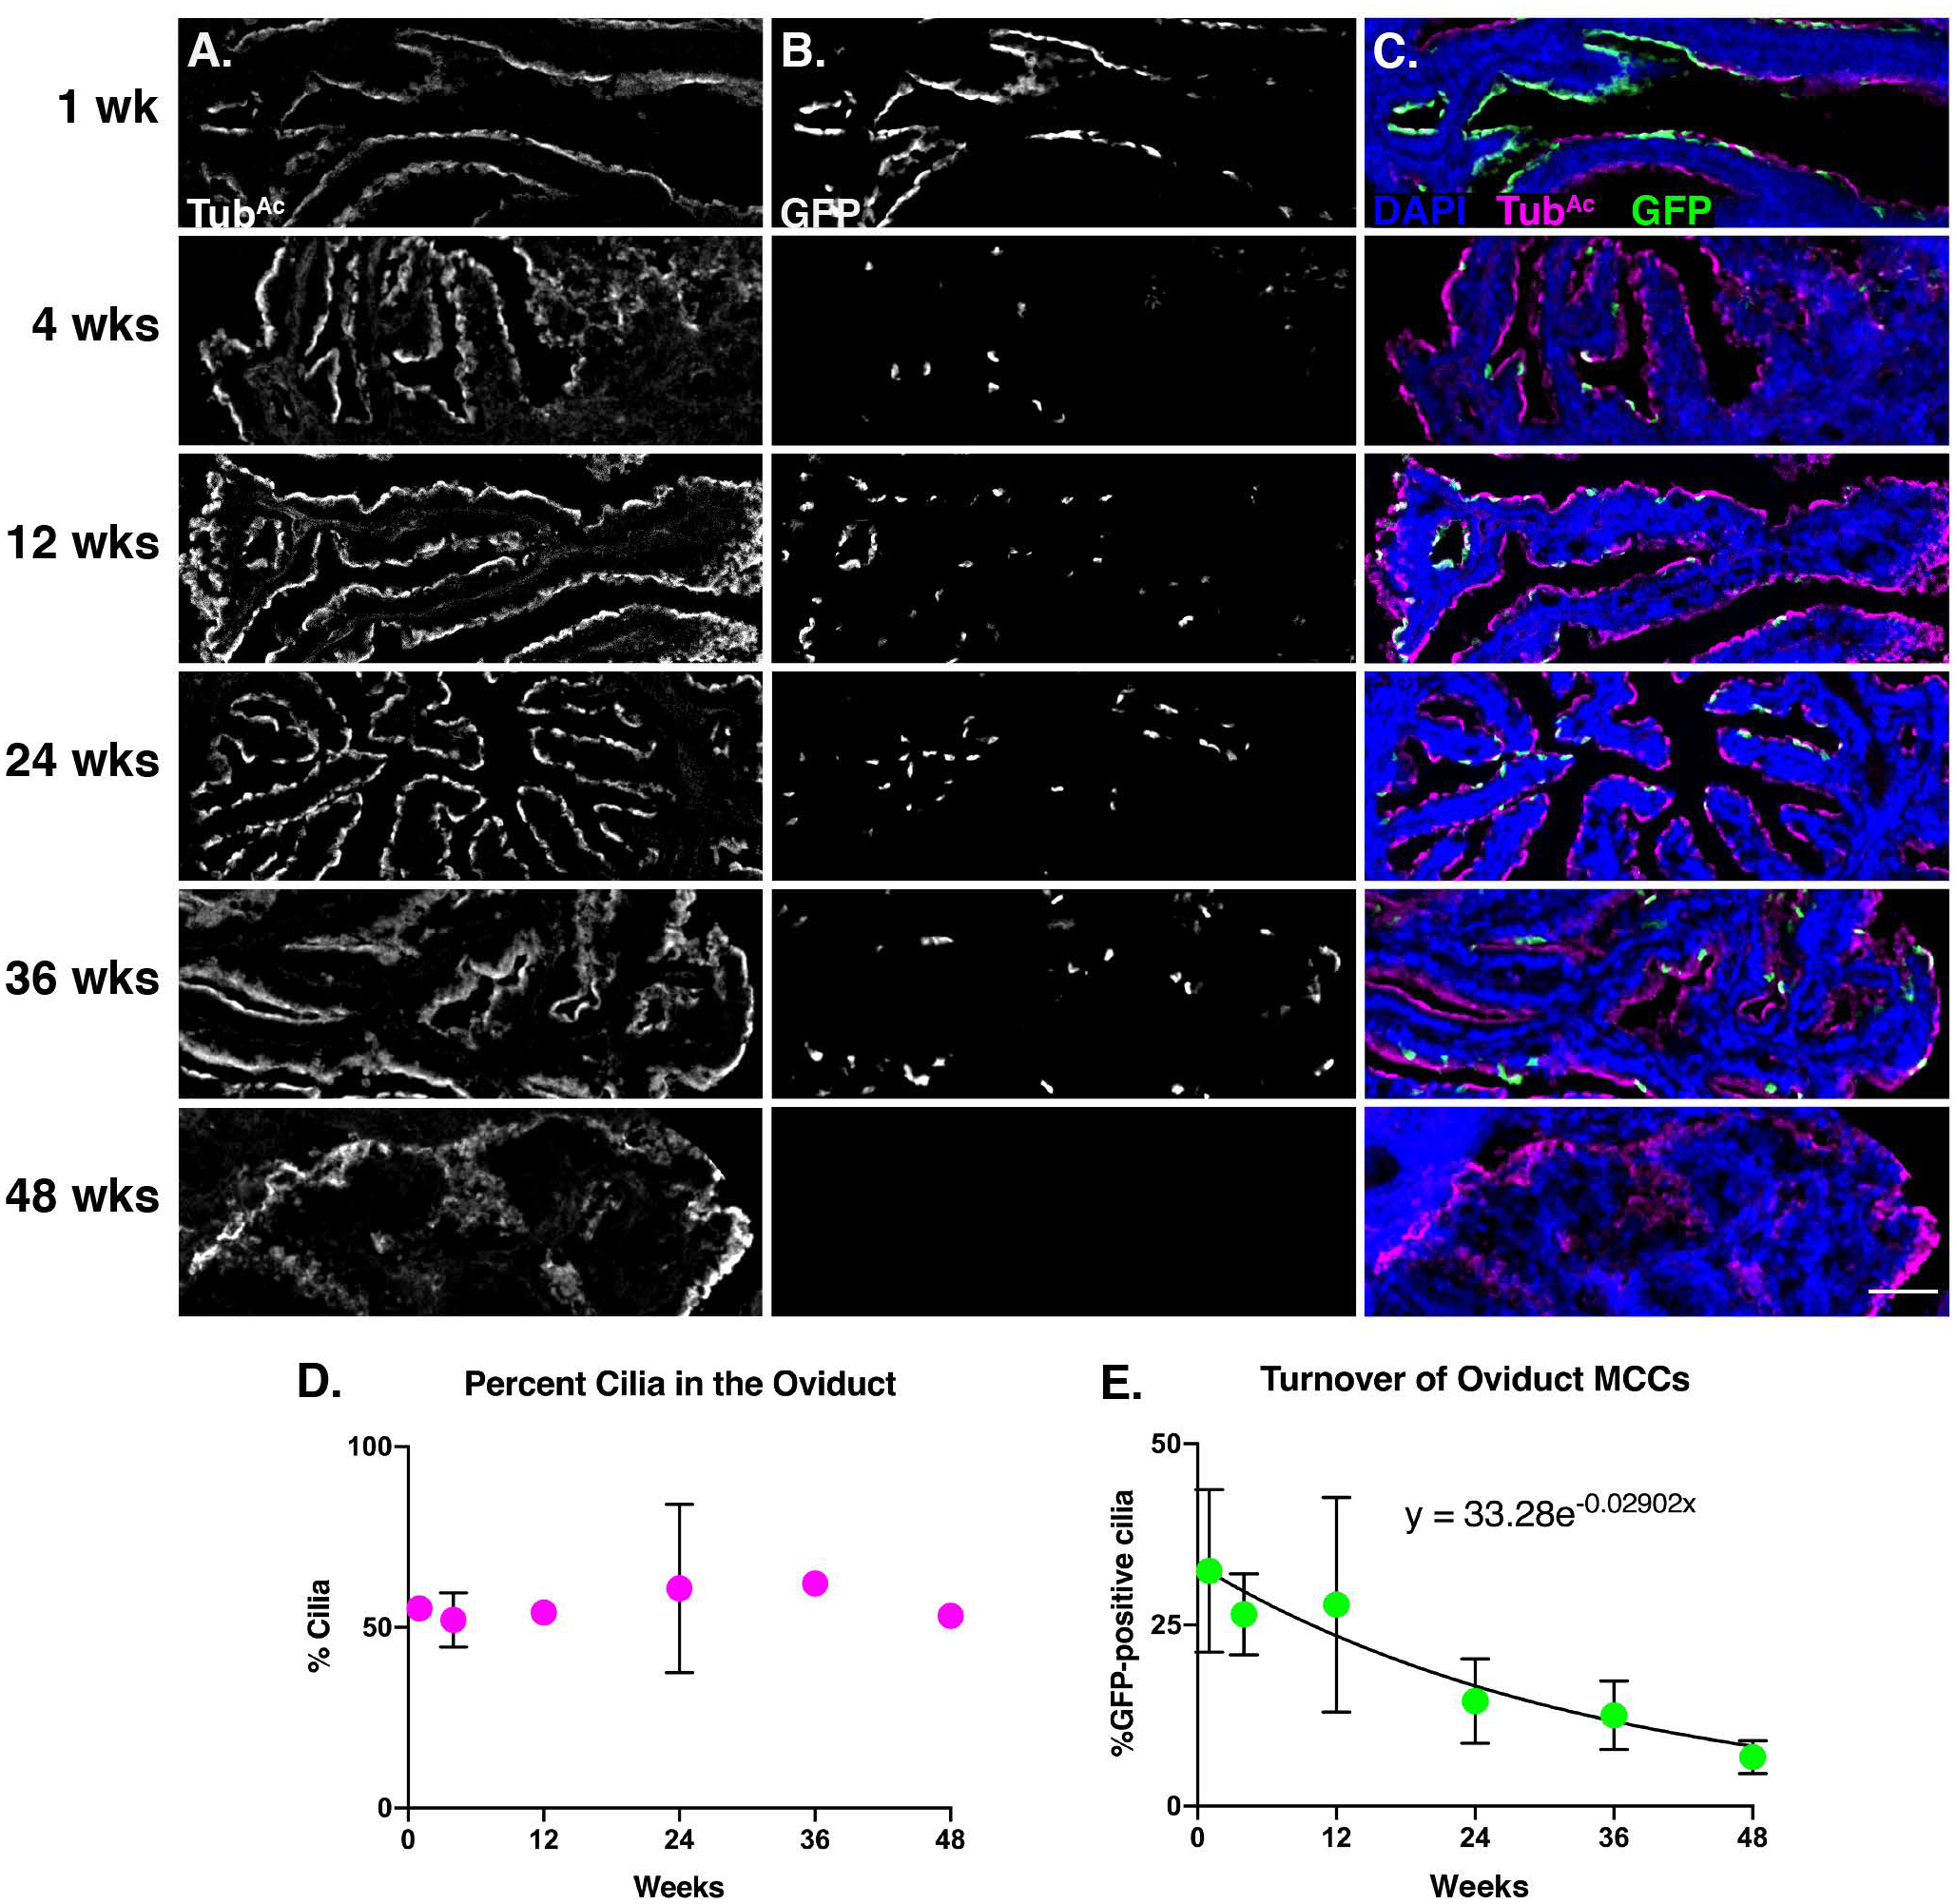
Oviduct sections from each timepoint were stained for A) cilia (TubAc, magenta), B) lineage labeled, mGFP+, cells (GFP, green), and nuclei (DAPI, blue). Images were taken at 10x. A-B) Grey scale of TubAc and GFP to more clearly show both channels. Scale bar = 50μm. C) Merge of cilia, GFP, and DAPI. D) Quantitation of cilia in the oviduct at each timepoint shows little change over time. It is important to note that in some instances, the error bars are too small to be seen. E) Quantitation of mGFP+ cells over time, fitted to an exponential decay, whose equation is shown on the graph This equation was solved to determine that the turnover rate of oviduct MCCs is approximately 6 months. All error bars represent the standard deviation.
Our data suggest that the lifetime of oviduct MCCs is similar to trachea MCCs, which was surprising because the local environment of these two populations is quite different. Trachea MCCs are exposed to various environmental inhalants, while oviduct MCCs are bathed in inflammatory ovulatory fluid every 4–5 days in a mouse (Allen, 1922). The critical implications of ovulatory fluid exposure on the oviduct fimbria has been documented in human studies. In female humans, ovarian epithelial cancer is one of the most prevalent and lethal gynecologic malignancies, and the cell of origin is likely a transformed oviduct fimbrial epithelial cell (Kindelberger et al., 2007; Siegel et al., 2016). Further, a decrease in the number of ovulations – either through pregnancy and lactation, or hormonal contraception – is correlated with a decrease in the risk of ovarian epithelial cancer (Hankinson et al., 1992; Purdie et al., 2003; Tung et al., 2005; Kindelberger et al., 2007; Havrilesky et al., 2013; Troisi et al., 2018). Therefore, recurrent exposure to ovulatory fluid is damaging to oviduct epithelial cells, which increases the risk of ovarian epithelial cancer. In addition, oviduct MCCs are regularly subjected to substantial mechanical perturbation by the passing ova during each estrous cycle. Nonetheless, our data suggest repeated exposure to ovulatory fluid and to ovum transport does not cause oviduct MCCs to turn over more rapidly than trachea MCCs.
This result prompted us to explore the possibility of dedicated stem cells in the mouse oviduct. Mouse oviduct MCCs can arise from secretory cells (Ghosh et al., 2017), though no underlying potential progenitor cell has yet been identified. Interestingly, Krt5+ stem-like cells have been found in human oviduct organoids (Paik et al., 2012), and moreover, Krt5+ basal stem cells give rise to new MCCs in the mouse trachea (Rock et al., 2009). We therefore tested the hypothesis that there may be Krt5+ progenitor cells in the mouse oviduct. Using both a Krt5::GFP allele (Schoch et al., 2004) as well as lineage labeling with Krt5CreER; Rosa26mTmG/+ (Van Keymeulen et al., 2011), we found no evidence for Krt5 labeling any cell type of the oviduct (Fig. 4A and C). This result was not due to a failure of the genetic tools, as we did observe labeled Krt5-positive basal cells in the trachea as expected (Fig. 4B and D). This study demonstrates that Krt5-positive cells are unlikely to be progenitor cells in the mouse oviduct, and highlights the need for future studies to investigate cell-type development and differentiation in the mouse oviduct. The majority of the developmental lineage of MCCs is derived from work in the trachea (Schoch et al., 2004; Rawlins et al., 2007; Rock et al., 2009), yet this work suggests that the oviduct MCCs differentiate along a different lineage than trachea MCCs, despite their similar turnover times.
Figure 4. Keratin 5 is not a progenitor marker in the oviduct.
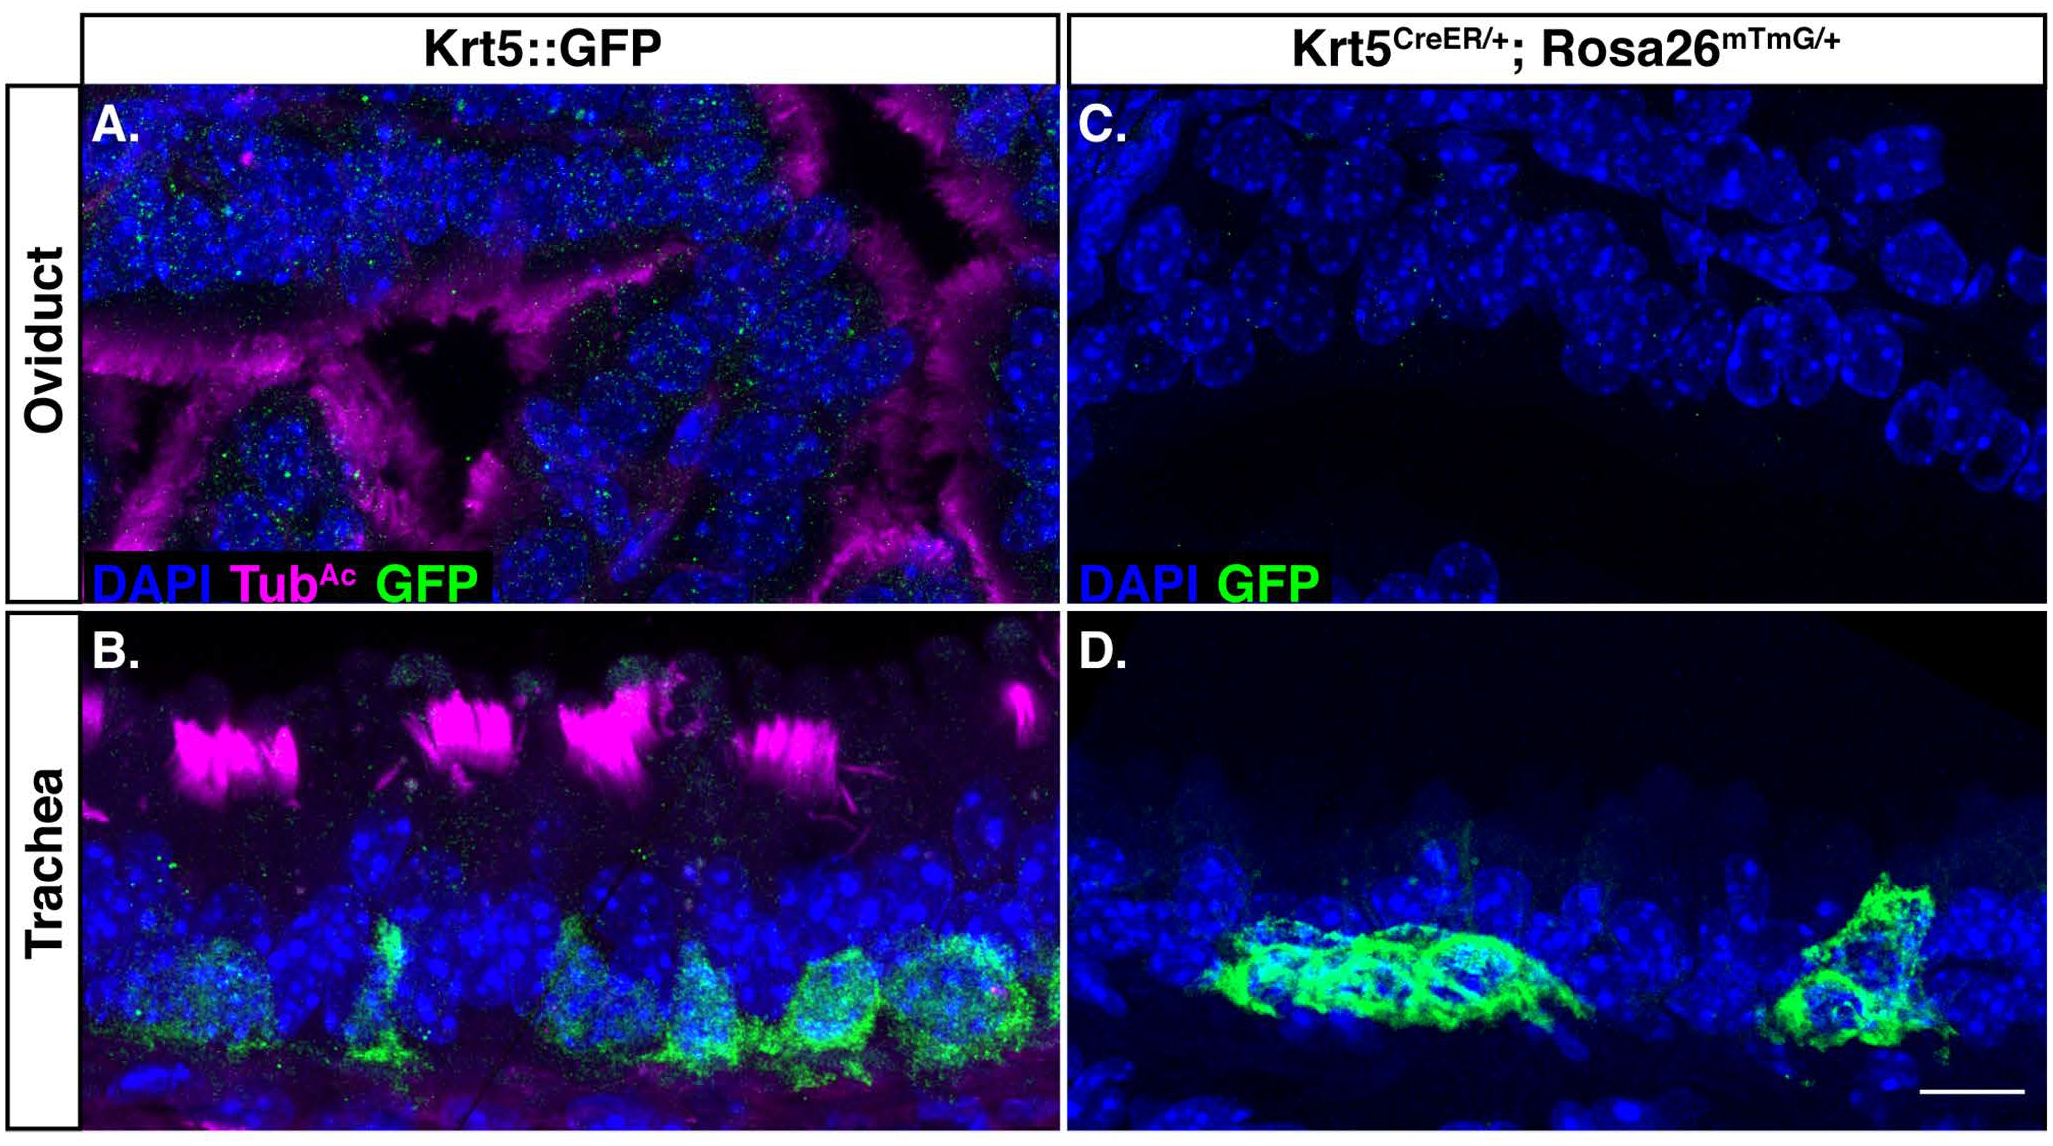
Krt5::GFP females were dissected, and sections of A) oviduct, and B) trachea were probed for nuclei (DAPI, blue), cilia (TubAc, magenta), and GFP (green). A) The oviduct does not have Krt5-positive cells. B) The trachea acts as a positive control, and does have Krt5-positive basal cells. Sections of C) oviduct, and D) trachea from Krt5CreER; Rosa26mTmG/+ females were probed for nuclei (DAPI, blue), and lineage-labeled cells (GFP, green). C) The oviduct does not have Krt5-positive cells. D) The trachea does display Krt5-positive lineage-labeled basal cells, as expected. Scale bar = 10μm.
Ependymal cells.
Brain sections were probed with TubAc to label cilia and GFP to mark the lineage-labeled cells (Fig. 5A–C). In general, our labeling scheme led to much higher proportion of GFP+ ependymal cells compared to MCCs in the other tissues (1wk timepoint in Fig. 5E compared to 1wk timepoint in Fig. 2E and 3E). At 1 week, ~78% of cilia are mGFP+, while at 48 weeks, ~56% of cilia are mGFP+ (Fig. 5A–C, and E). The turnover rate of the ependymal cells was slower than the two other tissues, with only a 25% decrease in GFP+ labeled cell populations over the course of the entire experiment (Fig. 5E). Again, TubAc staining revealed that the overall percentage of MCCs in the brain remained constant across the experiment (Fig. 5D). From this dataset, we calculated the half-life of the ependymal cell population to be ~83 weeks, or roughly a year and a half, which equates to the average lifetime of a normal mouse lab strain (Fig. 5E) (Comfort, 1959).
Figure 5. Ependymal cells display a half-life of ~21 months.
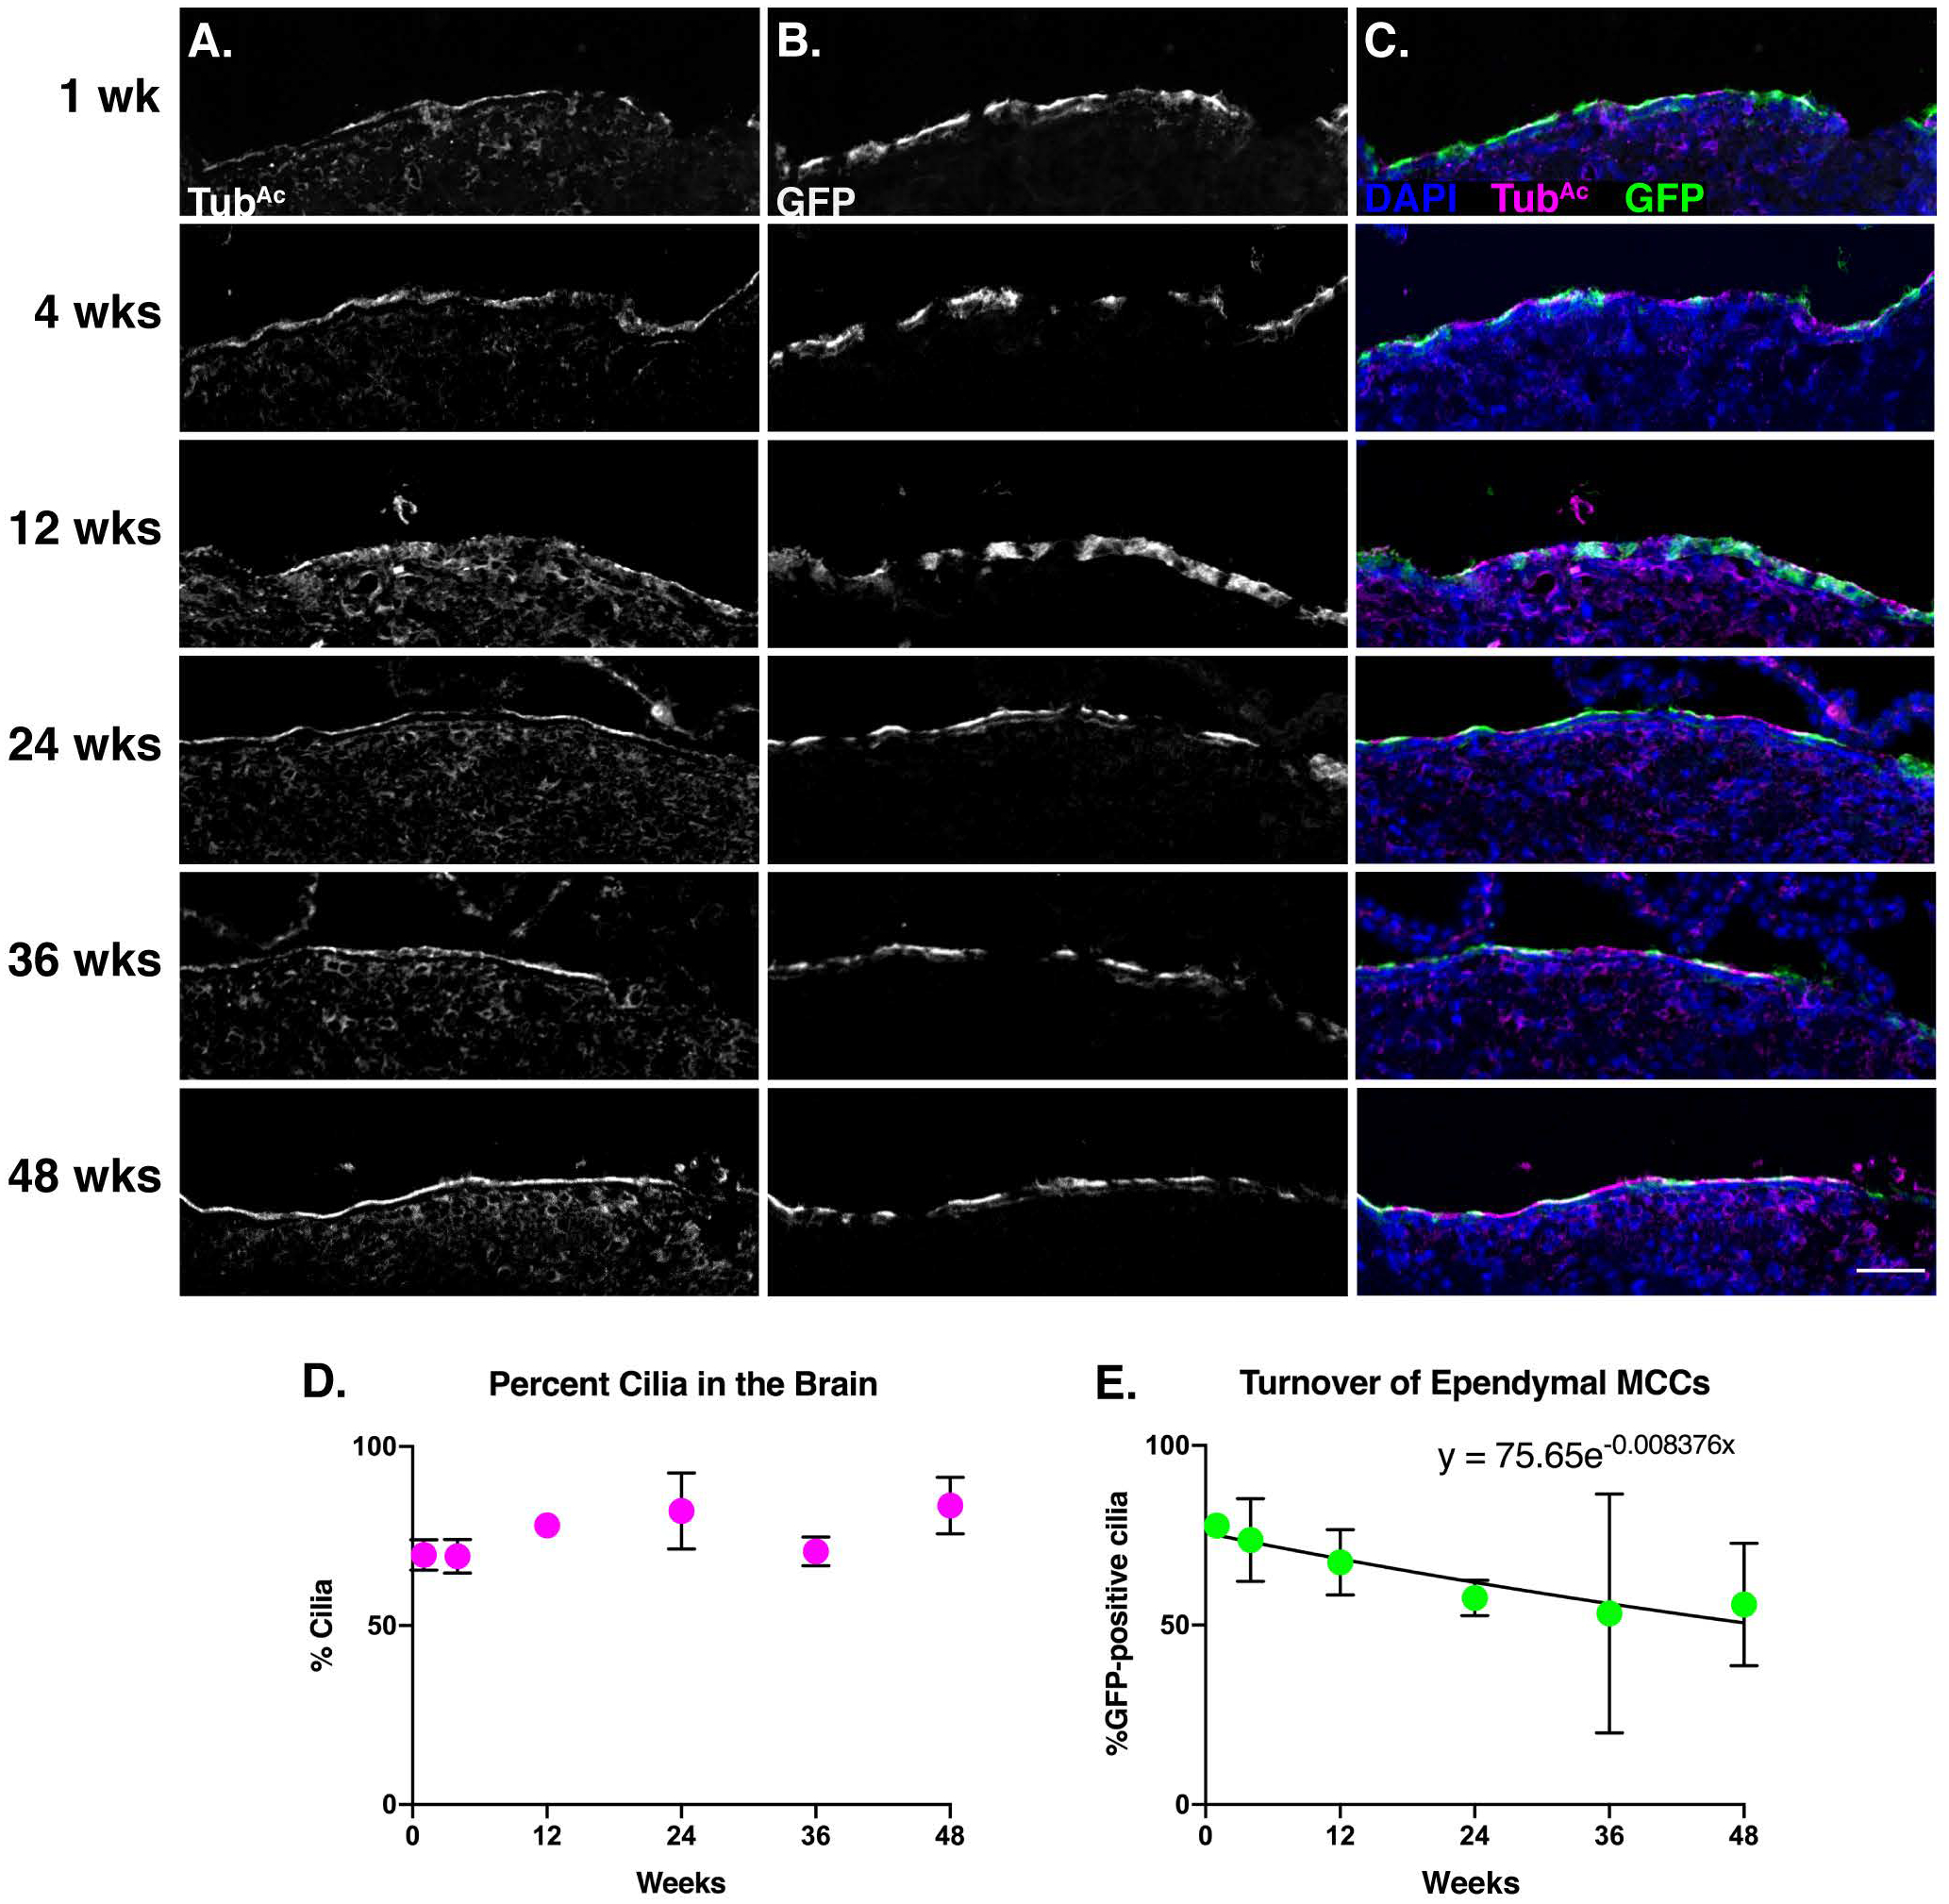
Brain sections from each timepoint were stained for A) cilia (TubAc, magenta), B) lineage labeled, mGFP+, cells (GFP, green), and nuclei (DAPI, blue). Images were taken at 10x. A-B) Grey scale of TubAc and GFP to more clearly show both channels. Scale bar = 50μm. C) Merge of cilia, GFP, and DAPI. D) Quantitation of cilia in the brain at each timepoint shows little change over time. E) Quantitation of mGFP+ cells over time, fitted to an exponential decay, whose equation is shown on the graph. This equation was solved to determine that the turnover rate of ependymal cells is approximately 21 months. All error bars represent the standard deviation. It is important to note that in some instances, the error bars are too small to be seen.
In contrast to the findings here, a previous study indicated that ependymal cells are postmitotic and likely born only once during development (Spassky et al., 2005). It is important to note, however, that the previous study focused on a much shorter time frame than our experiment: they labelled mitotically active cells in utero and then assessed ependymal cell development by 2mo of age. By contrast, our dataset labels MCCs at 6–8 weeks of age and we collected data for an additional 48 weeks. Because our data spans a much longer time scale, we were able to observe a slight decrease in GFP+ cilia while the percent ciliation of the ventricle stayed approximately the same (Fig. 5D–E). These data suggest, then, that ependymal cells do turnover in the mouse brain – albeit at a much slower rate compared to the trachea and oviduct MCCs. Thus, our data suggest that ependymal cells can be homeostatically replaced, warranting deeper investigation with regards to injury or infection of the ventricular system.
Conclusion.
In conclusion, we have shown that the oviduct and trachea MCCs turnover at approximately the rate (about 6mo), whereas the ependymal cell population turns over significantly slower (about 18mo). These data expand our understanding of the homeostasis of MCC populations, and how different local environments contribute to that homeostasis. The work sets the stage for further understanding how different MCC population lifespans change in response to loss of cilia, disease, injury, infection, pregnancy, and infertility.
Experimental Procedures.
Mice.
FOXJ1CreER2T (Rawlins et al., 2007), Krt5CreER (Van Keymeulen et al., 2011), Krt5::GFP (Schoch et al., 2004), and Rosa26mTmG (Muzumdar et al., 2007) animals were maintained on a mixed background (Swiss Webster and C57BL/6). Mice were housed in individually ventilated cages in a pathogen-free facility with continuous food and water, with a controlled light cycle (light from 7am-7pm). 6–8-week-old female FOXJ1CreER2T; Rosa26mTmG/+ were used to perform a comparative approach of the turnover rates of the trachea, oviduct, and brain multiciliated cells. A cohort of 36 mice were given 5 intraperitoneal (IP) injections of tamoxifen (tmx, Sigma) dissolved in corn oil at the dose of 1mg tmx/40g mouse over 2 weeks (Rawlins and Hogan, 2008). Of those 36 mice, 24 were experimental while the remaining 12 were control animals. Another cohort of 21 mice were given 5 IP injections of corn oil over the same time frame. Mice in groups of at least 3 were humanely euthanized by extended CO2 exposure at 1 week, 4 weeks, 12 weeks, 24 weeks, 36 weeks, and 48 weeks after the final tmx injection (Fig. 1).
6–8 week-old female Krt5::GFP and Krt5CreER; Rosa26mTmG/+ were used to determine if there are Krt5-positive cells in the oviduct, using trachea as a positive control. Tissue from Krt5::GFP animals was obtained from Dr. Jeremy Reiter’s lab at UCSF. Krt5CreER; Rosa26mTmG females were injected once with tmx (1mg tmx/40g mouse) and then euthanized 1wk post-tmx injection. All animal experiments were approved by the University of Texas at Austin Institutional Animal Care and Use Committee.
Tissue processing & immunofluorescence.
Trachea, oviducts, and brains were dissected from each animal and fixed in 4% paraformaldehyde (Electron Microscopy Sciences) overnight at 4°C. Fixed tissues were washed in PBS, and incubated in 30% sucrose overnight at 37°C. Tissues were washed briefly in NEG-50 Frozen Section Medium (ThermoFisher) and then were embedded in NEG-50 in an ethanol/dry ice bath (oviducts & trachea) or allowed to freeze at −80°C (brains) and stored at −20°C or −80°C. 12μm frozen sections were cut on a cryostat (Leica) and dried overnight at RT. Frozen sections were stored at −20°C.
Tissue sections were washed in PBS + 0.1% Tween20 (PBST) three times to remove NEG-50. Antigen retrieval was performed on brain sections using 0.1 M citrate buffer (pH6.8): citrate buffer was heated to boiling, slides were added to the buffer and allowed to cool for 1hr. Tissues were then blocked for at least 30min at RT with 5–10% normal goat serum + PBS (block buffer). Primary antibodies for GFP (chicken anti-GFP, 1:500 dilution, Abcam, ab13970) and cilia (mouse anti-acetylated tubulin, 1:1000 dilution, Sigma, cat# 6–11B-1) were diluted in block buffer and incubated on slides for 2hr at RT or overnight at 4°C. After washing three times with PBST, tissue was incubated with Alexa-Fluor coupled secondary antibodies (goat anti-chicken 488, goat anti-mouse 647, goat anti-rat 647, 1:1000 dilution, ThermoFisher) and DAPI (1:1000 dilution, ThermoFisher) for at least 30min at RT. After washing at least 3 times with PBST, slides were mounted with Prolong Gold (ThermoFisher).
The oviduct and trachea were imaged for quantitation and publication on a Zeiss LSM700 point scanning confocal microscope. For quantitation, brain tissue was imaged with a CSU-W1 spinning disk Nikon confocal, and publication images were captured with the Zeiss LSM700 point scanning confocal.
Quantitation.
Two to four sections spaced at least 100μm apart were analyzed for GFP+ ciliated cells. For the oviduct, we selected sections that contained the most anterior portion due to the enrichment of ciliated cells. For the brain, we selected sections that contained the dorsal third ventricle and lateral ventricles surrounding the anterior hippocampus. As membrane-GFP (from the Rosa26mTmG transgene) is strongly enriched in the ciliary membrane, we used it to quantify the percentage of luminal surface covered by GFP+ cilia. In FIJI (FIJI is Just ImageJ) the lumen of each tissue was traced based on DAPI staining and the length was measured. Similarly, the ciliated surface of the lumen was traced and measured based on acetylated tubulin. Finally, the GFP+ cilia were traced and measured along the lumen. From these length measurements, the %GFP+ ciliated surface is calculated for each animal at each timepoint. Using GraphPad Prism 8, each dataset was fitted with one-phase exponential decay curves (where the plateau was constrained to 0), which were solved to determine the half-life of MCCs in each tissue.
Acknowledgements.
ECR is supported by the NICHD (F32HD095618). NKT was supported by the TIDES Summer Fellowship Program from the University of Texas at Austin. MK is supported by Provost Graduate Excellence Fellowship through the Institute of Cell and Molecular Biology at the University of Texas at Austin. RSG is supported by the NIAMS (AR072009). JBW is supported by the NICHD (HD085901) and the NHLBI (HL117164). We thank Drs. Scott Randell, Jeremy Reiter and Semil Choksi for generously sharing trachea and oviduct tissue from Krt5::GFP female mice.
ECR is supported by the NICHD (F32HD095618). RSG is supported by the NIAMS (AR072009). JBW is supported by the NICHD (HD085901) and the NHLBI (HL117164).
References.
- Abdi S, Evans MJ, Cox RA, Lubbesmeyer H, Herndon DN, Traber DL. 1990. Inhalation injury to tracheal epithelium in an ovine model of cotton smoke exposure. Early phase (30 minutes). Am Rev Respir Dis 142:1436–1439. [DOI] [PubMed] [Google Scholar]
- Afzelius BA. 1976. A human syndrome caused by immotile cilia. Science 193:317–319. [DOI] [PubMed] [Google Scholar]
- Allen E 1922. The oestrus cycle in the mouse. American journal of anatomy 30:297–371. [Google Scholar]
- Brooks ER, Wallingford JB. 2014. Multiciliated cells. Curr Biol 24:R973–982. [DOI] [PMC free article] [PubMed] [Google Scholar]
- Comfort A 1959. Natural aging and the effects of radiation. Radiation Research Supplement 1:216–234. [Google Scholar]
- Duffy DM, Ko C, Jo M, Brannstrom M, Curry TE. 2019. Ovulation: Parallels With Inflammatory Processes. Endocr Rev 40:369–416. [DOI] [PMC free article] [PubMed] [Google Scholar]
- Ghosh A, Syed SM, Tanwar PS. 2017. In vivo genetic cell lineage tracing reveals that oviductal secretory cells self-renew and give rise to ciliated cells. Development 144:3031–3041. [DOI] [PubMed] [Google Scholar]
- Hankinson SE, Colditz GA, Hunter DJ, Spencer TL, Rosner B, Stampfer MJ. 1992. A quantitative assessment of oral contraceptive use and risk of ovarian cancer. Obstet Gynecol 80:708–714. [PubMed] [Google Scholar]
- Havrilesky LJ, Moorman PG, Lowery WJ, Gierisch JM, Coeytaux RR, Urrutia RP, Dinan M, McBroom AJ, Hasselblad V, Sanders GD, Myers ER. 2013. Oral contraceptive pills as primary prevention for ovarian cancer: a systematic review and meta-analysis. Obstet Gynecol 122:139–147. [DOI] [PubMed] [Google Scholar]
- Kindelberger DW, Lee Y, Miron A, Hirsch MS, Feltmate C, Medeiros F, Callahan MJ, Garner EO, Gordon RW, Birch C, Berkowitz RS, Muto MG, Crum CP. 2007. Intraepithelial carcinoma of the fimbria and pelvic serous carcinoma: Evidence for a causal relationship. Am J Surg Pathol 31:161–169. [DOI] [PubMed] [Google Scholar]
- Knowles MR, Boucher RC. 2002. Mucus clearance as a primary innate defense mechanism for mammalian airways. J Clin Invest 109:571–577. [DOI] [PMC free article] [PubMed] [Google Scholar]
- Martin L, Middleton E. 1978. Prolonged oestrogenic and mitogenic activity of tamoxifen in the ovariectomized mouse. J Endocrinol 78:125–129. [DOI] [PubMed] [Google Scholar]
- Muzumdar MD, Tasic B, Miyamichi K, Li L, Luo L. 2007. A global double-fluorescent Cre reporter mouse. Genesis 45:593–605. [DOI] [PubMed] [Google Scholar]
- Paik DY, Janzen DM, Schafenacker AM, Velasco VS, Shung MS, Cheng D, Huang J, Witte ON, Memarzadeh S. 2012. Stem-like epithelial cells are concentrated in the distal end of the fallopian tube: a site for injury and serous cancer initiation. Stem Cells 30:2487–2497. [DOI] [PMC free article] [PubMed] [Google Scholar]
- Pardo-Saganta A, Tata PR, Law BM, Saez B, Chow RD, Prabhu M, Gridley T, Rajagopal J. 2015. Parent stem cells can serve as niches for their daughter cells. Nature 523:597–601. [DOI] [PMC free article] [PubMed] [Google Scholar]
- Purdie DM, Bain CJ, Siskind V, Webb PM, Green AC. 2003. Ovulation and risk of epithelial ovarian cancer. Int J Cancer 104:228–232. [DOI] [PubMed] [Google Scholar]
- Rawlins EL, Hogan BL. 2008. Ciliated epithelial cell lifespan in the mouse trachea and lung. Am J Physiol Lung Cell Mol Physiol 295:L231–234. [DOI] [PMC free article] [PubMed] [Google Scholar]
- Rawlins EL, Ostrowski LE, Randell SH, Hogan BL. 2007. Lung development and repair: contribution of the ciliated lineage. Proc Natl Acad Sci U S A 104:410–417. [DOI] [PMC free article] [PubMed] [Google Scholar]
- Rock JR, Onaitis MW, Rawlins EL, Lu Y, Clark CP, Xue Y, Randell SH, Hogan BL. 2009. Basal cells as stem cells of the mouse trachea and human airway epithelium. Proc Natl Acad Sci U S A 106:12771–12775. [DOI] [PMC free article] [PubMed] [Google Scholar]
- Sawamoto K, Wichterle H, Gonzalez-Perez O, Cholfin JA, Yamada M, Spassky N, Murcia NS, Garcia-Verdugo JM, Marin O, Rubenstein JL, Tessier-Lavigne M, Okano H, Alvarez-Buylla A. 2006. New neurons follow the flow of cerebrospinal fluid in the adult brain. Science 311:629–632. [DOI] [PubMed] [Google Scholar]
- Schoch KG, Lori A, Burns KA, Eldred T, Olsen JC, Randell SH. 2004. A subset of mouse tracheal epithelial basal cells generates large colonies in vitro. Am J Physiol Lung Cell Mol Physiol 286:L631–642. [DOI] [PubMed] [Google Scholar]
- Siegel RL, Miller KD, Jemal A. 2016. Cancer statistics, 2016. CA Cancer J Clin 66:7–30. [DOI] [PubMed] [Google Scholar]
- Spassky N, Merkle FT, Flames N, Tramontin AD, Garcia-Verdugo JM, Alvarez-Buylla A. 2005. Adult ependymal cells are postmitotic and are derived from radial glial cells during embryogenesis. J Neurosci 25:10–18. [DOI] [PMC free article] [PubMed] [Google Scholar]
- Spassky N, Meunier A. 2017. The development and functions of multiciliated epithelia. Nat Rev Mol Cell Biol 18:423–436. [DOI] [PubMed] [Google Scholar]
- Troisi R, Bjorge T, Gissler M, Grotmol T, Kitahara CM, Myrtveit Saether SM, Ording AG, Skold C, Sorensen HT, Trabert B, Glimelius I. 2018. The role of pregnancy, perinatal factors and hormones in maternal cancer risk: a review of the evidence. J Intern Med 283:430–445. [DOI] [PMC free article] [PubMed] [Google Scholar]
- Tung KH, Wilkens LR, Wu AH, McDuffie K, Nomura AM, Kolonel LN, Terada KY, Goodman MT. 2005. Effect of anovulation factors on pre- and postmenopausal ovarian cancer risk: revisiting the incessant ovulation hypothesis. Am J Epidemiol 161:321–329. [DOI] [PubMed] [Google Scholar]
- Van Keymeulen A, Rocha AS, Ousset M, Beck B, Bouvencourt G, Rock J, Sharma N, Dekoninck S, Blanpain C. 2011. Distinct stem cells contribute to mammary gland development and maintenance. Nature 479:189–193. [DOI] [PubMed] [Google Scholar]
- Vanaken GJ, Bassinet L, Boon M, Mani R, Honore I, Papon JF, Cuppens H, Jaspers M, Lorent N, Coste A, Escudier E, Amselem S, Maitre B, Legendre M, Christin-Maitre S. 2017. Infertility in an adult cohort with primary ciliary dyskinesia: phenotype-gene association. Eur Respir J 50. [DOI] [PubMed] [Google Scholar]
- Zappaterra MW, Lehtinen MK. 2012. The cerebrospinal fluid: regulator of neurogenesis, behavior, and beyond. Cell Mol Life Sci 69:2863–2878. [DOI] [PMC free article] [PubMed] [Google Scholar]