

Abstract
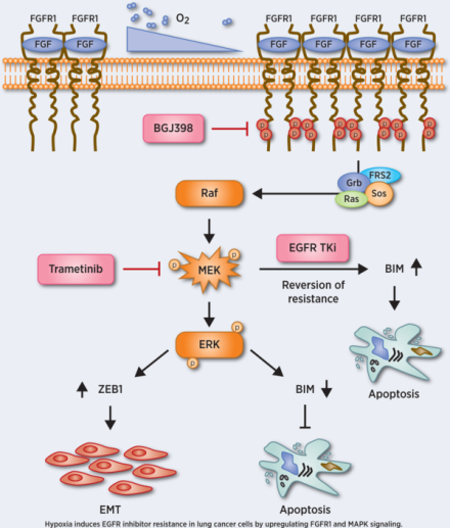
Development of resistance remains the key obstacle to the clinical efficacy of epidermal growth factor receptor (EGFR) tyrosine kinase inhibitors (TKI). Hypoxia is a key microenvironmental stress in solid tumors associated with acquired resistance to conventional therapy. Consistent with our previous studies, we show here that long-term, moderate hypoxia promotes resistance to the EGFR TKI osimertinib (AZD9291) in the NSCLC cell line H1975, which harbors two EGFR mutations including T790M. Hypoxia-induced resistance was associated with development of epithelial-mesenchymal transition (EMT) coordinated by increased expression of ZEB-1, an EMT activator. Hypoxia induced increased fibroblast growth factor receptor 1 (FGFR1) expression in NSCLC cell lines H1975, HCC827 and YLR086, and knockdown of FGFR1 attenuated hypoxia-induced EGFR TKI resistance in each line. Upregulated expression of FGFR1 by hypoxia was mediated through the MAPK pathway and attenuated induction of the pro-apoptotic factor BIM. Consistent with this, inhibition of FGFR1 function by the selective small molecular inhibitor BGJ398 enhanced EGFR TKI sensitivity and promoted upregulation of BIM levels. Furthermore, inhibition of MEK activity by trametinib showed similar effects. In tumor xenografts in mice, treatment with either BGJ398 or trametinib enhanced response to AZD9291 and improved survival. These results suggest that hypoxia is a driving force for acquired resistance to EGFR TKIs through increased expression of FGFR1. The combination of EGFR TKI and FGFR1 or MEK inhibitors may offer an attractive therapeutic strategy for NSCLC.
Graphical Abstract
Introduction
Non-small cell lung cancer (NSCLC) represents approximately 80% of all lung cancers and remains the leading cause of cancer-related mortality worldwide (1). Activating mutations of epidermal growth factor receptor (EGFR) in NSCLCs have been identified in 20% of NSCLC patients, leading to the development of small molecule inhibitors targeting EGFRs with specific activating mutations (2,3). This new therapeutic approach has profoundly changed the clinical landscape for patients with advanced cancers of the lung, and EGFR tyrosine kinase inhibitors (TKIs) have demonstrated efficacy in metastatic EGFR-positive lung cancer patients (4,5). However, most patients eventually develop resistance. An acquired second mutation in EGFR (T790M) has been found to be the primary mechanism of resistance, accounting for 60–70% of cases (6,7). This discovery has advanced the development of third-generation EGFR TKIs to overcome the EGFR T790M mutation. Currently, osimertinib, also known as AZD9291, is the only TKI approved by the FDA for treating this group of patients. However, like the first- and second-generation EGFR TKIs, resistance to AZD9291 has already emerged in the clinic (8), with mechanisms including mutations such as C797S (9) and the activation of alternative pathways or downstream targets via gene amplifications or gene fusions, among other mechanisms (10,11). However, further understanding of the underlying molecular mechanisms of EGFR TKI resistance is still needed to reveal alternative or supplementary strategies that can prevent or overcome acquired resistance.
Hypoxia is a distinctive feature of solid tumors that contributes fundamentally to numerous aspects of tumor biology and is identified as an adverse prognostic factor (12,13). The negative impact of hypoxia on the efficacy of radio- and chemotherapy is well established (12,14,15), It affects drug delivery, DNA repair, regulation of resistance genes, and cell cycle as well as cell death pathways (12,16). In keeping with this, hypoxia may contribute to EGFR TKI resistance.
Like the EGFR family, the fibroblast growth factor receptor (FGFR) family also belongs to the receptor tyrosine kinase (RTK) superfamily and is involved in signal transduction pathways that regulate cell proliferation, differentiation, migration and survival (17,18). Several mutations and alterations, including amplification and overexpression of FGFRs, have been identified in many cancer types over the last several years; therefore, they have potentially become a new target for cancer therapy development (18–21). Small molecule TKIs are the most widely used therapeutic approach to the inhibition of FGFR signaling in patients. They can be divided into two groups: non-selective and selective FGFR TKIs. FGFR-targeted agents are currently under investigation in clinical trials (21). To enhance the antitumor effects of FGFR-targeted therapies, combination with other agents is the main current strategy.
In our previous studies, we demonstrated that hypoxia promotes resistance to the TKI gefitinib in NSCLC cells in a pathway linked to features of epithelial-to-mesenchymal transition (EMT) and dependent on the function of the histone lysine demethylases LSD1 and PLU-1 (22). In this study, we further demonstrate that long-term, moderate hypoxia also induces resistance to the third-generation EGFR TKI osimertinib (AZD9291) in the NSCLC cell line H1975, which developed resistance to first- and second-generation EGFR TKIs via the T790M EGFR mutation. Consistent with our previous studies, the resistance is also accompanied by features of EMT including up-regulated ZEB-1, an EMT-related transcription factor. Mechanistically, we show that hypoxia increases FGFR1 expression in NSCLC cell lines H1975, HCC827 and YLR086, accompanied by down-regulated expression of the pro-apoptotic factor Bcl-2-like protein 11 (commonly designated as BIM). We also found FGFR1-induced EGFR TKI resistance is mainly mediated through the MAPK pathway. Finally, both the FGFR inhibitor BGJ398 and the MEK inhibitor trametinib enhanced EGFR TKI sensitivity in TKI-resistant lung cancer cell lines in vitro and in vivo. These findings suggest novel therapeutic strategies to prevent or overcome EGFR TKI resistance in NSCLC by combining EGFR inhibitors with FGFR1 inhibitors or MEK inhibitors.
Materials and Methods
Cells
HCC827 and H1975 cells were obtained from the ATCC (Manassas, VA) and grown in RPMI 1640 with 10% FBS. YLR086 is a patient-derived cell line, which was obtained from Dr. Katerina Politi (Yale University, Pathology Department) and the cells were cultured in RPMI with 10% FBS. All cell lines tested negative for mycoplasma.
Constructs
Lentiviral shRNA vectors for FGFR1 knockdown were obtained from Sigma-Aldrich (FGFR1: TRCN0000312516). TRIPZ inducible lentiviral FGFR1 shRNA vectors were purchased from Dharmacon-Horizon Discovery (RHS4696–200770323 & RHS4696–200776975).
Hypoxia
For moderate hypoxia (1% O2), cells were cultured in a hypoxic incubator (New Brunswick Galaxy 170 R, Eppendorf), which is maintained to achieve a constant O2 concentration within the entire incubator for the indicated times. The CO2 level was maintained at 5% using an internal CO2 regulation system.
Western blots
Cells were lysed in RIPA buffer (25 mM Tris-HCl pH 7.6, 150 mM NaCl, 1% Igepal CA-630, 1% sodium deoxycholate, 0.1% SDS) with supplemented with protease inhibitor cocktail (Roche) and PhosSTOP (Sigma). Band intensities were quantified using ImageJ64 software. Descriptions of the antibodies used can be found in Supplementary Materials and Methods. β-actin was used as an endogenous loading control.
Survival assays
Cell survival was assayed by clonogenic assays, cell proliferation assays, or monolayer growth. For clonogenic assays, after the H1975 cells were exposed to normoxia or hypoxia for 4 weeks, cells were seeded at 500/well in 6-well plates and treated with AZD9291 or WZ4002 (Selleckchem) at the indicated concentrations. Colonies were washed with 0.9% saline solution and stained with crystal violet 10–14 days later. Colonies consisting of >50 cells were counted. Colony formation was normalized to plating efficiency of the untreated cells. Errors bars in the survival analysis are based on three independent experiments. For cell proliferation assay, after the H1975 cells were exposed to normoxia or hypoxia for 4 weeks, 1X10⁵ cells were seeded in 100 mm dish and treated with AZD9291 or WZ4002 (Selleckchem) at 1 μM. Cell growth inhibition by AZD9291 and WZ4002 in H1975 N and H1975 H cells were measured by serial cell counts after 3, 6 and 9 days treatment. To quantify survival by monolayer growth, cells were seeded at a defined density in 6-well plates and treated with AZD9291 at the indicated concentrations for 5 days. Cells were stained with crystal violet for monolayer visualization and then the stain was dissolved in 70% ethanol and quantified by plate reader.
Quantitative real-time PCR analysis
For quantitative PCR analysis of endogenous ZEB-1 and FGFR1 mRNA expression, total RNA was prepared using the Absolutely RNA® Miniprep Kit (Qiagen). A total of 2 μg RNA was used to synthesize cDNA using the High Capacity cDNA Reverse Transcription kit (AB Applied Biosystems). The resulting cDNA was used in PCR reactions containing Taqman Universal PCR Master Mix (Applied Biosystems) and premixed Taqman probes and primers for FGFR1, ZEB-1 and 18S (internal control) (Applied Biosystems). A StepOnePlus RT-PCR system (Thermo Fisher Scientific) was used to measure fluorescence intensity in the real time and to calculate cycle thresholds.
Establishment of hypoxia-induced gefitinib-resistant HCC827 clones
After HCC827 cells were exposed to 1% O2 for 35 days, hypoxic cells were selected with gefitinib at 5 μm for 3 weeks, and the resistant clones were collected for further studies. The HCC827 C2–3 and C2–10 clones were selected at random for further study. The details have been described in our previous study (22).
Xenograft studies
Female athymic nu/nu mice (Envigo/Harlan) were used for in vivo xenograft studies. All studies were approved by the Yale University Institutional Animal Care and Use Committee (IACUC). Mice were quarantined for at least 1 week before experimental manipulation. For studying the effects of combination therapy of AZD9291 and BGJ398 (Selleckchem) on tumor growth, 2×10⁶ hypoxic H1975 cells (grown in 1% O2 for 4 weeks) in Matrigel were implanted subcutaneously in the right flanks of athymic nu/nu mice (N=10 per group). After the tumors reached 100 mm3, the mice were treated with DMSO, AZD9291 alone, BGJ398 alone, or AZD9291 plus BGJ398. AZD9291 (5 mg/kg) and BGJ398 (12.5 mg/kg) were delivered three times/week via oral gavage. Mice were visually observed daily, and tumors were measured three times per week by calipers to determine the tumor volume using the formula: V=4/3π(length/2)(width/2)(depth/2).
For studying the effects of combination therapy of AZD9291 and trametinib (Selleckchem) on tumor growth, 2×10⁶ hypoxic H1975 cells in Matrigel were implanted subcutaneously in the right flanks of athymic nu/nu mice (N=10 per group). After the tumors reached 100 mm3, the mice were treated with DMSO, AZD9291 alone, trametinib alone, or AZD9291 plus trametinib. AZD9291 (5 mg/kg) and trametinib (1 mg/kg) were delivered three times/week via oral gavage. Mice were visually observed daily, and tumors were measured three times per week by calipers to determine the tumor volume using the formula above.
Patient material and primary culture
Patient samples of the EGFR mutated tumors were collected at the University Hospital Essen under IRB approval. Tumor samples were homogenized using the Tumor Dissociation Kit and a gentleMACS Octo Dissociator (Miltenyi Biotec Inc.) according to the manufacture’s manual with the 37C_h_TDK_2 program. Red blood cells were removed with the Red Blood Cell Lysis Solution (Miltenyi Biotec Inc.). Cells were resuspended in RPMI full growth media including Pen/Strep and transferred to a cell culture flask. Cells were stable and steadily growing for at least two weeks under normal cell culture conditions.
R2: Genomics Analysis and Visualization
Correlations of gene expression were analyzed using the “R2: Genomics Analysis and Visualization Platform” (http://r2.amc.nl) based on the Cancer Cell Line Encyclopedia (CCLE, Broad Institute) database with a subtype filter for adenocarcinoma (136 samples). Correlation factor R and p-values were directly calculated with the R2 platform algorithms.
Evaluation of synergism
The synergistic growth inhibitory effects of combinations of EGFR TKIs (AZD9291 or gefitinib) and FGFR1 inhibitor (BGH398) or MEK inhibitor (trametinib) were analyzed by Combenefit software (https://sourceforge.net/projects/combenefit/). Data are presented as means ± SEM and compared using Student’s t-test or ANOVA with repeated measures when appropriate. All tests were two-sided. A P-value of less than 0.05 was considered statistically significant.
Results
Growth in moderate hypoxia promotes AZD9291 resistance in H1975 cells harboring the T790M mutation
The main challenge in TKI therapy, including EGFR TKIs, is the development of resistance in tumors (11,23). In our previous work, we showed that long-term moderate hypoxic exposure induced gefitinib resistance in HCC827 and YLR086 cells that harbored an activating EGFR mutation (22). To further investigate the effect of hypoxia in promoting EGFR TKI resistance, we evaluated whether hypoxia induces resistance to third-generation EGFR TKIs (AZD9291 and WZ4002, a commercially available selective TKI), which are used to target tumors with the T790M EGFR mutation that are resistant to first- and second-generation EGFR TKIs such as gefitinib (8). We used H1975, a NSCLC cell line harboring two EGFR mutations including the clinically relevant T790M, and the cells were exposed to normoxia or 1% O2 for 4 weeks (Fig. 1A). Both sets of cells were then tested for inhibition of cell growth by AZD9291 and WZ4002 under normoxic conditions by several methods. First, cell survival was measured by clonogenic survival assays. The cell survival rate was increased 2-fold in hypoxic H1975 cells compared to normoxic cells with both AZD9291 (Fig. 1B, left panel, p<0.001) and WZ4002 (Fig. 1B, right panel, p<0.001). Similarly, serial cell counts to measure cell proliferation showed that after AZD9291 or WZ4002 treatment for 3, 6, or 9 days, the number of H1975 cells in the normoxic cell population was only half that of hypoxic cells under the same treatment (p<0.001) (Fig. 1C). Finally, monolayer assays further confirmed that hypoxic H1975 cells have better survival than normoxic H1975 cells after both AZD9291 and WZ4002 treatment (Fig. 1D). Consistent with our previous studies (22), these data suggest that long-term mild hypoxia exposure promotes resistance to third-generation EGFR TKIs in H1975 cells. To assess the effect of moderate long-term hypoxia exposure on clonogenic survival capacity, we compared the normoxic and hypoxic HCC827 and H1975 cells with respect to survival by clonogenic assay under normoxic conditions. We did not find significant differences in clonogenic survival either between normoxic and hypoxic H1975 (p=0.148) or between normoxic and hypoxic HCC827 cells (p=0.312) (Fig. S1A).
Fig. 1. Growth in moderate hypoxia promotes AZD9291 resistance in H1975 cells harboring the T790M mutation.

After H1975 cells were exposed to normoxia (H1975 N) or to 1% O2 (H1975 H) for 4 weeks, they were tested under normoxic conditions for AZD9291 or WZ4002 sensitivity at the indicated concentrations. (A) Schematic of experimental design. (B) Cell survival measured by clonogenic assays of H1975 N and H1975 H cells treated with AZD9291 or WZ4002. Error bars represent SEs from three replicates (AZD9291: two-way ANOVA, interaction p<0.001; WZ4001: two-way ANOVA, interaction p<0.001). (C) Cell growth inhibition by AZD9291 and WZ4002 at 1 μM in H1975 N and H1975 H cells measured by serial cell counts at the indicated days of treatment. Error bars represent SEs from three replicates (t-test at each time point, P-values are indicated). (D) Monolayer growth assays demonstrate that H1975 H cells are resistant to AZD9291 and WZ4002 compared to H1975 N cells. H1975 N and H1975 H cells were treated with AZD9291 or WZ4002 at the indicated concentrations, and cells were visualized by staining with crystal violet, with images of stained monolayers in the upper panel. The stain was dissolved in 70% ethanol and analyzed by plate reader. The relative growth of the H1975 N and H1975H cells in response to EGFR TKI treatment (AZD9291 or WZ4002) is quantified in the lower panels.
To evaluate if the hypoxia-induced EGFR TKI resistance is persistent even after switching to growth under normoxia, we reexposed hypoxic H1975 cells and a hypoxia-induced gefitinib-resistant HCC827 clone, C2–10, to normoxia for 10 or 20 days, and then examined the cell sensitivity to AZD9291 or gefitinib, respectively, by clonogenic assays, performed under normoxia. We found that H1975 and HCC827 C2–10 previously grown under hypoxia retain their resistance to AZD9291 or gefitinib (Fig. S1B–D), suggesting the resistance induced by hypoxia persists even after a return to normoxic conditions.
Hypoxia induces EMT in H1975 cells by up-regulation of EMT transcription factor ZEB-1
In our previous work, we found that hypoxia promotes gefitinib resistance in HCC827 cells and primes cells for gefitinib-induced EMT (22). We decided to interrogate EMT markers in both normoxic and hypoxic H1975 cells. Consistently, western blot analyses showed decreased E-cadherin, an epithelial marker, and increased N-cadherin, fibronectin and vimentin, all mesenchymal markers, in hypoxic H1975 cells compared to normoxic cells, regardless of AZD9291 treatment (Fig. 2A). Next, we examined EMT transcription factor expression at the protein level in normoxic and hypoxic H1975 cells. Using hypoxia-induced gefitinib-resistant HCC827 clones, we have shown that some, but not all, EMT transcription factors, e.g., TWIST1 and SLUG, are increased in gefitinib-resistant HCC827 clones (22). Therefore, we examined EMT transcription factor levels in normoxic and hypoxic H1975 cells. This time, we found a significant increase in ZEB-1 in hypoxic H1975 cells at both the protein and mRNA levels, independent of AZD9291 treatment (Fig. 2B). Increased ZEB-1 was also found in hypoxia-induced gefitinib-resistant HCC827 clones C-3 and C2–10, at both protein and mRNA levels (Fig. 2C). Using immunofluorescence assays, we further confirmed that ZEB-1 is significantly increased in hypoxic H1975 cells and in hypoxia-induced gefitinib-resistant HCC827 clone C2–10 (Fig. 2D&E). Taken together, our data suggest that long-term hypoxia promotes AZD9291 resistance in H1975 cells. This is accompanied by features of EMT, namely the up-regulation of EMT transcription factor ZEB-1. Additionally, we found a correlation between HIF1α and EMT markers like VIM and ZEB1 by analyzing Cancer Cell Line Encyclopedia (CCLE) data from 136 adenocarcinoma samples in R2: Genomics Analysis and Visualization Platform data base (Fig. S2A, left and middle).
Fig. 2. Hypoxia induces EMT in H1975 cells by up-regulation of EMT transcription factor ZEB-1.
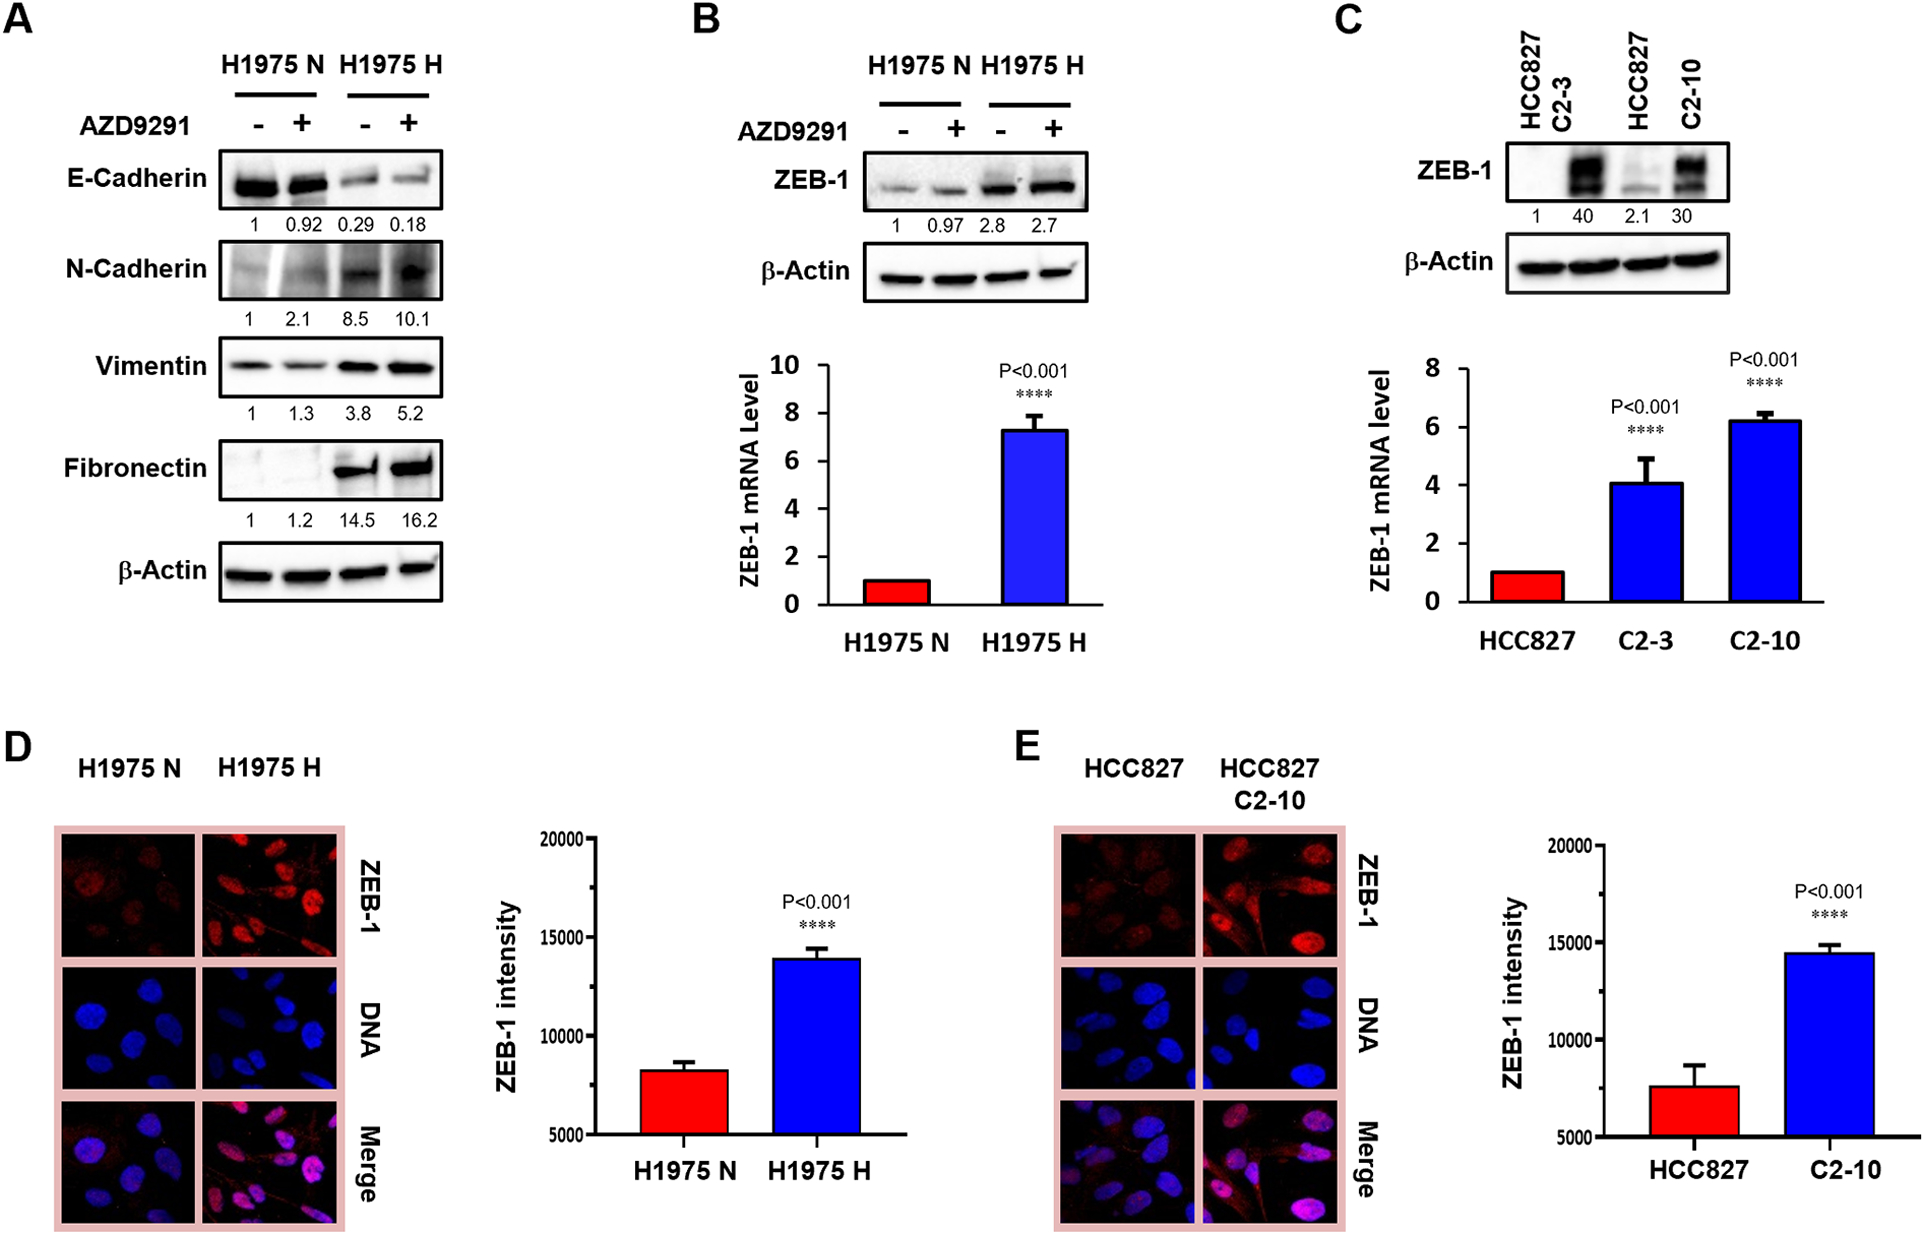
Normoxic (H1975 N) and hypoxic (H1975 H) H1975 cells were established as demonstrated in Fig1. after H1975 cells were exposed to normoxia (H1975 N) or to 1% O2 (H1975 H) for 4 weeks. (A) Western blot of EMT markers E-cadherin, N-cadherin, fibronectin and vimentin in normoxic (H1975 N) and hypoxic (H1975 H) H1975 cells with or without AZD9291 treatment at 1 μM. The relative band density values are shown below each panel. (B) ZEB-1 protein levels by western blot in H1975 N and H1975 H cells with or without AZD9291 treatment (top panel) and ZEB-1 mRNA levels in H1975 N and H1975 H cells by qRT-PCR (bottom panel). (C) Analysis of ZEB-1 expression levels by western blot (top panel) and by qRT-PCR (bottom panel) in parental HCC827 cells and in hypoxia-induced gefitinib-resistant HCC827 clones C2–3 and C2–10. (D) Immunofluorescence assay to examine ZEB-1 expression in H1975 N and H1975 H cells. Representative images of immunofluorescence of ZEB-1 (left) and quantification of ZEB-1 expression (right). Error bars represent SEs from three replicates (t-tests of corresponding H and N cells, P-values are indicated). (E) Immunofluorescence assay to examine ZEB-1 expression in HCC827 clone C2–10 compared to the parental line. Representative images of immunofluorescence of ZEB-1 (left) and quantification of ZEB-1 expression (right). Error bars represent SEs from three replicates (t-tests of corresponding H and N cells, P-values are indicated).
Hypoxia induces the up-regulation of FGFR1 in NSCLC
FGFR signaling has been associated with resistance to the EGFR/HER2 kinase inhibitor lapatinib and is involved in EMT (24). The FGF2-FGFR1 autocrine growth loop is also one of the mechanisms associated with gefitinib resistance (25). In addition, it has been shown that FGFR1 promotes cell proliferation and EMT in lung cancer (26). To evaluate the correlation among the hypoxia, FGFR1 or other RTKs and EMT, we interrogated the CCLE database, which revealed a correlation of mRNA levels between HIF1α and FGFR1 expression (Fig. S2A, right). Interestingly, HIF1 α was not correlated with other RTKs, such as VEGFR1, IGF1R and c-MET (Fig. S2B). Furthermore, we found that FGFR1 expression was positively correlated with the EMT-associated factors, ZEB1, N-cadherin and vimentin (Fig. S2C), but negatively related to E-cadherin (Fig. S2D, left). Other RTKs did not show a correlation to EMT-related proteins (Fig. S2D, middle and right).
To further investigate the impact of hypoxia on FGFR family or other RTKs expression, we performed microarray gene expression analyses comparing HCC827 cells and hypoxia-induced gefitinib resistant clones, HCC827 C2–3 and C2–10 cells (Array Express, Access #: E-MTAB-9452). The results indicate that FGFR1 expression is significantly increased at the mRNA level in hypoxia-induced gefitinib resistant clones, HCC827 C2–3 and C2–10 cells (p=0.008) among the FGFR family members (Fig. S3A). There was no increase among EGFR family members, and ERBB3 was significantly deceased (Fig. S3B, p=0.008), whereas we found that expression of insulin-like growth factor 1 receptor (IGF1R) (Fig. S3C, p=0.039) was increased in HCC827 C2–3 and C2–10 cells. Also, there were no changes among the VEGFR and PDGFR family (Fig. S3D&E), but tyrosine-protein kinase receptor UFO (AXL) expression was increased in HCC827 C2–3 and C2–10 cells (Fig. S3F, p<0.001).
Based on these findings, we next evaluated FGFR levels in hypoxic NSCLC cell lines H1975, HCC827 and YLR086 (Fig. 3A). By western blot analyses, we found increased FGFR1 protein levels in all three cell lines, compared to their normoxic controls, independent of treatment with TKIs (Fig. 3B). We observed similar results at the mRNA level, as assessed by quantitative real-time polymerase chain reaction (qRT-PCR) (Fig. 3C). We did not observe significant changes of FGFR2 and FGFR3 expression at protein levels upon normoxic and hypoxic exposure in these cell lines (Fig. S4). For additional clinical correlation, we analyzed two NSCLC patient tumor samples, patient 1 with T790M mutation showing resistance to AZD9291 and patient 2 with EGFR Exon 19 deletion. By using H1975 parental cells as control, the tumor cells were tested for HIF1 expression, along with RTK expression, by RT-PCR. We found that the HIF1α and HIF2α levels were increased in the patient 1 sample, not patient 2 (Fig. S5A and B), with similar trends for FGFR1 levels (Fig. S5C) and ZEB1 levels (Fig. S5D), but not other RTKs, including IGF1R, VEGFR1 (FLT1), EGFR, and ERBB3 (Fig. S5E–H). Taken all together, our data suggest that hypoxia is a driving force to induce upregulation of FGFR1, which further promotes EMT.
Fig. 3. Hypoxia induces the up-regulation of FGFR1 in NSCLCs.

(A) Schematic of experimental design in H1975, HCC827 and YLR086 cells to examine the impact of hypoxia on FGFR1 expression. (B) Western blot of FGFR1 in normoxic (N) and hypoxic (H) H1975 cells, HCC827 cells and YLR086 cells with or without AZD9291 or gefitinib treatment. The relative band density values are shown below each panel. (C) Relative FGFR1 expression at mRNA levels measured by qRT-PCR in N and H H1975, HCC827 and YLR086 cells. Error bars represent SEs from three replicates (t-tests of corresponding H and N cells, P-values are indicated). (D) Schematic of experimental design to examine the impact of knockdown of FGFR1 (or GFP, as a control) by a constitutive shRNA system on drug resistance mediated by subsequent hypoxia treatment in H1975, HCC827 and YLR086 cells. (E) Knockdown of FGFR1 in NCSLCs prevents hypoxia-induced EGFR TKI resistance. Clonogenic assays were performed in normoxic and hypoxic H1975, HCC827 and YLR086 cells with FGFR1 (or GFP) knockdown (shFGFR1 and shGFP, respectively) to test AZD9291 or gefitinib sensitivity at the indicated concentrations. Error bars represent SEs from three replicates (t-tests of corresponding H knockdown cells, P-values are indicated). (F) Schematic of experimental design to test the ability of knockdown of FGFR1 (by a doxycycline inducible TRIPZ lentiviral shRNA system) to reverse the acquired drug resistance in H1975 cells after hypoxia exposure. (G) Knockdown of FGFR1 (by Dox treatment to induce the shRNA) in H1975 cells after growth in hypoxia reverses the acquired resistance to AZD9291. After doxycycline treatment for 3 days, clonogenic assays were performed to test cell survival in the presence of AZD9291 at the indicated concentrations (two-way ANOVA, interaction P < 0.001; error bars represent SEs from three replicates). (H) Schematic of experimental design to test the effect of knockdown of FGFR1 (by a doxycycline-inducible TRIPZ lentiviral shRNA system) in hypoxia-induced gefitinib-resistant HCC827 sub-clone, C2–10. (I) Knockdown of FGFR1 in HCC827 C2–10 cells restores gefitinib sensitivity. After doxycycline treatment for 3 days, clonogenic assays were performed in HCC827 C2–10 cells treated with gefitinib at the indicated concentrations (two-way ANOVA, interaction P < 0.001; error bars represent SEs from three replicates).
To further probe the role of FGFR1 in hypoxia-induced EGFR TKI resistance, we used a constitutive short hairpin RNA (shRNA) system to knock down FGFR1 in H1975 cells.1975 shFGFR1) and control H1975 shGFP cells were exposed to normoxia or 1% O2 for 4 weeks. Next, clonogenic survival assays were performed to test AZD9291 sensitivity in H1975 shGFP and H1975 shFGFR1 cells (Fig. 3D). Consistent with our previous results (Fig. 1), AZD9291 resistance increased by around 2-fold after hypoxia exposure in control H1975 shGFP cells, (Fig. 3E). In contrast, knockdown of FGFR1 by shRNA attenuated the hypoxia induced AZD9291 resistance (Fig. 3E; the FGFR1 protein expression levels in FGFR1 knockdown cell lines are shown in Fig. S6A). These results were confirmed in two additional NSCLC cell lines, HCC827 and YLR086, in which FGFR1 knockdown rescued sensitivity to gefitinib (Fig. 3D&E; Fig. S6A). These data suggested that knockdown of FGFR1 prevents hypoxia-induced EGFR TKI resistance in NSCLCs.
Next, we asked whether inhibition of FGFR1 function can not only prevent but reverse hypoxia induced EGFR TKI resistance. Using a doxycycline-inducible TRIPZ lentiviral shRNA system to knock down FGFR1, along with control non-targeting (NT) doxycycline-inducible shRNA (shNT), we tested the effect of FGFR1 knockdown on cells that had already acquired EGFR TKI resistance by exposure to chronic hypoxia. To do so, we established normoxic H1975 shNT, hypoxic H1975 shNT and hypoxic H1975 shFGFR1 cell lines (Fig. 3F). Using these cells, clonogenic survival assays were performed to assess sensitivity to AZD9291 upon dox-mediated induction of FGFR1-targeting shRNAs (Fig. 3F), and knockdown of FGFR1 in hypoxic H1975 cells reversed AZD9291 resistance compared to the uninduced hypoxic H1975 shFGFR1 cells (Fig. 3G, Fig. S6B). Similarly, we also established HCC827 C2–10 shNT and HCC827 C2–10 shFGFR1 cells (Fig. 3H), and knockdown of FGFR1 reversed gefitinib resistance in the C2–10 shFGFR1 cells (Fig. 3I, Fig. S6B). These data provide evidence that knockdown of FGFR1 reverses hypoxia-induced EGFR TKI resistance in H1975 cells and gefitinib-resistant HCC827 clone. Taken together, these results show that hypoxia exposure up-regulates FGFR1 expression, which is associated with AZD9291 resistance. Thus, interference with FGFR1 function by shRNA knockdown is sufficient to reverse EGFR TKI resistance in lung cancer cells.
FGFR1 contributes to EGFR TKI resistance via MAPK activation
As a member of the RTK superfamily, FGFR1 works mainly through MAPK and PI3K signal transduction pathways to regulate cell proliferation, differentiation, migration and survival. To evaluate the signaling transduction pathways through which the hypoxia-up-regulated FGFR1 promotes EGFR TKI resistance in NSCLC cells, we tested MAPK pathway and PI3K pathway activation by measuring the levels of phosphorylated ERK (p-ERK) and phosphorylated AKT (p-AKT), respectively, in normoxic and hypoxic H975 cells treated with AZD9291 at 1 μM in serum-free medium for 2 days. Compared to normoxic H1975 cells in which the level of p-ERK was dramatically inhibited by AZD9291, the inhibitory effect of AZD9291 on p-ERK in hypoxic H1975 cells was attenuated (Fig. 4A, left panel). Interestingly, p-AKT was not detected in either normoxic or hypoxic H1975 cells under serum free conditions, regardless of AZD9291 treatment (Fig. 4A, left panel). Similarly, gefitinib inhibited ERK phosphorylation in parental HCC827 cells, but failed to inhibit p-ERK in hypoxia-induced gefitinib-resistant HCC827 clones C2–10 (Fig. 4A, right panel). Untreated HCC827 C2–10 cells present with much lower p-AKT levels than parental HCC827; however, p-AKT even more reduced upon administration of gefitinib (Fig. 4A).
Fig. 4. FGFR1 contributes to EGFR TKI resistance via MAPK activation.

(A) Western blot analyses of p-ERK, total ERK (T-ERK), p-AKT and total AKT (T-AKT) expression in normoxic and hypoxic H975 cells after treatment with AZD9291 at 1 μM in serum-free medium for 2 days, or in parental HCC827 cells and hypoxia-induced gefitinib-resistant HCC827 clone C2–10 cells after treatment with gefitinib at 1 μM in serum-free medium for 2 days. (B) Western blot analyses of p-ERK, total ERK (T-ERK), p-AKT and total AKT (T-AKT) expression in hypoxic H975 cells treated with or without AZD9291 at 1 μM or BGJ398 at 1 μM in serum-free medium for 2 days as indicated along with western blot analysis of the same factors in hypoxia-induced gefitinib-resistant HCC827 clone C2–10 were treated with or without gefitinib at 1 μM or BGJ398 in serum-free medium for 2 days. (C) Western blot analyses of p-ERK, total ERK (T-ERK), p-AKT and total AKT (T-AKT) expression in normoxic and hypoxic H975 cells after treatment with AZD9291 at 1 μM in serum-free medium for 2 days and then with or without stimulated with FGF2 at 10 ng/mL for the indicated times. (D) Western blot analyses of p-ERK, T-ERK, p-AKT and T-AKT expression in normoxic and hypoxic H975 cells that were treated or not with AZD9291 at 1 μM in serum-free medium for 2 days and then with or without BGJ398 for additional 4 hours. Then the cells were stimulated with FGF2 at 10 ng/mL for the indicated times. (E) Western blot analyses for p-ERK, T-ERK, p-AKT and T-AKT expression in parental HCC827 and hypoxia-induced gefitinib-resistant HCC827 clone C2–10 that were treated with gefitinib at 1 μM in serum-free medium for 2 days and then stimulated with FGF2 at 10 ng/mL for the indicated times. (F) Western blot analyses of p-ERK, T-ERK, p-AKT and T-AKT expression in parental HCC827 cells and hypoxia-induced gefitinib-resistant HCC827 clone C2–10 cells that were treated or not with gefitinib at 1 μM in serum-free medium for 2 days and then with or without BGH398 for additional 4 hours. Then the cells were stimulated with FGF2 at 10 ng/mL for the indicated times. Relative band density values normalized to β-actin are shown as indicated.
Under the same conditions, the FGFR inhibitor BGJ398 did not show inhibitory effects on p-ERK in hypoxic H1975 cells, but the combination of AZD9291 and BGJ398 led to enhanced p-ERK downregulation (Fig. 4B, left panel). Consistently, the combination of gefitinib and BGJ398 substantially inhibited p-ERK in hypoxia-induced gefitinib-resistant HCC827 clones C2–10 (Fig. 4B, right panel) and C2–3 (Fig. S7A) Similar results were also observed with the combination of the non-selective FGFR inhibitor ponatinib with AZD9291 or gefitinib, which further inhibited p-ERK in hypoxic H1975 cells (Fig. S7B) and HCC827 clones, C2–3 and C2–10 (Fig. S7C&D).
To further assess the difference in the FGFR1 signaling transduction pathways in hypoxic NSCLC cells, the normoxic and hypoxic H1975 cells were treated with AZD9291 in serum-free medium for 2 days to inhibit EGFR signaling transduction, and then stimulated by FGF2 at 10 ng/mL for the indicated times (Fig. 4C). Again, we observed AZD9291 showed less inhibitory effect on p-ERK in hypoxic H1975 cells, but FGF2 stimulation activated higher levels of p-ERK in hypoxic H1975 cells than in normoxic H1975 cells (Fig. 4C). As expected, FGF2-induced p-ERK was counteracted by pre-incubation of hypoxic H1975 cells with the FGFR inhibitor, BGJ398 (Fig. 4D).
Similarly, gefitinib suppressed p-ERK and p-AKT in parental HCC827 cells in serum-free medium, but FGF2 showed limited activation of p-ERK and p-AKT, consistent with the low FGFR1 level in this cell line, but gefitinib did not show any effect to inhibit p-ERK in hypoxia-induced gefitinib-resistant C2–10 cells (Fig. 4E). As shown above, BGJ398 completely inhibited any effects of FGF2 on p-ERK levels in C2–10 cells (Fig. 4F). These results suggest the presence of constitutive activation of FGFR1 in gefitinib-resistant C2–10 cells. Taken together, the results indicate that up-regulated expression of FGFR1 by hypoxia sustains MAPK activation in NSCLC cells.
Hypoxia-associated decrease in BIM induction is reversed by inhibition of FGFR1 or inhibition of MEK
BIM, a BH3-only pro-apoptotic protein, has been indicated to be involved in TKI-induced apoptosis in NSCLCs with EGFR activating mutations (27). Suppression of BIM expression, or BIM deletion, are associated with drug resistance (28–30). To understand the role of BIM in hypoxia-induced EGFR TKI resistance, we examined BIM levels in normoxic and hypoxic NSCLC cells after EGFR TKI treatment. We found that the induction of BIM by AZD9291 treatment is blunted in hypoxic H1975 cells, compared to normoxic H1975 cells (Fig. 5A, left panel). Similar results were seen in hypoxic HCC827 and YLR086 cells treated with gefitinib (Fig. 5A, middle and right panels).
Fig. 5. Hypoxia-associated decrease in BIM induction is reversed by inhibition of FGFR1 or inhibition of MEK.
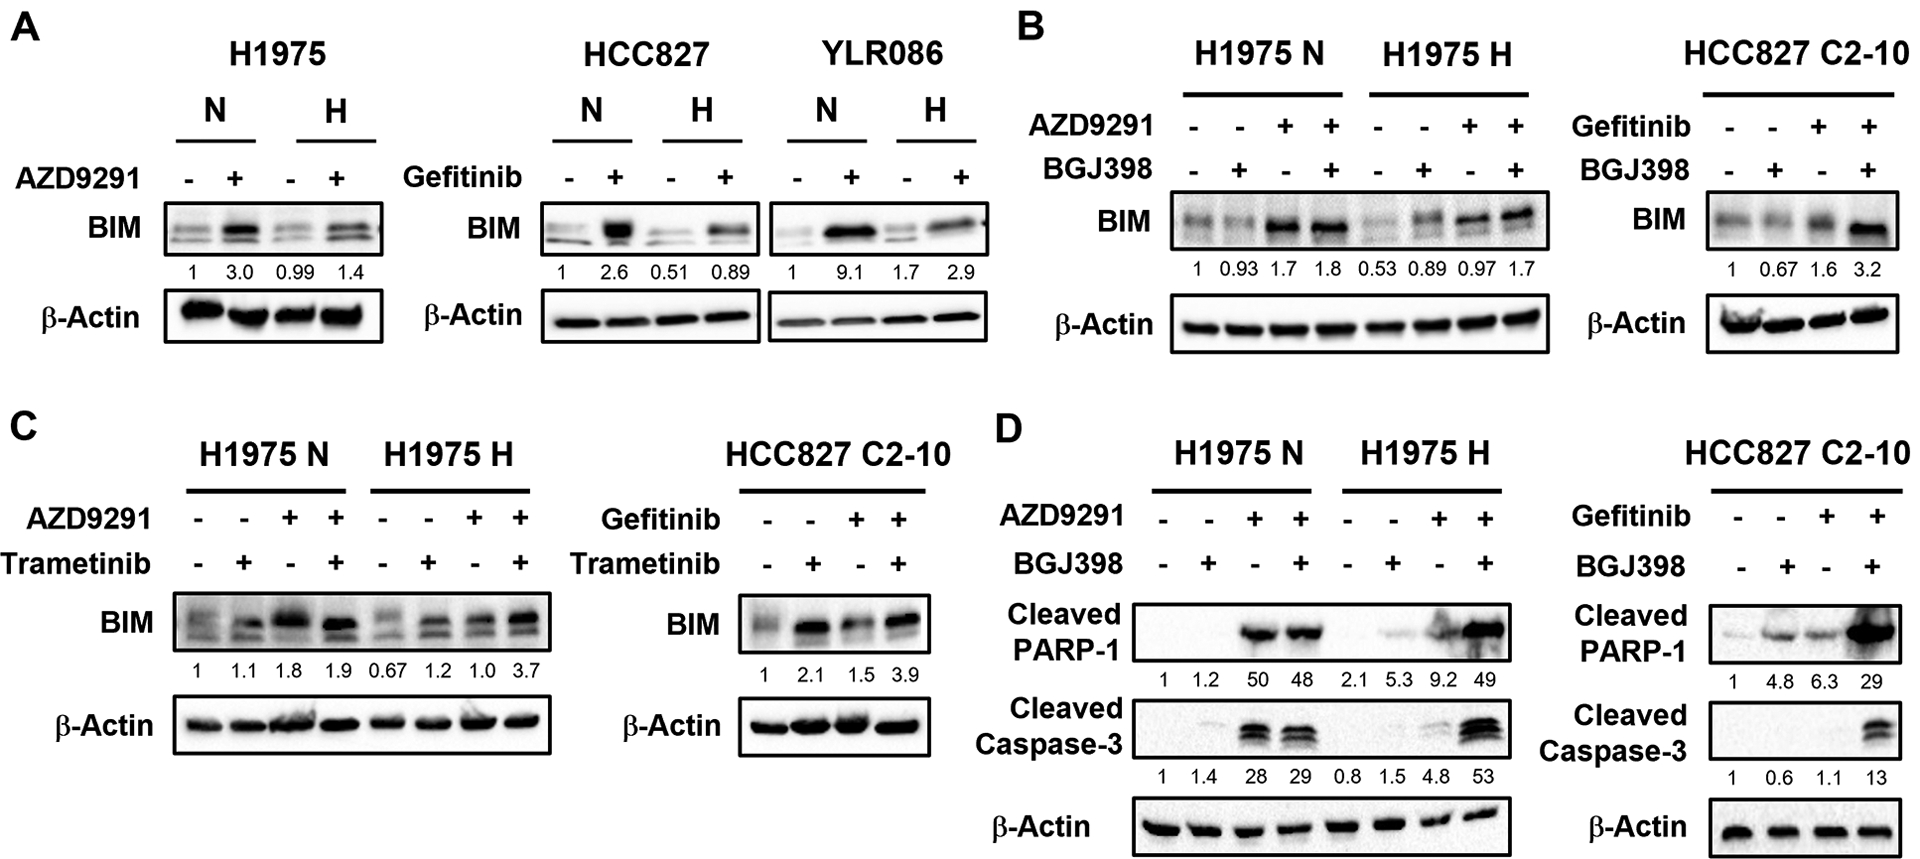
(A) BIM induction in hypoxic (H) H1975 cells by AZD9291 or in hypoxic HCC827 and YLR086 cells by gefitinib is attenuated, compared to normoxic (N) cells. BIM levels were analyzed by western blotting and the relative band density values are shown below each panel (B) Combination treatment with BGJ398 and AZD9291 induces BIM protein expression in H1975 H cells (left panel); or combination treatment with BGJ398 and gefitinib induces BIM protein expression in hypoxia-induced gefitinib-resistant HCC827 C2–10 clones (right panel), as detected by western blot analysis. The relative band density values are shown below each panel. (C) Combination treatment with trametinib and AZD9291 induces BIM protein expression in H1975 H (left panel); or combination treatment with trametinib and gefitinib in hypoxia-induced gefitinib-resistant HCC827 C2–10 clones (right panel), as detected by western blot analysis. The relative band density values are shown below each panel. All the drug treatments in this figure were last for 48 hours. (D) Combination treatment with BGJ398 and AZD9291 induces apoptosis in H1975H cells and combination treatment with BGJ398 and gefitinib induces apoptosis in hypoxia-induced gefitinib-resistant HCC827 C2–10 cells. Levels of cleaved PARP-1 and cleaved caspase 3 were detected by western blot analysis in H1975 H cells with or without BGJ398 and AZD9291 combination treatment or in gefitinib-resistant HCC827 C2–10 clone with or without BJG398 and gefitinib combination treatment. The relative band density values are shown below each panel. All the drug exposures in this figure were for 48 hours.
As shown above, FGFR1 expression is up-regulated by hypoxia. We hypothesized that the attenuation of AZD9291-induced BIM expression by hypoxia is mediated through FGFR1 signaling. To test this, we assessed the effect of combined AZD9291 and BGJ398 treatment on BIM levels in normoxic and hypoxic H1975 cells. If our hypothesis is true, the BIM levels should be up-regulated by the combination in hypoxic H1975 cells, compared to AZD9291 alone. As expected, we observed that BGJ398 treatment restored the induction of BIM after AZD9291 treatment (Fig. 5B, left panel). Combination of gefitinib with BGJ398 in hypoxia-induced gefitinib-resistant HCC827 C2–10 clones also substantially increased BIM levels, compared to gefitinib alone (Fig. 5B, right panel). Next we tested whether the effect of up-regulated FGFR1 on BIM expression could be blocked by the MEK inhibitor trametinib. We found that the addition of trametinib to AZD9291 enhanced BIM induction in hypoxic H1975 cells (Fig. 5C, left panel). Similarly, trametinib alone or in combination with gefitinib increased BIM levels in HCC827 C2–10 cells (Fig. 5C, right panel). To further investigate whether the increased BIM induced by the combination of BGJ398 with EGFR TKIs increases apoptosis in hypoxia-induced resistant lung cancer cells, we examined cleaved PARP-1 and cleaved caspase 3 by western blot. We observed increased cleaved PARP-1 and cleaved caspase 3 in response to combination treatment in hypoxic H1975 and hypoxia-induced gefitinib resistant HCC827 C2–10 cells, which is consistent with induced apoptosis in correlation with BIM upregulation in these cell lines (Fig. 5D).
Selective FGFR1 inhibitor BGJ398 enhances EGFR TKI sensitivity in hypoxic NSCLC cells
We then tested whether FGFR1 inhibition would enhance EGFR TKI sensitivity in hypoxic NSCLC cells. By clonogenic assay, we observed that BGJ398 treatment significantly increased AZD9291 sensitivity in hypoxic H1975 cells (Fig. 6A). A Loewe analysis of potential synergy found that BGJ398 and AZD929 were strongly synergistic at several doses (Fig. 6B). We also tested the combination of BGJ398 and gefitinib in hypoxia-induced gefitinib-resistant HCC827 clones C2–10 and C2–3. Similar results were confirmed in both cell lines (Fig. 6C&D and Fig. S8A). In contrast to hypoxic H1975 and hypoxia-induced gefitinib-resistant HCC827 clones, in normoxic H1975 cells, an analysis of potential synergy found that the combination of BGJ398 and AZD9291 was not significantly synergistic over a wide range of doses (Fig. S8B). Furthermore, the non-selective FGFR inhibitor ponatinib enhanced EGFR TKI sensitivity in HCC827, HCC827 C2–10 and H1975 cells (Fig. S8C–E). Next, we evaluated the effects of combined BGJ398 and AZD9291 treatment versus the single agents alone on the growth of hypoxic H1975 tumor xenografts in mice (Fig. 6E). H1975 cells grown in 1% O2 for 4 weeks prior to implantation were used for tumor xenografts model. We observed that BGJ398 alone had no effect on either tumor growth or mouse survival (as defined by tumor growth to three times the volume at initial treatment), whereas AZD9291 still showed a detectable effect compared to control (Fig. 6 F&G). However, the combination of AZD9291 and BGJ398 almost completely inhibited tumor growth and significantly improved survival compared to the single agents (Fig. 6F&G), demonstrating enhanced in vivo sensitization to AZD9291 by BGJ398. Together, our results suggest that blockage of FGFR1 by BGJ398 enhances AZD9291 response in hypoxic H1975 tumors and that the combination of FGFR1 inhibitor with EGFR inhibitor promotes survival.
Fig. 6. Selective FGFR1 inhibitor BGJ398 enhances EGFR TKI sensitivity in hypoxic NSCLC cells.

(A) Clonogenic assays in hypoxic (H) H1975 cells treated with or without 0.1 μM BGJ398, as indicated and increasing doses of AZD9291 (two-way ANOVA, interaction P < 0.001; error bars represent SEs from three replicates). (B) Synergy surface plots in H1975 H cells show synergy between BGJ398 and AZD9291 by Loewe analysis (n = 3). Combenefit software was used for the analysis of synergy. (C) Clonogenic assays in hypoxia-induced gefitinib-resistant HCC827 C2–10 clones treated with or without 0.1 μM BGJ398, as indicated, and increasing doses of gefitinib (two-way ANOVA, interaction P < 0.001; error bars represent SEs from three replicates). (D) Synergy surface plots in hypoxia-induced gefitinib-resistant HCC827 C2–10 clones show synergy between BGJ398 and gefitinib by Loewe analysis (n = 3). (E) Treatment scheme for mouse tumor growth study. (F) Growth curves of H1975 H cell xenograft tumors in control mice and mice treated with AZD9291 (5 mg/kg), BGJ398 (15 mg/kg) and AZD9291 plus BGJ398 (control versus BGJ398: two-way ANOVA, interaction P = 0.99, n = 10 mice per group; AZD9291 versus AZD9291 + BGJ398: two-way ANOVA, interaction P < 0.001, n = 10 mice per group). (G) Kaplan-Meier plot of survival of mice, with survival cutoff criteria defined as tumor volume greater than three times that at initial treatment [log-rank (Mantel-Cox) test: control versus BGJ398, P = 0.77; AZD9291versus AZD9291 + BGJ398, P < 0.05].
MEK inhibitor trametinib enhances EGFR TKI sensitivity in hypoxic NSCLC cells
Previous studies have shown that inhibition of MAPK signaling restores sensitivity to EGFR TKIs in resistant NSCLC cell lines (31,32). As we showed above, the up-regulation of FGFR1 by hypoxia mediates its effects via the MAPK pathway, as blockage of MAPK reversed the down-regulation of BIM by FGFR1. This provides a rationale for evaluating the effects of a MEK inhibitor on EGFR TKI resistance in hypoxic NSCLC cells. As expected, we observed that trametinib treatment significantly increased AZD9291 sensitivity in hypoxic H1975 cells (Fig. 7A) and a Loewe analysis of potential synergy found that trametinib and AZD9291 were strongly synergistic at several doses (Fig. 7B). We also tested the combination of trametinib and gefitinib in hypoxia-induced gefitinib-resistant HCC827 clones C2–10 and C2–3. Like the BGJ398 treatment, trametinib significantly reversed gefitinib resistance (Fig. 7C) and synergized with gefitinib in inhibiting cell survival in those clones (Fig. 7D and Fig. S9). We next evaluated the effects of combined trametinib and AZD9291 treatment on the growth of hypoxic H1975 tumor xenografts in mice (Fig. 7E). Different from BGJ398, trametinib alone controlled tumor growth and mouse survival more effectively than did AZD9291 alone (Fig. 7F&G). However, the combination of AZD9291 and trametinib further inhibited tumor growth and improved survival (Fig. 7F&G). The significant inhibitory effect of trametinib on hypoxic H1975 cell tumor growth further supports our observation in vitro that the effects of up-regulation of FGFR1 by hypoxia are mediated through the MAPK pathway and blocking MAPK signaling by trametinib interrupts the key signal transduction pathway that causes EGFR TKI resistance. To evaluate whether the combination of EGFR TKI with FGFR1 inhibitor or MEK inhibitor would cause serious side effects, we monitored the weight changes of the mice in each group and also performed blood tests after treatment. We observed that mouse weight remained stable in all groups during the treatment (Fig. S10A). In blood tests, white blood cell counts, hemoglobin levels and platelet counts had small variations, but all stayed within the normal range (Fig. S10B–D). These data suggest that combination therapy with EGFR TKI and FGFR1 inhibitor or MEK inhibitor does not have serious toxicity, which provides evidence of safety.
Fig. 7. MEK inhibitor trametinib enhances EGFR TKI sensitivity in hypoxic NSCLC cells.

(A) Clonogenic assay in hypoxic (H) H1975 cells treated with or without 5 nM trametinib, as indicated, and increasing doses of AZD9291 (two-way ANOVA, interaction P < 0.001; n = 3 technical replicates and bars represent means ± SEM). (B) Synergy surface plots in H1975 H cells show synergy between trametinib and AZD9291 (n = 3). Combenefit software was used for the analysis of synergy. (C) Clonogenic assay in hypoxia-induced gefitinib-resistant HCC827 C2–10 clones treated with or without 5 nM trametinib, as indicated, and increasing doses of gefitinib (two-way ANOVA, interaction P < 0.001; n = 3 technical replicates and bars represent means ± SEM). (D) Synergy surface plots in hypoxia-induced gefitinib-resistant HCC827 C2–10 clones show synergy between trametinib and gefitinib (n = 3). (E) Treatment scheme for mouse tumor growth and survival study. (F) Growth curves of H1975 H cell xenograft tumors in control mice and mice treated with AZD9291 (5 mg/kg) and/or trametinib (1 mg/kg) (control versus trametinib: two-way ANOVA, interaction P < 0.001, n = 10 mice per group; AZD9291 versus AZD9291 + trametinib: two-way ANOVA, interaction P < 0.001, n = 10 mice per group; trametinib versus AZD9291 + trametinib: two-way ANOVA, interaction P=0.265, n = 10 mice per group). (G) Kaplan-Meier plot of survival of mice from tumor growth experiment, with survival cutoff criteria defined as tumor volume greater than three times that at initial treatment [AZD9291versus AZD9291 + trametinib, P < 0.05].
Discussion
Tumor hypoxia profoundly influences numerous aspects of tumor biology and it has always been an attractive field for cancer research. In this study, we extended our previous findings to show that hypoxia induces resistance to the third-generation EGFR TKI AZD9291 in NSCLC cell line H1975, which is resistant to first- and second-generation TKIs due to the T790M EGFR mutation. We found that hypoxia-induced EGFR TKI resistance is accompanied by features of EMT, coordinated by increased expression of ZEB-1, an EMT activator. We present evidence that long-term, mild hypoxia exposure increases FGFR1 expression in NSCLC cells harboring activating EGFR mutations and that up-regulation of FGFR1 acts via the MAPK pathway to promote TKI resistance. In addition, induction of BIM, a BH3-only pro-apoptotic protein, by EGFR TKIs is decreased in hypoxic NSCLC cell lines, but this reduction can be reversed by combined treatment with EGFR TKIs and either the selective FGFR1 small molecular inhibitor BGJ398, or the MEK inhibitor trametinib. In keeping with this, inhibition of FGFR1 by BGJ398 attenuates hypoxia-induced EGFR TKI resistance, as does inhibition of MEK activity by trametinib. In vivo tumor growth assays in mice show that BGJ398 treatment or trametinib treatment suppresses growth of EGFR TKI-resistant tumors and restores sensitivity to AZD9291.
FGFRs 1–4 are part of a group of growth factor RTKs able to regulate cell proliferation, inhibition of apoptosis and cell migration (17–19,33). Alterations of FGFR genes, such as amplifications, fusions, mutations and overexpression by epigenetic or transcriptional regulation, have been identified in a variety of tumors, which are involved in various aspects of cancer biology, such as cancer cell stemness, anti-apoptosis, drug resistance, EMT and tumor invasion (18,20,24). Due to their high enzymatic activity and diverse functions associated with oncogenic potential, FGFRs have become attractive therapeutic targets and many small-molecule compounds targeting FGFRs have been developed. The benefits of FGFR inhibitors have been demonstrated in clinical trials involving subsets of patients with solid tumors harboring FGFR alterations (19,20,34). In this study, we provide evidence that long-term, mild hypoxia exposure increases FGFR1 expression in several lung cancer cell lines which are EGFR TKI-resistant. Knockdown of FGFR1 before or even after hypoxic exposure can attenuate hypoxia-induced EGFR TKI resistance (Fig. 3D&E). Interestingly, our microarray data also suggest that IGF1R and AXL are upregulated in hypoxia-induced gefitinib resistant clones, raining the possibility that they also may have roles in EGFR TKI resistance.
Induction of EMT in cancer cell lines has been suggested as a mechanism for emerging drug resistance to EGFR inhibitors (35–37). In our previous studies, we demonstrated that prolonged hypoxia exposure induces gefitinib resistance in a manner that is accompanied by EMT (22). In this study, we further showed that hypoxia-induced resistance to the third-generation EGFR TKI AZD9291 is also associated with EMT. In our cell models, development of EGFR TKI resistance under hypoxia is correlated with increased FGFR1 expression. FGFR1 activation has been linked to EMT in variety of cancers, including prostate cancer, HER-2 overexpression breast cancer and lung cancers harboring EGFR activating mutations, and promotes cancer progression and drug resistance (26,37–39). Our results have provided evidence to link between hypoxia and increased expression of FGFR1 in lung cancers, which is further connected to EMT and associated drug resistance. Combined with our previous finding that LSD1 and PLU-1/KDM5B are required for developing EGFR TKI resistance induced by hypoxia in HCC827 NSCLC cells (22), our current work indicates that tumor hypoxia is an important mediator of resistance to EGFR TKIs through multiple mechanisms, of which FGFR expression and EMT is one.
Previous studies have shown that resistance to EGFR inhibitors can arise through persistent or reactivation of ERK signaling and that MEK inhibition significantly delays the emergence of resistance to EGFR inhibitors (31,40,41). Several mechanisms of reactivation of ERK have been identified in EGFR inhibitor resistance, including overexpression of CXCR7, an atypical G protein-coupled receptor (41), RNF25-mediated NF-kB (42) and mitogen-activated protein kinase 1 (MARK1) gene amplification (31). Consistent with these previous studies, our current findings show sustained phosphorylation of ERK in hypoxic H1975 cells and in hypoxia-induced gefitinib-resistant HCC827 clones upon AZD9291 or gefitinib treatment (Fig. 4A). However, our study also extends these findings by demonstrating that the overexpression of FGFR1 by hypoxia is upstream of the activation of ERK in TKI-resistant NSCLC cells. This is shown by the fact that combined treatment of FGFR1 inhibitor BGJ398 and EGFR inhibitors further inhibits phosphorylation of ERK in both hypoxic H1975 cells and gefitinib-resistant HCC827 clones (Fig. 4B). In addition, compared to normoxic H1975 and HCC827 cells, increased induction of phosphorylation of ERK by FGF2 was observed in hypoxic H1975 cells in serum-free conditions. Thus, hypoxia drives FGFR1 up-regulation to sustain the activation of ERK.
BIM, a BH3-only pro-apoptotic protein, is involved in EGFR TKI-induced apoptosis (27,43,44). Attenuation of the up-regulation of BIM, epigenetic silencing of BIM, or BIM deletion have been shown to promote EGFR TKI resistance (28,30,38), which is direct evidence of the important role of BIM in development of EGFR TKI resistance. However, combined inhibition of ERK and EGFR overcomes the TKI resistance in NSCLCs with activating EGFR mutations by reversing deficient functional BIM expression (29). Consistently, we showed that induction of BIM by AZD9291 or gefitinib was attenuated in hypoxic H1975 and hypoxia-induced gefitinib-resistant HCC827 clones, compared to normoxic H1975 or HCC827 cells (Fig. 5A). Furthermore, either dual inhibition of FGFR1 and EGFR or dual inhibition of MEK and EGFR substantially induces BIM up-regulation in hypoxic H1975 cells or gefitinib-resistant clones (Fig. 5B&C). Based on this evidence, our findings suggest that resistance to EGFR TKI is induced by hypoxia via down-regulation of BIM through ERK activation that is stimulated by overexpression of FGFR1.
We further show that inhibition or knockdown of FGFR1 and inhibition of EGFR synergistically inhibits survival of TKI-resistant hypoxic H1975 cells and gefitinib-resistant HCC827 clones in vitro. In vivo, we also found that FGFR1 inhibitor BGJ398 enhanced the sensitivity of AZD9291-resistant tumors to AZD9291, as the combination of BGJ398 with AZD9291 almost completely inhibited the growth of hypoxic H1975 tumor xenografts and significantly improved survival, compared to AZD9291 alone. As discussed above, hypoxia induces EGFR inhibitor resistance in lung cancer cells through up-regulation of FGFR1 to sustain ERK activation. Since ERK is the only target of MEK1/2, inhibition of MEK by its inhibitor, trametinib, should show similar effects as blockage of FGFR1. As expected, trametinib showed similar synergistic inhibitory effects with EGFR TKIs in resistant hypoxic H1975 and HCC827 clones. In hypoxic H1975 tumor xenografts, trametinib alone had significant effects on both tumor growth and survival. This is because trametinib alone can block both FGFR1- and EGFR-induced activation of the MAPK pathway, which is the key pathway leading to EGFR TKI resistance from increased expression of FGFR1 by hypoxia.
Significant advances in our understanding of acquired resistance to EGFR TKIs in lung cancers with activating EGFR mutations are spurring the development of new strategies to overcome the resistance. The complexity of EGFR TKI resistance mechanisms has been highlighted in previous studies. Hypoxia, a key feature in solid tumors, fundamentally contributes to cancer therapy resistance and should be considered when studying EGFR TKI resistance. This study uncovers a molecular mechanism, namely activation of ERK and suppression of BIM by FGFR1, which expands our understanding of the role of hypoxia in TKI resistance in EGFR-mutant NSCLCs. These findings suggest that the combination of EGFR TKIs with FGFR1 inhibitors or with MEK inhibitor may offer an attractive therapeutic strategy for NSCLCs.
Supplementary Material
Significance.
Hypoxia-induced resistance to EGFR TKI is driven by overexpression of FGFR1 to sustain ERK signaling, where a subsequent combination of EGFR TKI with FGFR1 inhibitors or MEK inhibitors reverses this resistance.
Acknowledgements:
We thank D. Hegan and A. Dhawan for their assistance. This work was supported by the NIH (grants R01ES005775 and R35CA197574 to P.M.G.).
Footnotes
Conflict of Interest Statement:
The authors declare no potential conflicts of interest.
References
- 1.Ferlay J, Colombet M, Soerjomataram I, Dyba T, Randi G, Bettio M, et al. Cancer incidence and mortality patterns in Europe: Estimates for 40 countries and 25 major cancers in 2018. European Journal of Cancer 2018;103:356–87. [DOI] [PubMed] [Google Scholar]
- 2.Paez JG, Jänne PA, Lee JC, Tracy S, Greulich H, Gabriel S, et al. EGFR Mutations in Lung Cancer: Correlation with Clinical Response to Gefitinib Therapy. Science 2004;304(5676):1497. [DOI] [PubMed] [Google Scholar]
- 3.Lynch TJ, Bell DW, Sordella R, Gurubhagavatula S, Okimoto RA, Brannigan BW, et al. Activating Mutations in the Epidermal Growth Factor Receptor Underlying Responsiveness of Non–Small-Cell Lung Cancer to Gefitinib. New England Journal of Medicine 2004;350(21):2129–39. [DOI] [PubMed] [Google Scholar]
- 4.Mok TS, Wu Y-L, Thongprasert S, Yang C-H, Chu D-T, Saijo N, et al. Gefitinib or Carboplatin–Paclitaxel in Pulmonary Adenocarcinoma. New England Journal of Medicine 2009;361(10):947–57. [DOI] [PubMed] [Google Scholar]
- 5.Sequist LV, Waltman BA, Dias-Santagata D, Digumarthy S, Turke AB, Fidias P, et al. Genotypic and Histological Evolution of Lung Cancers Acquiring Resistance to EGFR Inhibitors. Science Translational Medicine 2011;3(75):75ra26–75ra26. [DOI] [PMC free article] [PubMed] [Google Scholar]
- 6.Kobayashi S, Boggon TJ, Dayaram T, Jänne PA, Kocher O, Meyerson M, et al. EGFR Mutation and Resistance of Non–Small-Cell Lung Cancer to Gefitinib. New England Journal of Medicine 2005;352(8):786–92. [DOI] [PubMed] [Google Scholar]
- 7.Yu HA, Arcila ME, Rekhtman N, Sima CS, Zakowski MF, Pao W, et al. Analysis of Tumor Specimens at the Time of Acquired Resistance to EGFR-TKI Therapy in 155 Patients with EGFR-Mutant Lung Cancers. Clinical Cancer Research 2013;19(8):2240–47. [DOI] [PMC free article] [PubMed] [Google Scholar]
- 8.Andrews Wright NM, Goss GD. Third-generation epidermal growth factor receptor tyrosine kinase inhibitors for the treatment of non-small cell lung cancer. Translational Lung Cancer Research 2019:S247–S64. [DOI] [PMC free article] [PubMed] [Google Scholar]
- 9.Thress KS, Paweletz CP, Felip E, Cho BC, Stetson D, Dougherty B, et al. Acquired EGFR C797S mutation mediates resistance to AZD9291 in non-small cell lung cancer harboring EGFR T790M. Nat Med 2015;21(6):560–2. [DOI] [PMC free article] [PubMed] [Google Scholar]
- 10.Leonetti A, Sharma S, Minari R, Perego P, Giovannetti E, Tiseo M. Resistance mechanisms to osimertinib in EGFR-mutated non-small cell lung cancer. Br J Cancer 2019;121(9):725–37. [DOI] [PMC free article] [PubMed] [Google Scholar]
- 11.Nagano T, Tachihara M, Nishimura Y. Mechanism of Resistance to Epidermal Growth Factor Receptor-Tyrosine Kinase Inhibitors and a Potential Treatment Strategy. Cells 2018;7(11). [DOI] [PMC free article] [PubMed] [Google Scholar]
- 12.Scanlon SE, Glazer PM. Multifaceted control of DNA repair pathways by the hypoxic tumor microenvironment. DNA Repair 2015;32:180–89. [DOI] [PMC free article] [PubMed] [Google Scholar]
- 13.Vaupel P The Role of Hypoxia-Induced Factors in Tumor Progression. The Oncologist 2004;9(S5):10–17. [DOI] [PubMed] [Google Scholar]
- 14.Tan Q, Saggar JK, Yu M, Wang M, Tannock IF. Mechanisms of Drug Resistance Related to the Microenvironment of Solid Tumors and Possible Strategies to Inhibit Them. Cancer J 2015;21(4):254–62. [DOI] [PubMed] [Google Scholar]
- 15.Gray LH, Conger AD, Ebert M, Hornsey S, Scott OCA. The Concentration of Oxygen Dissolved in Tissues at the Time of Irradiation as a Factor in Radiotherapy. The British Journal of Radiology 1953;26(312):638–48. [DOI] [PubMed] [Google Scholar]
- 16.Masoud GN, Li W. HIF-1α pathway: role, regulation and intervention for cancer therapy. Acta Pharmaceutica Sinica B 2015;5(5):378–89. [DOI] [PMC free article] [PubMed] [Google Scholar]
- 17.Beenken A, Mohammadi M. The FGF family: biology, pathophysiology and therapy. Nature Reviews Drug Discovery 2009;8(3):235–53. [DOI] [PMC free article] [PubMed] [Google Scholar]
- 18.Ornitz DM, Itoh N. The Fibroblast Growth Factor signaling pathway. WIREs Developmental Biology 2015;4(3):215–66. [DOI] [PMC free article] [PubMed] [Google Scholar]
- 19.Porta R, Borea R, Coelho A, Khan S, Araújo A, Reclusa P, et al. FGFR a promising druggable target in cancer: Molecular biology and new drugs. Critical Reviews in Oncology/Hematology 2017;113:256–67. [DOI] [PubMed] [Google Scholar]
- 20.Katoh M, Nakagama H. FGF Receptors: Cancer Biology and Therapeutics. Medicinal Research Reviews 2014;34(2):280–300. [DOI] [PubMed] [Google Scholar]
- 21.Katoh M Fibroblast growth factor receptors as treatment targets in clinical oncology. Nature Reviews Clinical Oncology 2019;16(2):105–22. [DOI] [PubMed] [Google Scholar]
- 22.Lu Y, Liu Y, Oeck S, Glazer PM. Hypoxia Promotes Resistance to EGFR Inhibition in NSCLC Cells via the Histone Demethylases, LSD1 and PLU-1. Molecular Cancer Research 2018;16(10):1458. [DOI] [PMC free article] [PubMed] [Google Scholar]
- 23.Yaghmaie M, Yeung CCS. Molecular Mechanisms of Resistance to Tyrosine Kinase Inhibitors. Current Hematologic Malignancy Reports 2019;14(5):395–404. [DOI] [PubMed] [Google Scholar]
- 24.Brown WS, Akhand SS, Wendt MK. FGFR signaling maintains a drug persistent cell population following epithelial-mesenchymal transition. Oncotarget 2016;7(50):83424–36. [DOI] [PMC free article] [PubMed] [Google Scholar]
- 25.Ware KE, Hinz TK, Kleczko E, Singleton KR, Marek LA, Helfrich BA, et al. A mechanism of resistance to gefitinib mediated by cellular reprogramming and the acquisition of an FGF2-FGFR1 autocrine growth loop. Oncogenesis 2013;2(3):e39–e39. [DOI] [PMC free article] [PubMed] [Google Scholar]
- 26.Wang K, Ji W, Yu Y, Li Z, Niu X, Xia W, et al. FGFR1-ERK1/2-SOX2 axis promotes cell proliferation, epithelial–mesenchymal transition, and metastasis in FGFR1-amplified lung cancer. Oncogene 2018;37(39):5340–54. [DOI] [PubMed] [Google Scholar]
- 27.Costa DB, Halmos B, Kumar A, Schumer ST, Huberman MS, Boggon TJ, et al. BIM Mediates EGFR Tyrosine Kinase Inhibitor-Induced Apoptosis in Lung Cancers with Oncogenic EGFR Mutations. PLOS Medicine 2007;4(10):e315. [DOI] [PMC free article] [PubMed] [Google Scholar]
- 28.Yuan J, Li B, Zhang N, Zhu H, Zhou L, Zhang L, et al. Clinical Implications of the BIM Deletion Polymorphism in Advanced Lung Adenocarcinoma Treated With Gefitinib. Clinical Lung Cancer 2018;19(4):e431–e38. [DOI] [PubMed] [Google Scholar]
- 29.Song K-A, Niederst MJ, Lochmann TL, Hata AN, Kitai H, Ham J, et al. Epithelial-to-Mesenchymal Transition Antagonizes Response to Targeted Therapies in Lung Cancer by Suppressing BIM. Clinical Cancer Research 2018;24(1):197–208. [DOI] [PMC free article] [PubMed] [Google Scholar]
- 30.Takeuchi S, Hase T, Shimizu S, Ando M, Hata A, Murakami H, et al. Phase I study of vorinostat with gefitinib in BIM deletion polymorphism/epidermal growth factor receptor mutation double-positive lung cancer. Cancer Science 2020;111((2)):561–70. [DOI] [PMC free article] [PubMed] [Google Scholar]
- 31.Ercan D, Xu C, Yanagita M, Monast CS, Pratilas CA, Montero J, et al. Reactivation of ERK Signaling Causes Resistance to EGFR Kinase Inhibitors. Cancer Discovery 2012;2(10):934–47. [DOI] [PMC free article] [PubMed] [Google Scholar]
- 32.Li Y, Zang H, Qian G, Owonikoko TK, Ramalingam SR, Sun S-Y. ERK inhibition effectively overcomes acquired resistance of epidermal growth factor receptor-mutant non–small-cell lung cancer cells to osimertinib. Cancer;n/a(n/a). [DOI] [PMC free article] [PubMed] [Google Scholar]
- 33.Grose R, Dickson C. Fibroblast growth factor signaling in tumorigenesis. Cytokine & Growth Factor Reviews 2005;16(2):179–86. [DOI] [PubMed] [Google Scholar]
- 34.Presta M, Chiodelli P, Giacomini A, Rusnati M, Ronca R. Fibroblast growth factors (FGFs) in cancer: FGF traps as a new therapeutic approach. Pharmacology & Therapeutics 2017;179:171–87. [DOI] [PubMed] [Google Scholar]
- 35.Byers LA, Diao L, Wang J, Saintigny P, Girard L, Peyton M, et al. An Epithelial–Mesenchymal Transition Gene Signature Predicts Resistance to EGFR and PI3K Inhibitors and Identifies Axl as a Therapeutic Target for Overcoming EGFR Inhibitor Resistance. Clinical Cancer Research 2013;19(1):279–90. [DOI] [PMC free article] [PubMed] [Google Scholar]
- 36.Frederick BA, Helfrich BA, Coldren CD, Zheng D, Chan D, Bunn PA, et al. Epithelial to mesenchymal transition predicts gefitinib resistance in cell lines of head and neck squamous cell carcinoma and non–small cell lung carcinoma. Molecular Cancer Therapeutics 2007;6(6):1683–91. [DOI] [PubMed] [Google Scholar]
- 37.Bronte G, Bravaccini S, Bronte E, Burgio MA, Rolfo C, Delmonte A, et al. Epithelial-to-mesenchymal transition in the context of epidermal growth factor receptor inhibition in non-small-cell lung cancer. Biological Reviews 2018;93(4):1735–46. [DOI] [PubMed] [Google Scholar]
- 38.Yochum ZA, Cades J, Wang H, Chatterjee S, Simons BW, O’Brien JP, et al. Targeting the EMT transcription factor TWIST1 overcomes resistance to EGFR inhibitors in EGFR-mutant non-small-cell lung cancer. Oncogene 2019;38(5):656–70. [DOI] [PMC free article] [PubMed] [Google Scholar]
- 39.Acevedo VD, Gangula RD, Freeman KW, Li R, Zhang Y, Wang F, et al. Inducible FGFR-1 Activation Leads to Irreversible Prostate Adenocarcinoma and an Epithelial-to-Mesenchymal Transition. Cancer Cell 2007;12(6):559–71. [DOI] [PubMed] [Google Scholar]
- 40.Tricker EM, Xu C, Uddin S, Capelletti M, Ercan D, Ogino A, et al. Combined EGFR/MEK Inhibition Prevents the Emergence of Resistance in EGFR Mutant Lung Cancer. Cancer Discovery 2015;5(9):960–71. [DOI] [PMC free article] [PubMed] [Google Scholar]
- 41.Becker JH, Gao Y, Soucheray M, Pulido I, Kikuchi E, Rodríguez ML, et al. CXCR7 Reactivates ERK Signaling to Promote Resistance to EGFR Kinase Inhibitors in NSCLC. Cancer Research 2019;79(17):4439–52. [DOI] [PMC free article] [PubMed] [Google Scholar]
- 42.Cho JH, You Y-M, Yeom YI, Lee DC, Kim B-K, Won M, et al. RNF25 promotes gefitinib resistance in EGFR-mutant NSCLC cells by inducing NF-κB-mediated ERK reactivation. Cell Death & Disease 2018;9(6):587. [DOI] [PMC free article] [PubMed] [Google Scholar]
- 43.Li X, Wang S, Li B, Wang Z, Shang S, Shao Y, et al. BIM Deletion Polymorphism Confers Resistance to Osimertinib in EGFR T790M Lung Cancer: a Case Report and Literature Review. Targeted Oncology 2018;13(4):517–23. [DOI] [PubMed] [Google Scholar]
- 44.Xia J, Bai H, Yan B, Li R, Shao M, Xiong L, et al. Mimicking the BIM BH3 domain overcomes resistance to EGFR tyrosine kinase inhibitors in EGFR-mutant non-small cell lung cancer. Oncotarget 2017;8(65). [DOI] [PMC free article] [PubMed] [Google Scholar]
Associated Data
This section collects any data citations, data availability statements, or supplementary materials included in this article.