Chromate is a toxic by-product of multiple industrial processes. Chromate reduction is an important biological activity that ameliorates Cr(VI) toxicity. Numerous researchers have identified chromate reductase activity by observing chromate reduction. However, all identified chromate reductase enzymes have flavin as a cofactor or use a flavin as a substrate. We show here that NfoR, an enzyme claimed to be a chromate reductase, is in fact an FMN reductase. In addition, we show that reduction of a flavin is a viable way to transfer electrons to chromate but that it is unlikely to be the native function of enzymes. We propose that upregulation of a redox-active flavoprotein is a viable means to detoxify chromate that relies on adventitious reduction that is not catalyzed.
KEYWORDS: chromate, catalysis, environmental microbiology, flavin, reductase, reduction
ABSTRACT
Soil bacteria can detoxify Cr(VI) ions by reduction. Within the last 2 decades, numerous reports of chromate reductase enzymes have been published. These reports describe catalytic reduction of chromate ions by specific enzymes. These enzymes each have sequence similarity to known redox-active flavoproteins. We investigated the enzyme NfoR from Staphylococcus aureus, which was reported to be upregulated in chromate-rich soils and to have chromate reductase activity (H. Han, Z. Ling, T. Zhou, R. Xu, et al., Sci Rep 7:15481, 2017, https://doi.org/10.1038/s41598-017-15588-y). We show that NfoR has structural similarity to known flavin mononucleotide (FMN) reductases and reduces FMN as a substrate. NfoR binds FMN with a dissociation constant of 0.4 μM. The enzyme then binds NADPH with a dissociation constant of 140 μM and reduces the flavin at a rate of 1,350 s−1. Turnover of the enzyme is apparently limited by the rate of product release that occurs, with a net rate constant of 0.45 s−1. The rate of product release limits the rate of observed chromate reduction, so the net rate of chromate reduction by NfoR is orders of magnitude lower than when this process occurs in solution. We propose that NfoR is an FMN reductase and that the criterion required to define chromate reduction as enzymatic has not been met. That NfoR expression is increased in the presence of chromate suggests that the survival adaption was to increase the net rate of chromate reduction by facile, adventitious redox processes.
IMPORTANCE Chromate is a toxic by-product of multiple industrial processes. Chromate reduction is an important biological activity that ameliorates Cr(VI) toxicity. Numerous researchers have identified chromate reductase activity by observing chromate reduction. However, all identified chromate reductase enzymes have flavin as a cofactor or use a flavin as a substrate. We show here that NfoR, an enzyme claimed to be a chromate reductase, is in fact an FMN reductase. In addition, we show that reduction of a flavin is a viable way to transfer electrons to chromate but that it is unlikely to be the native function of enzymes. We propose that upregulation of a redox-active flavoprotein is a viable means to detoxify chromate that relies on adventitious reduction that is not catalyzed.
INTRODUCTION
Hexavalent chromium pollution in the environment poses considerable health risks. Chromium is widely used in industrial processes such as the manufacturing of alloys, paints, paper, and tanning (1). The waste produced is often improperly disposed of and used as fill material on construction sites and wetlands, and as a result, the toxic Cr(VI) enters and contaminates the surrounding soil and water. Chromium can enter the human body via absorption through skin, ingestion, or inhalation. Compounds of Cr(VI) such as chromate are soluble, toxic, and mutagenic, with long-term exposure leading to ulceration, liver failure, skin disorders and, ultimately, lung and digestive tract cancer (2). In contrast, compounds of Cr(III) are nonmutagenic, less toxic, and insoluble (3). As such, chromate pollution can be remediated through the reduction of Cr(VI) to Cr(III). However, the implementation of such processes in affected areas can be prohibitively expensive and causes further disruption to the environment (4).
Bioremediation is a natural, nondestructive phenomenon that nullifies chromate pollution (3, 5). Several enzymes have been identified as possible candidates for the bioremediation of hexavalent chromium though most have been characterized as also having functions other than chromate reduction, such as nitroreductases, quinone reductases, and flavin reductases (4). Strains of chromate-resistant Staphylococcus aureus were found to upregulate the expression of an NAD(P)H-flavin oxidoreductase (NfoR), and preliminary research suggested that NfoR functions as a chromate reductase and nitroreductase with enhanced activity in the presence of Cu(II) (6). Here, we show that NfoR functions as a flavin mononucleotide (FMN) reductase, rapidly reducing bound FMN, followed by rate-limiting release of FMNH2. We submit that NfoR is not a chromate reductase and instead propose that through selection for upregulation of NfoR expression, the bacteria have acquired a modest adaptation in response to the environment that accomplishes chromate detoxification. This modification increases production of reduced flavin, a molecule capable of reducing a plethora of harmful oxidants. We also submit that the designation of an enzyme as a chromate reductase must be accompanied by a formal demonstration of rate enhancement and that evidence of chromate reduction by itself is insufficient to establish this category of enzymatic activity.
RESULTS
Expression and purification of NfoR.
NfoR was expressed and purified to yield 45 mg of protein per liter of culture. The enzyme proved to be moderately unstable, often precipitating with routine manipulations. The addition of 100 mM NaCl improved tractability sufficiently to permit characterization. The as-isolated enzyme typically copurified with an ∼17% fractional content of FMN, indicating noncovalent but high-affinity binding for the FMN substrate. The copurified FMN could be removed by immobilization on a nickel affinity column in the presence of denaturants. Both the FMN-bound and apo form of NfoR could be concentrated and stored indefinitely at −80°C without appreciable loss of activity. The turnover number of the enzyme under anaerobic conditions in the presence of saturating substrates (300 μM NADPH, 150 μM FMN) is 0.45 s−1.
Transient-state FMN reduction.
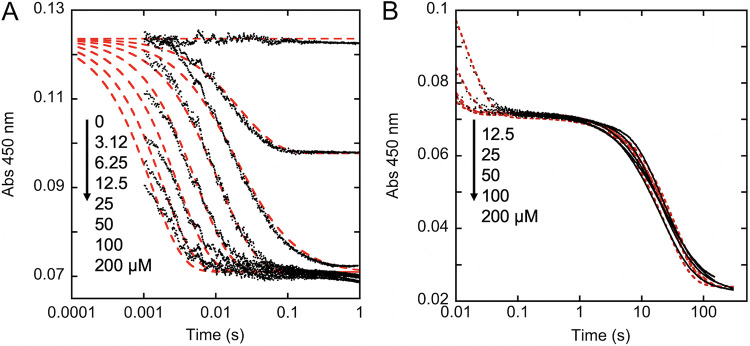
The two-electron reduction of FMN results in a decrease in the intensity of absorption of the isoalloxazine from 340 to 520 nm. This signal was used to observe hydride transfer from NADPH to the FMN on the surface of NfoR. NfoR in the presence of FMN (twice the enzyme concentration) was mixed with NADPH and observed at 450 nm (Fig. 1). NADPH concentrations in excess of the enzyme and equivalent to or greater than the FMN concentration yielded two phases of reduction. The rate of the first phase titrated with NADPH concentration to a limit, indicating that reduction involves preequilibrium formation of an NfoR⋅FMN⋅NADPH complex that is followed by hydride transfer. Global fitting using numerical integration returned a ratio for the association and dissociation rate constants for NADPH binding that gave a KNADPH of 141 ± 5 μM. A confidence interval analysis of the fit revealed that the ratio of these rates (equilibrium constant) is well described by the data but that the actual magnitudes of the rate constants for binding are not confined well. The fit also provided a measure of the rate constant for hydride transfer at 1,350 ± 20 s−1 (Fig. 1A). These data indicate both rapid NADPH binding and hydride transfer to FMN in NfoR. The subsequent phase observed was the reduction of the excess FMN and was largely independent of the concentration of NADPH and occurred with an average rate constant of 0.034 ± 0.005 s−1 (Fig. 1B). This rate is not assigned to an intrinsic rate for any specific step in catalysis as it is more than 10-fold lower than the NfoR turnover number. The low relative rate observed is likely a function of the limiting concentration of FMN present or the trapping of the enzyme in an inhibitory product complex (e.g., NfoR⋅FMNH2⋅NADPH) in which the release of FMNH2 and/or NADPH is slow.
FIG 1.
Transient-state reduction of FMN by NfoR. (A) The initial reduction of FMN from 0.0012 s−1, observed when anaerobic NfoR (6.25 μM) in the presence of 12.5 μM FMN was mixed with a range of anaerobic NADPH solutions: 0, 3.12, 6.25, 12.5, 25, 50, 100, and 200 μM. The data were fit globally (red dashed lines) to the model depicted in Fig. 9, assuming an active enzyme concentration of 6.1 μM and a change in extinction coefficient of 8,800 M−1 cm−1 for FMN reduction. (B) The ensuing reduction of residual FMN from 0.01 to 200 s. The data shown are for 12.5, 25, 50, 100, and 200 μM NADPH. The data were fit analytically to equation 1 (dashed line). Arrows indicate increasing NADPH concentrations.
The effect of an external oxidant on the NfoR steady state.
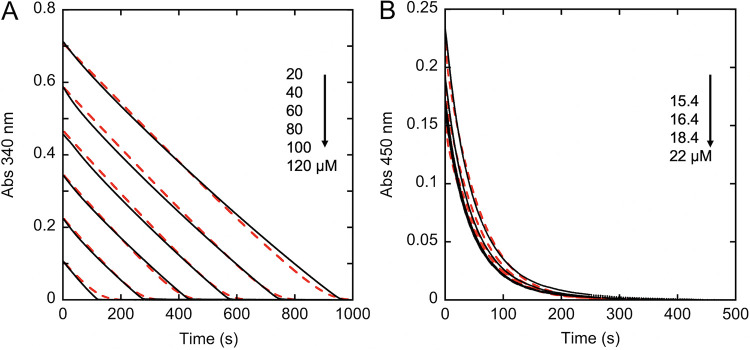
The kinetic behavior of NfoR in the presence and absence of an external oxidant was demonstrated by conducting activity assays under aerobic and anaerobic conditions. Aerobic activity was monitored at 340 nm in the presence of atmospheric dioxygen (∼250 μM); at a low enzyme concentration this wavelength principally reports the two-electron oxidation of NADPH. Aerobic activity assays were carried out in the presence of limiting FMN (5 μM, 5-fold excess relative to the NfoR concentration) and reacted with NADPH concentrations that ranged from 20- to 120-fold greater than the enzyme concentration (1 μM). In each assay, the rate of NADPH consumption is constant and does not abate until all NADPH is consumed (Fig. 2A). Assays of this type may be interpreted as exceedingly tight binding for NADPH. However, the transient-state observation of the dependence of the rate of hydride transfer indicated that the binding energy for the (NfoR⋅FMN)⋅NADPH complex is modest at ∼140 μM (Fig. 1). Moreover, the fact that consumption of NADPH is greater than the available FMN concentration dictates that FMN is regenerated in the reaction. As such, these traces are interpreted as the activity of NfoR in the presence of a constant concentration of FMN that is maintained by reoxidation.
FIG 2.
Demonstration of the kinetics of NfoR with and without an external oxidant. (A) NADPH consumption under aerobic conditions: 1 μM NfoR with 5 μM FMN reacting with 20, 40, 60, 80, 100, and 120 μM NADPH in the presence of 250 μM dioxygen as an oxidant and observed at 340 nm. (B) FMN consumption under anaerobic conditions: 4 μM NfoR in the presence of 150 μM NADPH reacting with 15.4, 16.4, 18.4, and 22 μM FMN and observed at 450 nm. Both data sets were fit simultaneously using numerical integration to the model depicted in Fig. 10 (red dashed line). Arrows indicate decreasing concentrations for successive assays.
Under anaerobic conditions, the reduction of FMN as observed at 450 nm is curving and asymptotic, consistent with the progressive exhaustion of substrate(s) (Fig. 2B), which is not regenerated in the reaction. As a demonstration of concept, the data for aerobic and anaerobic assays were fit globally to the same model (Fig. 2) in which the principal difference was that the dioxygen concentration was set to zero for the anaerobic data set. While progress curves cannot be fit to reliably determine microscopic rate constants, the fit makes the case that an external oxidant will promote the net chemistry of NfoR and lead to the erroneous conclusion that the external oxidant is a substrate.
FMN equilibrium binding.
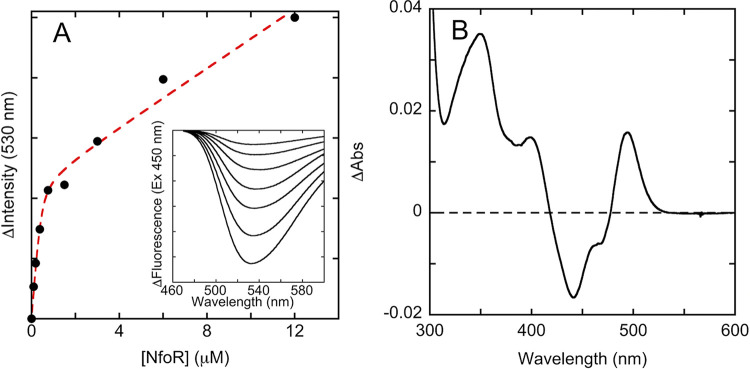
The association of FMN with oxidized apo NfoR results in a perturbation of the FMN fluorescence spectrum when FMN is excited with 450-nm light and provides a means to measure the dissociation constant for the NfoR⋅FMN complex. The data obtained indicated that the NfoR⋅FMN complex has high affinity, with a Kd (dissociation constant) of 440 ± 37 nM (Fig. 3). This is in good agreement with the data from anaerobic transient-state experiments in which the reduction of NfoR⋅FMN by NADPH is independent of the concentration of FMN.
FIG 3.
Equilibrium binding to the NfoR⋅FMN complex. (A) The binding isotherm for NfoR⋅FMN complex based on fluorescence emission when 3 μM FMN was titrated with apo NfoR. The data were fit to equation 2 (dashed line) that describes the general solution to a quadratic equation added to a straight line that accounts for residual FMN in the apo NfoR sample. The inset shows the difference emission spectrum of FMN as NfoR was titrated (ascending concentrations are from top to bottom). (B) The binding absorption difference spectrum of FMN in the NfoR⋅FMN complex relative to that of unbound FMN. FMN (20 μM) was mixed with NfoR to a final concentration of 64 μM. The spectrum of unliganded FMN was then corrected for dilution and subtracted from the spectrum obtained in the presence of NfoR.
The structure of NfoR.
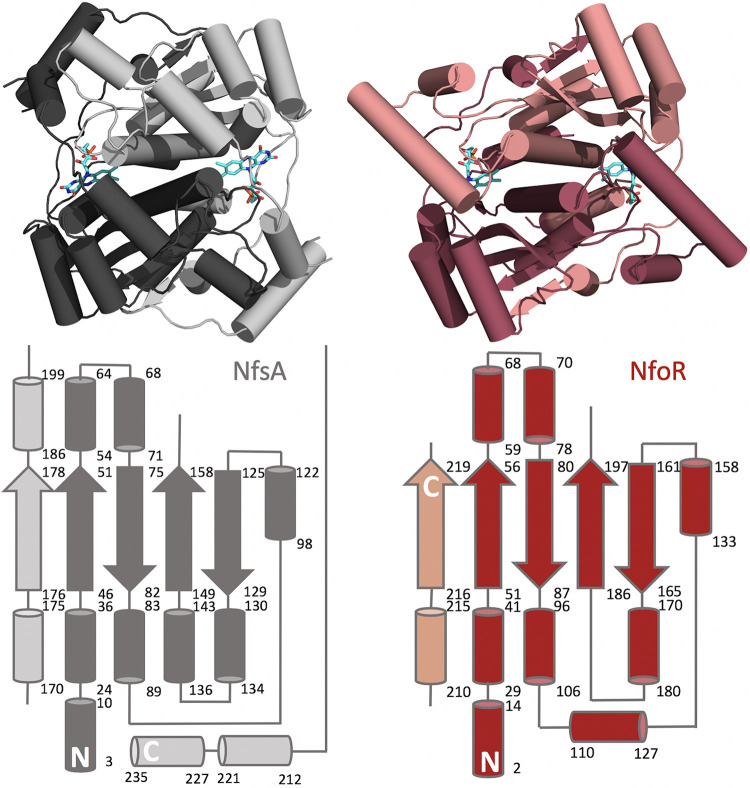
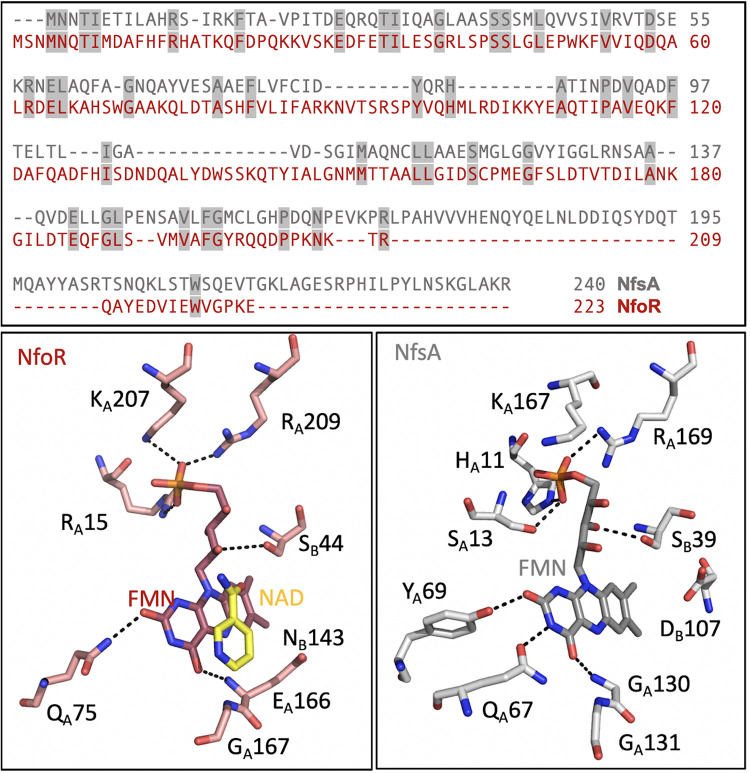
NfoR was crystallized using sitting-drop vapor diffusion to yield rhombic crystals that diffracted to a limit of 2.02 Å with the C2 space group (Table 1). The topology of the NfoR enzyme closely resembles the model FMN reductase, NfsA, from Vibrio harveyi (PDB code 2BKJ), which serves to reduce the flavin substrate of luciferase (7) (Fig. 4). Compared directly with the NfsA structure using the CEalign command available in PyMOL software (Schrödinger, Inc.), the root mean square deviation (RMSD) value for 176/240 residues was 3.69 Å. This modest level of structural similarity is in accord with the low level of sequence identity (19%) obtained from Clustal Omega alignment of the primary structures (Fig. 5, gray shading). Two topological differences are apparent in the secondary structure comparison of NfsA and NfoR. These differences are summarized in topology diagrams in Fig. 4 and show that the two subunits of both structures are entwined with secondary structural elements from both protomers to form functional domains. Two of the C-terminal secondary elements that interact with the other protomer in this manner in NfsA are absent from the NfoR structure, and this structure is therefore truncated relative to that of NfsA. In addition, NfoR has no helix between residues 180 and 186, while NfsA has a helix at this part of the structure that spans residues 136 to 143. NfoR also has an additional helix that is formed between residues 110 and 127. Positionally, this helix is in a similar position to two helices in NfsA that arise between residues 212 and 235.
TABLE 1.
Crystallographic data collection and model refinement statistics for the NfoR⋅FNR⋅NAD+ complex (PDB code 7JH4)
| Parameter | Value for the parametera |
|---|---|
| Data collection | |
| Resolution range (Å) | 50.00–2.02 (2.05–2.02) |
| Space group | C2 |
| Unit cell dimensions | |
| a, b, c (Å) | 174.8, 84.8, 107.7 |
| α, β, γ (°) | 90.0, 124.3, 90.0 |
| Rmergeb | 0.048 (0.622) |
| Rpim | 0.036 (0.516) |
| CC1/2c | (0.588) |
| Total no. of reflections | 311,343 |
| No. of unique reflections | 84,335 |
| Completeness (%) | 95.9 (75.1) |
| Multiplicity | 3.7 (3.1) |
| 〈I/σ(I)〉 | 21.6 (1.2) |
| Resolution 〈I/σ(I)〉 cutoff = 2 (Å) | 2.13 |
| Model refinement | |
| Rcryst/Rfree (%) | 16.9/20.7 |
| Wilson B-factor (Å2) | 24.8 |
| No. of TLS groups | 36 |
| Avg B factor (Å2)d | 34.6 |
| Protein atoms | 34.4 |
| Solvent | 38.2 |
| Ligands | 25.2 |
| RMSD | |
| Bond length (Å) | 0.007 |
| Bond angle (°) | 0.75 |
| Coordinate error (Å) | 0.17 |
| Ramachandran statistics (%) | |
| Favored | 96.74 |
| Allowed | 2.71 |
| Outliers | 0.54 |
| Rotamer outliers (%) | 0.31 |
| Clash score | 8.65 |
Values in parentheses apply to the highest-resolution shell.
R = ∑(‖Fobs| − scale ×| Fcalc‖)/∑|Fobs|.
Peason correlation coefficient between two random half data sets.
Isotropic equivalent B factors, including the contribution from translation-libration-screw (TLS) refinement.
FIG 4.
Structure comparison of NfsA from Vibrio harveyi (gray) and NfoR from Staphylococcus aureus (red). The structures of NfoR (PDB code 7JH4) and NfsA (PDB code 2BKJ) were aligned using PyMOL (Schrödinger, Inc.). Topology diagrams for NfsA and NfoR are shown below each structure.
FIG 5.
Conserved elements of NfoR compared to NfsA. (Top) Clustal alignment of NfoR and NfsA. Conserved residues are indicated by gray shading. (Bottom) Comparison of the select active-site residues that contact the FMN for NfoR from Staphylococcus aureus (PDB code 7JH4) and NfsA from Vibrio harveyi (PDB code 2BKJ).
The FMN binding site of NfoR has broad features similar to those found in NfsA (Fig. 5). However, after careful analysis, we have determined that a reduced FMN (FNR) has been generated during data collection as a radiation-induced artifact (8). The bent FMN ring more faithfully fits to the observed density and does not generate any residual difference density (difference in the observed and calculated structure factor amplitudes, Fo − Fc). When oxidized FMN was fit, the Rfree value was notably worse by ∼0.5%, and the difference density also suggested that the ring was bent. A number of previously published papers have documented this X-ray-induced artifact (9, 10).
Only density for the nicotinamide of the NAD+ was observed in the map, and its positioning would suggest that association of this molecule with the active site of NfoR is a crystallographic artifact. Among five subunits in an asymmetric unit of the space group C2, the nicotinamide ring of the NAD+ can be observed in only two subunits. The observation of the electron density of the nicotinamide ring in the active site is strictly accompanied by a specific intersubunit interaction in the vicinity, which is a π-π/π-cation interaction between W70 and R103 from an adjacent subunit in the crystallographic lattice (see Fig. S1 in the supplemental material). When W70 is not interacting with R103, the nicotinamide ring was not observed in the active site due to hinderance caused by W70 in a different orientation. We speculate that W70 plays a role in NADH binding and NAD+ release. Since the observation of the nicotinamide ring is strictly related to this interaction that exists only in crystals, the complex structure we observed here is a result of soaking after the crystals are formed.
Moreover, the position of the nicotinamide ring is not optimal for hydride transfer. While the distance to the flavin is typical for such complexes (3.5 Å), the nicotinamide is rotated roughly 90° (counterclockwise in Fig. 5) from the position expected for reduction (11). The residues shown in Fig. 5 that surround the FMN substrate are shown for reference and are not a complete set of interacting residues with this ligand. The suboptimal positioning of the nicotinamide is possibly due to the fact that the isoalloxazine ring of FMN is clearly reduced, suggesting that this structure represents a late event in the catalytic cycle (Fig. 6). Cupric ions have been proposed to have a modulating influence on the reduction of chromate (6). It is of note that repeated attempts to cocrystallize NfoR with copper ions failed to reveal a copper binding site to the enzyme, even at millimolar concentrations of the metal ion (see below).
FIG 6.
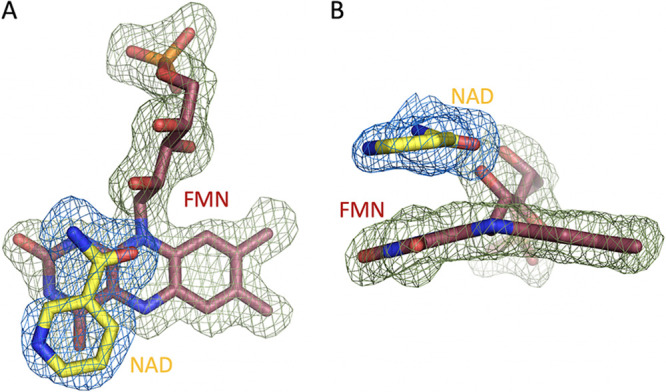
Omit difference maps (Fo − Fc at 3.0 σ) generated by individually omitting FMN (green contour) and NAD+ (blue contour). (A) Depiction of the relative position of the NAD+ nicotinamide and the FMN difference maps. (B) The image from panel A rotated 90° and depicting evidence for the two-electron reduced oxidation state of the FMN substrate.
Reoxidation of flavins by chromate and copper.
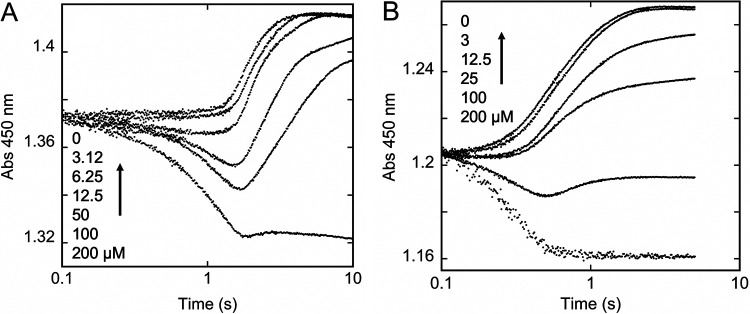
To ascertain catalysis with respect to NfoR and the reduction of chromate or other metal ions, NfoR with FMN was mixed with one of two oxidant metal ions in the presence of NADPH under anaerobic conditions. The primary objective was to establish if NfoR can reduce metal ions more rapidly than they reduce in solution in the presence of reduced flavin. Figure 7A depicts the reoxidation of FMNH2 generated by NfoR reacting with chromate ions. The data show qualitatively that reduction of chromate is contingent on the release of FMNH2 from the enzyme in that a significant lag corresponding in time to the inception of product release is observed (compare Fig. 1B and 7A). In contrast, the data shown in Fig. 7B indicate that cupric ions can access and oxidize FMNH2 prior to release from the enzyme. These outcomes are likely to reflect the accessibility of the reduced flavin to the form of the metal ion presented in that the radius of copper ions is smaller (and similar to that of dioxygen) than that of chromate (1.4 Å versus 2.5 Å).
FIG 7.
Reoxidation of FMNH2 bound to NfoR under anaerobic conditions. (A) NfoR (10 μM final concentration) with FMN (100 μM final concentration) was mixed with NADPH (12 μM final concentration) with chromate (0, 6.26, 12.5, 50, 100, and 200 μM) and observed at 450 nm. (B) NfoR (10 μM final concentration) with FMN (100 μM final concentration) was mixed with NADPH (12 μM final concentration) with cupric copper (0, 3, 12.5, 25, 100, and 200 μM) and observed at 450 nm. These data were not fit analytically or to a comprehensive model. Arrows indicate decreasing concentrations of oxidant for successive observations.
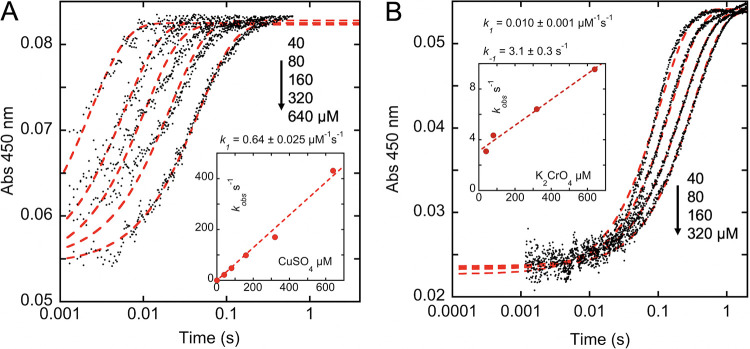
The reduction of chromate or copper(II) ions by FMNH2 derived from NfoR is orders of magnitude slower than it occurs in solution in the presence of unliganded FADH2. These data are less complex than those dependent on the kinetics of NfoR and are described well when fit to a single exponential phase. Based on the data acquired, the rate constants for reduction of chromate and copper by FADH2 are estimated to be 1.0 × 10⁴ and 6.4 × 10⁵ M−1 s−1, respectively (Fig. 8). The control data for chromate have added complexity. The dependence has a positive intercept, suggesting a complex between the Cr(VI) compound and the FADH2 (Fig. 8B, inset). While an encompassing kinetic model accounting for this has not been developed, it is reasonably explained in broad terms by the known tendency of chromate to associate with nucleotides (12–15). These data definitively establish that NfoR does not catalyze reduction of copper(II) or chromate ions as the rates observed with reduced flavin at millimolar concentrations are, respectively, 1,400- and 22-fold higher than the apparent turnover number of NfoR (0.45 s−1). The use of copper in this instance relates to the claim that NfoR chromate-reducing activity is enhanced in the presence of copper ions (6). These data show that copper is, from a kinetic standpoint, a more effective oxidant than chromate for FMNH2 derived from NfoR and that any observed rate enhancement in terms of NADPH consumption is a function of that propensity and not a result of modulation by binding.
FIG 8.
Reoxidation of photoreduced FAD. Anaerobic FAD (5 μM final) was photoreduced in the presence of 1 mM methionine using a Xenon arc lamp. The reduced flavin was then mixed with oxidant (CuSO4 or K2Cr2O7) and observed at 450 nm. (A) Reoxidation in the presence of 40, 80, 160, 320, and 640 μM CuSO4. The inset depicts the dependence of the rates observed based on the fit to equation 3 (dashed line) (B) Reoxidation in the presence of 20, 40, 160, and 320 μM K2Cr2O7 (predominately CrO4= at pH 8.0). The inset depicts the dependence of the rates observed based on the fit to equation 3 (dashed line).
DISCUSSION
Chromium is a hazardous biproduct/pollutant produced by industrial processes (2, 3). One strategy for remediation of contaminated soils and water is to reduce toxic soluble chromium(VI) compounds to the less toxic and insoluble chromium(III) oxides and hydroxides. In 1994, Losi et al., demonstrated that irrigation of agricultural soils with chromate-laced water resulted in a 20-fold diminishment of soluble chromium in water outflow. The conclusion was that bacteria in the soil possess strategies to ameliorate chromium toxicity (5). Early reports of bacterial chromium reduction described the efficiency of flavin reductases in the reduction of chromium and emphasized the facile thermodynamics and kinetics of this reaction (16). Importantly, this initial report did not describe the enzymes involved as chromium (or chromate) reductases. However, in the same year it was claimed that Vibrio harveyi nitroreductase (formally a flavin reductase) was also a chromate reductase, without a demonstration of the catalytic or enzymological characteristics that definitively support such a claim (17). Shortly after, Ackerley et al. were among the first to identify proteins long regarded as flavin reductases as chromate reductase enzymes. These researchers identified ChrR from Pseudomonas putida and YieF and NfsA from Escherichia coli as chromate reductases (18, 19). Similarly, in 2008, Opperman et al. identified a chromate reductase from Thermus scotoductus that exhibited Michaelis-Menten kinetics with respect to Cr(VI) (20–22). These proteins were homologous with dihydrolipoamide dehydrogenase and old yellow enzyme, both flavin-dependent enzymes. Later, in 2010, it was reported that FerB, a homodimeric flavoprotein from Paracoccus denitrificans, catalyzed the reduction of chromate using NADH as an electron donor (23). Soon after, in 2012, Eswaramoorthy et al. published the structure of a flavin-dependent quinone reductase, ChrD from E. coli, that was indicated to have a chromate-reducing capacity (24). In 2013, E. coli NemA (the flavin dependent N-ethylmaleimide reductase) was also reported to efficiently reduce chromate, and the enzyme was described as a chromate reductase (25). Later, in 2015, Deng et al. claimed chromate reductase activity for the Serratia-sourced ChrT protein, which has high sequence identity with FMN reductase enzymes (26). Lipoamide dehydrogenase activity was shown for a reported chromate reductase from Leucobacter sp. in 2016 by Sarangi and Krishnan (27). Then in 2017, Han et al. reported that the purported chromate reductase activity of NfoR was enhanced in the presence of Cu(II) ions (6). NfoR is the subject of the current investigation and is clearly similar to known FMN reductase enzymes (Fig. 4 and 5).
All proteins described to date as chromate reductases either have a flavin cofactor or use a flavin as a substrate. This is of some importance with regard to enzymatic catalysis of chromate reduction. Early and later reports acknowledged the facile nature of reduction of chromate by reduced flavins (16, 19). Flavins have reduction potentials around −200 mV, almost 1,500 mV below that of chromate. Moreover, the redox versatility of the reduced isoalloxazine ensures facile one-electron reactions with metal ions (Fig. 8). As such, the principal question is whether chromate reduction is catalyzed directly on the surface of these enzymes, fulfilling the chromate reductase definition, or if it is a collision-based reaction with bound or free reduced flavin that is not an intended function of these enzymes. It is interesting that no structures of putative chromate reductases have been reported that have chromate bound.
The formal definition of a catalyst is an entity that accelerates the rate of a reaction but is itself unchanged by the reaction. Given that all claimed chromate reductases utilize reduced flavins, a fundamental requirement is that they increase the rate of reduction of chromate relative to the rate of reduction by unliganded reduced flavin. This criterion has not yet been met and/or measured in any of the published works that claim to have discovered chromate reductase activity. That no crystal structures have yet been solved with chromate bound does not by itself prove that these enzymes do not harbor this activity. While binding is a consistent property of enzymes, the binding of a substrate is not required for a protein to be an enzyme, and validated substrates can react in a bimolecular manner with enzymes, such as the reaction of dioxygen with numerous oxygenases (28–30). Michaelis-Menten kinetics are also offered as evidence of enzymatic behavior; however, such observations can be deceptive as hyperbolic dependencies arise when some other contingent chemical step becomes rate limiting at high reactant concentrations. In this instance, if the rate of chromate reduction by bound or liberated FMNH2 is substantially less than the rate of flavin reduction and/or release, the observed rate of reaction will approach a limit and thus appear to display conventional Michaelis-Menten kinetics. The only means to formally demonstrate catalysis is direct comparison of catalyzed and uncatalyzed rates. In the absence of such evidence, the existence of chromate reductase activity is unproven. It is interesting that well before the first claims of chromate reductase activity, a similar dearth of fundamental evidence had been noted for enzymes miscategorized as ferric reductases that were in fact also flavin reductases (31).
In 2017, Han et al. showed that RNA for NfoR production is upregulated under chromate-induced stress, raising the possibility that increased flavin reduction is a viable strategy to survive chromate-rich environments. Here, we identify NfoR as an FMN reductase similar in function and structure to known FMN reductases. Further, we demonstrate that the fundamental catalysis definition required for the chromate reductase designation is not met by this enzyme. NfoR has low sequence identity but high structural similarity to the model FMN reductase NfsA (Fig. 4 and 5). The apparent low rate of FMNH2 release (Fig. 1B) is a common characteristic of flavin reductases, presumably designed to limit autooxidation of free reduced flavin (32–34) that results in the futile loss of reducing equivalents (Fig. 6). In the case of NfoR, release of reduced flavin is not necessarily required for redox cycling in the presence of an oxidant (Fig. 2A and 7), as in the case with cupric copper, which apparently can react with FMNH2 while it is bound to NfoR (Fig. 1B). However, with regard to enhanced bioremediation capacity of microorganisms for chromate pollution, engineering of NfoR to increase the rate constant for of FMNH2 release would seem to be a viable strategy.
Concluding remarks.
While there is no dispute that bacteria adapt to Cr(VI) in the environment, the observation of chromate reduction does not by itself prove that this process is catalyzed by a chromate reductase. Adventitious reduction of chromate (or other toxic oxidants) by reduced flavin is thermodynamically and kinetically favored. Previous reports of chromate reductase activity do not provide direct evidence for catalysis. That all prior reports of chromate reductase activity ascribe the function to a recognizable flavin-dependent enzyme raises the possibility that noncatalytic chromate reduction is the common observation. The data presented here make a clear case for NfoR functioning as an FMN reductase that can be enlisted by upregulation to ameliorate chromate toxicity.
MATERIALS AND METHODS
Materials, quantitation, and reaction conditions.
Tris, sodium dihydrogen phosphate, EDTA, kanamycin, isopropyl β-d-1-thiogalactopyranoside (IPTG), HEPES buffer, urea, NaCl, potassium bromide, BD TALON affinity column packing, the Miller formulation of lysogeny broth (LB) powder, and potassium bromide were purchased from Fisher Scientific. Reduced NADP (NADPH) was purchased from RPI Research Products. Dextrose powder was from Spectrum Chemical. Riboflavin 5′-monophosphate (FMN) and glucose oxidase were obtained from Sigma-Millipore. Streptomycin sulfate powder was made by Gibco. Imidazole and glycerol were acquired from Acros Organics. Competent Escherichia coli BL21(DE3) cells were purchased from New England Biolabs. Copper(II) chloride, copper(II) sulfate, and potassium dichromate were from VWR. All concentrations of substrates and products were determined spectrophotometrically using known extinction coefficients: NAD(P)H, ε340 = 6,220 M−1 cm−1; NAD(P)+, ε260 = 17,800 M−1 cm−1; FMN, ε450 = 12,200 M−1 cm−1; FAD, ε450 = 11,300 M−1 cm−1; NfoR, ε280 = 31,000 M−1 cm−1. All kinetic experiments were undertaken in assay buffer (20 mM Tris, 100 mM NaCl, pH 8.0) at 20°C.
Plasmid expression construct.
Plasmid was kindly provided by Xiangkai Li’s group at Lanzhou University. Briefly, the nfoR gene was amplified using oligonucleotides that incorporated both an NcoI restriction site and a 6×His tag at the N terminus (CCCATGGGCCATCATCATCATCATCACATGAGCAATATGAATCAAACAATTAT [underlined sequences indicate the NdeI restriction site and incorporated sequence for a fused N-terminal His tag, respectively]) and an XhoI restriction site at the C terminus (CCGCTCGAGTTCTTTTGGTCCAACCCATT [the underlined sequence indicates the incorporation of an XhoI restriction site]). The amplified gene was then digested and cloned into the NcoI and XhoI sites of pET28a, yielding an expression construct (named here pSanfoR) with the nfoR gene fused to 6×His tags at both the N terminus and C terminus.
Production and purification of NfoR.
BL21(DE3) cells harboring the pSanfoR plasmid were prepared as cell stocks by selecting a single colony from transformation plates and inoculation with 20 ml of LB medium, with kanamycin selection (50 μg/ml). The cells were grown until early exponential phase, at which time sterilized glycerol was added to 20%, and 1-ml aliquots were frozen at –80°C. To express NfoR, a 50-ml starter culture of LB medium containing kanamycin (50 μg/ml) was inoculated with the frozen glycerol cell stock cells and grown overnight at 37°C with shaking at 250 rpm. This culture was used to inoculate two 1-liter volumes of sterile LB medium with kanamycin (50 μg/ml). The cultures were grown at 37°C and shaken at 250 rpm until an optical density at 600 nm (OD600) of ∼0.6 was reached. The cultures were cooled on ice at 4°C for 40 min before being induced with IPTG (0.5 mM). Cultures were then incubated at 16°C and shaken at 200 rpm for 20 h. Cells were harvested by centrifugation at 6,370 × g for 20 min. The cell pellet was resuspended in buffer A (10 mM imidazole, 500 mM NaCl, 50 mM NaH2PO4, pH 7.5) and lysed while on ice by sonication with a QSonica Q500 sonicator at 30% amplitude for 7 min. Cell debris was pelleted, and the supernatant was retained by centrifugation twice at 31,000 × g for 20 min, with decanting between steps. The supernatant was then subjected to Ni2+ affinity chromatography using two 5-ml HisTrap FF columns connected in series and preequilibrated with buffer A. NfoR was eluted with a 20-column-volume linear gradient of imidazole (10 mM to 500 mM) in buffer A. Fractions containing NfoR were identified by SDS-PAGE correlated with the 280-nm chromatogram and were pooled and exchanged into gel filtration buffer (50 mM HEPES, 300 mM NaCl, pH 7.5) using 10-kDa Amicon Ultra centrifugal filters (Millipore). The pooled and concentrated sample (2 ml) was subject to size exclusion chromatography using a HiLoad 16/60 (16 mm by 60 cm) Superdex column (GE Healthcare) equilibrated in gel filtration buffer. The fractions of the dominant elution peak were pooled. Protein concentrations were measured by UV absorption at 280 nm based on the calculated extinction coefficient ε280 = 3.1 × 10⁴ M−1 cm−1 (35).
Apo NfoR was prepared according to a modified protocol via His tag-based immobilization as described previously (36). Briefly, a 5-ml HisTrap FF column was preequilibrated with buffer B (10 mM imidazole, 300 mM NaCl, 50 mM HEPES, pH 7.5), and 20 ml of 20 μM pure NfoR was loaded onto the column. The bound protein was washed with 10 column volumes of a mild denaturant (2 M KBr, 2 M urea, dissolved in buffer B). NfoR was then eluted with a 20-column-volume linear imidazole gradient (10 to 250 mM imidazole) in buffer B. Apo NfoR was then exchanged into assay buffer (20 mM Tris, 100 mM NaCl, pH 8.0) using centrifugal concentrators.
Transient-state FMN reduction.
The hydride transfer reaction from NADPH to FMN was observed at 450 nm using rapid mixing methods. NfoR (12.5 μM) was prepared anaerobically in a tonometer in assay buffer that included 1 mM dextrose and 25 μM FMN. The tonometer was made anaerobic using published protocols (37). Once the exchange of dissolved gases was complete, glucose oxidase was added from the tonometer sidearm to provide 1 U/ml of activity. The tonometer was then mounted onto a Hitech DX2 (TgK Scientific) stopped-flow spectrophotometer equipped with ceramic valves and a polyetheretherketone (PEEK) flow circuit. NADPH solutions were prepared in the same buffer with 1 mM dextrose and sparged with purified argon gas for 5 min. Glucose oxidase was then added to 1 U/ml, and the syringe was captured and mounted to the stopped-flow instrument. The reduction of FMN was observed for two time frames. Initial rapid hydride transfer was observed for 1 s. For NADPH concentrations in excess of the enzyme concentration, subsequent net FMN reduction was observed for 200 s. The dependence of the rate of the initial hydride transfer was modeled using KinTek Explorer software to the model depicted in Fig. 9. This model assumes that the binding affinity of NfoR for FMN is sufficiently high that the NfoR-FMN equilibrium need not be considered. As such, the fit returns estimates of both the (NfoR⋅FMN)⋅NADPH dissociation constant and the limiting rate of hydride transfer. Data that covered 200 s were fit to a linear combination of two exponentials as described by equation 1, where the first phase (ΔAbs1e-kobs1t) accounts for the tail end of the initial hydride transfer that is observed in these data between 0.01 and 0.1 s. In the second phase, kobs2 is the observed rate constant, ΔAbs2 is the associated amplitude of the absorption change, and C is the Abs450nm endpoint.
| (1) |
FIG 9.

Kinetic scheme for the reductive reaction of NfoR.
Enzyme activity assays.
Routine activity measurements of purified NfoR were made by monitoring consumption of NADPH at 25°C. In 1 ml of assay buffer, 4 μM NfoR supplemented with 200 μM flavin mononucleotide (FMN) was mixed with 200 μM NADPH. The reaction was monitored at 340 nm (Δε340 = 6.22 × 10³ M−1 cm−1) using a Shimadzu 2600 spectrophotometer, and the reaction rate was calculated from a fit to the linear portion of the progress curve between 5 and 20 s.
A comparison of the kinetic behaviors of NfoR in the presence and absence of a sacrificial oxidant was carried out by observing the turnover of the enzyme under aerobic and anaerobic conditions. The aerobic reaction mixture included 1 μM NfoR with 5 μM FMN, and the reaction was observed with a range of NADPH concentrations (20, 40, 60, 80, 100, and 120 μM) in the presence of atmospheric dioxygen (∼250 μM) at 340 nm using a Shimadzu 2600 spectrophotometer.
Anaerobic turnover was observed using published protocols for anaerobiosis with stopped-flow instrumentation (37). NfoR (1 μM) was prepared in assay buffer in a tonometer in the presence of 300 μM NADPH and 1 mM dextrose. Once the vessel was made anaerobic, glucose oxidase to 1 U/ml was added from the tonometer sidearm and mounted onto the stopped-flow instrument. The NfoR/NADPH solution was then mixed with a range of FMN concentrations (15.4, 16.4, 18.4, and 22 μM), and the reaction was observed at 450 nm.
The anaerobic and aerobic data sets obtained were fit simultaneously to the model depicted in Fig. 10 using numerical integration subroutines implemented in KinTek Explorer software (KinTeK Corp.). In this scheme, the hydride transfer rate constant was fixed to the value determined from the transient-state observation of hydride transfer described above. The bimolecular rate constant for reduced flavins reacting with dioxygen was fixed to the known value of 250 M−1 s−1 for this reaction (38). In addition, the rate constants that define the NfoR⋅FMN dissociation constant were fixed to a ratio that equals the dissociation constant determined by perturbation of the FMN fluorescence spectrum (see below).
FIG 10.
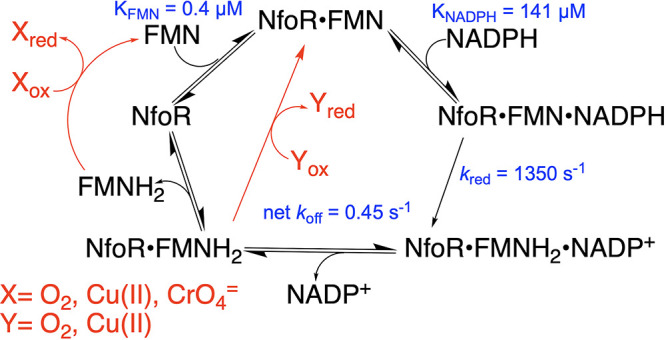
Proposed kinetic mechanism for NfoR in the presence and absence of an external oxidant.
FMN equilibrium binding.
The dissociation constant for the NfoR⋅FMN complex was estimated from perturbation of the FMN emission spectrum when titrated with NfoR. Near-apo NfoR was prepared as described above. For each ratio of FMN to NfoR, 2,950 μl of 3 μM FMN in assay buffer was placed in a 3-ml fluorescence cuvette, and 50 μl of 2-fold serially diluted NfoR stocks was added. For each NfoR concentration, an emission spectrum was recorded using a Shimadzu RF6000 spectrofluorometer. Formation of the NfoR⋅FMN complex was registered as a decrease in the area of the FMN emission spectrum from 460 to 600 nm with excitation at 450 nm. The change in intensity at 530 nm was plotted against the concentration of added NfoR. The data were fit to the solution of the quadratic form of the single-site binding equation added to a straight line (equation 2). The m[NfoR] term is to account for what is assumed to be a fluorescence contribution from residual FMN in the NfoR sample (39).
| (2) |
Crystallization and structure determination.
The NfoR⋅FMN⋅NAD+ complex was crystallized by the sitting-drop vapor diffusion method. Drops were formed at room temperature by mixing 6 μl of 45 mg/ml of purified NfoR with 10 mM NAD+ in 50 mM HEPES and 300 mM NaCl, pH 7.5, with 6 μl of 30% polyethylene glycol (PEG) 4000, 210 mM ammonium acetate, and 100 mM sodium citrate, pH 5.6. Initial crystals appeared in 14 days and were used to seed subsequent crystal growth that appeared within 7 days. The crystals grew to a size of approximately 400 by 400 by 400 μm. Crystals were cryo-protected for data collection by being soaked briefly in the well solution supplemented with glycerol to 20%. Crystals were then flash-cooled by being plunged in liquid nitrogen.
Diffraction data were collected at 100 K at the Structural Biology Center beamline 19-BM of the Advanced Photon Source at Argonne National Laboratory. The beamline was equipped with an ADSC-315r detector. Data were collected using an oscillation angle of 0.5° over a range of 180° and an exposure time of 1 s per frame. The wavelength was fixed at 0.97856 Å. Diffraction images were processed using HKL2000 (40). Data processing statistics are given in Table 1. Phasing was conducted via molecular replacement using the program Phaser. A homologous model of the putative NAD(P)H-flavin oxidoreductase from Streptococcus pyogenes M1, a group A Streptococcus (GAS), was used as a starting search model (PDB code 2HAY). The model building and refinement were undertaken in Coot (41) and Phenix (42), respectively, in a repeated manner until the lowest Rfree was achieved. Structural analysis and figures were made using PyMOL (The PyMOL Molecular Graphics System, version 2.0, Schrödinger, LLC).
Reoxidation of flavins by chromate and copper.
In order to establish if the reduction of metal ions by NfoR is catalytic, the rate of reduction in the presence of the enzyme was compared to the rate in solution using anaerobic double mixing stopped flow spectrophotometry. NfoR (10 μM final concentration) with FMN (100 μM final concentration) was mixed with NADPH (12 μM final concentration) in a range of concentrations of cupric copper (0, 3, 12.5, 25, 100, and 200 μM) or chromate (0, 6.26, 12.5, 50, 100, and 200 μM) and observed at 450 nm for 5 or 10 s, respectively.
As controls, anaerobic flavin adenine dinucleotide (FAD) in a tonometer (10 μM final) in assay buffer was photoreduced in the presence of 1 mM methionine using a Xenon arc lamp (43). The reduced flavin was then mixed with oxidant (40, 80, 160, 320, and 640 μM CuSO4 or 40, 80, 320, and 640 μM K2CrO4) and observed at 450 nm using charge-coupled-device (CCD) detection. FAD was used in these measurements to avoid the complication arising from the propensity of FMN to decompose when irradiated (39). The control data were fit to a single exponential phase according to equation 3. In this equation ΔAbs450nm is the change in absorption at 450 nm, kobs is the observed rate constant for FADH2 oxidation, and C is the endpoint absorption at 450 nm.
| (3) |
Data availability.
The coordinates and structure factors of NfoR have been deposited in the Protein Data Bank under accession number 7JH4.
Supplementary Material
ACKNOWLEDGMENTS
This research was supported by National Science Foundation grant 1904480 to G.R.M. and Dr. Michael and Dorothy Carbon Fellowships to A.G.O.
Footnotes
Supplemental material is available online only.
REFERENCES
- 1.Zayed AM, Terry N. 2003. Chromium in the environment: factors affecting biological remediation. Plant Soil 249:139–156. doi: 10.1023/A:1022504826342. [DOI] [Google Scholar]
- 2.Guertin J. 2005. Toxicity and health effects of chromium (all oxidation states), p 215–230. In Guertin J, Jacobs JA, Avakian CP (ed), Chromium(VI) handbook. CRC Press, Boca Raton, FL. [Google Scholar]
- 3.Losi ME, Amrhein C, Frankenberger WT Jr. 1994. Environmental biochemistry of chromium. Rev Environ Contam Toxicol 136:91–121. doi: 10.1007/978-1-4612-2656-7_3. [DOI] [PubMed] [Google Scholar]
- 4.Thatoi H, Das S, Mishra J, Rath BP, Das N. 2014. Bacterial chromate reductase, a potential enzyme for bioremediation of hexavalent chromium: a review. J Environ Manage 146:383–399. doi: 10.1016/j.jenvman.2014.07.014. [DOI] [PubMed] [Google Scholar]
- 5.Losi ME, Amrhein C, Frankenberger WT Jr. 1994. Bioremediation of chromate-contaminated groundwater by reduction and precipitation in surface soils. J Environ Qual 23:1141–1150. doi: 10.2134/jeq1994.00472425002300060003x. [DOI] [Google Scholar]
- 6.Han H, Ling Z, Zhou T, Xu R, He Y, Liu P, Li X. 2017. Copper (II) binding of NAD(P)H- flavin oxidoreductase (NfoR) enhances its Cr(VI)-reducing ability. Sci Rep 7:15481. doi: 10.1038/s41598-017-15588-y. [DOI] [PMC free article] [PubMed] [Google Scholar]
- 7.Tanner JJ, Lei B, Tu SC, Krause KL. 1996. Flavin reductase P: structure of a dimeric enzyme that reduces flavin. Biochemistry 35:13531–13539. doi: 10.1021/bi961400v. [DOI] [PubMed] [Google Scholar]
- 8.Carugo O, Djinovic Carugo K. 2005. When X-rays modify the protein structure: radiation damage at work. Trends Biochem Sci 30:213–219. doi: 10.1016/j.tibs.2005.02.009. [DOI] [PubMed] [Google Scholar]
- 9.Hersleth HP, Hsiao YW, Ryde U, Gorbitz CH, Andersson KK. 2008. The crystal structure of peroxymyoglobin generated through cryoradiolytic reduction of myoglobin compound III during data collection. Biochem J 412:257–264. doi: 10.1042/BJ20070921. [DOI] [PubMed] [Google Scholar]
- 10.Rohr AK, Hersleth HP, Andersson KK. 2010. Tracking flavin conformations in protein crystal structures with Raman spectroscopy and QM/MM calculations. Angew Chem Int Ed Engl 49:2324–2327. doi: 10.1002/anie.200907143. [DOI] [PubMed] [Google Scholar]
- 11.Pai EF, Schulz GE. 1983. The catalytic mechanism of glutathione reductase as derived from x-ray diffraction analyses of reaction intermediates. J Biol Chem 258:1752–1757. [PubMed] [Google Scholar]
- 12.Flores A, Perez JM. 1999. Cytotoxicity, apoptosis, and in vitro DNA damage induced by potassium chromate. Toxicol Appl Pharmacol 161:75–81. doi: 10.1006/taap.1999.8779. [DOI] [PubMed] [Google Scholar]
- 13.Mattagajasingh SN, Misra HP. 1996. Mechanisms of the carcinogenic chromium(VI)-induced DNA-protein cross-linking and their characterization in cultured intact human cells. J Biol Chem 271:33550–33560. doi: 10.1074/jbc.271.52.33550. [DOI] [PubMed] [Google Scholar]
- 14.Stearns DM, Kennedy LJ, Courtney KD, Giangrande PH, Phieffer LS, Wetterhahn KE. 1995. Reduction of chromium(VI) by ascorbate leads to chromium-DNA binding and DNA strand breaks in vitro. Biochemistry 34:910–919. doi: 10.1021/bi00003a025. [DOI] [PubMed] [Google Scholar]
- 15.Zhitkovich A, Voitkun V, Kluz T, Costa M. 1998. Utilization of DNA-protein cross-links as a biomarker of chromium exposure. Environ Health Perspect 106(Suppl 4):969–974. doi: 10.1289/ehp.98106s4969. [DOI] [PMC free article] [PubMed] [Google Scholar]
- 16.Puzon GJ, Petersen JN, Roberts AG, Kramer DM, Xun L. 2002. A bacterial flavin reductase system reduces chromate to a soluble chromium(III)-NAD+ complex. Biochem Biophys Res Commun 294:76–81. doi: 10.1016/S0006-291X(02)00438-2. [DOI] [PubMed] [Google Scholar]
- 17.Kwak YH, Lee DS, Kim HB. 2003. Vibrio harveyi nitroreductase is also a chromate reductase. Appl Environ Microbiol 69:4390–4395. doi: 10.1128/aem.69.8.4390-4395.2003. [DOI] [PMC free article] [PubMed] [Google Scholar]
- 18.Ackerley DF, Gonzalez CF, Keyhan M, Blake R II, Matin A. 2004. Mechanism of chromate reduction by the Escherichia coli protein, NfsA, and the role of different chromate reductases in minimizing oxidative stress during chromate reduction. Environ Microbiol 6:851–860. doi: 10.1111/j.1462-2920.2004.00639.x. [DOI] [PubMed] [Google Scholar]
- 19.Ackerley DF, Gonzalez CF, Park CH, Blake R II, Keyhan M, Matin A. 2004. Chromate-reducing properties of soluble flavoproteins from Pseudomonas putida and Escherichia coli. Appl Environ Microbiol 70:873–882. doi: 10.1128/aem.70.2.873-882.2004. [DOI] [PMC free article] [PubMed] [Google Scholar]
- 20.Opperman DJ, Heerden E. 2008. A membrane-associated protein with Cr(VI)-reducing activity from Thermus scotoductus SA-01. FEMS Microbiol Lett 280:210–218. doi: 10.1111/j.1574-6968.2007.01063.x. [DOI] [PubMed] [Google Scholar]
- 21.Opperman DJ, van Heerden E. 2007. Aerobic Cr(VI) reduction by Thermus scotoductus strain SA-01. J Appl Microbiol 103:1907–1913. doi: 10.1111/j.1365-2672.2007.03429.x. [DOI] [PubMed] [Google Scholar]
- 22.Opperman DJ, Piater LA, van Heerden E. 2008. A novel chromate reductase from Thermus scotoductus SA-01 related to old yellow enzyme. J Bacteriol 190:3076–3082. doi: 10.1128/JB.01766-07. [DOI] [PMC free article] [PubMed] [Google Scholar]
- 23.Sedlacek V, Kucera I. 2010. Chromate reductase activity of the Paracoccus denitrificans ferric reductase B (FerB) protein and its physiological relevance. Arch Microbiol 192:919–926. doi: 10.1007/s00203-010-0622-4. [DOI] [PubMed] [Google Scholar]
- 24.Eswaramoorthy S, Poulain S, Hienerwadel R, Bremond N, Sylvester MD, Zhang YB, Berthomieu C, Van Der Lelie D, Matin A. 2012. Crystal structure of ChrR–a quinone reductase with the capacity to reduce chromate. PLoS One 7:e36017. doi: 10.1371/journal.pone.0036017. [DOI] [PMC free article] [PubMed] [Google Scholar]
- 25.Robins KJ, Hooks DO, Rehm BH, Ackerley DF. 2013. Escherichia coli NemA is an efficient chromate reductase that can be biologically immobilized to provide a cell free system for remediation of hexavalent chromium. PLoS One 8:e59200. doi: 10.1371/journal.pone.0059200. [DOI] [PMC free article] [PubMed] [Google Scholar]
- 26.Deng P, Tan X, Wu Y, Bai Q, Jia Y, Xiao H. 2015. Cloning and sequence analysis demonstrate the chromate reduction ability of a novel chromate reductase gene from Serratia sp. Exp Ther Med 9:795–800. doi: 10.3892/etm.2014.2148. [DOI] [PMC free article] [PubMed] [Google Scholar]
- 27.Sarangi A, Krishnan C. 2016. Detoxification of hexavalent chromium by Leucobacter sp. uses a reductase with specificity for dihydrolipoamide. J Basic Microbiol 56:175–183. doi: 10.1002/jobm.201500285. [DOI] [PubMed] [Google Scholar]
- 28.Entsch B, Ballou DP, Massey V. 1976. Role of oxygenated flavins in the catalytic reaction of p-hydroxybenzoate hydroxylase, p 111–123. In Singer TP. (ed), Flavins and flavoproteins: proceedings of the Fifth International Symposium on flavins and flavoproteins. Elsevier, Amsterdam, Netherlands. [Google Scholar]
- 29.Johnson-Winters K, Purpero VM, Kavana M, Nelson T, Moran GR. 2003. (4-Hydroxyphenyl)pyruvate dioxygenase from Streptomyces avermitilis: the basis for ordered substrate addition. Biochemistry 42:2072–2080. doi: 10.1021/bi026499m. [DOI] [PubMed] [Google Scholar]
- 30.Crozier-Reabe KR, Phillips RS, Moran GR. 2008. Kynurenine 3-monooxygenase from Pseudomonas fluorescens: substrate-like inhibitors both stimulate flavin reduction and stabilize the flavin-peroxo intermediate yet result in the production of hydrogen peroxide. Biochemistry 47:12420–12433. doi: 10.1021/bi8010434. [DOI] [PubMed] [Google Scholar]
- 31.Fontecave M, Coves J, Pierre JL. 1994. Ferric reductases or flavin reductases? Biometals 7:3–8. doi: 10.1007/BF00205187. [DOI] [PubMed] [Google Scholar]
- 32.Morrison E, Kantz A, Gassner GT, Sazinsky MH. 2013. Structure and mechanism of styrene monooxygenase reductase: new insight into the FAD-transfer reaction. Biochemistry 52:6063–6075. doi: 10.1021/bi400763h. [DOI] [PMC free article] [PubMed] [Google Scholar]
- 33.Heine T, van Berkel WJH, Gassner G, van Pee KH, Tischler D. 2018. Two-component FAD-dependent monooxygenases: current knowledge and biotechnological opportunities. Biology 7:42. doi: 10.3390/biology7030042. [DOI] [PMC free article] [PubMed] [Google Scholar]
- 34.Sucharitakul J, Chaiyen P, Entsch B, Ballou DP. 2005. The reductase of p-hydroxyphenylacetate 3-hydroxylase from Acinetobacter baumannii requires p-hydroxyphenylacetate for effective catalysis. Biochemistry 44:10434–10442. doi: 10.1021/bi050615e. [DOI] [PubMed] [Google Scholar]
- 35.Pace NC, Vajdos F, Fee L, Grimsley G, Gray T. 1995. How to measure and predict the molar absorption coefficient of a protein. Protein Sci 4:2411–2423. doi: 10.1002/pro.5560041120. [DOI] [PMC free article] [PubMed] [Google Scholar]
- 36.Hefti MH, Milder FJ, Boeren S, Vervoort J, van Berkel WJH. 2003. A His-tag based immobilization method for the preparation and reconstitution of apoflavoproteins. Biochim Biophys Acta 1619:139–143. doi: 10.1016/S0304-4165(02)00474-9. [DOI] [PubMed] [Google Scholar]
- 37.Moran GR. 2019. Anaerobic methods for the transient-state study of flavoproteins: the use of specialized glassware to define the concentration of dioxygen. Methods Enzymol 620:27–49. doi: 10.1016/bs.mie.2019.03.005. [DOI] [PubMed] [Google Scholar]
- 38.Massey V. 2002. The reactivity of oxygen with flavoproteins. Int Congr Ser 1233:3–11. doi: 10.1016/S0531-5131(02)00519-8. [DOI] [Google Scholar]
- 39.Holzer W, Shirdel J, Zirak P, Penzkofer A, Hegemann P, Deutzmann R, Hochmuth E. 2005. Photo-induced degradation of some flavins in aqueous solution. Chem Phys 308:69–78. doi: 10.1016/j.chemphys.2004.08.006. [DOI] [Google Scholar]
- 40.Otwinowski Z, Minor W. 1997. Processing of X-ray diffraction data collection in oscillation mode. Methods Enzymol 276:307–325. doi: 10.1016/S0076-6879(97)76066-X. [DOI] [PubMed] [Google Scholar]
- 41.Emsley P, Lohkamp B, Scott WG, Cowtan K. 2010. Features and development of Coot. Acta Crystallogr D Biol Crystallogr 66:486–501. doi: 10.1107/S0907444910007493. [DOI] [PMC free article] [PubMed] [Google Scholar]
- 42.Liebschner D, Afonine PV, Baker ML, Bunkoczi G, Chen VB, Croll TI, Hintze B, Hung LW, Jain S, McCoy AJ, Moriarty NW, Oeffner RD, Poon BK, Prisant MG, Read RJ, Richardson JS, Richardson DC, Sammito MD, Sobolev OV, Stockwell DH, Terwilliger TC, Urzhumtsev AG, Videau LL, Williams CJ, Adams PD. 2019. Macromolecular structure determination using X-rays, neutrons and electrons: recent developments in Phenix. Acta Crystallogr D Struct Biol 75:861–877. doi: 10.1107/S2059798319011471. [DOI] [PMC free article] [PubMed] [Google Scholar]
- 43.Massey V, Hemmerich P. 1978. Photoreduction of flavoproteins and other biological compounds catalyzed by deazaflavins. Biochemistry 17:9–16. doi: 10.1021/bi00594a002. [DOI] [PubMed] [Google Scholar]
Associated Data
This section collects any data citations, data availability statements, or supplementary materials included in this article.
Supplementary Materials
Data Availability Statement
The coordinates and structure factors of NfoR have been deposited in the Protein Data Bank under accession number 7JH4.


