Abstract
Desorption electrospray ionization (DESI), easy ambient sonic-spray ionization (EASI) and low-temperature plasma (LTP) ionization are powerful ambient ionization techniques for mass spectrometry. However, every single method has its limitation in terms of polarity and molecular weight of analyte molecules. After the miniaturization of every possible component of the different ion sources, we finally were able to embed two emitters and an ion transfer tubing into a small, hand-held device. The pen-like interface is connected to the mass spectrometer and a separate control unit via a bundle of flexible tubing and cables. The novel device allows the user to ionize an extended range of chemicals by simple switching between DESI, voltage-free EASI, or LTP ionization as well as to freely move the interface over a surface of interest. A mini camera, which is mounted on the tip of the pen, magnifies the desorption area and enables a simple positioning of the pen. The interface was successfully tested using different types of chemicals, pharmaceuticals, and real life samples. Moreover, the combination of optical data from the camera module and chemical data obtained by mass analysis facilitates a novel type of imaging mass spectrometry, which we name “interactive mass spectrometry imaging (IMSI)”.
In life and material sciences, the field of mass spectrometry has undoubtedly become an essential component of instrumental analysis with a wide range of applications. On the one side, affordable, highly sensitive, and accurate mass analyzers have been developed;1,2 on the other side, the emergence of “ambient mass spectrometry” allows direct analysis of samples with no or little sample pretreatment in the open air.
Now, a variety of both direct as well as indirect surface sampling methodologies are available to ionize chemicals on surfaces at ambient conditions. The former include desorption electrospray ionization (DESI),3 direct analysis in real time (DART),4 low-temperature plasma (LTP) ionization,5 rapid evaporative ionization mass spectrometry (REIMS),6 easy ambient sonic-spray ionization (EASI),7 picosecond infrared laser desorption (PIRL),8 SpiderMass,9 or sources, which combine different ionization technologies.10−12 However, the importance and impact of direct surface sampling techniques is emphasized by numerous important applications.13−34 In contrast, a common feature of indirect surface sampling methods is the local separation of the extraction and the ionization process. Most common are liquid extraction surface analysis (LESA),35 nanospray DESI (nano-DESI),36 commercially available elution-based systems,37,38 and the recently launched MasSpec Pen.39
At our organic chemistry department, daily routine mass spectrometry is in strong demand. High-resolution mass spectra of a wide range of polar, nonpolar, volatile, and ionic chemicals are requested; however, we lack a universal ionization source for fast and easy to perform mass spectrometric analyses of different chemicals on any kind of surface. We therefore started the design and construction of a novel ambient ionization interface, which was intended to be hand-held and freely movable over the sample surface in the open air. Most of the literature-known systems are limited in terms of their usability, e.g. due to their rigidness3,4 or the orthogonal arrangements of emitter and ion guide,40−43 while others are designated for a potential medical use (avoiding extraction with organic solvents).6,8,39,44
It is known45 and has been confirmed by our preliminary experiments that the range of analytes which can be ionized by a single ionization technique is always limited in terms of molecular weight as well as polarity. To broaden the spectrum of detectable analyte molecules, we decided to combine different ionization techniques in one interface. Due to the spatial limitations of a pen-like design, we ended up with the implementation of three ionization techniques with an excellent potential for miniaturization: DESI, EASI, and the complementary LTP ionization.
Device Design
The design of the novel ambient ionization source was mainly driven by four requirements: (i) the interface preferably is a hand-held, pen-like device; (ii) it is freely movable in front of the mass spectrometer and connected via a bundle of tubing and cables for the transport of liquids, gases, electric currents and ions; (iii) it allows simultaneous mass spectrometric analysis as well as optical imaging of the surface of interest; and (iv) it provides a fast and easy to perform mass spectrometric analysis of a maximum variety of volatile as well as nonvolatile chemicals on any kind of surface.
As depicted in Figures 1, 2, S-1, and S-2, the developed hand-held interface comprises two parallel emitters and one ion transfer tube. The first emitter for DESI and EASI, the two spray-based ionization modes, consists of an inner fused silica capillary (50 μm I.D., 360 μm O.D.) for solvent transport, which is connected to an external syringe pump. In case of DESI, the DC high voltage potential (4.5 kV) is drawn from the mass spectrometer and applied to the metal hollow needle of the syringe (no high voltage needed for EASI). The nebulizing gas nitrogen (N2), which is necessary for DESI as well as EASI, passes through the outer concentrically held metal capillary. Our setup required flow rates of pure methanol (alternatively ethanol or isopropanol) of about 10–20 μL·min–1 and a gas pressure of 2 bar or higher for DESI and slightly elevated 4 bar or higher for EASI to efficiently generate charged, primary solvent droplets. The second emitter is a miniaturized LTP source, which is built of a 0.6 mm I.D. 1.4 mm O.D. glass capillary used as a dielectric barrier. An outer electrode was made of copper tape, which surrounds the glass capillary near its front end. The grounded counter electrode, a 100 μm O.D. copper wire, was laid inside the glass tubing. The outer ring electrode is connected to an AC power supply (2–5 kVpp, 22.5 kHz), and the discharge gas helium (He) passes through the glass capillary to generate the low-temperature plasma. The heated capillary of the mass spectrometer was elongated by a PEEK or even more flexible FEP tubing (0.8 mm I.D., 1.6 mm O.D.) and guided through the hand-held interface. At the front end, the tubing was beveled to collect and transport charged droplets or ionized chemicals to the mass spectrometer.
Figure 1.
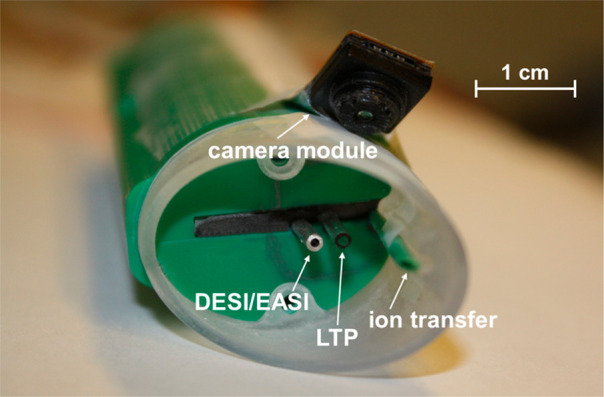
Prototype of the hand-held DESI, EASI, and LTP ion source for ambient ionization mass spectrometry. Top view of the open beveled tip of the interface showing the DESI/EASI-emitter, LTP-emitter, ion transfer tube, and camera module.
Figure 2.
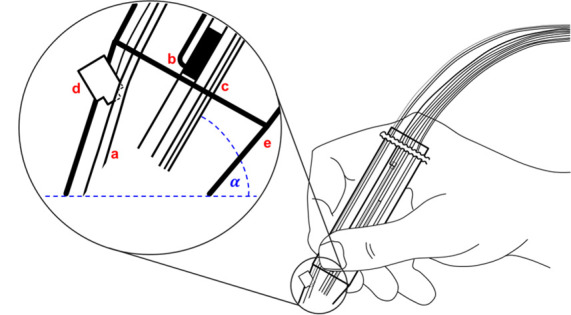
Schematic diagram of the hand-held device: (a) represents the droplet collecting tubing, (b) the LTP-emitter, (c) the DESI/EASI-emitter, (d) the camera module, (e) the housing, and (α) the probe angle. The whole setup is specified in Figures S-1 and S-2 and Table S-1 in the Supporting Information.
A prerequisite for an undisturbed ion transfer is a constant distance of approximately 0.5 cm between the ion transfer tubing and the first emitter inside the housing (d1 in Figure S-1). Moreover, the transfer tubing must neither be touched nor touch any surrounding surface or cable during analysis. To prevent sagging of the ion transfer tubing, we limited the length of the tubing to 60 cm. However, we were able to observe similar signal intensities when using 1 m tubing. The tip of the outer housing is also beveled to help the user keep the impact angle of primary droplets as well as plasma in the range of 45° to 60°. For optical analysis, a camera module was mounted near the tip of the interface and focused onto the spot, which is targeted by the two emitters. To obtain an optimum image quality, the tip of the pen-like device was made of a translucent plastic material.
The interface is controlled by a separate control unit, which is placed in front of the mass spectrometer. It contains a single board computer, which is utilized for switching between the three ionization modes LTP, DESI, and EASI as well as to process the live stream from the camera module. Two solenoid gas valves were used to regulate He and N2 gas supply, while a high voltage relay interconnects DC high voltage, which is drawn from the mass spectrometer. A full list of all components and materials is shown in Table S-1 of the Supporting Information.
Experimental Section
Chemicals and Samples
Ethanol, isopropanol, and methanol were obtained from VWR (Fontenay Sous Bois, France). Acetylsalicylic acid, caffeine, and paracetamol containing thomapyrin tablets (Sanofi, Vienna, Austria), nutmegs, bananas, and cloves (for the extraction of eugenol) were bought at local pharmacy and supermarkets in Innsbruck (Austria). For a full list, see the Supporting Information.
DESI/EASI/LTP-MS Analysis
The flexible ion guide tubing of the DESI/EASI/LTP source (length 0.6 m) was connected to the heated capillary of a LTQ-Orbitrap XL mass spectrometer (Thermo Fisher Scientific GmbH) using a PTFE sleeve as shown in Figure S-3. For screening experiments (Figures 3, S-4, and S-5 and Table S-2), a spatula was used to apply traces of selected chemicals, pharmaceuticals, and food products to a microscope slide or filter paper by slightly touching the surface. Our supplemental software displayed a live video stream from the camera on the tip of the pen at the mass spectrometer’s workstation and allowed a quick shift between the ionization modes. The hand-held device could precisely be moved on the sample surface (Movie 1), and mass spectra were obtained within a few seconds. Limits of detection (LOD) were found to be ≥20 nmol of 2-heptanone in the case of LTP mode and ≥5 pmol of PPG 1000 for the DESI mode (for details, see the Supporting Information). Operating parameters of the Orbitrap mass spectrometer were as follows: positive/negative ion-mode for a scan range of m/z 50 to 1600, spray voltage was set to 4.5 kV in case of DESI and disabled for EASI and LTP measurement, maximum injection time was 500 ms. Raw data files were analyzed using Xcalibur Qual Browser 4.1 software (Thermo Scientific).
Figure 3.
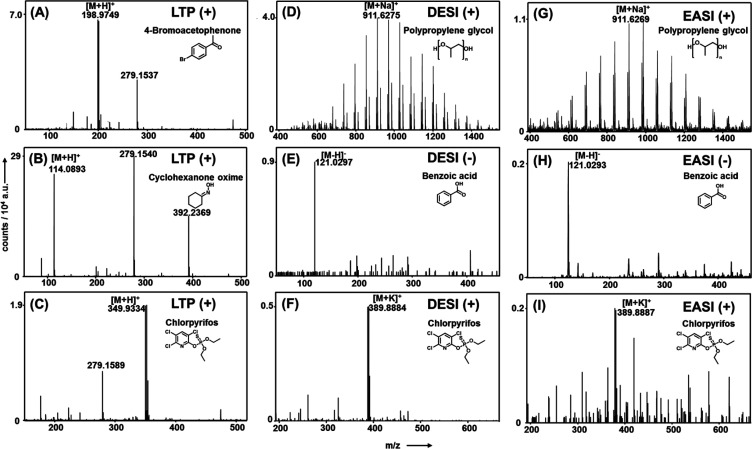
Positive and negative ion mass spectra of five selected compounds obtained with the hand-held interface in LTP (A–C), DESI (D–F), and EASI (G–I) mode. A comparison of DESI and EASI mode clearly shows a 2–4 times reduced sensitivity when no high voltage potential is applied to the spray solution in EASI mode.
Results and Discussion
We selected a set of 34 chemicals with a variety of functional groups and different combinations thereof to demonstrate advantages as well as capabilities of the 3-in-1 ionization source. The pure chemicals applied to glass or paper surfaces were directly analyzed using LTP, DESI, and EASI ionization in positive as well as negative ion-mode (for a full list of compounds as well as of obtained molecular ions, see Table S-2).
In Figures 3 and S-5, exemplary mass spectra of selected chemicals are depicted. Without exception and in accordance with the proposed LTP ionization mechanism,46 plasma ionization gave protonated molecular ions of less polar, low-molecular weight compounds. In the case of highly volatile compounds (e.g., dimethylformamide or pyridine), strong signals appeared as soon as the tip of the pen approached, e.g., an open bottle. As expected and as can be seen in the middle and right column of Figure 3, DESI as well as EASI generated protonated ([M + H]+), sodiated ([M + Na]+), or potassiated ([M + K]+) molecular ions. A comparison of DESI and EASI mass spectra clearly reveals a 2–4 times reduced sensitivity of EASI in positive as well as negative ion-mode. Still, we are convinced that the EASI mode is an important feature of our interface. It is a zero-voltage ionization technique, which allows harmless mass spectrometric analyses of chemicals on human skin, in particular when EASI-MS is performed with nonhazardous spray solvents, e.g. ethanol or isopropanol mixed with water. It turned out that the use of a slightly oversized metal capillary of the spray emitter (see Figures 2, S-1, and S-2), which enables higher nitrogen flow rates through the tip of the emitter, was a prerequisite for utilizing one single emitter for DESI and EASI.
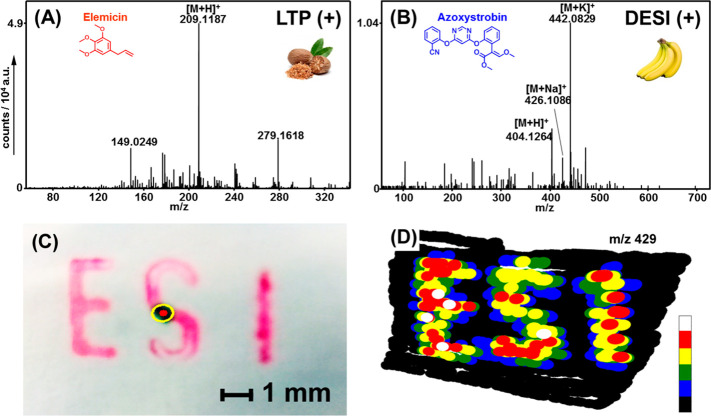
In Figure 4 (top), analyses of nutmegs and banana peels are shown. The surface of a nutmeg (Figure 4A) was touched with the hand-held interface, and the ingredient elemicin was detected within seconds at m/z 209.119 as protonated ([M + H]+) species using the LTP ion source. Utilizing DESI in the positive ion-mode, the pesticide azoxystrobin could easily be detected as protonated ([M + H]+), sodiated ([M + Na]+), and potassiated ([M + K]+) species (Figure 4B).
Figure 4.
(A, B) Detection of chemicals in complex matrixes. (A) A Nutmeg was analyzed with the LTP ion source and (B) a banana skin was analyzed using the DESI ion source. (C, D) EASI-IMSI experiment in positive ion-mode. (C) Letters were imprinted on white paper using a red ink. (D) False color ion image representing the relative signal intensities found at m/z = 429 (from black = 0% to white = 100%).
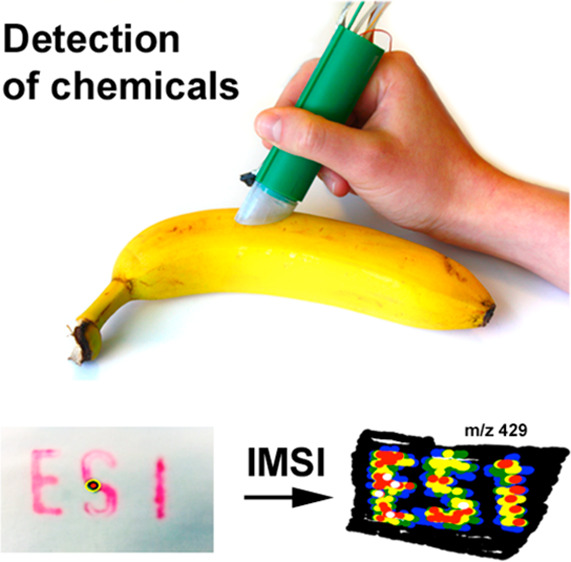
A special feature of the novel interface is the integrated camera module, which allows the combination of optical and mass spectrometric data. Typically, mass spectrometry imaging (MSI),13,47−50 in particular at an elevated lateral resolution, is a very time-consuming methodology. A user has to define a region of interest, which then is analyzed spot by spot within a relatively long period of time (in microprobe mode).47 Moreover, microprobe mass spectrometry imaging does not offer a “preview” function, unless the whole sample is analyzed pointwise at a very low lateral resolution. In DESI or EASI mode, our hand-held device has a low lateral resolution too, but the user can interactively define the region of interest by moving the pen-like device with one hand. As depicted in Figures 4 (bottom), S-6, and S-7, we developed a python software, which is able to track the pen’s motion relative to the surface of interest by automatically tracking a manually defined reference point. A red ink, which gives signals at m/z 429 (4D) in the positive ion-mode of DESI/EASI, was used to generate an imprinted test sample. By assigning the obtained mass spectra to the coordinates of the area of desorption, an ion image of the analyte can be generated (4D). As shown in Figure S-7, the lateral resolution of the first trial runs was observed to be <1 mm.
Conclusions
Three ionization techniques, DESI, EASI, and LTP, have successfully been integrated into a small, pen-like housing, which can freely be moved in front of a mass spectrometer to analyze chemicals on any kind of surface. The hand-held interface turned out to be an extremely versatile accessory to our existing mass spectrometry system. In the course of daily routine analysis, we are now able to perform minute high-resolution MS analysis of chemicals on paper, glass, wood, etc., but also on TLC plates in terms of reaction control. Neither sample preparation nor a replacement of an ion source at the mass spectrometer is necessary. Our in-lab written software package provides basic functionalities and allows a simple switching between the modes of operation.
Most importantly, the synchronous optical and mass spectrometric analyses of a sample surface (Movie 1) facilitate a novel type of imaging mass spectrometry, which we named interactive mass spectrometry imaging (IMSI). To show the capabilities of IMSI at this early stage of development, we utilized a rather simple method to track the pen’s motion. A more sophisticated approach would be automated object tracking, which does not require a manually positioned reference mark. The determination of the optical flow based on the obtained real-time images would then enable both the stitching of an optical image (panorama) of the scanned surface as well as recording the motion of the hand-held interface relative to the sample surface. Although the lateral resolution of this prototype was found to be in the millimeter range, an enormous amount of time can be saved due to the fact that the user will be able to interactively define the region of 2D localization in real-time.
Acknowledgments
This line of research was inspired by visits of T.M. in the laboratories of Prof. R. Graham Cooks, a great pioneer and visionary in the field of mass spectrometry. T.M. also gratefully acknowledges very valuable discussions with Mag. Hannes Kostner, an expert in prototyping and image processing. C.M. acknowledges financial support by 1669 Förderkreis of the University of Innsbruck, Austria Wirtschaftsservice (AWS), D. Swarovski KG and Tyrolean Science Fund (TWF).
Supporting Information Available
The Supporting Information is available free of charge at https://pubs.acs.org/doi/10.1021/acs.analchem.0c02615.
Additional materials, methods, and results (PDF)
A movie of the synchronous optical and mass spectrometric analyses of a sample surface in MOV format is available in the online version of the paper.
The authors declare no competing financial interest.
Supplementary Material
References
- Makarov A. Anal. Chem. 2000, 72, 1156–1162. 10.1021/ac991131p. [DOI] [PubMed] [Google Scholar]
- Perry R. H.; Cooks R. G.; Noll R. J. Mass Spectrom. Rev. 2008, 27, 661–699. 10.1002/mas.20186. [DOI] [PubMed] [Google Scholar]
- Takats Z.; Wiseman J. M.; Gologan B.; Cooks R. G. Science 2004, 306, 471–473. 10.1126/science.1104404. [DOI] [PubMed] [Google Scholar]
- Cody R. B.; Laramée J. A.; Nilles J. M.; Durst H. D. JEOL news 2005, 40, 8–12. [Google Scholar]
- Harper J. D.; Charipar N. A.; Mulligan C. C.; Zhang X.; Cooks R. G.; Ouyang Z. Anal. Chem. 2008, 80, 9097–9104. 10.1021/ac801641a. [DOI] [PubMed] [Google Scholar]
- Schäfer K. C.; Dénes J.; Albrecht K.; Szaniszló T.; Balog J.; Skoumal R.; Katona M.; Tóth M.; Balogh L.; Takáts Z. Angew. Chem., Int. Ed. 2009, 48, 8240–8242. 10.1002/anie.200902546. [DOI] [PubMed] [Google Scholar]
- Haddad R.; Sparrapan R.; Kotiaho T.; Eberlin M. N. Anal. Chem. 2008, 80, 898–903. 10.1021/ac701960q. [DOI] [PubMed] [Google Scholar]
- Woolman M.; Ferry I.; Kuzan-Fischer C. M.; Wu M.; Zou J.; Kiyota T.; Isik S.; Dara D.; Aman A.; Das S. Chem. Sci. 2017, 8, 6508–6519. 10.1039/C7SC01974B. [DOI] [PMC free article] [PubMed] [Google Scholar]
- Fatou B.; Saudemont P.; Leblanc E.; Vinatier D.; Mesdag V.; Wisztorski M.; Focsa C.; Salzet M.; Ziskind M.; Fournier I. Sci. Rep. 2016, 6, 1–14. 10.1038/srep25919. [DOI] [PMC free article] [PubMed] [Google Scholar]
- Nyadong L.; Galhena A. S.; Fernández F. M. Anal. Chem. 2009, 81, 7788–7794. 10.1021/ac9014098. [DOI] [PubMed] [Google Scholar]
- Ai W.; Nie H.; Song S.; Liu X.; Bai Y.; Liu H. J. Am. Soc. Mass Spectrom. 2018, 29, 1408–1415. 10.1007/s13361-018-1949-3. [DOI] [PubMed] [Google Scholar]
- Lawton Z. E.; Traub A.; Fatigante W. L.; Mancias J.; O’Leary A. E.; Hall S. E.; Wieland J. R.; Oberacher H.; Gizzi M. C.; Mulligan C. C. J. Am. Soc. Mass Spectrom. 2017, 28, 1048–1059. 10.1007/s13361-016-1562-2. [DOI] [PubMed] [Google Scholar]
- Wiseman J. M.; Ifa D. R.; Song Q.; Cooks R. G. Angew. Chem., Int. Ed. 2006, 45, 7188–7192. 10.1002/anie.200602449. [DOI] [PubMed] [Google Scholar]
- Steiner R. R.; Larson R. L. J. Forensic Sci. 2009, 54, 617–622. 10.1111/j.1556-4029.2009.01006.x. [DOI] [PubMed] [Google Scholar]
- Wiley J. S.; García-Reyes J. F.; Harper J. D.; Charipar N. A.; Ouyang Z.; Cooks R. G. Analyst 2010, 135, 971–979. 10.1039/b919493b. [DOI] [PubMed] [Google Scholar]
- Petersen H.; Tavakoli F.; Kruber S.; Münscher A.; Gliese A.; Hansen N. O.; Uschold S.; Eggert D.; Robertson W. D.; Gosau T. Lasers Surg. Med. 2016, 48, 385–391. 10.1002/lsm.22498. [DOI] [PMC free article] [PubMed] [Google Scholar]
- Balog J.; Kumar S.; Alexander J.; Golf O.; Huang J.; Wiggins T.; Abbassi-Ghadi N.; Enyedi A.; Kacska S.; Kinross J. Angew. Chem., Int. Ed. 2015, 54, 11059–11062. 10.1002/anie.201502770. [DOI] [PubMed] [Google Scholar]
- Lalli P. M.; Sanvido G. B.; Garcia J. S.; Haddad R.; Cosso R. G.; Maia D. R.; Zacca J. J.; Maldaner A. O.; Eberlin M. N. Analyst 2010, 135, 745–750. 10.1039/b923398a. [DOI] [PubMed] [Google Scholar]
- Morlock G.; Ueda Y. Journal of Chromatography A 2007, 1143, 243–251. 10.1016/j.chroma.2006.12.056. [DOI] [PubMed] [Google Scholar]
- Van Berkel G. J.; Ford M. J.; Deibel M. A. Anal. Chem. 2005, 77, 1207–1215. 10.1021/ac048217p. [DOI] [PubMed] [Google Scholar]
- Zhang Y.; Ma X.; Zhang S.; Yang C.; Ouyang Z.; Zhang X. Analyst 2009, 134, 176–181. 10.1039/B816230A. [DOI] [PubMed] [Google Scholar]
- Strittmatter N.; Lovrics A.; Sessler J.; McKenzie J. S.; Bodai Z.; Doria M. L.; Kucsma N.; Szakacs G.; Takats Z. Anal. Chem. 2016, 88, 7507–7514. 10.1021/acs.analchem.6b00187. [DOI] [PubMed] [Google Scholar]
- Fatou B.; Saudemont P.; Duhamel M.; Ziskind M.; Focsa C.; Salzet M.; Fournier I. J. Biotechnol. 2018, 281, 61–66. 10.1016/j.jbiotec.2018.06.339. [DOI] [PubMed] [Google Scholar]
- Feider C. L.; Krieger A.; DeHoog R. J.; Eberlin L. S. Anal. Chem. 2019, 91, 4266–4290. 10.1021/acs.analchem.9b00807. [DOI] [PMC free article] [PubMed] [Google Scholar]
- Huba A. K.; Mirabelli M. F.; Zenobi R. Anal. Chim. Acta 2018, 1030, 125–132. 10.1016/j.aca.2018.05.050. [DOI] [PubMed] [Google Scholar]
- Wu C.; Dill A. L.; Eberlin L. S.; Cooks R. G.; Ifa D. R. Mass Spectrom. Rev. 2013, 32, 218–243. 10.1002/mas.21360. [DOI] [PMC free article] [PubMed] [Google Scholar]
- Ma X.; Ouyang Z. TrAC, Trends Anal. Chem. 2016, 85, 10–19. 10.1016/j.trac.2016.04.009. [DOI] [PMC free article] [PubMed] [Google Scholar]
- Müller T.; Oradu S.; Ifa D. R.; Cooks R. G.; Kräutler B. Anal. Chem. 2011, 83, 5754–5761. 10.1021/ac201123t. [DOI] [PMC free article] [PubMed] [Google Scholar]
- Sawicki J. W.; Bogdan A. R.; Searle P. A.; Talaty N.; Djuric S. W. Reaction Chemistry & Engineering 2019, 4, 1589–1594. 10.1039/C9RE00054B. [DOI] [Google Scholar]
- Evans-Nguyen K.; Stelmack A. R.; Clowser P. C.; Holtz J. M.; Mulligan C. C. Mass Spectrom. Rev. 2020, 10.1002/mas.21646. [DOI] [PubMed] [Google Scholar]
- Spencer S. E.; Santiago B. G.; Glish G. L. Anal. Chem. 2015, 87, 11887–11892. 10.1021/acs.analchem.5b03447. [DOI] [PubMed] [Google Scholar]
- Kiontke A.; Holzer F.; Belder D.; Birkemeyer C. Anal. Bioanal. Chem. 2018, 410, 3715–3722. 10.1007/s00216-018-1033-7. [DOI] [PubMed] [Google Scholar]
- Cotte-Rodríguez I.; Mulligan C. C.; Cooks R. G. Anal. Chem. 2007, 79, 7069–7077. 10.1021/ac0707939. [DOI] [PubMed] [Google Scholar]
- Garimella S.; Xu W.; Huang G.; Harper J. D.; Cooks R. G.; Ouyang Z. J. Mass Spectrom. 2012, 47, 201–207. 10.1002/jms.2955. [DOI] [PubMed] [Google Scholar]
- Kertesz V.; Van Berkel G. J. J. Mass Spectrom. 2010, 45, 252–260. 10.1002/jms.1709. [DOI] [PubMed] [Google Scholar]
- Roach P. J.; Laskin J.; Laskin A. Analyst 2010, 135, 2233–2236. 10.1039/c0an00312c. [DOI] [PubMed] [Google Scholar]
- Rolli R.; Loppacher M.; Morlock G. CAMAG Bibliogr. Service CBS 2009, 102, 2–3. [Google Scholar]
- Advion. https://www.advion.com/products/plate-express/ (accessed 10/12/2020).
- Zhang J.; Rector J.; Lin J. Q.; Young J. H.; Sans M.; Katta N.; Giese N.; Yu W.; Nagi C.; Suliburk J. Science Translational Medicine 2017, 9, eaan3968. [DOI] [PMC free article] [PubMed] [Google Scholar]
- Wiley J. S.; Shelley J. T.; Cooks R. G. Anal. Chem. 2013, 85, 6545–6552. 10.1021/ac4013286. [DOI] [PubMed] [Google Scholar]
- Jjunju F. P.; Maher S.; Li A.; Syed S. U.; Smith B.; Heeren R. M.; Taylor S.; Cooks R. G. Anal. Chem. 2015, 87, 10047–10055. 10.1021/acs.analchem.5b02684. [DOI] [PubMed] [Google Scholar]
- Woolman M.; Gribble A.; Bluemke E.; Zou J.; Ventura M.; Bernards N.; Wu M.; Ginsberg H. J.; Das S.; Vitkin A. Sci. Rep. 2017, 7, 1–12. 10.1038/s41598-017-00272-y. [DOI] [PMC free article] [PubMed] [Google Scholar]
- Chen C.-H.; Chen T.-C.; Zhou X.; Kline-Schoder R.; Sorensen P.; Cooks R. G.; Ouyang Z. J. Am. Soc. Mass Spectrom. 2015, 26, 240–247. 10.1007/s13361-014-1026-5. [DOI] [PMC free article] [PubMed] [Google Scholar]
- Chen C.-H.; Lin Z.; Garimella S.; Zheng L.; Shi R.; Cooks R. G.; Ouyang Z. Anal. Chem. 2013, 85, 11843–11850. 10.1021/ac4025279. [DOI] [PMC free article] [PubMed] [Google Scholar]
- Albert A.; Engelhard C. Anal. Chem. 2012, 84, 10657–10664. 10.1021/ac302287x. [DOI] [PubMed] [Google Scholar]
- Chan G. C.-Y.; Shelley J. T.; Wiley J. S.; Engelhard C.; Jackson A. U.; Cooks R. G.; Hieftje G. M. Anal. Chem. 2011, 83, 3675–3686. 10.1021/ac103224x. [DOI] [PubMed] [Google Scholar]
- McDonnell L. A.; Heeren R. Mass Spectrom. Rev. 2007, 26, 606–643. 10.1002/mas.20124. [DOI] [PubMed] [Google Scholar]
- Caprioli R. M.; Farmer T. B.; Gile J. Anal. Chem. 1997, 69, 4751–4760. 10.1021/ac970888i. [DOI] [PubMed] [Google Scholar]
- Ifa D. R.; Manicke N. E.; Dill A. L.; Cooks R. G. Science 2008, 321, 805–805. 10.1126/science.1157199. [DOI] [PubMed] [Google Scholar]
- Cooks R. G.; Ouyang Z.; Takats Z.; Wiseman J. M. Science 2006, 311, 1566–1570. 10.1126/science.1119426. [DOI] [PubMed] [Google Scholar]
Associated Data
This section collects any data citations, data availability statements, or supplementary materials included in this article.


