Abstract
Wayfinding is a major challenge for visually impaired travelers, who generally lack access to visual cues such as landmarks and informational signs that many travelers rely on for navigation. Indoor wayfinding is particularly challenging since the most commonly used source of location information for wayfinding, GPS, is inaccurate indoors. We describe a computer vision approach to indoor localization that runs as a real-time app on a conventional smartphone, which is intended to support a full-featured wayfinding app in the future that will include turn-by-turn directions. Our approach combines computer vision, existing informational signs such as Exit signs, inertial sensors and a 2D map to estimate and track the user’s location in the environment. An important feature of our approach is that it requires no new physical infrastructure.
While our approach requires the user to either hold the smartphone or wear it (e.g., on a lanyard) with the camera facing forward while walking, it has the advantage of not forcing the user to aim the camera towards specific signs, which would be challenging for people with low or no vision. We demonstrate the feasibility of our approach with five blind travelers navigating an indoor space, with localization accuracy of roughly 1 meter once the localization algorithm has converged.
Keywords: Blindness, visual impairment, wayfinding, indoor localization, computer vision
1. INTRODUCTION AND RELATED WORK
Indoor wayfinding is a major challenge for blind and visually impaired travelers, who generally lack access to visual cues such as landmarks and informational signs that many travelers rely on for navigation. Outdoor environments, while often more dangerous to traverse than indoor environments, have the advantage of access to GPS-based apps. These include a number that are either expressly designed for, or accessible to, visually impaired users, including Nearby Explorer1, Seeing Eye GPS2, BlindSquare3 and Google Maps4. However, GPS is only accurate outdoors, and the goal of making similar tools for travelers of all abilities function in GPS-denied indoor environments is an area of active research, with entire conferences dedicated to this subject5, and increasing presence in the marketplace.
A range of technologies have been developed for wayfinding applications; see [24] for a recent overview. Early work in accessible wayfinding emphasized the use of infrared light beacons [2], RFIDs [9] and visual markers [3, 27]. More recently, low-energy Bluetooth Beacons have been deployed in a variety of environments to support localization for use by apps such as NavCog [1]. All of these systems, however, require additional physical infrastructure, with associated installation and maintenance costs that may discourage implementation [10].
Alternative approaches for indoor localization are being developed that require no new infrastructure. The most popular among these is the use of Wi-Fi access points [8], now used by mainstream apps such as Apple Maps6 in a growing number of airports7 and shopping malls8. Another approach is to use magnetic signatures [21, 25], e.g., used in the IndoorAtlas9 and Microsoft Path10 apps. However, magnetic signatures require prior calibration, are unreliable in the absence of metallic structures (such as in buildings constructed primarily of wood) and may drift unpredictably over time, e.g., whenever large metallic structures such as shelves and tables are moved. Inertial sensing approaches use the smartphone inertial measurement unit (IMU) to perform dead reckoning through step detection [4, 5], but unless dead reckoning is augmented with other forms of location information it drifts over time. Moreover, such inertial-based step counting approaches require a stable walking gait for good performance, but visually impaired travelers sometimes walk in an irregular gait when exploring unfamiliar surroundings [22]. Such an irregular gait may occur when the traveler slows down (and perhaps stops momentarily) or steps sideways to explore.
Computer vision is a promising technology that enables indoor localization without the need for added infrastructure [11, 15], though it can also be used in conjunction with added infrastructure [18]. Some computer vision-based localization systems have relied on special hardware such as Google Tango [17], but other approaches such as VizMap [11] use standard smartphones. Moreover, the special tracking and positional estimation functions of Google Tango are now provided by the ARKit and ARCore Augmented Reality libraries available on standard iOS and Android mobile devices; the Google Visual Positioning System (VPS)11 uses a standard Android smartphone to provide more precise localization information to augment what is available by other means, including GPS and Wi-Fi. More recently, work by [23] addresses the last-few-meters wayfinding problem, which uses computer vision to recognize landmarks, read signage and identify places to complement the navigation guidance provided by a GPS-based navigation tool, whose noisy localization estimates only suffice to guide the user to the vicinity of their destination. Computer vision is combined with LiDAR in CaBot [14], which is a suitcase-sized autonomous navigation robot that localizes a visually impaired user and provides real-time orientation and mobility guidance (towards a desired destination while avoiding obstacles such as other people).
We propose a computer vision-based localization approach, implemented as a stand-alone real-time iPhone app. Our approach uses a 2D map (floor plan) that is more lightweight than the complex 3D models used by SLAM (simultaneous localization and mapping) technology such as [11]. It combines Visual-Inertial Odometry (VIO) (see Sec. 2.1) to estimate the user’s relative (ego-) motion in the environment with location information obtained from sign recognitions and geometric constraints imposed by walls and other barriers indicated on the map. In contrast with the Clew iOS app [28], which uses VIO to record a visually impaired traveler’s relative movements (i.e., dead reckoning) and facilitates path retracing, our approach estimates and tracks the user’s absolute location in the environment, i.e., their location on a map. The only requirements are a 2D floor plan of the environment, which can be easily converted into a digital map and annotated, along with a few pictures of highly visible signs, used as landmarks, to be logged in the same map. Compared to other mechanisms that utilize visual SLAM and use generic visual features for reference and localization, the landmarks (signs) selected for our system are arguably more stable over time and less susceptible to superficial changes such as lighting conditions, moved furniture, new posters or other wall coverings, etc. This is a critical issue to ensure that the spatial information encoded in our system remains valid through time, without the need for frequent updates.
2. APPROACH
We first review our recent work that this paper builds on before describing the new approach in detail.
2.1. Previous approach
The approach we describe in this paper builds on our recent work [6], which is a marker-based computer vision system in which a collection of unique markers (2D barcodes) are posted on the wall every several meters (roughly one such marker for each office door in an office building). The basic principle of [6] is that the user’s location can be determined in any frame in which a marker is recognized by estimating the camera’s pose relative to the marker and using the marker’s known location and orientation on the 2D map. The algorithm uses Visual-Inertial Odometry (VIO) [16] to update the absolute location estimate from the most recent marker recognition in the great majority of frames in which no marker is recognized.
VIO is an algorithm that performs dead reckoning, i.e., estimating the user’s movements in the environment, by combining computer vision and the smartphone’s inertial measurement unit (IMU). VIO is now a standard feature on modern smartphones that supports Augmented Reality (AR) applications, and is included in ARKit12 for iOS and ARCore13 for Android. It estimates movements in 6 degrees of freedom: X, Y, Z translations (in which +Y is aligned to the up direction defined by gravity and the XZ plane is the horizontal plane) in physical units (i.e., meters) and 3D orientation defined by roll, pitch and yaw. It is straightforward to project the 6D VIO motion estimates to the horizontal reference frame of the 2D map; given a known starting location and yaw (hereafter yaw refers to the direction of the camera line of sight projected on the horizontal plane), we can estimate the user’s trajectory on the map. While the resulting VIO trajectory is usually a good approximation of the user’s actual trajectory, the location estimate drifts over time, and the overall trajectory scale may be off by as much as 10% or more. We will describe our new approach in Sec. 2.2 that overcomes the limitations imposed by VIO noise (which could, for instance, erroneously estimate that the user is walking through a wall) and by the need for a known initial location and yaw, which is not always available.
In [6] we devised a simple app on an iPhone 8 that logs video frames and VIO data at several frames per second. The only feedback it provides to users is an audio warning if the camera is pointed too far above or below the horizon, to maximize the opportunities for capturing usable pictures of markers. The localization algorithm was implemented on a laptop computer for offline analysis of the logged data. Our experiments with four blind users demonstrated the feasibility of this marker-based localization approach.
2.2. New approach
Our new approach builds on the previous work described above by adding three principal elements: (1) Recognition of standard signs, including Exit signs, instead of markers (which are no longer used). (2) Using the locations of walls and other impassable barriers in the map, as well as the locations of signs, to constrain the location and motion estimates. (3) Maintaining and evolving multiple location hypotheses over time using a particle filter, instead of the single hypothesis that we updated over time in [6]. Next we describe each element in turn.
2.2.1. Sign recognition.
A key element of our approach is the use of informational signs as beacons: when a sign is recognized in an image, the apparent location of the sign in the image determines the user’s approximate location relative to the sign. (If there are multiple signs in the floor plan with identical appearance then a single sign recognition in isolation cannot determine which sign was recognized; multiple hypotheses must be considered, which is an important motivation for the particle filter described in Sec. 2.2.3.) Our current system recognizes just one type of sign: the standard emergency Exit sign, which is particularly useful as a beacon because the line-of-sight to an Exit sign is legally mandated to be visible throughout any workplace or commercial space [20]. We build on our past Exit sign recognition algorithm [7], which we applied in our earlier work on indoor localization [22] that used step detection to perform dead reckoning. The Exit sign recognition algorithm is a fast Adaboost cascade-based approach that runs on the smartphone in approximately 7ms on a 630 × 360 image, and returns an approximate bounding box for each detected Exit sign.
Given an Exit sign bounding box estimate, we use the centroid of the bounding box to estimate the direction to the sign and its distance. The direction to the sign is calculated as the angular difference between the yaw direction (the direction of the camera line of sight projected on the horizontal plane) and the direction of the sign centroid in the image. The distance is calculated using 3D orientation information furnished by VIO, assuming knowledge of two pieces of information: (a) the physical height of the sign centroid above the ground and (b) the height of the camera above the ground (which depends on the user’s height and how the smartphone is held or worn). In brief, the distance is estimated using the apparent elevation of the detected sign above the horizon in the image: the closer the sign appears to the horizon, the farther away it is. (Note that the horizon line in the image is specified by the camera’s pitch and roll, furnished by VIO.)
2.2.2. Visibility and traversability constraints.
The map (Fig. 3) specifies the locations of walls and other barriers in addition to the location and orientation of each sign (not shown in Fig. 3). A simple 2D ray-tracing algorithm is performed to determine where on the map each sign is visible, taking into account both the opaqueness of walls and the additional constraint that a sign is only recognizable from a limited range of viewing angles. (Note that some signs, such as Exit signs, have faces visible on both sides; this necessitates two sign annotations sharing the same location but having opposite orientations.) The resulting visibility map for each sign is used to determine whether a sign is expected to be visible for a specific location and yaw hypothesis; if it is, then when a sign is detected in an image, the estimated direction and distance to the sign are compared with the direction and distance implied by the location and yaw hypothesis to evaluate the evidence for the hypothesis.
Figure 3:
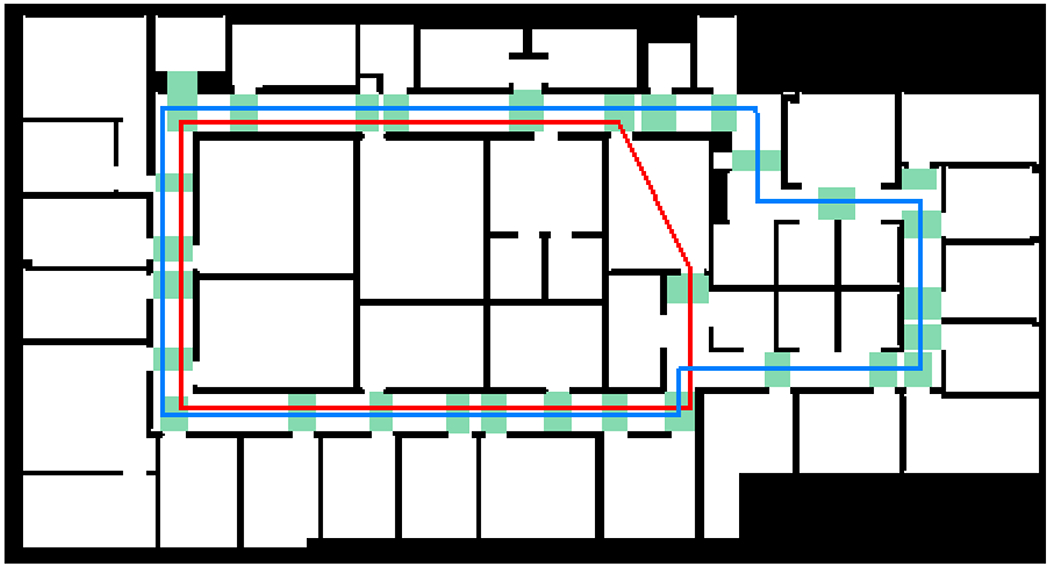
Map of indoor environment, with dimensions 39 m × 21 m. Walls and other impassable barriers are shown in black. A total of 31 rectangular regions of interest (ROIs), used in User Study 2, are indicated in green. Route R1 (77 m) is shown in blue and route R2 (58 m) in red.
A similar ray-tracing algorithm is performed to determine if a hypothetical trajectory should be ruled out because it implies that the traveler is walking through a wall or other impassable barrier. This calculation allows the particle filter to remove impossible hypotheses.
2.2.3. Particle filter.
We use a standard particle filter algorithm [26] from robotics to represent uncertain knowledge of the user’s location (x, y) and yaw θ; the entire state is denoted S = (x, y, θ). The particle filter maintains multiple hypotheses for S that evolve over time (see Fig. 1), continually accumulating evidence from multiple sources (sign detections, motion from VIO and impassable barriers indicated in the map) until it “locks on” to the correct location, which is indicated by a tight spatial cluster of hypotheses in the map.
Figure 1:
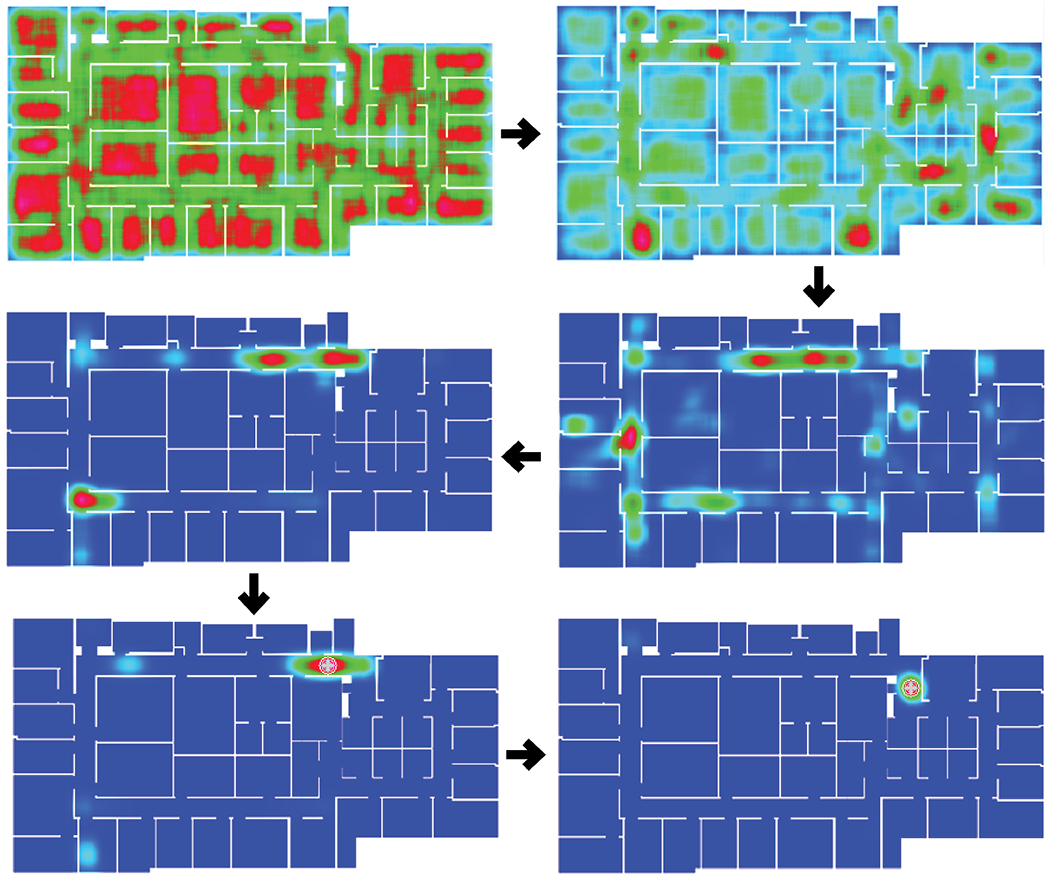
Evolution of spatial probability density map over time shows how localization algorithm begins with high uncertainty and converges to a single well-localized peak. See text for details.
The particle filter contains two main components: (a) A dynamical model expressing how a hypothesis St at time t is likely to evolve in the next time step, St+1. VIO measurements at t and t + 1 allow us to predict St+1 in terms of St; the dynamical model accounts for the noise in this prediction. Note that yaw noise is very low, since the yaw estimate is based heavily on the smartphone’s gyroscope, which estimates yaw changes with only minimal drift over time. By contrast, the noise in estimating spatial translations is much larger, since VIO estimates egomotion by combining both apparent motion cues in the image with inertial data. We compensate for noise in the overall estimated translation scale using a scale correction factor that is drawn uniformly randomly from the interval [1, 1.2] for each particle when it is created; this factor corrects the scale of all spatial translations estimated by VIO for the life of the particle. The dynamical model also rules out invalid state changes from St to St+1 that would violate the traversability constraint. (b) A measurement (likelihood) model that assesses the consistency of a hypothesis St with an Exit sign detection (or non-detection). This model compares the predicted Exit sign detection in the image implied by St with an actual detection, taking into account the relative distance, relative yaw and visibility implied by the map, and assigns a likelihood score to St.
To interpret the set of particles at each time step, we apply a kernel density estimator (KDE)[26] to estimate a spatial probability density map, or heat map. Local maxima in this heat map above a minimum peak threshold are considered as candidate location estimates; the algorithm returns a location estimate if only one substantial candidate peak exists, otherwise the algorithm declares uncertainty.
Fig. 1 shows how the uncertainty of the heat map decreases as the user walks and signs are detected. The top left image shows the heat map generated by the particle filter soon after the system is launched (red means high likelihood of the user standing in that location, green means medium likelihood and blue means low likelihood). Next, an Exit sign detection generates clusters of likely locations that are compatible with the camera yaw hypothesis and estimated distance with respect to all the Exit signs in the floor plan. In the images that follow, as the user keeps walking, the uncertainty decreases until most of the particles converge around a single location in the map, yielding a strong peak in the heat map that is interpreted by the system as a likely user location. The white cross at the center of the cluster shows the estimated user location.
2.3. Implementation details
We initially implemented the new localization algorithm on a laptop that analyzed data offline saved by the logging app we developed in [6]. Then we ported the entire app to the iPhone 8, where it runs in real time using Swift for the user interface and C++ for the localization and computer vision algorithms; the app uses the main rear-facing camera to acquire the video imagery needed for VIO. The real-time app uses 50, 000 particles in the particle filter and uses a particle filter time step of 100ms (reflecting the computational limitations imposed by real-time performance); the logging app records data roughly every 6 – 7ms, including the bounding boxes of any Exit sign detections.
Both apps provide several forms of audio feedback. The first audio feedback is to help the user keep the camera line of sight roughly horizontal, issuing a warning whenever the camera is pointed too far above or below the horizon. Second, both apps monitor the status of the VIO tracking, which must be initialized when the app is first launched by panning the camera for a few seconds, and issue a text-to-speech (TTS) announcement after VIO has been initialized. A “too fast” TTS announcement is issued if the VIO tracker deems that the camera is moving too fast, in which case the user has to slow down, or stop momentarily, until the warning stops.
The real-time app provides three additional forms of audio feedback. First, every few seconds an audio tone is issued to indicate whether the system declares a localization result (single beep) or it declares uncertainty (double beep). Second, we defined a total of 31 regions of interest (ROIs) on the map (see Fig. 3), one for nearly every office door and landmark (e.g., elevator, stairwell) on the floor; any time the algorithm estimates that the smartphone is located inside an ROI, the app issues a brief TTS announcement. The TTS announcement is repeated continously as long the location remains in the ROI. We note that this user interface was designed for the convenience of the experimenter, and is not intended to guide the user (who often found the repeating TTS announcements distracting and annoying); in the future we will devise a UI that provides accessible wayfinding guidance. In addition, the app issues an audio warning if the camera lens is covered.
Finally, the real-time app allows the experimenter to set the height of the smartphone camera above the floor, since the Exit sign range estimates used by the particle filter depend on this number.
We note that the real-time app uses substantial computational resources. In one participant experiment we measured the battery consumption from the app: the battery charge decreased from 100% to 87% after more than 16 minutes of continuous use of the app. We conclude that the battery consumption is significant but comparable to other resource-intensive smartphone apps such as video games, and is therefore not likely to prohibit real-world usage.
The app software will be open sourced upon publication of this manuscript.
3. USER STUDIES
We conducted two user studies. The first study assessed localization performance conducted using the logging app and offline analysis of the data saved by it. The second study focused on the performance of the real-time localization app. Together these studies included a total of six blind participants (ages 27 – 72, four female/two male). The studies were done in an iterative fashion, using our experiences with the first few participants in each study to debug both the software and our experimental protocol and to refine our UI; the results from these participants are excluded from our analysis. Results are reported from two participants in the first study (P1 and P4) and five participants in the second study (P1, P3, P4, P5 and P6).
Three participants used a white cane and the other three used a guide dog. For each participant, we described the purpose of the experiment and obtained IRB consent. Before participants used our app, we explained how it worked, including the app’s audio feedback and the need to avoid sudden camera movements (which causes motion blur and thereby degrades the image quality) or covering the camera lens with the hands. Participants were instructed to walk with whatever travel aid they wished to use (white cane or guide dog). If the participant held the smartphone by hand (see Fig. 2), they were instructed to aim the camera straight ahead; any orientation (e.g., portrait or landscape) consistent with this camera direction was permitted. Then we had each participant practice using the app under the same conditions that would apply to the formal experiment.
Figure 2:
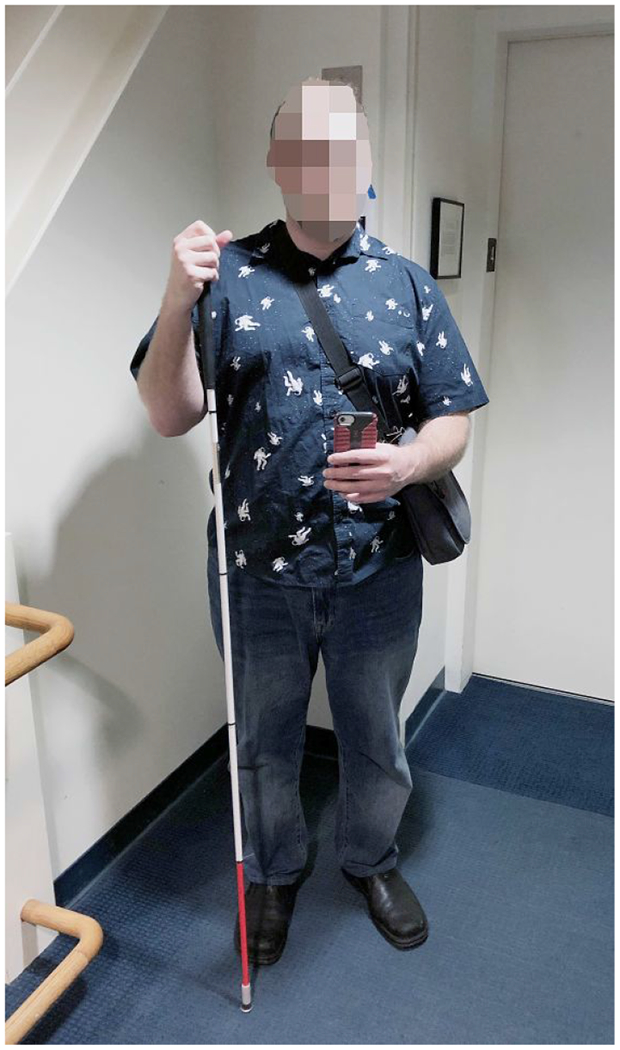
Participant shown (with face obscured) holding smartphone in experiment.
All experiments were performed on a floor of the main Smith-Kettlewell building, with dimensions 39 m × 21 m (see Fig. 3).
3.1. User Study 1: Localization performance using the logging app
This study assesses offline localization performance as a function of two conditions. The first condition is the modality, i.e., how the user holds or wears the smartphone, which has four possible values: handheld, lanyard (which we note is a modality that is supported by the Google Lookout app14), pocket (the smartphone is placed in a shirt pocket with the lens facing out) and strap (the smartphone is attached to the strap of a satchel or shoulder bag; in [6] this is referred to as the satchel condition).
The second condition is the starting condition, which is the information that the localization algorithm has when it’s initialized. The two possible starting condition values are unknown and known. Unknown means that both the location and yaw are unknown, and so the particles are randomly initialized with a uniform distribution over the floor plan (including all allowed locations but not inside walls or other barriers) and uniform yaw – this is a worst-case assumption that would apply to the case in which a traveler knows which floor of a building they are on but nothing else. Known means that the starting location is known to within a meter accuracy but the yaw is unknown, which would apply to the case in which a traveler knows their approximate starting location (e.g., near an elevator) but not the direction they are facing. (We have experimented with using the magnetometer to estimate the user’s initial yaw, but these yaw estimates are unreliable, sometimes deviating more than 90° degrees from the true yaw.) Note that, while the modality is fixed for each experimental trial that we conducted, we are free to vary the starting condition when analyzing the data offline.
Each participant completed a total of 16 trials. The experimenter gave turn-by-turn directions (such as “turn left in 3… 2… 1”) in a Wizard-of-Oz paradigm [12] simulating the way a full-featured wayfinding app would function. In each trial, the participant was asked to use a specific modality and to complete either of two routes, R1 (77 m long) or R2 (58 m long), in either a clockwise or counterclockwise direction (Fig. 3). The trials were randomized so that each block of 4 trials contained all four modalities in random order (to minimize learning effects that could otherwise result). For each participant we recorded the height of the smartphone camera above the ground for all four modalities.
3.1.1. User Study 1 ground truth procedure.
We devised a simple procedure to evaluate the localization accuracy. The procedure establishes an approximate ground truth location at selected reference points in the path taken by the user. This is accomplished by having an experimenter follow a few meters behind the traveler and take a video of their footsteps. This video is reviewed offline, with the experimenter noting each frame when the traveler passes by a reference point (such as a door) and using visual context (e.g., nearby doors and other features) to determine the corresponding ground truth location on the map. The ground truth location for each reference point is then entered by clicking on the corresponding location on the map. We estimate that the ground truth location is accurate to about 1 m, which implies that errors can be estimated to approximately 1 m accuracy.
In our experiments we used a pre-selected set of reference points (11 for the short circuit and 15 for the long one) to evaluate each route, depending on the length of the route and the visibility of landmarks. The data logged by the traveler’s app is time-synched with the video so that any reference point in the video is associated with the corresponding logging data. In this way, the ground truth location of each reference point may be directly compared with the corresponding location estimated from the logging data.
3.1.2. User Study 1 results.
We show the localization error for the unknown starting location condition in Fig. 4. Each plot shows the cumulative distribution function (CDF) of the localization error for a specific modality and aggregates over all trials with that modality for both participants. Within each trial all available localization results are included; no data is available for times when the algorithm declares uncertainty. The median localization errors are under 1 m for all modalities, which is roughly the same as the accuracy of our ground truth location estimates; 95% of the localization estimates have an error of 1.5m or better.
Figure 4:
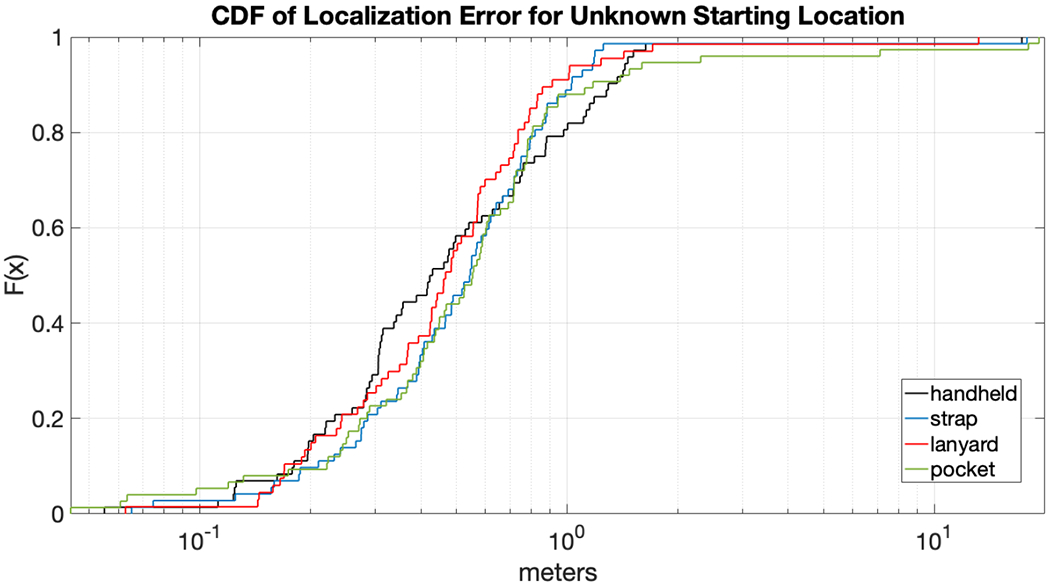
Offline analysis: localization error given unknown starting condition, for each of the four modalities (handheld, lanyard, strap, pocket). Error in meters is shown as a cumulative distribution function (CDF) plot. The median localization errors are under 1 meter for all four modalities (but note that the accuracy of the ground truth location estimates is roughly 1 meter). Each line aggregates four trials per participant times two participants.
We also show the localization error for the known starting location condition in Fig. 5, displayed in the same way as the previous figure. Again the median localization errors are under 1 m for all modalities; 95% of the localization estimates have an error of 1.4m or better.
Figure 5:
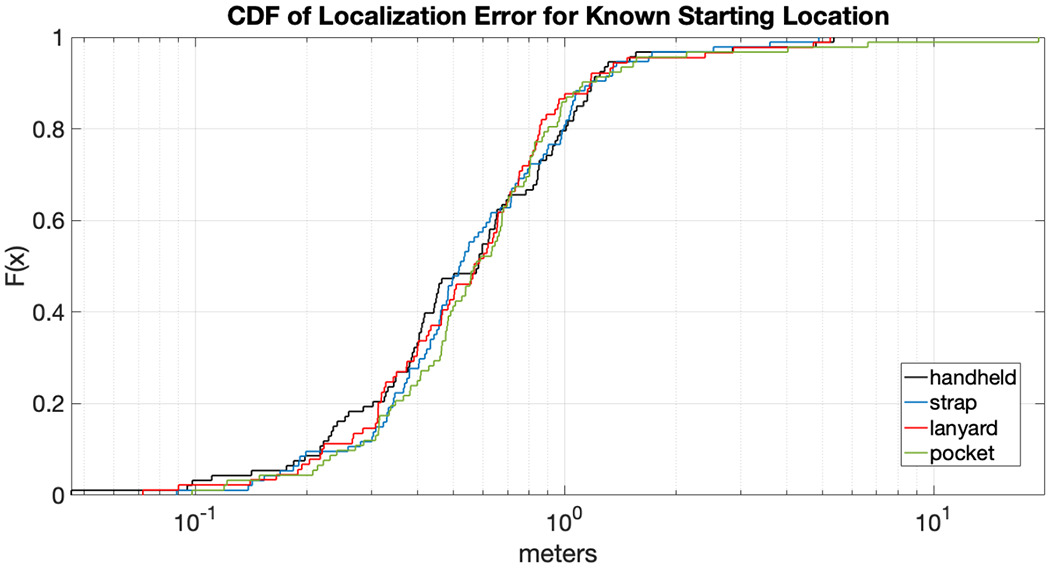
Same as previous figure but for known starting condition. The median localization errors are under 1 meter for all four modalities (but note that the accuracy of the ground truth location estimates is roughly 1 meter).
These results demonstrate that our algorithm provides accurate localization estimates once it converges (“locks on”). They also suggest that all of the four modalities are about equal in effectiveness, and so the choice of which modality to use should be based mostly on individual preferences and circumstances.
Next we analyze how long it takes (both in terms of distance and time) for the algorithm to converge, i.e., to arrive at a single localization estimate. Fig. 6 shows the CDF of the distance to convergence, both for the known starting location and unknown starting location conditions. Each condition aggregates over all trials from both participants. As expected, the distance to convergence is usually very short (a few meters) for the known starting location condition. For the unknown starting location condition, the median distance is approximately 12 meters. Empirically we have observed that convergence often occurs after the participant has walked around at least one corner of a path. Corners provide a powerful constraint for the particle filter, since false trajectories that turn by 90° (as directed by VIO) are likely to collide with a wall and are thus immediately removed from consideration.
Figure 6:
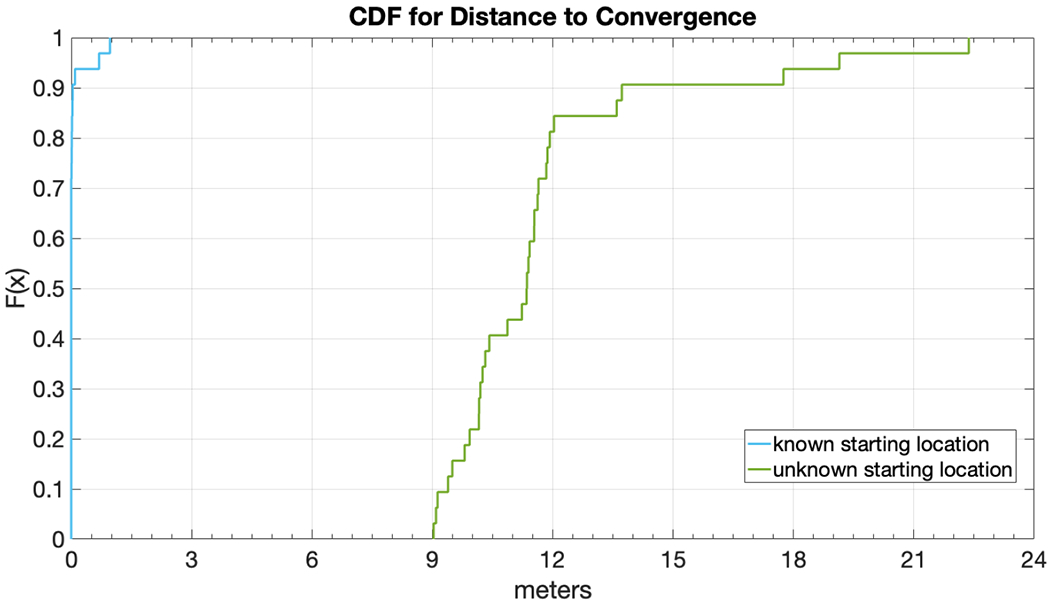
Distance to convergence.
Fig. 7 shows the corresponding CDFs expressed for time to convergence instead of distance. As before, the time to convergence is usually very short (just a few to several seconds) for the known starting location condition. For the unknown starting location condition, the median time is approximately 19 sec. We note that, though these plots aggregate over both participants, convergence times depend strongly on walking speed, which varies among participants (see Sec. 3.2.2).
Figure 7:
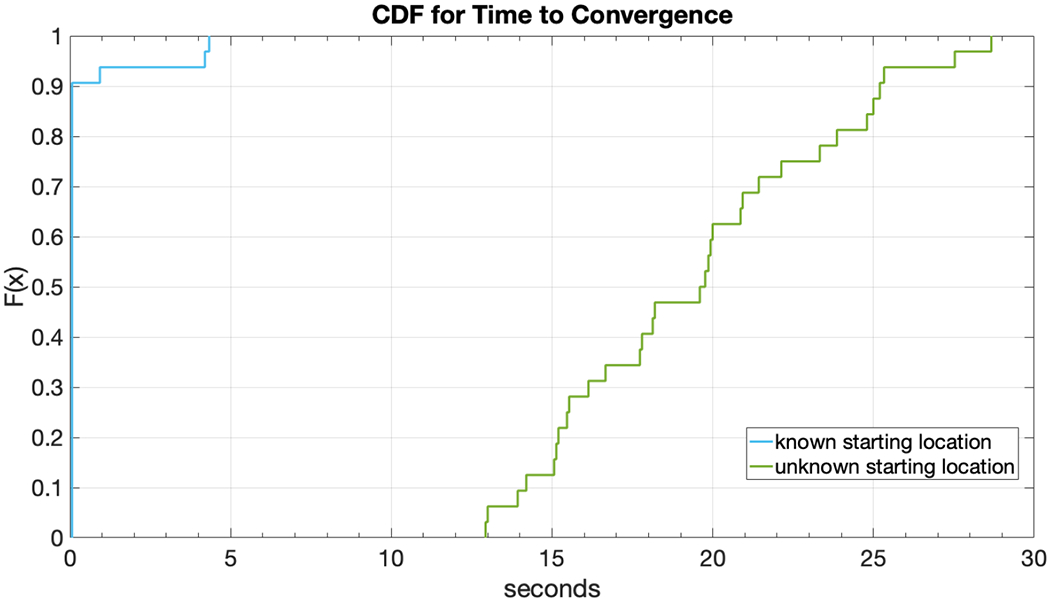
Time to convergence.
Finally, we report the fraction of data samples (logged by the app) for which the algorithm supplied a localization estimate, as opposed to samples for which the algorithm reports uncertainty. For the unknown starting location condition this fraction ranges from 0.65 to 0.69 (depending on modality), and for the known starting location condition it ranges from 0.87 to 0.89. If we ignore samples that occur before the initial convergence, then the fractions range from 0.78 to 0.84 for unknown starting location and 0.88 to 0.89 for known starting location. These results show that the incidence of uncertainty is low after the initial convergence. However, as we discuss in Sec. 3.2.2, the peak location represented by the initial convergence is often at the incorrect location, and is only corrected later after additional evidence has accumulated.
3.2. User Study 2: Localization performance using the real-time app
This study assesses localization performance of the real-time app. Based on the earlier finding that the other modalities (lanyard, pocket and strap) are roughly as effective as handheld, we test in the handheld condition only. We focus on two different scenarios, each tested with five participants.
Convergence scenario (four trials per participant): In each trial, the participant is told to start exploring the floor from a specified initial location and walking direction. No directions or guidance are given to the participant. The participant is asked to continue walking until the app converges (“locks on”) to the correct location. The app is launched with the unknown starting location condition, reflecting the possibility that the participant only knows what floor they are on but not their location or yaw. This scenario simulates the conditions under which a traveler might launch a full-featured wayfinding app and explore the environment until the app converges and offers guidance.
Tracking scenario (one trial per participant): The experimenter has arranged for the app to have already converged to the correct location before this trial begins. The participant is told to follow a lengthy route specified by the experimenter, who gives turn-by-turn directions (as in User Study 1). This scenario simulates the conditions under which a traveler might use a full-featured wayfinding app after it has converged.
Note that the tracking scenario begins with complete knowledge of the participant’s initial location and yaw; by contrast, the “known” starting location condition from User Study 1 is incomplete in that it assumes a known initial location but unknown yaw.
3.2.1. User Study 2 ground truth procedure.
We devised a procedure similar to that used in User Study 1 to evaluate the localization accuracy. Again the experimenter walked a few steps behind the participant and acquired video of their footsteps and of the nearby scene; however, since the real-time app performed no data logging, we relied on the audio track of the video to record the audible feedback issued by the app. By reviewing this video offline, the experimenter was able to estimate the participant’s ground truth location relative to the ROIs (see Fig. 3) and compare it with the app’s audio feedback. Instead of evaluating localization accuracy in physical units (e.g., meters), we evaluated how often the correct feedback was obtained when the participant entered a ROI. The offline video also allowed the experimenter to determine the timing of any events in the trial.
3.2.2. User Study 2 results.
In the convergence trials our goal is to assess the distribution of walking distances required to attain convergence. (There are four convergence trials per participant; however, the data for one trial was accidentally deleted for one participant.) We distinguish between first convergence and correct convergence. First convergence refers to the first time in which the algorithm reports a location estimate, as in User Study 1. However, empirically we find that the first such location estimate is often incorrect, but that after a short period of additional walking the location estimate locks on to the correct location, which we refer to as the correct convergence. In the future we will explore an automatic method for estimating whether a convergence is likely to be correct or not, to reduce the confusion associated with incorrect (but mostly transient) location estimates.
In User Study 2 a location estimate is indicated by a TTS utterance reporting an ROI; unfortunately, if the algorithm’s estimate of the user’s location doesn’t fall within an ROI then we are forced to ignore this location estimate (since the audio feedback doesn’t convey specific location information in this case). In other words, convergence (first or correct) can’t be inferred until the participant enters an ROI, which artificially inflates the convergence distances we measured. Fortunately the ROIs cover the walkable space quite densely (Fig. 3) so this effect should be minimal.
We show the distribution of first and correct convergences as CDFs (shown in red and blue, respectively) in Fig. 8. The two CDF curves have a similar shape except that the correct convergence distance CDF is shifted by roughly 10 m relative to the first convergence distance CDF.
Figure 8:
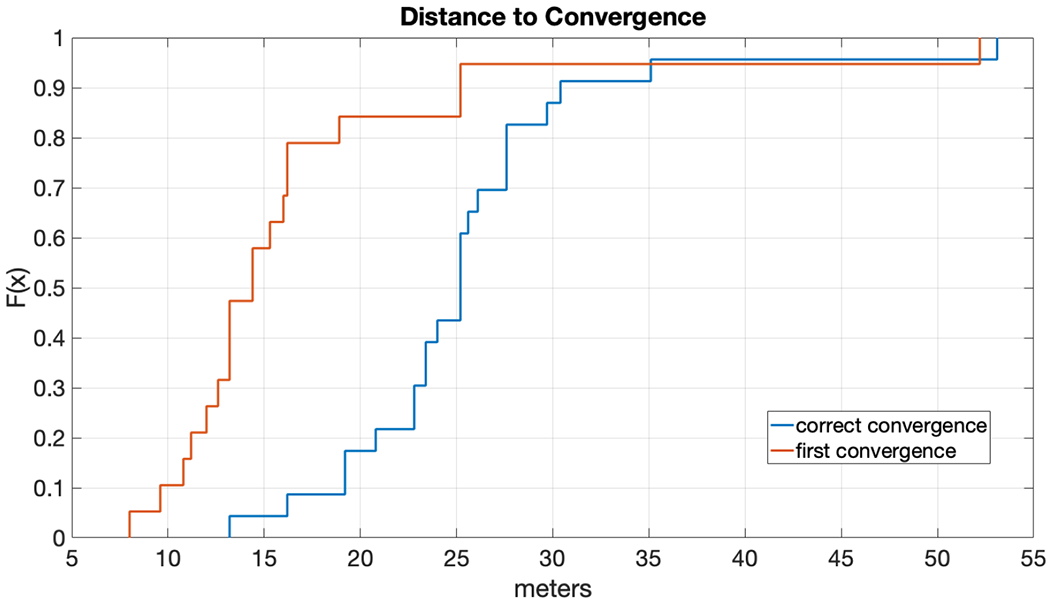
First distance to convergence (red) and correct distance to convergence (blue), in meters, shown as CDFs.
Next we discuss the tracking trials. Here we assess performance in terms of the false positive rate (FPR) and false negative rate (FNR), which together form a suitable proxy for a metric localization error in a physical unit such as meters. We define FPR as FPR = FP/(FP + TN) where FP is the number of false positives (a FP is defined as a TTS utterance that is reported either in the wrong ROI, or in a location that is not inside an ROI) and TN is the number of true negatives (occasions when the participant was not inside a ROI and the app uttered no TTS). Similarly, FNR is defined as FNR = FN/(TP + FN), where TP is the number of true positives (occasions when the participant entered a ROI and the app uttered the correct TTS for it) and FN is the number of false negatives (times the user was inside an ROI but no TTS was announced).
Empirically we found that FPR = 0 for all trials of all five participants. The FNR rates for each participant (P1, P3, P4, P5 and P6) are as follows: FNR = (0.02, 0.009, 0.009, 0.09, 0.02). The FNR rates are very low (0.02 or lower) for every participant except for P5. In the tracking trial for each participant, the route covered a total of roughly 100 ROIs (counting each ROI multiple times if it was visited in multiple passes along the trial).
Finally, we report the average walking speed for each participant. For simplicity we estimated this speed for a representative long straight-line path that each participant walked in their tracking trial. The average walking speeds, in units of m/s, for each participant (P1, P3, P4, P5 and P6) are as follows: speed = (0.9, 1.2, 0.6, 0.9, 1.6). This highlights the high variability in walking speed that we encountered.
Overall, the results of User Study 2 demonstrate that the real-time app performs localization reliably once the algorithm locks on to the correct location. We note that the real-time app works well despite a slower sampling rate compared with the offline algorithm.
4. CONCLUSIONS AND FUTURE WORK
We have demonstrated the feasibility of a real-time app that combines computer vision, a 2D map and the smartphone’s IMU to estimate and track the user’s location in an indoor environment. While the app requires the user to either hold the smartphone or wear it with the camera facing forward while walking, it has the advantage of not forcing the user to aim the camera towards specific signs, which would be challenging for people with low or no vision. Once the localization algorithm locks on to the correct location, it continues to track with a typical localization accuracy of roughly 1 meter or better.
Future work will focus on testing our approach on other indoor environments, including buildings with multiple floors. The smartphone barometer can be used to automatically detect and estimate relative floor transitions [19], though additional information is still required to estimate the absolute floor location (such as the initial floor that the user begins on when the app is launched).
A long-term priority will be to increase the speed of the convergence (locking on) process. The simplest way to accomplish this is to expand the set of signs that are recognized and distinguished in an environment; even Exit signs often contain left or right arrows (which our Exit sign recognition algorithm currently ignores) that can be used to distinguish them from other Exit signs in the same environment. Ideally a sign recognition algorithm could be trained with a single clear image of a (planar) sign, which would make it easy to train the system to recognize and distinguish multiple signs. We will also investigate an alternative method of estimating the distance to a sign directly from the physical size and shape of the sign and its appearance in the image, instead of our current approach that requires knowledge of the height difference between the camera and the sign.
The app we have implemented performs localization only, but we will transform it into a full-featured wayfinding app with an accessible UI that offers turn-by-turn directions to a desired destination as well as optional announcements of nearby points of interest. We recently conducted focus groups on the indoor wayfinding needs of blind and visually impaired travelers and will use the feedback from these groups to drive the development of our UI. Some visually impaired travelers might prefer navigation directions presented using spatialized (3D) sound, as implemented in the Microsoft Soundscape app15, and we will experiment with this type of interface as a possible alternative (or supplement) to verbal directions. We note that travelers with residual vision may prefer a visual UI (e.g., an Augmented Reality interface that superimposes high-contrast arrows on the smartphone screen to guide the user) over an audio one.
We acknowledge that our current approach is best suited to indoor environments dominated by corridors, which provide powerful geometric constraints that rule out many false location hypotheses; wide open indoor spaces such as airports are challenging for visually impaired travelers [13] and may also be problematic for our localization algorithm. The persistent Augmented Reality capabilities that have recently been added to ARKit and ARCore (e.g., 16), which allow an app to create and save a 3D model of an environment and use it later as a reference for localizing the camera (effectively a SLAM-based approach), may be useful for handling wide open spaces.
CCS CONCEPTS.
• Human-centered computing → Accessibility technologies; Mobile devices; • Computing methodologies → Computer vision.
ACKNOWLEDGMENTS
The authors would like to acknowledge helpful discussions with Dr. Roberto Manduchi, Mr. Marc-Aurèle Rivière and Dr. Huiying Shen. We would like to thank Dr. Seyed Ali Cheraghi for suggesting the battery consumption test.
This work is supported by the National Institutes of Health/National Eye Institute, grant no. 1R01EY029033, and by the National Institute on Disability, Independent Living, and Rehabilitation Research, grant. no. 90RE5024-01-00.
Footnotes
REFERENCES
- [1].Ahmetovic Dragan, Gleason Cole, Ruan Chengxiong, Kitani Kris, Takagi Hironobu, and Asakawa Chieko. 2016. NavCog: a navigational cognitive assistant for the blind. In Proceedings of the 18th International Conference on Human-Computer Interaction with Mobile Devices and Services ACM, 90–99. [Google Scholar]
- [2].Brabyn Lesley A and Brabyn John A. 1983. An evaluation of “Talking Signs” for the blind. Human Factors 25, 1(1983), 49–53. [DOI] [PubMed] [Google Scholar]
- [3].Coughlan James and Manduchi Roberto. 2009. Functional assessment of a camera phone-based wayfinding system operated by blind and visually impaired users. International Journal on Artificial Intelligence Tools 18, 03 (2009), 379–397. [DOI] [PMC free article] [PubMed] [Google Scholar]
- [4].Fallah Navid, Apostolopoulos Ilias, Bekris Kostas, and Folmer Eelke. 2012. The user as a sensor: navigating users with visual impairments in indoor spaces using tactile landmarks. In Proceedings of the SIGCHI Conference on Human Factors in Computing Systems ACM, 425–432. [Google Scholar]
- [5].Flores German and Manduchi Roberto. 2018. Easy Return: An App for Indoor Backtracking Assistance. In ACM CHI Conference on Human Factors in Computing Systems (CHI’18) https://escholarship.org/uc/item/0jz7c81x [Google Scholar]
- [6].Fusco Giovanni and Coughlan James M.. 2018. Indoor Localization Using Computer Vision and Visual-Inertial Odometry. In International Conference on Computers Helping People with Special Needs Springer, 86–93. [DOI] [PMC free article] [PubMed] [Google Scholar]
- [7].Fusco Giovanni, Tekin Ender, and Coughlan James M.. 2016. Sign Finder Application - Technical Report. (2016). https://www.ski.org/sign-finder-application-technical-report [Google Scholar]
- [8].Gallagher Thomas, Wise Elyse, Li Binghao, Andrew G Dempster Chris Rizos, and Ramsey-Stewart Euan. 2012. Indoor positioning system based on sensor fusion for the blind and visually impaired. In 2012 International Conference on Indoor Positioning and Indoor Navigation (IPIN) IEEE, 1–9. [Google Scholar]
- [9].Ganz Aura, Siddhesh Rajan Gandhi Carole Wilson, and Mullett Gary. 2010. INSIGHT: RFID and Bluetooth enabled automated space for the blind and visually impaired. In 2010 Annual International Conference of the IEEE Engineering in Medicine and Biology IEEE, 331–334. [DOI] [PubMed] [Google Scholar]
- [10].Gleason Cole. 2017. Crowdsourcing the Installation and Maintenance of Indoor Navigation Infrastructure. In Proceedings of the 19th International ACM SIGACCESS Conference on Computers and Accessibility ACM, 411–412. [Google Scholar]
- [11].Gleason Cole, Guo Anhong, GieradLaput Kris Kitani, and Bigham Jeffrey P. 2016. VizMap:Accessible visual information through crowdsourced map reconstruction. In Proceedings of the 18th International ACM SIGACCESS Conference on Computers and Accessibility ACM, 273–274. [Google Scholar]
- [12].Good Michael D,Whiteside John A, Wixon Dennis R, and Jones Sandra J. 1984. Building a user-derived interface. Commun. ACM 27, 10(1984), 1032–1043. [Google Scholar]
- [13].Guerreiro Joao, Ahmetovic Dragan, Sato Daisuke, Katani Kris, and Asakawa Chieko. 2019. Airport Accessibility and Navigation Assistance for People with Visual Impairments. In CHI 2019. [Google Scholar]
- [14].Guerreiro João, Sato Daisuke, Asakawa Saki, Dong Huixu, Kitani Kris M, and Asakawa Chieko. 2019. CaBot: Designing and Evaluating an Autonomous Navigation Robot for Blind People. In The 21st International ACM SIGACCESS Conference on Computers and Accessibility ACM, 68–82. [Google Scholar]
- [15].Hu Feng, Zhu Zhigang, and Zhang Jianting. 2014. Mobile panoramic vision for assisting the blind via indexing and localization. In European Conference on Computer Vision Springer, 600–614. [Google Scholar]
- [16].Kelly Jonathan and Sukhatme Gaurav S. 2011. Visual-inertial sensor fusion: Localization, mapping and sensor-to-sensor self-calibration. The International Journal of Robotics Research 30, 1(2011), 56–79. [Google Scholar]
- [17].Bing Li J Munoz Pablo, Rong Xuejian, Xiao Jizhong, Tian Yingli, and Arditi Aries. 2016. ISANA: wearable context-aware indoor assistive navigation with obstacle avoidance for the blind. In European Conference on Computer Vision Springer, 448–462. [Google Scholar]
- [18].Nair Vishnu, Tsangouri Christina, Xiao Bowen, Olmschenk Greg, Zhu Zhigang, and Seiple William H. 2018. A hybrid indoor positioning system for the blind and visually impaired using Bluetooth and Google tango. (2018). [Google Scholar]
- [19].Hideaki NII, Romain FONTUGNE, Yojiro UO, and Keiichi SHIMA. 2017. BaR: Barometer based Room-level Positioning. In 2017 International Conference on Indoor Positioning and Indoor Navigation (IPIN), Vol.4. [Google Scholar]
- [20].OSHA. 2018. OSHA Fact Sheet: Emergency Exit Routes. https://www.osha.gov/OshDoc/data_General_Facts/emergency-exit-routes-factsheet.pdf
- [21].Riehle Timothy H, Anderson Shane M, Lichter Patrick A, Giudice Nicholas A, Sheikh Suneel I, Knuesel Robert J, Kollmann Daniel T, and Hedin Daniel S. 2012. Indoor magnetic navigation for the blind. In 2012 Annual International Conference of the IEEE Engineering in Medicine and Biology Society IEEE, 1972–1975. [DOI] [PubMed] [Google Scholar]
- [22].Rituerto Alejandro, Fusco Giovanni, and Coughlan James M.. 2016. Towards a Sign-Based Indoor Navigation System for People with Visual Impairments. In 18th International ACM SIGACCESS Conference on Computers and Accessibility ACM, ACM, Reno, NV. [DOI] [PMC free article] [PubMed] [Google Scholar]
- [23].Saha Manaswi, Alexander J Fiannaca Melanie Kneisel, Cutrell Edward, and Morris Meredith Ringel. 2019. Closing the Gap: Designing for the Last-Few-Meters Wayfinding Problem for People with Visual Impairments. In The 21st International ACM SIGACCESS Conference on Computers and Accessibility ACM, 222–235. [Google Scholar]
- [24].Sakpere Wilson,Adeyeye-Oshin Michael, and Mlitwa Nhlanhla BW. 2017. A state-of-the-art survey of indoor positioning and navigation systems and technologies. South African Computer Journal 29, 3(2017), 145–197. [Google Scholar]
- [25].Subbu Kalyan Pathapati, Gozick Brandon, and Dantu Ram. 2013. LocateMe: Magnetic-fields-based indoor localization using smartphones. ACM Transactions on Intelligent Systems and Technology (TIST) 4, 4(2013), 73. [Google Scholar]
- [26].Thrun Sebastian, Burgard Wolfram, and Fox Dieter. 2005. Probabilistic robotics. MIT press. [Google Scholar]
- [27].Tjan Bosco S, Beckmann Paul J, Roy Rudrava, Giudice N, and Legge Gordon E. 2005. Digital sign system for indoor way finding for the visually impaired. In 2005 IEEE Computer Society Conference on Computer Vision and Pattern Recognition (CVPR’05)-Workshops IEEE, 30–30. [Google Scholar]
- [28].Yoon Chris, Louie Ryan, Ryan Jeremy, Vu MinhKhang, Bang Hyegi, Derksen William, and Ruvolo Paul. 2019. Leveraging Augmented Reality to Create Apps for People with Visual Disabilities: A Case Study in Indoor Navigation. In The 21st International ACMSIGACCESS Conference on Computers and Accessibility ACM, 210–221. [Google Scholar]


