Abstract
Background
Elevated adiposity is often posited by medical and public health researchers to be a risk factor associated with cardiovascular disease, diabetes, and other diseases. These health challenges are now thought to be reflected in epigenetic modifications to DNA molecules, such as DNA methylation, which can alter gene expression.
Methods
Here we report the results of three Epigenome Wide Association Studies (EWAS) in which we assessed the differential methylation of DNA (obtained from peripheral blood) associated with three adiposity phenotypes (BMI, waist circumference, and impedance-measured percent body fat) among American Indian adult participants in the Strong Heart Study.
Results
We found differential methylation at 8264 CpG sites associated with at least one of our three response variables. Of the three adiposity proxies we measured, waist circumference had the highest number of associated differentially methylated CpGs, while percent body fat was associated with the lowest. Because both waist circumference and percent body fat relate to physiology, we focused interpretations on these variables. We found a low degree of overlap between these two variables in our gene ontology enrichment and Differentially Methylated Region analyses, supporting that waist circumference and percent body fat measurements represent biologically distinct concepts.
Conclusions
We interpret these general findings to indicate that highly significant regions of the genome (DMR) and synthesis pathways (GO) in waist circumference analyses are more likely to be associated with the presence of visceral/ abdominal fat than more general measures of adiposity. Our findings confirmed numerous CpG sites previously found to be differentially methylated in association with adiposity phenotypes, while we also found new differentially methylated CpG sites and regions not previously identified.
Introduction
The condition “obesity” is often posited by medical and public health researchers to be a risk factor associated with cardiovascular disease, diabetes, and other metabolic and inflammatory disturbances [1]. Obesity is defined as the accumulation of excess body fat which may be detrimental to health [2], but is most frequently diagnosed using the body mass index (BMI), a ratio of an individual’s weight to the square of their height [3]. However, it is well-documented that substantial variation exists among human populations in terms of the percent body fat an individual carries, and the health risks to which a given BMI value purportedly corresponds [4, 5]. Indeed, BMI can track body fat percentage poorly, limiting comparisons between human populations, even among populations with relatively small amounts of genetic divergence [5, 6].
For proxy variables such as the BMI to be valuable, they must have a high degree of fidelity to the traits they are intending to represent. However, BMI has been shown to misrepresent both the comparative physiologies of populations [6] and the health of individuals in a clinical setting [7, 8]. In spite of this limitation, BMI continues to be used as a diagnostic criterion for the likelihood that the adipose tissue present in an individual will result in health problems (i.e., “obesity”), and is frequently used to describe global trends in public health, especially in reference to predicting future prevalences of metabolic syndrome and cardiovascular disease [2].
“Obesity”-associated health challenges such as metabolic syndrome and cardiovascular disease are now thought to be potentially mediated via epigenetic mechanisms that impact gene expression (e.g., [9]). In particular, DNA methylation (DNAm), or the addition of a methyl group to the cytosine nucleotide of 5′-C-phosphate-G-3′ (CpG) dinucleotides, is one of the most well-studied epigenetic biomarkers, and differential DNAm at multiple loci has been associated with BMI in past studies [1, 3, 9-11].
This study investigated the extent to which an Epigenome Wide Association Studies (EWAS) focused on BMI replicates findings of two EWAS focused on other physiological measurements: waist circumference and percent body fat. The former has been included in some previous EWAS (e.g., [3, 9], though these studies were done using data from other populations and therefore of uncertain generalizeability). Waist circumference is a coarse proxy for visceral adipose tissue, which has been associated with increased likelihood of multiple forms of cancer, insulin resistance, and other pathologies [12-15]. We chose percent body fat because it is a direct measurement of the amount of adipose tissue a person has, and thus functions as a control for the notion that body fat itself is directly causing disease. We conducted our analyses on data gathered as part of the Strong Heart Study, a population-based prospective cohort study to monitor cardiovascular disease and its risk factors in American Indian communities [16].
The goals of the present investigation were to (1) expand the diversity of ancestry and experience represented in epigenetic studies of human health, (2) apply Illumina’s EPIC array to expand the number of CpG sites and Differentially Methylated Regions (DMRs) examined in association with BMI, and (3) to compare these associations to two other, more biologically relevant variables: waist circumference and percent body fat. Here we present the results of three EWAS, one for each adiposity proxy. We compare the results of these three analyses, and present a comparison among our overall findings and those of previous EWAS focused on BMI and waist circumference.
Methods
Study population
The Strong Heart Study is a population-based prospective cohort study funded by the National Heart Lung and Blood Institute to monitor cardiovascular disease and its risk factors in 12 US American Indian communities from the Northern Plains, the Southern Plains, and the Southwest [16]. The study began in 1989, and recruited men and women between 45 and 75 years old in all communities; all participants gave informed consent to participate in the study. In this study, DNA methylation in peripheral blood was measured in 2351 individuals recruited in the first (of three) phases of the Strong Heart Study. After quality control was performed, 2325 samples were included in our analyses (all from Phase 1 of the Strong Heart Study) (Fig. 1).
Fig. 1. Diagram illustrating data processing procedure used for this study.
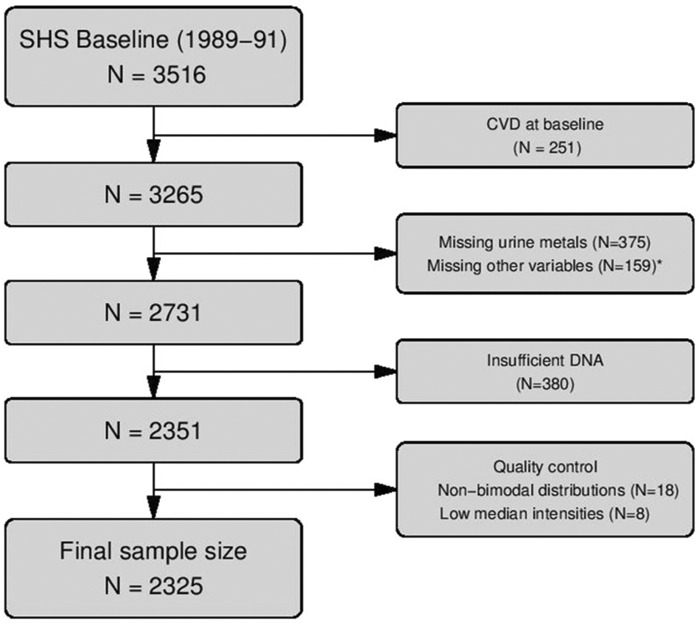
Flow chart describing the processing of data, the number of samples that were removed at each stage, and the final sample size.
* 5 participants missing education, 2 smokings status, 11 BMI, 52 LDL cholesterol, 14 hypertension treatment, 111 eGFR, 30 diabetes
Data collection
Participants were interviewed and physically examined by centrally trained staff according to a standardized protocol [16, 17]. In the interview, participants reported sociodemographic data (age, sex, education), smoking status (never, current, former), and medical history. The physical examination conducted anthropometric measures, including height, weight, and blood pressure, and collected a fasting blood sample and spot urine sample.
Adiposity phenotypes
Participants were examined in the morning after a 12-h overnight fast, which included instruction not to eat breakfast the morning of the visit to the exam, and to eat or drink nothing but water after 9:00 the previous evening [17]. Height was measured standing in centimeters rounded to the nearest integer, and weight was measured in kilograms using a scale that was re-zeroed each day and calibrated against a known 50 lb weight every month or whenever the scale was moved. Body Mass Index was calculated by dividing weight in kilograms by height in meters squared. Waist circumference at umbilicus was measured supine in centimeters rounded to the nearest integer. The bioelectric impedance was measured supine on the right side, unless amputated, using Impedance Meter Model # B1A101 (RJL Equipment Company). For the impedance measurements, participants were checked by examiners to confirm they had not exercised vigorously for the past 12 h, had not consumed alcohol in the past 24 h, and were not dehydrated. We estimated fat free mass and percentage of body fat using fat free by equations based on total body water validated in American Indian populations [18, 19].
DNA methylation
Biological specimens were collected during a physical examination and were stored at <−70 °C. DNA from white blood cells was extracted and stored at the Penn Medical Laboratory, MedStar Health Research Institute under a strict quality control system. Genomic DNA was shipped to Texas Biomedical Research Institute where it was bisulfite-converted, eluted in buffer, and DNAm was measured using Illumina’s MethylationEPIC BeadChip Array (EPIC), which provides a measure of DNAm at a single nucleotide resolution at >850,000 CpG sites. This platform is enriched with content important in disease and likely labile to environmental exposures. Samples were randomized across and within plates to remove potential batch artifacts and confounding effects, and replicate and across-plate control samples were included on every plate.
DNA methylation data were read in six different batches (five batches of 400 individuals and the sixth one with 350 individuals), and combined using the R package minfi. Individuals without a bimodal distribution in DNA methylation levels were excluded (N = 18). We generated a sample QC report based on EPIC control probes to assess staining, hybridization, bisulfite conversion, and other parameters (minfi R package). Detection of failed probes was based on Illumina’s recommendations (6159 CpG sites that had a p-detection value greater than 0.01 in more than 5% of the individuals were removed). We determined the total intensity (methylated + unmethylated channel) across all probes measured, excluding 8 participants that had low median intensities (the cut off point was 10 log2 intensity units). Single sample noob normalization was conducted with the R package minfi [20, 21]. After these exclusions, we had a total 2325 individuals and 860079 CpGs. We then deconvolved white blood cell types using the Houseman method [22] in the sva R package (which distinguishes among CD8T, CD4T, NK, B cells, Monocytes, and Granulocytes) that were used later on as adjustment variables in the regression models. Principal Component Analysis (PCA) was conducted to determine if any batch effect correction was required, and batch effect correction was conducted for sample plate, sample row, and sample isolation technique using the combat function (sva R package). PCA was repeated afterward to check that batch effect had been removed. Cross-hybridizing probes, sex chromosomes, and SNP probes with minor allele frequency > 0.05 [23] were removed for analysis. Our final number of CpG sites for analysis was 790026.
Differentially methylated positions and regions analyses
Three predictors of DNAm were assessed: BMI, waist circumference, and body fat percentage. We used linear regression to identify mean differences in DNAm associated with our potential predictors using the limma package in R [24], adjusting for biologically relevant variables (age, sex, smoking status (never, former, current), and location/origin of each participant (Arizona, Oklahoma, North/South Dakota)) and estimated cell type proportions [22]. Multiple comparisons were accounted for using the Benjamini and Hochberg method for false discovery rates (FDR) [25]. DMRs analysis was performed using the DMRcate R package, which uses Stouffer p value [26] for combining p values and grouping significant CpG sites into regions. For these analyses we considered the FDR-corrected results to be significant at p ≤ 0.05.
Gene ontology enrichment
We performed gene ontology enrichment analyses using the gometh package of R, which includes a correction for bias due to the differing numbers of CpG sites profiled for each gene. Enrichment results of p < 0.05 FDR were considered significant; we chose this value in order to maintain the same cutoff across all of our analyses and consistent with related literature (e.g., [9]).
Comparisons with previous EWAS
We chose five previously conducted EWAS encompassing nine cohort studies against which to compare our results: the criterion for inclusion was that the studies must include the Houseman deconvolution of white blood cell types, and include either BMI or waist circumference as the investigated phenotype in the EWAS (no other studies included percent body fat). The studies selected used data from diverse cohorts, but all used the Illumina Infinium HumanMethylation450k BeadChip Array. The studies included drew their data from the following cohorts: the Research on Obesity & Diabetes among African Migrants (RODAM) study among Ghanians living in the Netherlands, Germany, the UK, and Ghana; the Rotterdam Study (RS) among residents of Rotterdam, Netherlands; the Atherosclerosis Risk in Communities Study (ARIC) among white and Black residents in four states in the USA; the Framingham Heart Study (FHS) among the residents of Framingham Massachusetts, USA; the Genetics of Lipid Lowering Drugs and Diet Network (GOLDN) study among multiple generations of white families living in Minnesota and Utah in the USA; the Qatari Family Study (QFS) among multiple generations of Qatari families living in Qatar; the European Prospective Investigation into Cancer and Nutrition (EPICOR) study among Italian people; the Kooperative Gesundheits-forschung in der Region Augsburg (Cooperative Health Research in the Augsburg Region, or KORA) cohort among a representative sample of the residents of the Augsburg Region of Germany; and the London Life Sciences Prospective Population (LOLIPOP) Study among residents of London in the UK.
We compiled the differentially methylated CpGs each study found to be statistically significantly associated with BMI or waist circumference, and compared them with our results, noting which findings were consistent with our study.
Results
The median (interquartile range) for BMI, waist circumference and % body fat were 29.6 (26.22, 33.63) kg/m2, 103 (94, 112) cm, and 35.9 (28.8, 42.4)%, respectively (Table 1). Women had higher BMI and waist circumference and markedly higher % body fat than men. Participants from Arizona had higher values for the three phenotypes compared to Oklahoma and North/South Dakota.
Table 1.
Median (IQR) of BMI (kg/m2), waist circumference (cm), and % body fat by participant’s characteristics.
| BMI (kg/m2) | Waist circumference (cm) | % Body fat | ||
|---|---|---|---|---|
| Overall | 2325 | 29.6 (26.2, 33.6) | 103 (94, 112) | 35.9 (28.8, 42.4) |
| Age, years | ||||
| < 50 | 669 | 29.8 (26.5, 34.2) | 102 (94, 112) | 35.5 (28.5, 42.7) |
| 50–64 | 1246 | 29.7 (26.4, 33.8) | 103 (95, 113) | 36.3 (29.2, 42.3) |
| ≥65 | 410 | 28.7 (25.5, 32.3) | 102 (93, 112) | 35.4 (28, 42.1) |
| Sex | ||||
| Men | 964 | 28.9 (25.8, 32.5) | 101 (94, 110) | 28.5 (24.4, 32.3) |
| Women | 1361 | 30.1 (26.4, 34.5) | 104 (94, 114) | 41.0 (36.7, 45.3) |
| Smoking status | ||||
| Never | 684 | 29.8 (26.6, 34.6) | 103 (95, 113) | 38.7 (31.9, 44.5) |
| Former | 748 | 30.5 (27.6, 34.3) | 105 (98, 114) | 35.2 (29.6, 42.4) |
| Current | 893 | 28.1 (24.8, 32.3) | 99 (91, 110) | 33.3 (26.8, 40.0) |
| Center | ||||
| Arizona | 312 | 32.0 (28.3, 37.0) | 109 (100, 120) | 40.5 (33.3, 45.8) |
| Oklahoma | 981 | 29.7 (26.4, 34.0) | 103 (95, 113) | 35.4 (28.7, 42.3) |
| N/S Dakota | 1032 | 28.7 (25.5, 32.5) | 101 (92, 110) | 34.5 (28, 41.2) |
N/S North/South
We found differential methylation at 8264 CpG sites associated with one or more of our three response variables. Specifically, we found that BMI was associated with 3383, waist circumference with 7743, and percent bodyfat with 810 differentially methylated CpG sites, with substantial overlap among and between the three variables (Figs. 2 and 3). Of the top ten most significant CpGs for each variable, relatively few were unique to an individual measure of phenotype (Fig. 4, Supplementary Table 1-4).
Fig. 2. Venn Diagram of results of three EWAS studies (BMI, waist circumference, and percent body fat).
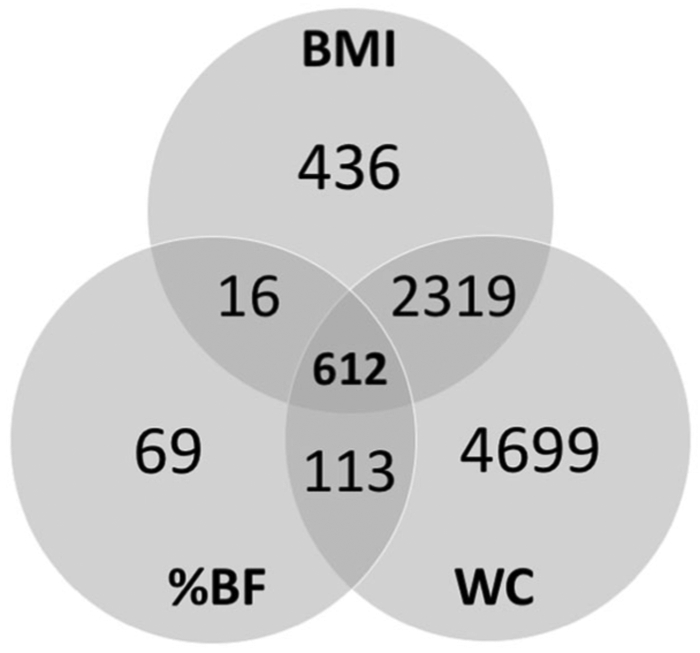
This diagram shows the overlap in significantly differentially methylated CpG results for three EWAS studies described in this paper.
Fig. 3. Manhattan plot of three EWAS studies (BMI, waist circumference, and percent body fat).
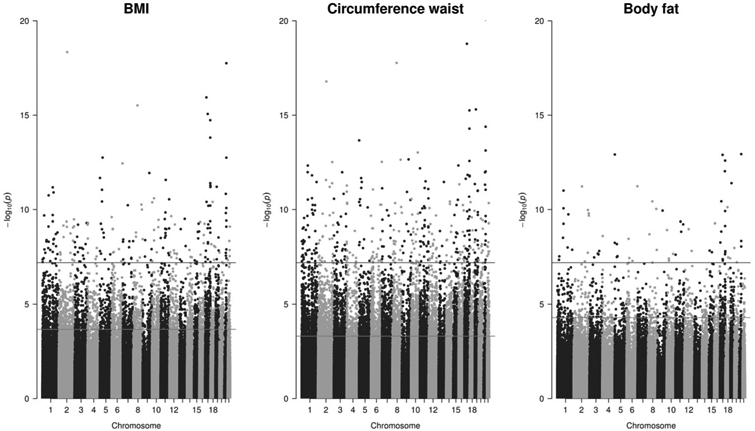
Blue (higher) horizontal lines show Bonferroni correction cutoff, red (lower) horizontal lines show FDR correction cutoff (color figure online).
Fig. 4. Venn diagram of differentially methylated CpG sites.
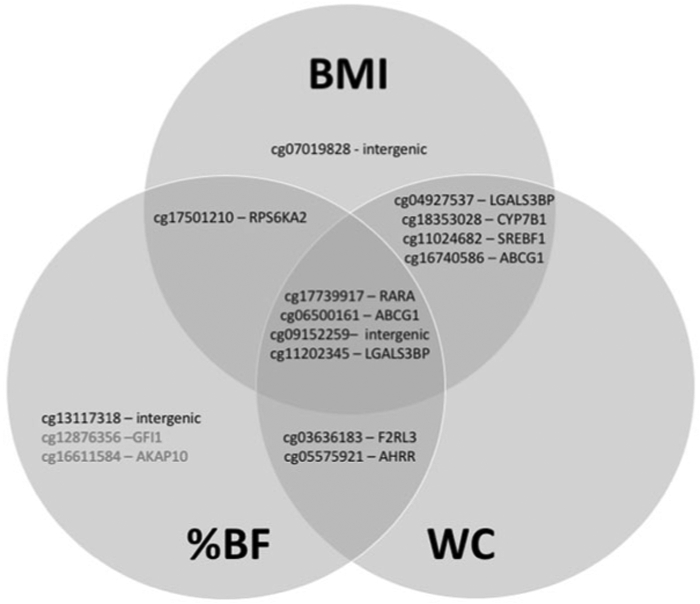
Diagram shows the top ten most significantly differentially methylated CpG sites in each of three EWAS studies (BMI, waist circumference, and percent body fat).
Our DMR analyses identified 312 DMRs across all three EWAS: 15 were uniquely associated with BMI, 194 were uniquely associated with waist circumference, 90 were associated with both BMI and waist circumference, and 13 were associated with all three variables (Fig. 5, Supplementary Tables 5-7). We chose three regions with the highest number of differentially methylated CpG sites associated with all three outcomes (BMI, percent bodyfat, and waist circumference) to illustrate those regions in more detail: the genes associated with these regions are ACB1G, FLI1, and SENCR (Fig. 6). In sensitivity analyses stratifying the main findings for the three variables by sex, the findings were similar for both men and women (Supplementary Table 8).
Fig. 5. Venn diagram of differentially methylated CpG regions.
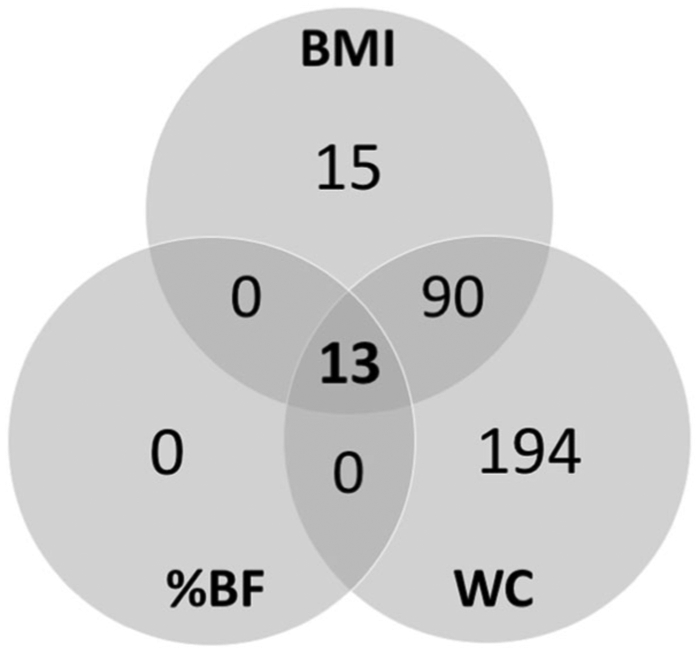
Diagram shows the overlap in significantly differentially methylated regions results for three EWAS studies (BMI, waist circumference, and percent body fat).
Fig. 6. Graphical representation of selected results from DMR analyses.
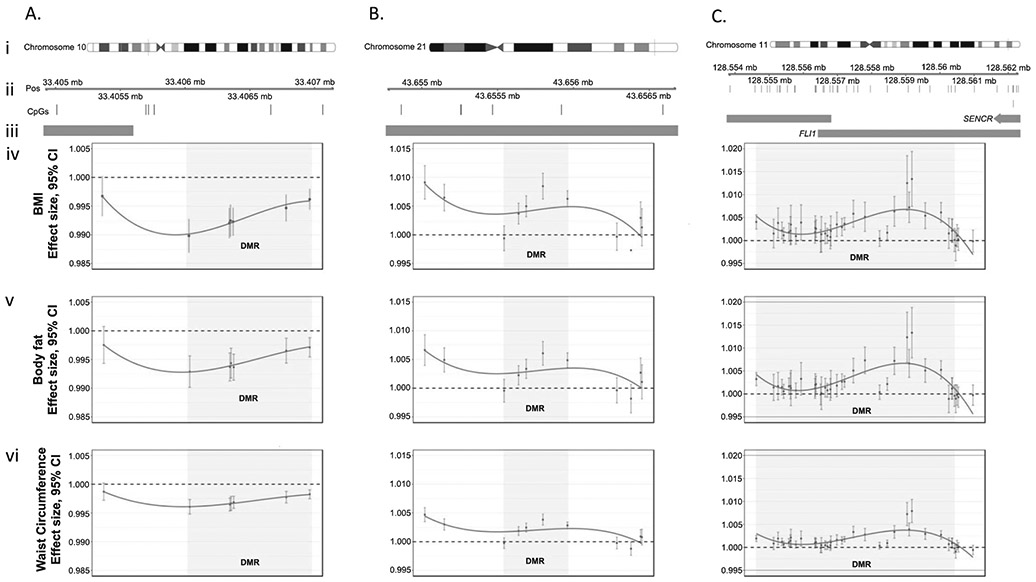
We chose three regions (a–c) with the highest number of CpG sites associated with our three outcomes (BMI, percent body fat, and waist circumference). For each region we illustrate (i) the chromosome and location of the region (ii) the expanded region and specific location of CpGs within it (iii) any overlap with promoter regions of the genome (shown as orange bars) and the effect size of individual CpGs within a region (points) and the entire region (gray shading) for each of our three response variables: (iv) BMI, (v) percent body fat and (vi) waist circumference. Within each plot (a–c iv-vi) points are connected with smoothed splines.
For each of the three EWAS that we performed, we carried out gene ontology enrichment analyses (R, gometh package) correcting for bias due to the differing numbers of CpG sites profiled for each gene. We found that 248 differentially methylated genes were associated with BMI, 315 with waist circumference, and four with percent body fat. There was substantial overlap among and between the three variables: all gene ontology (GO) terms associated with percent body fat were also found in BMI and waist circumference analyses, while 208 GO terms were associated with both BMI and waist circumference (Fig. 7, Supplementary Tables 9-11).
Fig. 7. Venn diagram of Gene Ontology Enrichment Association results.
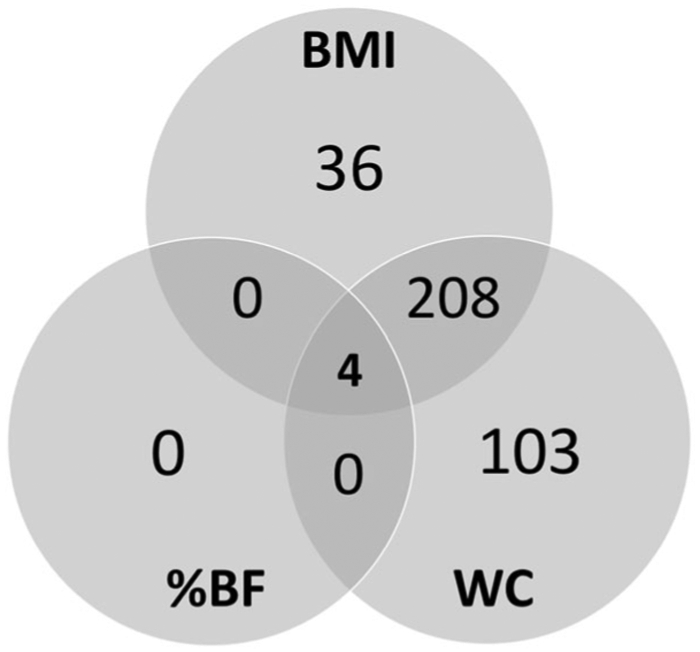
Diagram shows the overlap in Gene Ontology Enrichment Association results for three EWAS studies (BMI, waist circumference, and percent body fat).
This is the first Illumina Infinium HumanMethylationEPIC BeadChip Array (EPIC) EWAS to assess DNAm associated with adiposity, and the only EWAS to date that has used data from a cohort of people with predominantly American Indian ancestry. In order to validate our results both in terms of the assay, and in terms of the variability among human populations, we compared our results to those of 5 other published studies, which examined either BMI or waist circumference associations with differential DNA methylation using the previous generation of Illumina array. We found that 134 of the CpG sites that our study identified as differentially methylated in association with either BMI, waist circumference, or percent body fat were also identified as differentially methylated in association with either BMI or waist circumference in at least one of the other studies, which drew data from multiple cohorts (RODAM [11], RS [3], ARIC, FHS, GOLDN [3, 9] the Qatari Family Study [10], EPICOR, KORA, and LOLIPOP [1]) (Supplementary Table 12).
Discussion
Here we report that three common proxies for determining an individual’s body-fat-related health risk (the definition of “obesity”) have overlapping, but distinct, associations with methylation of DNA at CpG sites and genomic regions [27]. Our results substantially expand the number of CpG sites examined in association with BMI and waist circumference, as previous studies used a previous generation of Illumina Infinium HumanMethylation BeadChip Array, the capacity of which was approximately 450 thousand CpG sites (the capacity of the EPIC array is greater than 860 thousand CpGs). However, there is overlap between the two generations of assay: many of our results matched previous studies done using the previous generation (450k sites) array [1, 3, 9-11].
Of the three adiposity proxies we measured, waist circumference had the highest number of associated differentially methylated CpGs, while percent body fat was associated with the lowest number of differentially methylated CpGs. In our DMR analyses, body fat showed a similar pattern: the highest number of DMRs were associated with waist circumference, with fewest associated with percent body fat.
As percent body fat is a calibrated measure of an individual’s body composition, and waist circumference is a direct measure of central adiposity, we interpret these two variables to be, in theory, the most relevant and focused indicators of physiology (of the three proxies that we assessed). In interpreting the results presented here, we, therefore, suggest that the CpGs associated only with BMI, but not with percent body fat or waist circumference, be the object of secondary focus, as it is possible that these signals reflect domains other than adiposity.
Limiting our focus to waist circumference and percent body fat is in keeping with recommendations of the current literature, which generally reports that index variables such as BMI are poor indicators of overall health and fitness both in individuals [7, 8] and for groups because they apply unevenly across populations [2], while being easily confounded in general [28]. The CpGs and DMRs associated with percent body fat and waist circumference are more likely to be indicative of physiology and potential health outcomes associated with the presence of adipose tissue and its distribution in the body compared to CpGs and DMRs associated with BMI alone [29, 30].
Even with such a constraint imposed, our study replicates 127 previously identified differentially methylated CpGs that in our study were associated with either waist circumference or body fat, and which were associated in previous studies with either waist circumference or BMI (no previous study considered percent body fat). In addition to this overlap with results from the previous generation of Illumina’s array, we identified 7828 other differentially methylated CpGs associated with percent body fat, waist circumference, or both. Among those, 4537 are not found in the 450 K array.
Gene ontology (GO) enrichment analyses indicated that immune system pathways (e.g., leukocyte differentiation and activation, lymphocyte activation, and hemipoetic/lymphoid organ development) were among the most significantly DMRs in all three analyses. While our study relies on blood DNA methylation, rather than methylation of adipose tissue itself, these methylation signals in blood could be reflecting changes in immune system pathways that are either affected by adiposity or that predispose to differential adiposity levels. For example, it is known that immune function can be impaired by malnutrition: methylation along these pathways may be congruent with previous findings of increased immune activity associated with greater degrees of adiposity (reviewed in [31]). Similarly, cells in visceral fat depots (associated with higher waist circumferences) have been shown to produce higher counts of lymphocytes and inflammation transcripts than cells in subcutaneous fat depots—indicating that at least in some cases, higher waist circumferences may be associated with increased immunoactivity [32]. Whether the differential methylation in our dataset represents an increase or decrease in transcriptomic activity cannot be conclusively determined: methylation within the body of genes (rather than in promoters) has been associated with increased and baseline level transcription, while methylation of transcription factor binding sites effectively silences genes [33, 34].
Waist circumference is a proxy for central adiposity, while percent body fat is a proxy for how much fat an individual has relative to their body mass. The low degree of overlap between these two variables in general, but specifically gene ontology enrichment and DMR analyses, indicates that in terms of DNA methylation, physiologically—and thus likely for health outcomes—these two measurements represent concepts which are biologically distinct. We therefore interpret these general findings to indicate that highly significant regions of the genome (DMR) and synthesis pathways (GO) in waist circumference analyses are more likely to be associated with the presence of visceral/abdominal fat than other measures. In fact, regions and pathways associated only with waist circumference and not with percent body fat (nor BMI) may be better candidates for investigation of visceral-fat-related DNA methylation markers as well as related health concerns. Similarly, we interpret the low number of significant regions (DMR) and pathways (GO) that are associated with percent body fat as indicating that how much fat an individual carries is a bad proxy for physiology—and thus unlikely to predict health outcomes, although the impact of measurement error cannot be totally discarded.
In particular, our DMR analysis showed that the top ten DMRs (ranked by density of methylation (number of methylated CpGs/width of region)) associated with waist circumference alone were strongly associated with genes involved in cell signaling, immune function, and metabolism (i.e., PSMB1, ROR2, RALGDS, NOTCH1, PLPBP, ZDHHC7, SYF2, SIGLEC15, ITPKA, VGLL4). This is congruent with the results of our gene ontology enrichment analysis for waist circumference, which found that pathways related to immune system function and signal transduction were among the most heavily differentially methylated. It is challenging to codify the combined results of all three DMR analyses into a similar narrative, as, for example, the three most heavily DMRs that occur across all three phenotypes do not have a united biological function. SENCR (smooth muscle differentiation-associated lncRNA) is not, to our knowledge associated with any adiposity related condition and FLI1 (a proto-oncogene) is associated with Ewing sarcoma, a form of cancer that is agnostic to BMI [35, 36]. However, reduced expression of ABCG1 (macrophage cholesterol and phosopholipids transport) has been associated with metabolic syndrome, which may be relevant to some, but not all, individuals with elevated adiposity [37]. All in all, combining the results of DMR analyses from all three adiposity phenotypes does not indicate that BMI, percent bodyfat, and waist circumference are physiologically synonymous, nor does doing so appear to add nuance.
Although percent body fat and waist circumference represent an improvement from the use of BMI to make conclusions about body composition and adiposity, they are still noisy approximations of overall health [8]. For example, waist circumference does not take into account the relative amounts of visceral and subcutaneous adipose tissue [38], and substantial measurement error is associated with impedance measures of percent body fat [39]. Impedance measures of percent body fat have been shown to be less precise than Dual Energy X-Ray Absorptiometry (DXA) for determining the total and regional amounts of adipose tissue [39]. Even with a perfect measure of the percent of an individual’s mass that is comprised of adipose tissue, fat distribution has also been found to be associated with health outcomes. For example, abdominal adiposity (represented by waist circumference) has been positively associated with liver cancer [12-14], and visceral (rather than subcutaneous) adipose tissue may be associated with insulin resistance and the onset of type 2 diabetes [15, 38].
In the context of future studies, we emphasize that waist circumference and body fat percentage are known to be insufficiently sensitive to elucidate the relationships among adipose tissue, perceived fatness, and health risks [7, 40-42]. Advancing knowledge of the relationship of adipose tissue to various disease statuses in humans will require major shifts in both framework and technique (reviewed in [43]). The current conceptual framework in which we investigate health associations with adipose tissue relies on the assumption that adipose tissue is overwhelmingly negative to health, when in reality there exists a healthy window of the amount of adipose tissue necessary for health throughout life [44, 45]. In terms of techniques used, we advocate a departure from the cheap but rudimentary BMI and waist circumference in favor of considering more expensive, but higher precision methods such as DXA and MRI that allow for the high degree of precision needed to make conclusions about complex phenotypes: data that are needed and currently not available in studies of American Indian communities [15, 46, 47]. Adoption of these methods may require reducing the sample size of studies, but we argue that a smaller number of high-precision datapoints (such as in a cross-sectional study) would yield more novel information than a large number of low-precision datapoints.
Several of the differentially methylated genes associated with adiposity measures within our study are established to be associated with smoking (e.g., AHRR, F2RL3, and RARA) [48, 49]. Additional experimental studies are necessary to understand the directionality of this relationship and the degree to which smoking may interact with physiological processes to influence adiposity phenotype and DNA methylation patterns.
This study is the first to use DNA methylation data obtained using the Illumina MethylationEPIC BeadChip (EPIC) in an adiposity EWAS, and is also the only EWAS of which we are aware that uses percent body fat as a proxy for adiposity in humans. This study broadens the populations across which such comparisons are made: studies to which we compared our results include no individuals of North or South American descent. Previous studies have used data from cohorts made up of individuals of European descent (RS, FHS I, FHS II, GOLDN, EPICOR, KORA), although a few have considered individuals of Ghanian (RODAM), African (ARIC), South Asian (LOLIPOP), and West Asian (Qatari Family Study) ancestry [1, 3, 9-11, 50]. Our findings confirmed numerous CpG sites previously found to be differentially methylated in association with adiposity phenotypes, while we also found new differentially methylated CpG sites and regions not previously identified.
Data availability
Access to Strong Heart Study raw data is subject to approval by participating tribes following the procedures established by the Strong Heart Study in agreement with the tribes. Detailed information is available in the Strong Heart Study website https://strongheartstudy.org/.
Code availability
Code used to analyze data in this paper is available from the senior author and the corresponding author.
Supplementary Material
Acknowledgements
This work was supported by grants for the National Heart, Lung, and Blood Institute (NHLBI) (under contract numbers 75N92019D00027, 75N92019D00028, 75N92019D00029, and 75N92019D00030) and previous grants (R01HL090863, R01HL 109315, R01HL109301, R01HL109284, R01HL109282, and R01HL 109319 and cooperative agreements: U01HL41642, U01HL41652, U01HL41654, U01HL65520, and U01HL65521) and by the National Institutes of Health Sciences (R01ES021367, R01ES025216, P42ES 010349, P30ES009089). Thanks to Dr. Pascale R Leroueil for computational expertise and Ali Thompson for illuminating discussions. All analyses and writing of this manuscript were done on the occupied territory of the Lenape and Wappinger Nations.
Footnotes
Conflict of interest The authors declare that they have no conflict of interest.
Publisher’s note Springer Nature remains neutral with regard to jurisdictional claims in published maps and institutional affiliations.
Supplementary information The online version of this article (https://doi.org/10.1038/s41366-020-0646-z) contains supplementary material, which is available to authorized users.
References
- 1.Wahl S, Drong A, Lehne B, Loh M, Scott WR, Kunze S, et al. Epigenome-wide association study of body mass index, and the adverse outcomes of adiposity. Nature. 2017;541:81. [DOI] [PMC free article] [PubMed] [Google Scholar]
- 2.Ng M, Fleming T, Robinson M, Thomson B, Graetz N, Margono C, et al. Global, regional, and national prevalence of overweight and obesity in children and adults during 1980–2013: a systematic analysis for the Global Burden of Disease Study 2013. Lancet. 2014;384:766–81. [DOI] [PMC free article] [PubMed] [Google Scholar]
- 3.Dhana K, Braun K, Nano J, Voortman R, Joyce M, Uitterlinden A, et al. An epigenome-wide association study (EWAS) of obesity-related traits. Annals Nutr Metab. 2017;71:287–287. [Google Scholar]
- 4.Shai I, Jiang R, Manson JE, Stampler MJ, Willett WC, Colditz GA, et al. Ethnicity, obesity, and risk of type 2 diabetes in women - A 20-year follow-up study. Diabetes Care. 2006;29: 1585–90. [DOI] [PubMed] [Google Scholar]
- 5.Deurenberg-Yap M, Schmidt G, van Staveren WA, Deurenberg P. The paradox of low body mass index and high body fat percentage among Chinese, Malays and Indians in Singapore. Int J Obes. 2000;24:1011–7. [DOI] [PubMed] [Google Scholar]
- 6.Rush EC, Goedecke J, Jennings C, Micklesfield L, Dugas L, Lambert EV, et al. BMI, fat and muscle differences in urban women of five ethnicities from two countries. Int J Obes. 2007;31:1232–9. [DOI] [PubMed] [Google Scholar]
- 7.Muller MJ, Geisler C, Blundell J, Dulloo A, Schutz Y, Krawczak M. The case of GWAS of obesity: does body weight control play by the rules? Int J Obes. 2018;42:1395–405. [DOI] [PubMed] [Google Scholar]
- 8.Bosy-Westphal A, Braun W, Geisler C, Norman K, Muller MJ. Body composition and cardiometabolic health: the need for novel concepts. Eur J Clin Nutr. 2018;72:638–44. [DOI] [PubMed] [Google Scholar]
- 9.Demerath EW, Guan WH, Grove ML, Aslibekyan S, Mendelson M, Zhou YH, et al. Epigenome-wide association study (EWAS) of BMI, BMI change and waist circumference in African American adults identifies multiple replicated loci. Human Mol Gen. 2015;24:4464–79. [DOI] [PMC free article] [PubMed] [Google Scholar]
- 10.Al Muftah WA, Al-Shafai M, Zaghlool SB, Visconti A, Tsai PC, Kumar P, et al. Epigenetic associations of type 2 diabetes and BMI in an Arab population. Clin Epigen. 2016;8:13. [DOI] [PMC free article] [PubMed] [Google Scholar]
- 11.Meeks KAC, Henneman P, Venema A, Burr T, Galbete C, Danquah I, et al. An epigenome-wide association study in whole blood of measures of adiposity among Ghanaians: the RODAM study. Clin Epigen. 2017;9:103. [DOI] [PMC free article] [PubMed] [Google Scholar]
- 12.Schlesinger S, Aleksandrova K, Pischon T, Fedirko V, Jenab M, Trepo E, et al. Abdominal obesity, weight gain during adulthood and risk of liver and biliary tract cancer in a European cohort. Int J Cancer. 2013;132:645–57. [DOI] [PubMed] [Google Scholar]
- 13.Pang YJ, Kartsonaki C, Guo Y, Chen YP, Yang L, Bian Z, et al. Central adiposity in relation to risk of liver cancer in Chinese adults: a prospective study of 0.5 million people. Int J Cancer. 2019;145:1245–53. [DOI] [PMC free article] [PubMed] [Google Scholar]
- 14.Campbell PT, Newton CC, Freedman ND, Koshiol J, Alavanja MC, Freeman LEB, et al. Body mass index, waist circumference, diabetes, and risk of liver cancer for US adults. Cancer Res. 2016;76:6076–83. [DOI] [PMC free article] [PubMed] [Google Scholar]
- 15.Shuster A, Patlas M, Pinthus JH, Mourtzakis M. The clinical importance of visceral adiposity: a critical review of methods for visceral adipose tissue analysis. Br J Radiol. 2012;85:1–10. [DOI] [PMC free article] [PubMed] [Google Scholar]
- 16.Lee ET, Welty TK, Fabsitz R, Cowan LD, Le NA, Oopik AJ, et al. The strong heart study - a study of cardiovascular disease in American Indians: designs and methods. Am J Epidemiol. 1990;132:1141–55. [DOI] [PubMed] [Google Scholar]
- 17.The Strong Heart Study Manual Chapter 5: Clinical Examination. 2012. (Modified May 2, 2003). https://strongheartstudy.org/portals/1288/Assets/documents/manuals/Phase%20I%20Operations%20Manual.pdf?ver=2017-11-15-134631-313.
- 18.Rising R, Swinburn B, Larson K, Ravussin E. Body composition in Pima Indians: validation of bioelectrical resistance. Am J Clin Nutr. 1991;53:594–8. [DOI] [PubMed] [Google Scholar]
- 19.Stolarczyk LM, Heyward VH, Hicks VL, Baumgartner RN. Predictive accuracy of bioelectrical impedance in estimating body composition of Native American women. Am J Clin Nutr. 1994;59:964–70. [DOI] [PubMed] [Google Scholar]
- 20.Fortin JP, Triche TJ, Hansen KD. Preprocessing, normalization and integration of the Illumina HumanMethylationEPIC array with minfi. Bioinformatics. 2017;33:558–60. [DOI] [PMC free article] [PubMed] [Google Scholar]
- 21.Triche TJ, Weisenberger DJ, Van Den Berg D, Laird PW, Siegmund KD. Low-level processing of Illumina Infinium DNA Methylation BeadArrays. Nucleic Acids Res. 2013;41:e90. [DOI] [PMC free article] [PubMed] [Google Scholar]
- 22.Houseman EA, Accomando WP, Koestler DC, Christensen BC, Marsit CJ, Nelson HH, et al. DNA methylation arrays as surrogate measures of cell mixture distribution. Bmc Bioinform. 2012;13:86. [DOI] [PMC free article] [PubMed] [Google Scholar]
- 23.McCartney DL, Walker RM, Morris SW, McIntosh AM, Porteous DJ, Evans KL. Identification of polymorphic and off-target probe binding sites on the Illumina Infinium MethylationEPIC Bead-Chip. Genomics Data. 2016;9:22–24. [DOI] [PMC free article] [PubMed] [Google Scholar]
- 24.Ritchie ME, Phipson B, Wu D, Hu YF, Law CW, Shi W, et al. limma powers differential expression analyses for RNA-sequencing and microarray studies. Nucl Acids Res. 2015;43:e47. [DOI] [PMC free article] [PubMed] [Google Scholar]
- 25.Benjamini Y, Hochberg Y. Controlling the false discovery rate: a practical and powerful approach to multiple testing. J R Stat Soc Ser B-Methodol. 1995;57:289–300. [Google Scholar]
- 26.Demerath NJ, The American Soldier: Volume I, adjustment during army life. By S. A. Stouffer, E. A. Suchman, L. C. DeVinney, S. A. Star, R. M. Williams, Jr. Volume II, Combat and Its Aftermath. By S. A. Stouffer, A. A. Lumsdaine, M. H. Lumsdaine, R. M. Williams, Jr., M. B. Smith, I. L. Janis, S. A. Star, L. S. Cottrell, Jr. Princeton, New Jersey: Princeton University Press, 1949. Vol. I, 599 pp., Vol. II, 675 pp. $7.50 each; $13.50 together. Social Forces. 1949;28:87–90. [Google Scholar]
- 27.Afshin A, Forouzanfar MH, Reitsma MB, Sur P, Estep K, Lee A, et al. Health effects of overweight and obesity in 195 countries over 25 years. N Engl J Med. 2017;377:13–27. [DOI] [PMC free article] [PubMed] [Google Scholar]
- 28.Gonzalez MC, Correia M, Heymsfield SB. A requiem for BMI in the clinical setting. Current Opin Clin Nutr Metab Care. 2017;20:314–21. [DOI] [PubMed] [Google Scholar]
- 29.Gearon E, Tanamas SK, Stevenson C, Loh VHY, Peeters AA, Changes in waist circumference independent of weight: Implications for population level monitoring of obesity. Preventive Med. 2018;111:378–83. [DOI] [PubMed] [Google Scholar]
- 30.Prentice AM, Jebb SA. Beyond body mass index. Obes Rev. 2001;2:141–7. [DOI] [PubMed] [Google Scholar]
- 31.Martí A, Marcos A, Martínez JA. Obesity and immune function relationships. Obes Rev. 2001;2:131–40. [DOI] [PubMed] [Google Scholar]
- 32.O’Rourke RW, Metcalf MD, White AE, Madala A, Winters BR, Maizlin II, et al. Depot-specific differences in inflammatory mediators and a role for NK cells and IFN-gamma in inflammation in human adipose tissue. Int J Obes. 2009;33:978–90. [DOI] [PMC free article] [PubMed] [Google Scholar]
- 33.Lappalainen T, Greally JM. Associating cellular epigenetic models with human phenotypes. Nat Rev Gen. 2017;18:441–51. [DOI] [PubMed] [Google Scholar]
- 34.Moore LD, Le T, Fan G. DNA methylation and its basic function. Neuropsychopharmacology. 2013;38:23–38. [DOI] [PMC free article] [PubMed] [Google Scholar]
- 35.Buchta CM, Boi KS, Miller BJ, Milhem MM, Norian LA. Obesity does not exacerbate the protumorigenic systemic environment in sarcoma subjects. ImmunoHorizons. 2017;1:20. [DOI] [PMC free article] [PubMed] [Google Scholar]
- 36.Joffe L, Dwyer S, Bender JLG, Frazier AL, Ladas EJ. Nutritional status and clinical outcomes in pediatric patients with solid tumors: A systematic review of the literature. Sem Oncol. 2019;46:48–56. [DOI] [PMC free article] [PubMed] [Google Scholar]
- 37.Choromanska B, Mysliwiec P, Hady HR, Dadan J, Mysliwiec H, Bonda T, et al. The implication of adipocyte ATP-binding cassette A1 and G1 transporters in metabolic complications of obesity. J Physiol Pharmacol. 2019;70:143–52. [DOI] [PubMed] [Google Scholar]
- 38.Samaras K, Botelho NK, Chisholm DJ, Lord RV. Subcutaneous and visceral adipose tissue gene expression of serum adipokines that predict type 2 diabetes. Obesity. 2010;18:884–9. [DOI] [PubMed] [Google Scholar]
- 39.Pateyjohns IR, Brinkworth GD, Buckley JD, Noakes M, Clifton PM. Comparison of three bioelectrical impedance methods with DXA in overweight and obese men. Obesity. 2006;14:2064–70. [DOI] [PubMed] [Google Scholar]
- 40.Borga M, West J, Bell JD, Harvey NC, Romu T, Heymsfield SB, et al. Advanced body composition assessment: from body mass index to body composition profiling. J Invest Med. 2018;66:887–95. [DOI] [PMC free article] [PubMed] [Google Scholar]
- 41.Hunger JM, Major B. Weight stigma mediates the association between bmi and self-reported health. Health Psych. 2015; 34:172–5. [DOI] [PMC free article] [PubMed] [Google Scholar]
- 42.Pause C Borderline: the ethics of fat stigma in public health. J Law Med Ethics. 2017;45:510–7. [Google Scholar]
- 43.Hill JH, Solt C, Foster MT. Obesity associated disease risk: the role of inherent differences and location of adipose depots. Hormone Molecular Biol Clin Invest. 2018;33. [DOI] [PubMed] [Google Scholar]
- 44.Black RE, Allen LH, Bhutta ZA, Caulfield LE, de Onis M, Ezzati M, et al. Maternal and child undernutrition 1—maternal and child undernutrition: global and regional exposures and health consequences. Lancet. 2008;371:243–60. [DOI] [PubMed] [Google Scholar]
- 45.Miller SL, Wolfe RR. The danger of weight loss in the elderly. J Nutr Health Aging. 2008;12:487–91. [DOI] [PubMed] [Google Scholar]
- 46.Wells JCK, Fewtrell MS. Measuring body composition. Arch Dis Child. 2006;91:612–7. [DOI] [PMC free article] [PubMed] [Google Scholar]
- 47.Klopfenstein BJ, Kim MS, Krisky CM, Szumowski J, Rooney WD, Purnell JQ. Comparison of 3 T MRI and CT for the measurement of visceral and subcutaneous adipose tissue in humans. Br J Radiol. 2012;85:e826–e830. [DOI] [PMC free article] [PubMed] [Google Scholar]
- 48.Barcelona V, Huang YF, Brown K, Liu JX, Zhao W, Yu M, et al. Novel DNA methylation sites associated with cigarette smoking among African Americans. Epigenetics. 2019;14:383–91. [DOI] [PMC free article] [PubMed] [Google Scholar]
- 49.Fasanelli F, Baglietto L, Ponzi E, Guida F, Campanella G, Johansson M, et al. Hypomethylation of smoking-related genes is associated with future lung cancer in four prospective cohorts. Nat Commun. 2015;6:10192. [DOI] [PMC free article] [PubMed] [Google Scholar]
- 50.Leek JT, Johnson WE, Parker HS, Jaffe AE, Storey JD. The sva package for removing batch effects and other unwanted variation in high-throughput experiments. Bioinformatics. 2012;28:882–3. [DOI] [PMC free article] [PubMed] [Google Scholar]
Associated Data
This section collects any data citations, data availability statements, or supplementary materials included in this article.
Supplementary Materials
Data Availability Statement
Access to Strong Heart Study raw data is subject to approval by participating tribes following the procedures established by the Strong Heart Study in agreement with the tribes. Detailed information is available in the Strong Heart Study website https://strongheartstudy.org/.


