

Abstract
Transcription activation by distal enhancers is essential for cell-fate specification and maintenance of cellular identities. How long-range gene regulation is physically achieved, especially within complex regulatory landscapes of non-binary enhancer-promoter configurations, remains elusive. Recent nanoscopy advances quantitatively linked promoter kinetics and ~100–200 nm-sized clusters of enhancer-associated regulatory factors (RFs) at important developmental genes. Here, we further dissect mechanisms of RF clustering and transcription activation in mouse embryonic stem cells. RF recruitment into clusters involves specific molecular recognition of cognate DNA and chromatin binding sites, suggesting underlying cis-element clustering. Strikingly, imaging tagged genomic loci, with ≤1 kilobase and ≈20 nanometer precision, in live cells, reveals distal enhancer clusters over the extended locus in frequent close proximity to target genes - within RF clustering distances. These high-interaction-frequency enhancer cluster “super-clusters” create nano-environments wherein clustered RFs activate target genes, providing a structural framework for relating genome organization, focal RF accumulation and transcription activation.
INTRODUCTION
Accurate, precise, and robust transcription requires relaying regulatory information from distal enhancers to target genes1,2. Although various physical mechanisms have been proposed (e.g. looping, scanning, linking, oozing)3–5, DNA or chromatin looping has been the major framework for conceptualizing promoter-enhancer communication. The looping model posits direct enhancer-promoter contact through formation of molecular complexes. Several lines of evidence support this view, including correlation between proximity and transcription6–9, as well as gene activation through forced chromatin interactions10–14. However, it is not clear how physically close promoters and enhancers must come for transcription activation. Often enhancers and promoters are separated by distances of several hundred nanometers15,16, inconsistent with direct molecular contacts. At the same time, certain single-cell imaging studies have revealed weak or no correlation between enhancer-promoter distances and transcription activity15,17.
Modern models for enhancer action incorporate our increased understanding of the complexity in the live-cell setting, notably emerged knowledge of the high-order genome organization and of the crowded and compartmentalized intra-nuclear milieu18–20. Topologically associated domains (TADs)21,22 partition the genome in ~100kb-Mb regions that can define the dynamic range of certain enhancers23,24. Key developmental and cell identity genes are controlled by TAD-sized complex regulatory landscapes, containing multiple enhancers and promoters25, and, intriguingly, enhancers within a whole TAD can act as a single coherent regulatory unit26. Cell identity genes are also proposed to be controlled by extended regulatory elements, with clusters of enhancers and high levels of active chromatin marks and co-factors27. In other examples of complex non-binary enhancer-promoter gene regulation, an enhancer can simultaneously activate two promoters linked in cis (on the same chromosome) or in trans (in different chromosomes)28,29, while multiple enhancers in separate chromosomes can also coordinate to activate a single gene30–32. As many structural and biophysical aspects have yet to be characterized in detail, how physically gene regulation is achieved through all these complex non-binary promoter-enhancer configurations is not well understood.
An attractive idea for explaining some of the phenomena emerging in these complex gene regulatory settings postulates the formation of specialized nuclear sub-compartments, or local activating “environments”, with a characteristic composition of regulatory factors (RFs), needed to activate embedded target genes18,33,34. Interestingly, these ideas also incorporate features of alternative classical enhancer-promoter communication models (e.g. scanning, linking and oozing), whereby the mere proximity within the compartment allows enhancer-associated regulatory factors to reach the target promoter over short distances18,35. Some early supportive evidence comes from observations of nuclear clustering of transcription regulatory factors36–38, but such ideas have been mostly speculative; since often clusters cannot be assigned to specific genes and active transcription sites, alternative roles often exerted by other nuclear compartments, such as storage, buffering or recycling, could not be excluded.
More direct evidence linking RF clusters to transcription comes from recent advances that enabled imaging, tracking, and quantifying Pol II and regulatory factors simultaneously with nascent transcription, at specific gene loci in live cells, with down to single-molecule resolution39. Those experiments revealed clusters of Pol II regulatory factors (RFs) at single active loci of pluripotent stem cell identity genes39. These ~100–200 nm-sized clusters, comprised of ~10–20 detected molecular copies of each RF, appear to quantitatively control the amplitude and burst frequency kinetics of the target promoters39. However, although single-gene nanoscopy observations support the notion that certain classes of enhancers operate by locally concentrating the transcription machinery, the mechanisms that create such RF clusters have not been fully elucidated. Moreover, the spatiotemporal relationships between RF clusters, multiple distal enhancers and co-regulated or coordinated genes have not been studied in detail. Thus, the relevance of specialized nuclear compartments to complex non-binary enhancer-promoter configurations remains to be directly established.
Depending on the types of molecular interactions responsible for recruiting and locally concentrating RFs, two distinct mechanisms for clustering can be envisioned. In one end of the spectrum, clustering is dominated by specific molecular recognition interactions. In this scenario, multiple cognate DNA and chromatin binding sites serve as a structural scaffold for recruiting multiple TFs and co-factors. Clustering of cognate sites could reflect closely-spaced sites along the DNA in 1D40,41, or proximity of multiple distant enhancers, in 3D42,43, or both. Moreover, the detailed density and spatial arrangement of specific sites could also determine whether the retention of individual factors within the cluster is dominated by their affinity for the targets or by local trapping due to multiple re-binding events. In the other end of the spectrum, models postulate formation of transcription compartments via processes akin to liquid-liquid phase separation44,45, as also proposed for other compartmentalized biochemical processes inside cells. Evidence for this second class of models comes from in vitro experiments, in vivo experiments with artificial droplet-forming systems, as well as observations of clustered patterns of endogenous proteins in cells44,45. Prevalence of intrinsically disordered regions (IDRs) on Pol II RFs, and weak and multivalent IDR-IDR interactions are proposed to be the driving force forming these novel macromolecular assemblies. In this scenario, IDR-IDR interactions facilitate recruitment of additional molecules and build-up of the cluster on top of any specifically bound molecules that seed formation or facilitate tethering of the cluster to specific genomic loci. Which of these distinct models applies to the previously observed RF clusters at active pluripotency gene loci in live mESCs has not been directly tested.
Here we investigate the mechanisms of RF clustering and its relationship to genome organization and transcription in more detail. We focus on Sox2 and Brd4, two important regulatory factors in mESCs, investigating Sox2 and Brd4 clustering throughout the nucleus as well as at specific active gene loci. We systematically characterize the effects of mutations that abolish specific molecular recognition of target DNA and chromatin sites or IDR-IDR interactions. Our results indicate that Sox2 and Brd4 recruitment into clusters depends on specific recognition of cognate DNA and chromatin sites rather than IDR-IDR interactions, suggesting spatial clustering of cis-elements. To understand the underlying genome topologies, we further develop genomic imaging methods, to probe the juxtaposition of distal genomic elements and target genes with kilobase and nanometer precision in live cells. Intriguingly, we discover frequent proximity of multiple distant enhancer clusters within ~100–200nm of the target gene; these arrangements emerge as the underlying genome topologies behind the observed RF clustering. Finally, to probe how RF clusters relate to gene coordination and co-regulation, we explore the relationships between clustered RFs and transcription of two linked promoters on the sister chromatids, after DNA duplication. Our results reveal coordinated transcription accompanied by an apparently shared pool of clustered Brd4, utilized by the two sister-chromatids in this specific configuration of two linked promoters.
RESULTS
Brd4 and Sox2 recruitment into nuclear clusters depends on specific DNA and chromatin binding
We first focus on the molecular interactions that organize two key RFs in mouse Embryonic Stem Cells (mESCs), the transcription factor Sox2 and the chromatin reader Brd4. Sox2 contains a structured N-terminal High-Mobility Group (HMG) DNA binding domain46 and an unstructured C-terminal Trans-activation domain (TAD)47. Brd4 contains a double bromodomain module involved in acetyl-lysine recognition48, as well as an extended C-terminal Serine-rich IDR44 of unknown function. Both full-length Sox2 and the Brd4 IDR are capable of droplet formation in vitro44,45, while the Brd4 IDR also forms clusters when over-expressed and artificially multimerized in live cells44,49.
To visualize the nuclear organization of the endogenous Sox2 and Brd4, we engineer mESCs with homozygous SNAP-tag knock-in and use the bright, photostable, and low-background Silicon-substituted Rhodamine (SiR) dye. Using a point-scanning confocal microscope specifically configured for increased sensitivity in the far-red spectrum (Methods), we observe numerous SNAP-Sox2 and SNAP-Brd4 clusters throughout the nucleus (Figure 1a, 1e). What are the molecular interactions holding together these macro-molecular assemblies? The two proposed clustering mechanisms, binding to a scaffold of cognate DNA and chromatin sites or self-assembly of an IDR-IDR interaction network, have distinct predictions for how molecules are recruited into clusters. The interactions contributing to recruitment can be tested by quantifying the ability of various Sox2 and Brd4 mutants to incorporate into the WT protein clusters. Specifically, if clustering reflects mostly molecules bound to a scaffold of DNA and chromatin sites, we expect that IDR-IDR interactions will not be sufficient for recruiting mutants that cannot engage in specific binding. Alternatively, if the cluster mass is built-up chiefly through IDR-IDR interaction networks - perhaps on top of a small sub-population of DNA and chromatin-bound molecules for tethering to specific genomic loci (e.g. at cis-elements), or even completely independent of specific binding (e.g. for more general roles in the nucleus, such as storage, buffering or recycling), the IDRs would be almost entirely necessary, as well as generally sufficient, for efficient incorporation into clusters.
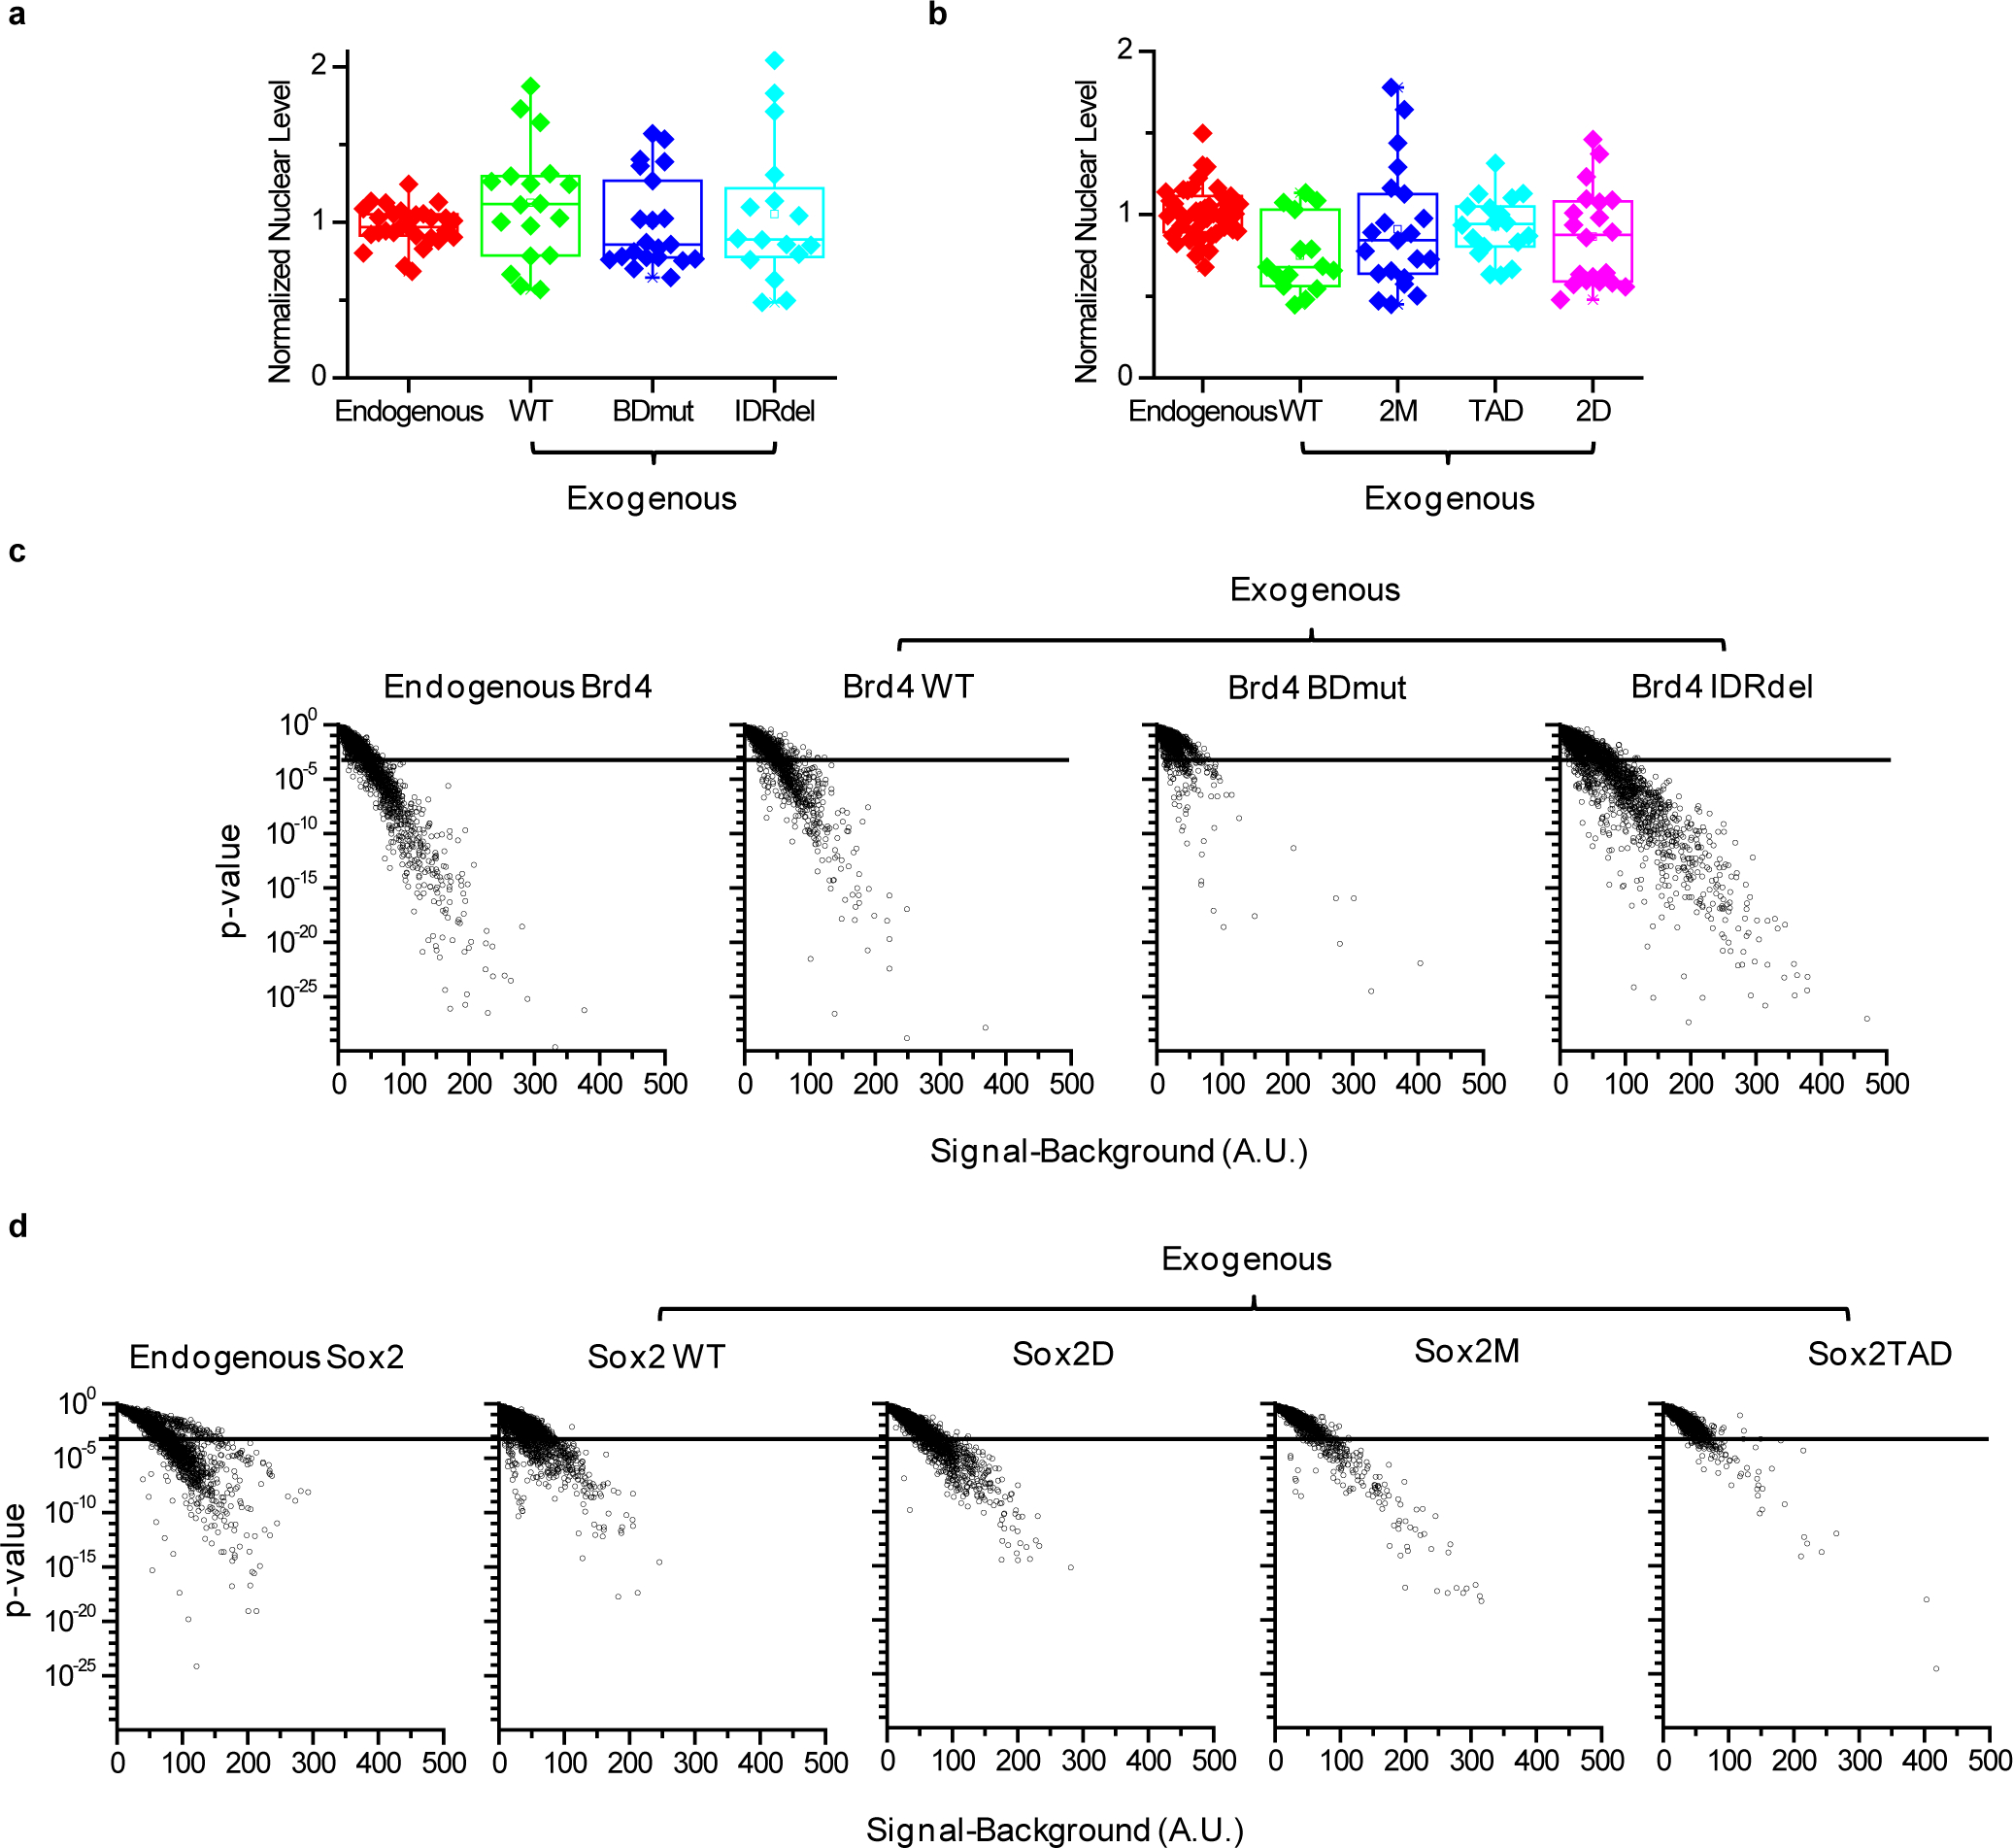
Figure 1. Specific interactions with acetylated targets and Sox DNA motifs are needed for Brd4 and Sox2 clustering, respectively, while IDRs are dispensable.
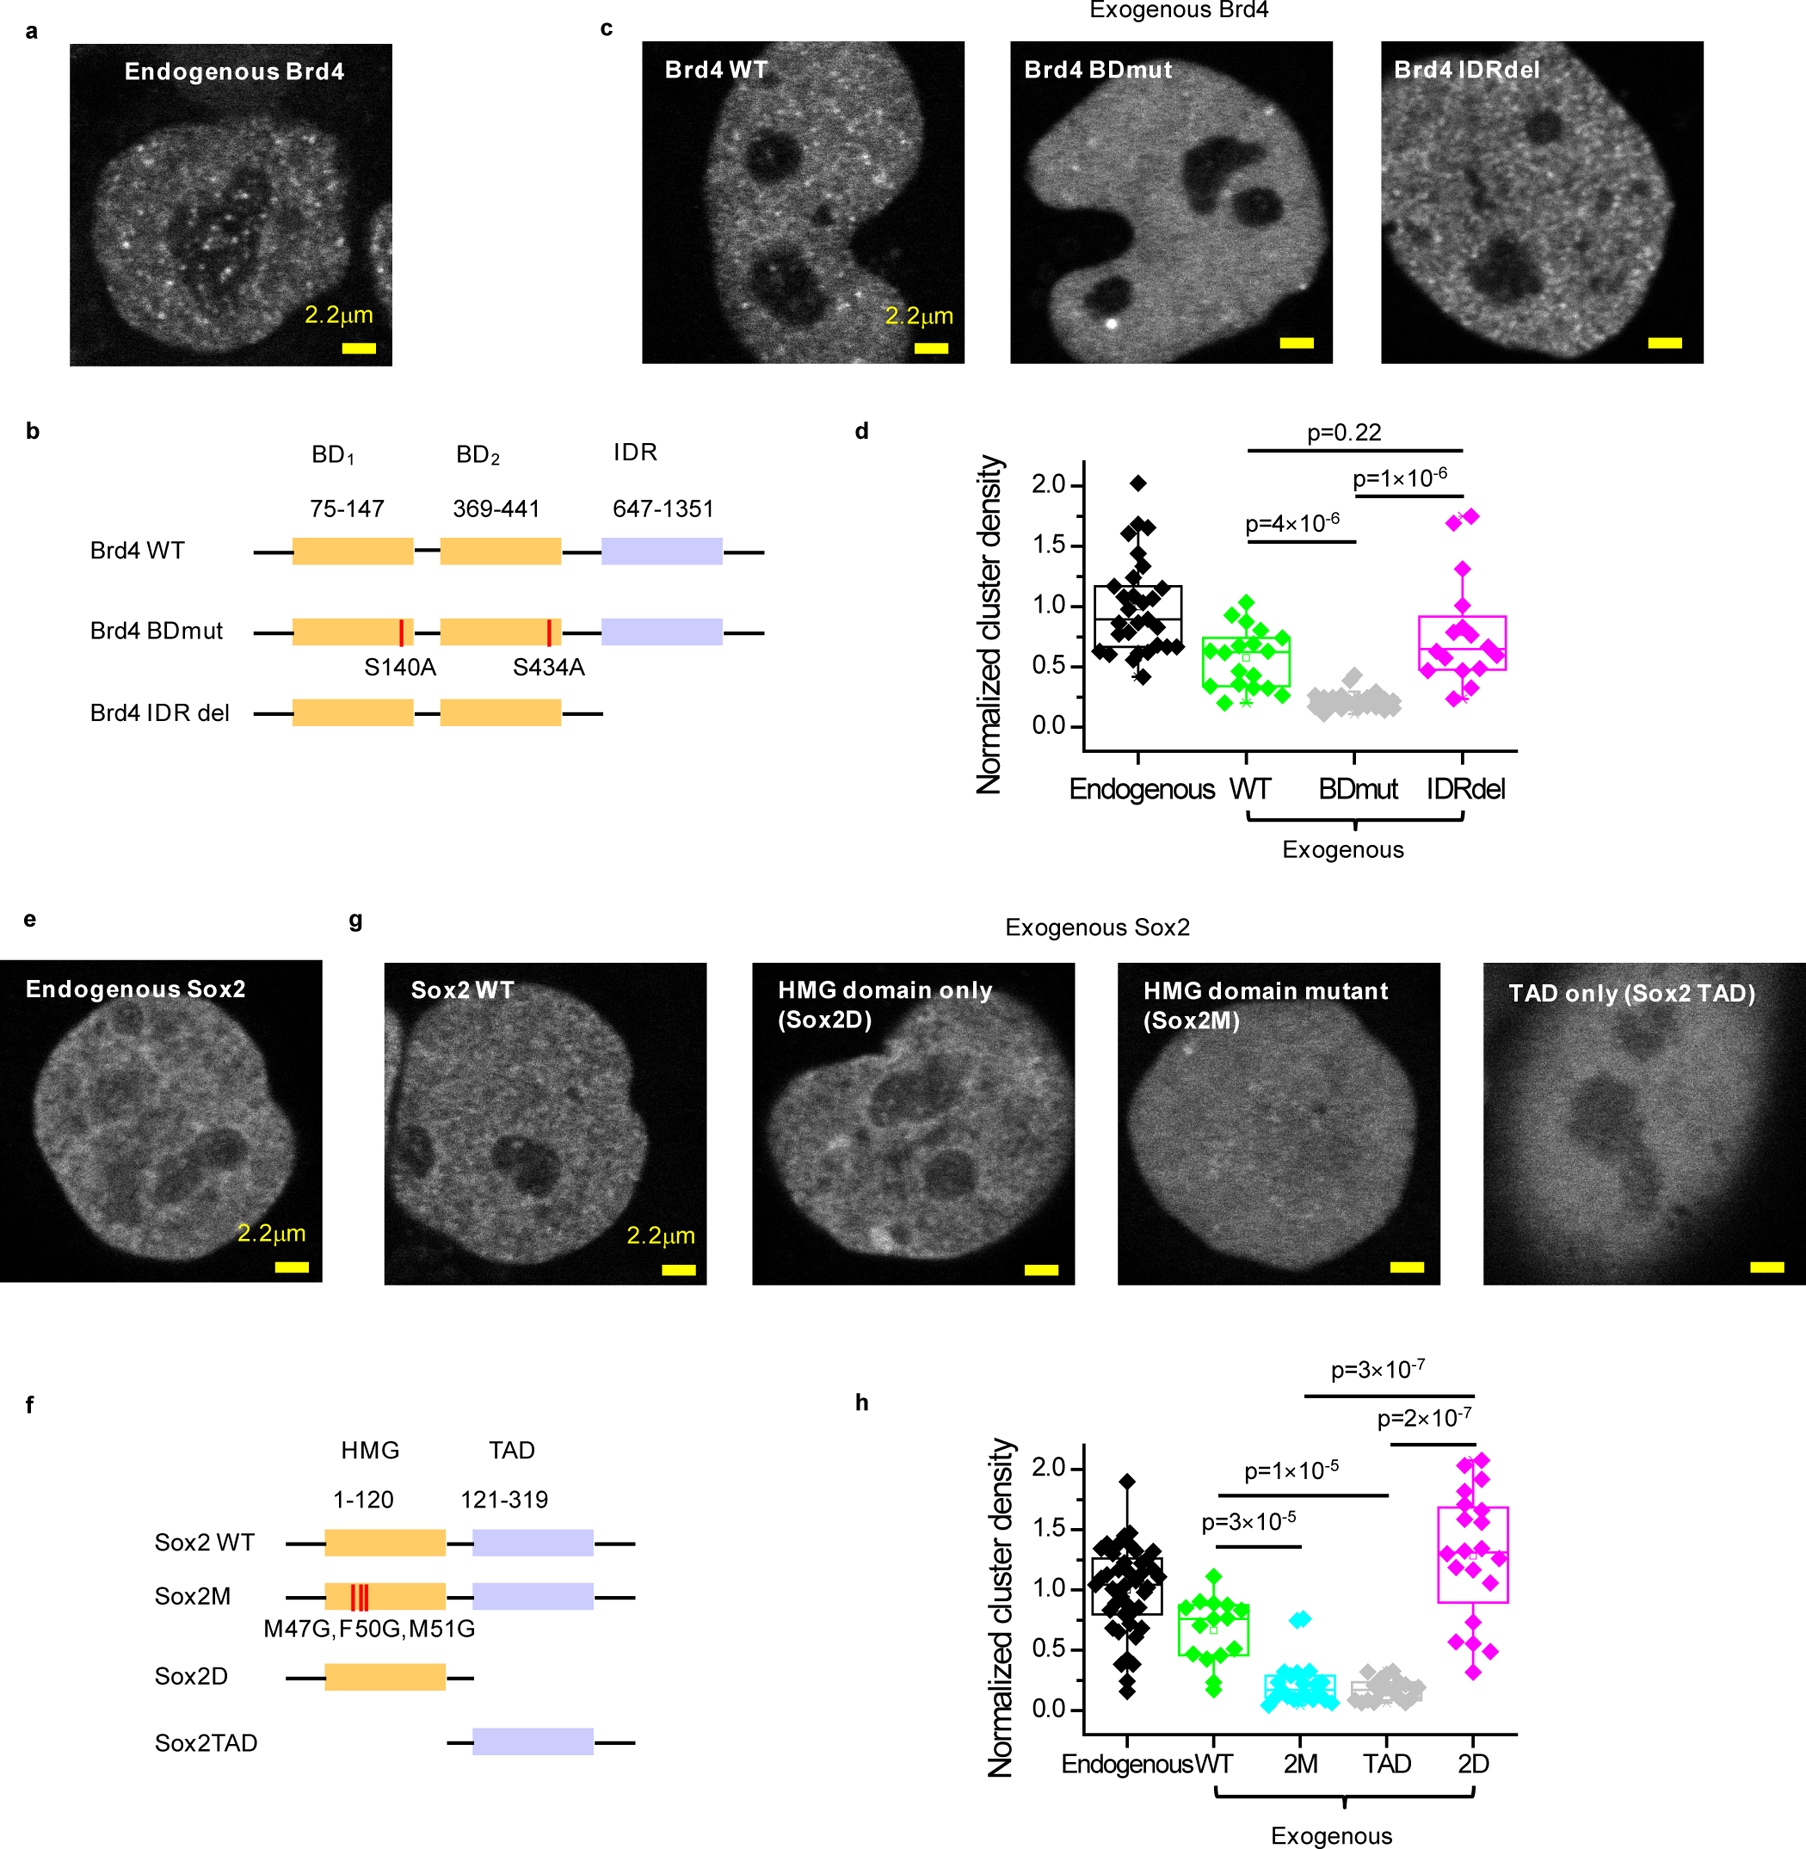
(a) Representative clustering pattern of endogenous Brd4 in live mESC nuclei. Endogenous Brd4 is visualized by bi-allelic knock-in of an N-terminal SNAP-tag and labeling with SiR-BG dye. (b) Domain organization of Brd4 and schematic of double bromodomain and IDR deletion mutants. Two serine residues (S140, S434) are mutated to alanine to generate the double bromodomain mutant, Brd4 BDmut. The entire IDR domain (647–1351) was deleted to generate the IDR deletion mutant, Brd4 IDRdel. (c) Representative images of nuclear distribution of exogenous SNAP-tag WT, BDmut and IDRdel Brd4 labeled with SiR-BG dye in live mESCs. (d) Quantification of Brd4 clustering in mESCs. For ectopically expressed WT, BDmut and IDRdel Brd4, cells with close-to-endogenous expression level are selected for analysis (Extended Data Figure 1a). Each data point corresponds to the nuclear cluster density of a single cell, normalized to the mean nuclear cluster density of endogenous Brd4. Data points are from 2 independent experiments with total n= 29, 18, 21, and 16 cells for endogenous, WT, Bdmut, and IDRdel, respectively. p-values are calculated based on a Wilcoxon rank-sum test. (e) Representative clustering pattern of endogenous Sox2 in live mESC nuclei. Endogenous Sox2 is labeled with an N-terminal SNAP-tag bi-allelic knock-in and visualized with SiR-BG dye. (f) Domain organization of Sox2 and schematic of HMG point and deletion mutants as well as TAD deletion mutant. Three residues in the HMG domain responsible for DNA binding (M47, F50 and M51) are mutated to glycine to generate Sox2M mutant. The entire TAD or HMG domain is deleted to generate Sox2D or Sox2 TAD mutants, respectively. (g) Representative images of nuclear distribution of exogenous SNAP-tag WT, 2M, TAD, and 2D Sox2 labeled with SiR-BG dye in live mESCs. (h) Quantification of Sox2 clustering in mESCs. For ectopically expressed WT, 2M, TAD, and 2D Sox2, cells with close-to-endogenous expression level are selected for analysis (Extended Data Figure 1b). Each data point corresponds to the nuclear cluster density of a single cell, normalized based on the average nuclear density for endogenous Sox2. Data points are from 2 independent experiments with total n= 43, 15, 21, 18, and 20 cells for endogenous, WT, 2M, TAD, and 2D, respectively. p-values are calculated based on a Wilcoxon rank-sum test. In panels (d, h), nuclear cluster density quantification is based on a single-cluster detection significance of p<0.001 (Extended Data Fig. 1c–d). Box-plots in (d, h): boxes indicate inter-quartile range (IQR: 25%75% intervals) and the median line, whiskers indicate 1.5× the IQR; ‘×’ symbols indicate 1% and 99% percentiles; square symbols indicate the mean. Data for graphs in (d, h) are available as source data online.
To probe the molecular interactions that underlie recruitment into clusters, we thus engineer and express various Sox2 and Brd4 mutants with compromised abilities to engage in specific DNA and chromatin recognition or IDR-IDR interactions (Figure 1b, 1f). To explore a natural range of nuclear concentrations and minimize possible effects due to over-expression, we: (1) transiently express the exogenous proteins; (2) fine-tune expression conditions; (3) select individual cells that express exogenous proteins to within ≈0.5–2× of the mean endogenous level (Extended Data Fig. 1a, 1b). Interestingly, we discover that incorporation of Sox2 and Brd4 into clusters strictly depends on specific Sox DNA-binding motif and acetyl-lysine recognition, respectively. Although WT Sox2 and Brd4 as well as IDR deletion Sox2 and Brd4 mutants readily incorporate into clusters, Sox2 with deleted or mutated HMG domain and Brd4 with mutated bromodomains do not (Figure 1c, d, g, h; Extended Data Fig. 1c–d). These results suggest that, unlike the requirement of IDRs for droplet formation in vitro, IDR-IDR interactions are not required for recruitment into the clusters observed in live cells. Our results are more consistent with a physical model whereby clustering of Sox2 and Brd4 throughout mESC nuclei mostly reflects multiple molecules that simultaneously occupy closely-spaced specific binding sites on DNA and chromatin.
Brd4 and Sox2 recruitment at active gene loci depends on specific DNA and chromatin binding
We next investigate the mechanism of Sox2 and Brd4 clustering at specific, transcriptionally active genomic loci. Previously, we had discovered and characterized Pol II and RF clusters at specific loci using single-gene and single-molecule live-cell nanoscopy methods39. We had combined target-locking nanoscopy, a technique that can count single molecules detection sensitivity within the vicinity of a target location (e.g. the transcription site), and point-scanning nanoscopy, to extract spatial information over a more extended dynamic range. With this approach, we had discovered that ~10–20 endogenous Sox2 and Brd4 molecules cluster within an average distance of about 200 nm of the Pou5f1 and Nanog transcription sites39. We extend those observations to Sox2, visualizing the Sox2 nascent RNA using the 24×MS2 system, and Pol II, Sox2, Brd4, and Mediator through homozygous SNAP-tagging of the endogenous genes. We observe ~15 Pol II, ~30 Sox2, ~20 Brd4, and ~10 Mediator molecules clustered at the Sox2 locus, within 100–200 nm from the transcription site (Extended Data Fig. 2a–c). Taken together with our previous observations of RF clustering at Pou5f1 and Nanog39, these results suggest that clustering of ~10–30 RF molecules at single active loci, to within ~100–200nm from the transcription site, might be a general feature of pluripotency genes in mESCs.
To understand the molecular interactions that create RF clusters at specific gene loci, we analyze WT vs. mutant Sox2 and Brd4 at both Pou5f1 and Sox2. To better probe the quantitative behavior of the various constructs, we explore a wide dynamic range of exogenous protein expression levels, spanning from below to significantly above the endogenous Brd4 and Sox2 levels. We visualize the formation of Sox2 and Brd4 clusters and their spatial relationships to the transcription site by point-scanning, while, using a cluster-size calibration from target-locking, we also quantify the number of molecules in each cluster (Methods). Our single-gene imaging experiments recapitulate our results from imaging clusters throughout the nucleus: clustering of Sox2 and Brd4 at the single gene locus also depends on specific Sox DNA-binding motif and acetyl-lysine recognition, with little contribution from IDR-IDR interactions (Figure 2a–d, Extended Data Fig. 2d–e). Quantification of Brd4 and Sox2 clustering shows that IDR deletion Brd4 and Sox2 mutants incorporate into clusters at the Pou5f1 locus with similar efficiencies as the respective WT proteins. Contrary, the HMG domain point mutant Sox2 incorporates into clusters with significantly reduced efficiency, while the HMG domain deletion mutant Sox2 and the double bromodomain mutant Brd4 barely incorporate into clusters, even at up to 10–20-fold over-expression compared to the endogenous proteins (Figure 2a–d). Similar observations also apply for Brd4 clusters at the Sox2 locus (Extended Data Fig. 2d–e). Thus Sox2 and Brd4 clustering at the single-gene level likely does not reflect IDR-dependent recruitment, but rather binding of multiple molecules to multiple specific binding sites that span a ~100–200 nm-sized volume within the vicinity of the transcription site.
Figure 2. Specific interactions with acetylated targets and Sox DNA motifs are needed for Brd4 and Sox2 clustering, respectively, at the Pou5f1 locus, while IDRs are dispensable.
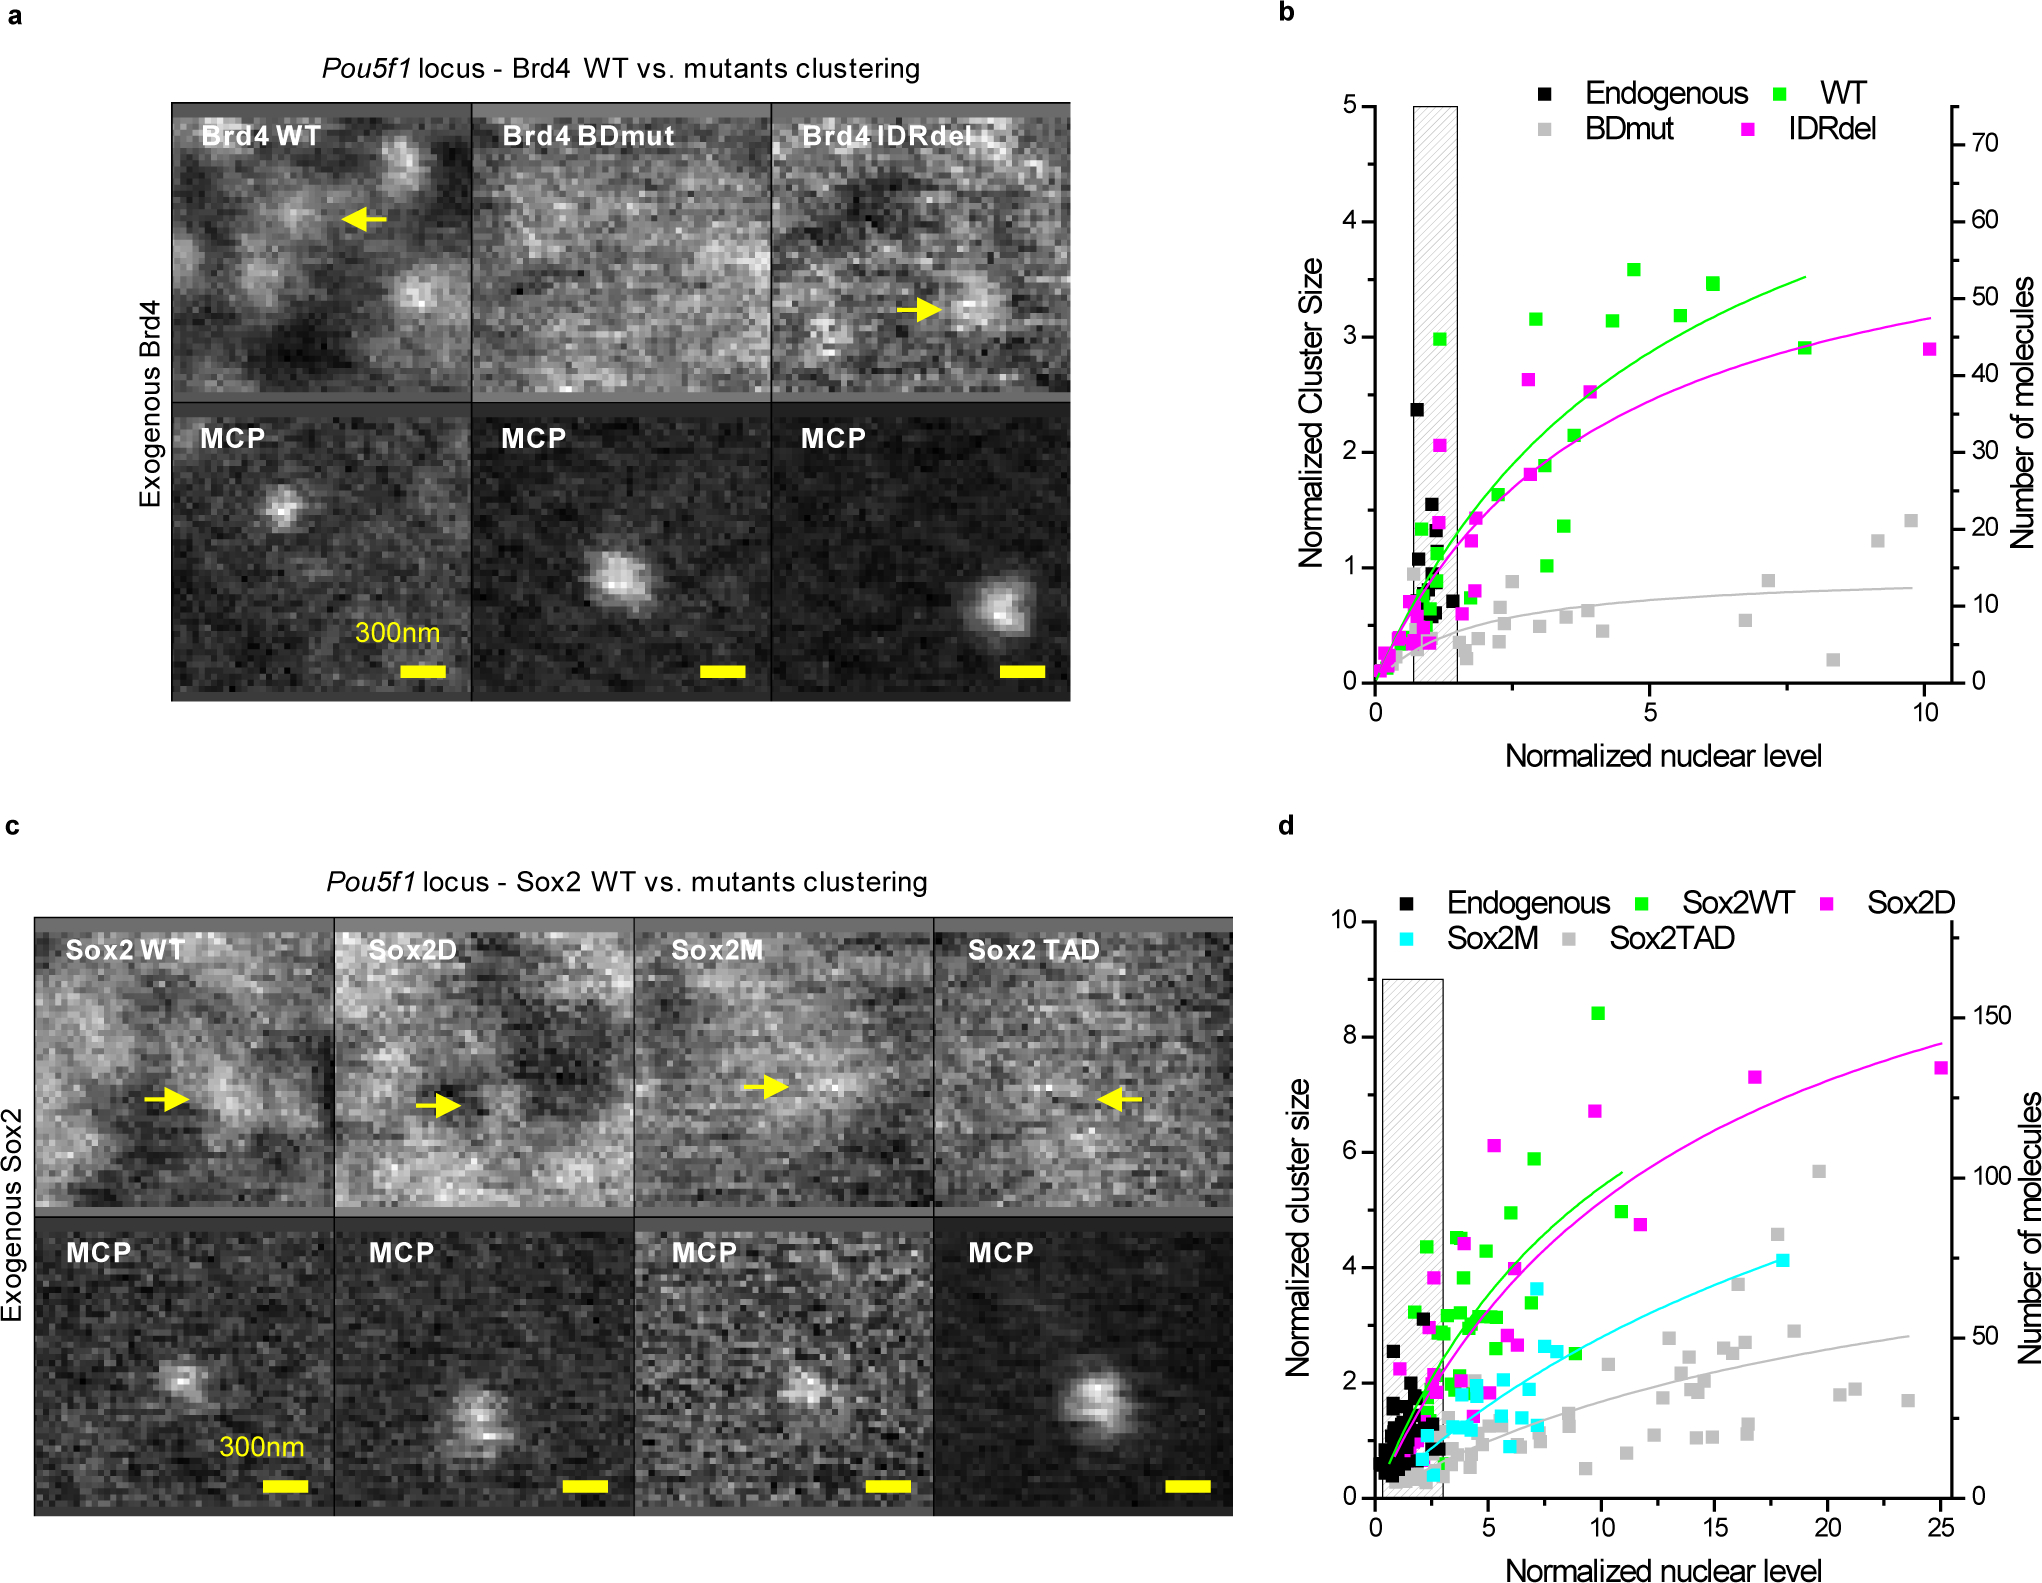
(a and b) Organization of SNAP-Brd4 at the Pou5f1 locus. Pou5f1 nascent RNA was imaged by MCP-mNeonGreen binding to 24×MS2 inserted in the 3’UTR. (a) Representative live-cell images, revealing co-localized SNAP-tagged Brd4 foci with MCP-mNeonGreen-tagged nascent RNA, for WT and IDRdel, but not for BDmut Brd4. Yellow arrows indicate colocalized Brd4 clusters. Expression level of exogenous Brd4 in these pictures is close to endogenous Brd4. (b) Quantification of Brd4 clustering at the Pou5f1 locus. Each data point corresponds to a single time-point measurement in a single cell (n=14, 24, 24, and 23 total cells from 2 independent experiments, for endogenous, WT, BDmut, and IDRdel Brd4, respectively). The left y-axis shows the size of individual clusters, normalized to the average cluster size of endogenous Brd4 at the Pou5f1 locus (~15 molecules). The right y-axis shows the absolute number of Brd4 molecules per cluster. The x-axis shows the nuclear level, estimated from the fitted local background level in the Pou5f1 ROI, normalized to the average nuclear level of endogenous Brd4. (c and d) Organization of SNAP-Sox2 at the Pou5f1 locus. (c) Live-cell imaging reveals co-localized SNAP-tagged Sox2 foci with MCP-mNeonGreen-tagged nascent RNA, for WT Sox2 and for TAD deletion (Sox2D) and HMG point (Sox2M) mutants, but not for HMG deletion (Sox2 TAD) mutant Sox2. Yellow arrows indicate colocalized Sox2 clusters. Expression level of exogenous Sox2 in these pictures is close to endogenous Sox2. (d) Quantification of Sox2 clustering at the Pou5f1 locus. Each data point corresponds to a single time-point measurement in a single cell (n=51, 39, 20, 56, and 29 total cells from 2, 3, 1, 3, and 3 independent experiments, for endogenous, WT, 2M, TAD, and 2D Sox2, respectively). The left y-axis shows the size of individual clusters, normalized to the average cluster size of endogenous Sox2 at the Pou5f1 locus (~18 molecules). The right y-axis shows the absolute number of Sox2 molecules per cluster. The x-axis shows the nuclear level, estimated from the fitted local background level in the Pou5f1 ROI, normalized to the average nuclear level of endogenous Sox2. (b, d) Solid lines: apparent binding curves by fitting to the function y = Ax/(x + K). Grey bar: endogenous Brd4 and Sox2 expression levels. Data for graphs in (b, d) are available as source data online.
The ability to quantify the number of clustered molecules while tuning the expression level in single cells over a range of concentrations, up to ≥10× above the mean endogenous nuclear concentration, provides a rough estimate for the number of potential accessible binding sites. Interestingly, the sizes of Sox2 and Brd4 clusters at the Pou5f1 locus continue to increase with increasing levels of ectopically expressed proteins, accumulating at saturation up to ~7-fold and ~3–4-fold more Sox2 and Brd4 molecules than at endogenous concentrations (Figure 2b, d). The presence of ~15–20 endogenous Sox2 molecules at the Pou5f1 locus is consistent with high occupancy of predicted Sox2 binding sites in enhancer clusters that span ~5 kb upstream of the Pou5f1 transcription start site. However, given the density of Sox motifs, accumulation of >100 specifically-bound Sox2 molecules is unlikely to be accommodated just within the immediate upstream genomic region. Thus, we hypothesize that additional enhancer clusters with Sox2 binding sites, spread over a more extended genomic region, might participate in scaffolding the observed RF clusters.
Live-cell imaging of tagged genomic loci with ≤1 kilobase resolution
Testing whether focal RF accumulation is associated with clustering of distal enhancers requires measuring the physical distances between the transcription site and distal genomic loci. Such measurements should ideally be performed in live cells, free of potential artifacts due to chemical fixation and denaturation that might perturb nanometer-scale organizations, as in e.g. in-situ-hybridization assays. We reason that programmable DNA binding probes, coupled with the high sensitivity of our imaging setup – able to detect and localize with nanometer precision clusters of down to ~4–5 endogenous Pol II and RF molecules at the transcription site39 – should enable us to probe genomic organization with high resolution in live cells. To visualize the spatial relationships between distal genomic regions and the transcription site in live cells, we further develop a method based on fluorescent, nucleolytically-deactivated Cas9 proteins (dCas9) and chimeric arrays of guide RNAs (gRNAs) (Figure 3a)50. We successfully tag and image specific genomic locations with dCas9-Halo programmed with down to 12 unique gRNAs, spanning a region of <1kb (Figure 3b). Notably, the high detection Signal-to-Noise Ratio (SNR) (Figure 3c) enables 2-color nanometer distance measurements between DNA-bound dCas9-Halo-JF646 molecules and the Pou5f1 transcription site, using MCP-mNeonGreen to tag the nascent RNA (Figure 3d, e). These results highlight how our approach can image tagged genomic loci in live cells with high resolution and sensitivity.
Figure 3. High detection sensitivity enables imaging of tagged genomic lociand measuring genomic interactions with nanometer precision in live cells.
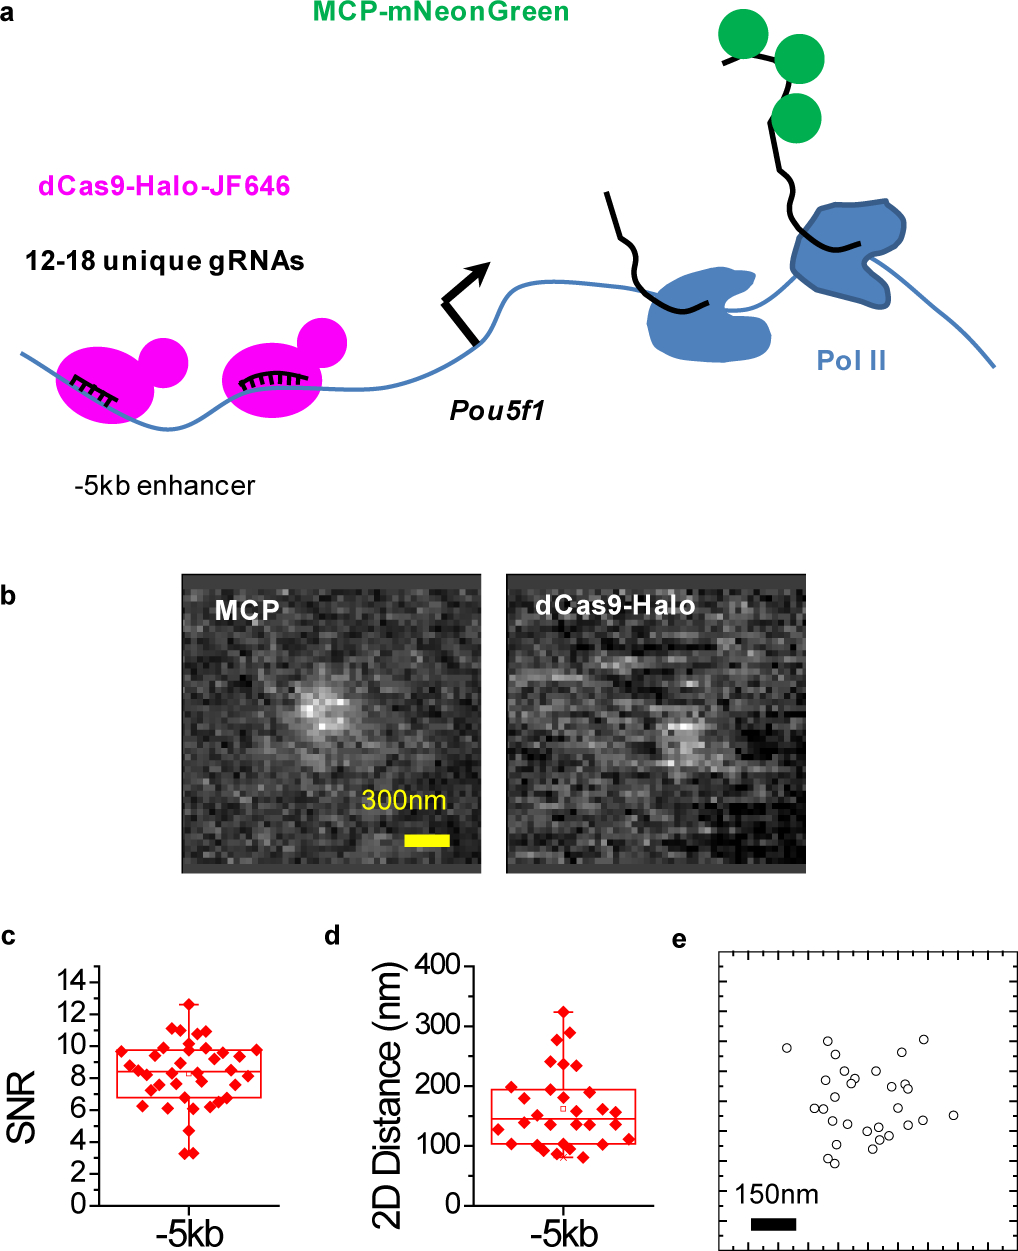
(a) Schematic of the dCas9-Halo and chimeric gRNA array imaging approach. (b) Representative live-cell images showing colocalization between dCas9-Halo-JF646 tagging the −5 kb proximal Pou5f1 enhancer region and MCP-mNeonGreen tagging the nascent Pou5f1 RNA with 24×MS2 at the 3’UTR. (c) Detection of Signal-to-Noise Ratio (SNR) for the dCas9-Halo-JF646-tagged −5kb Pou5f1 enhancer in individual cells. SNR=8.3±2 (mean±S.D., n=38 cells from 2 independent experiments) (d and e) 2D distance measurements and xy scatter plot of relative positions between dCas9 and MCP for the proximal −5kb Pou5f1 enhancer (n=30 cells from 2 independent experiments). Box-plots in (c, d): boxes indicate inter-quartile range (IQR: 25%75% intervals) and the median line, whiskers indicate 1.5× the IQR; ‘×’ symbols indicate 1% and 99% percentiles; square symbols indicate the mean. Data for graphs in (c, d, e) are available as source data online.
Imaging genomic interactions with ≈20 nanometer precision reveals distal enhancers close to target genes
The extended Pou5f1 locus contains putative enhancer elements ~20 kb upstream and ~40 kb downstream, in addition to enhancers immediately upstream (Figure 4a). To probe the spatial relations between these various cis-elements and the target gene, we separately tag and image 9 genomic regions, spanning 80 kb upstream to 180 kb downstream of Pou5f1. We use 3 arrays of up to 6 gRNAs, for a total of up to 18 gRNAs per region. For each region we measure the distance between the dCas9-tagged genomic locus and the MCP-tagged transcription site. The measured distances agree to ≈20 nm r.m.s. between replicate experiments, illustrating the precision achievable by our improved dCas9 imaging method (Extended Data Fig. 3a–b). Intriguingly, our measurements reveal that in addition to the immediate upstream enhancers, the −20 kb and +40 kb putative enhancers within the extended Pou5f1 locus are located on average within the distances of the observed RF clustering (<200 nm) (Figure 4b). Each individual distal enhancer cluster is observed in proximity to the transcription site in 60% to >80% of the measurements (Figure 4c). These results indicate that distal enhancers from the extended genomic locus are frequently brought to within ~100–200 nm spatial proximity of the Pou5f1 transcription site.
Figure 4. Imaging genomic interactions in the extended Pou5f1 locus reveals frequent proximity of distal enhancer clusters and the target gene.
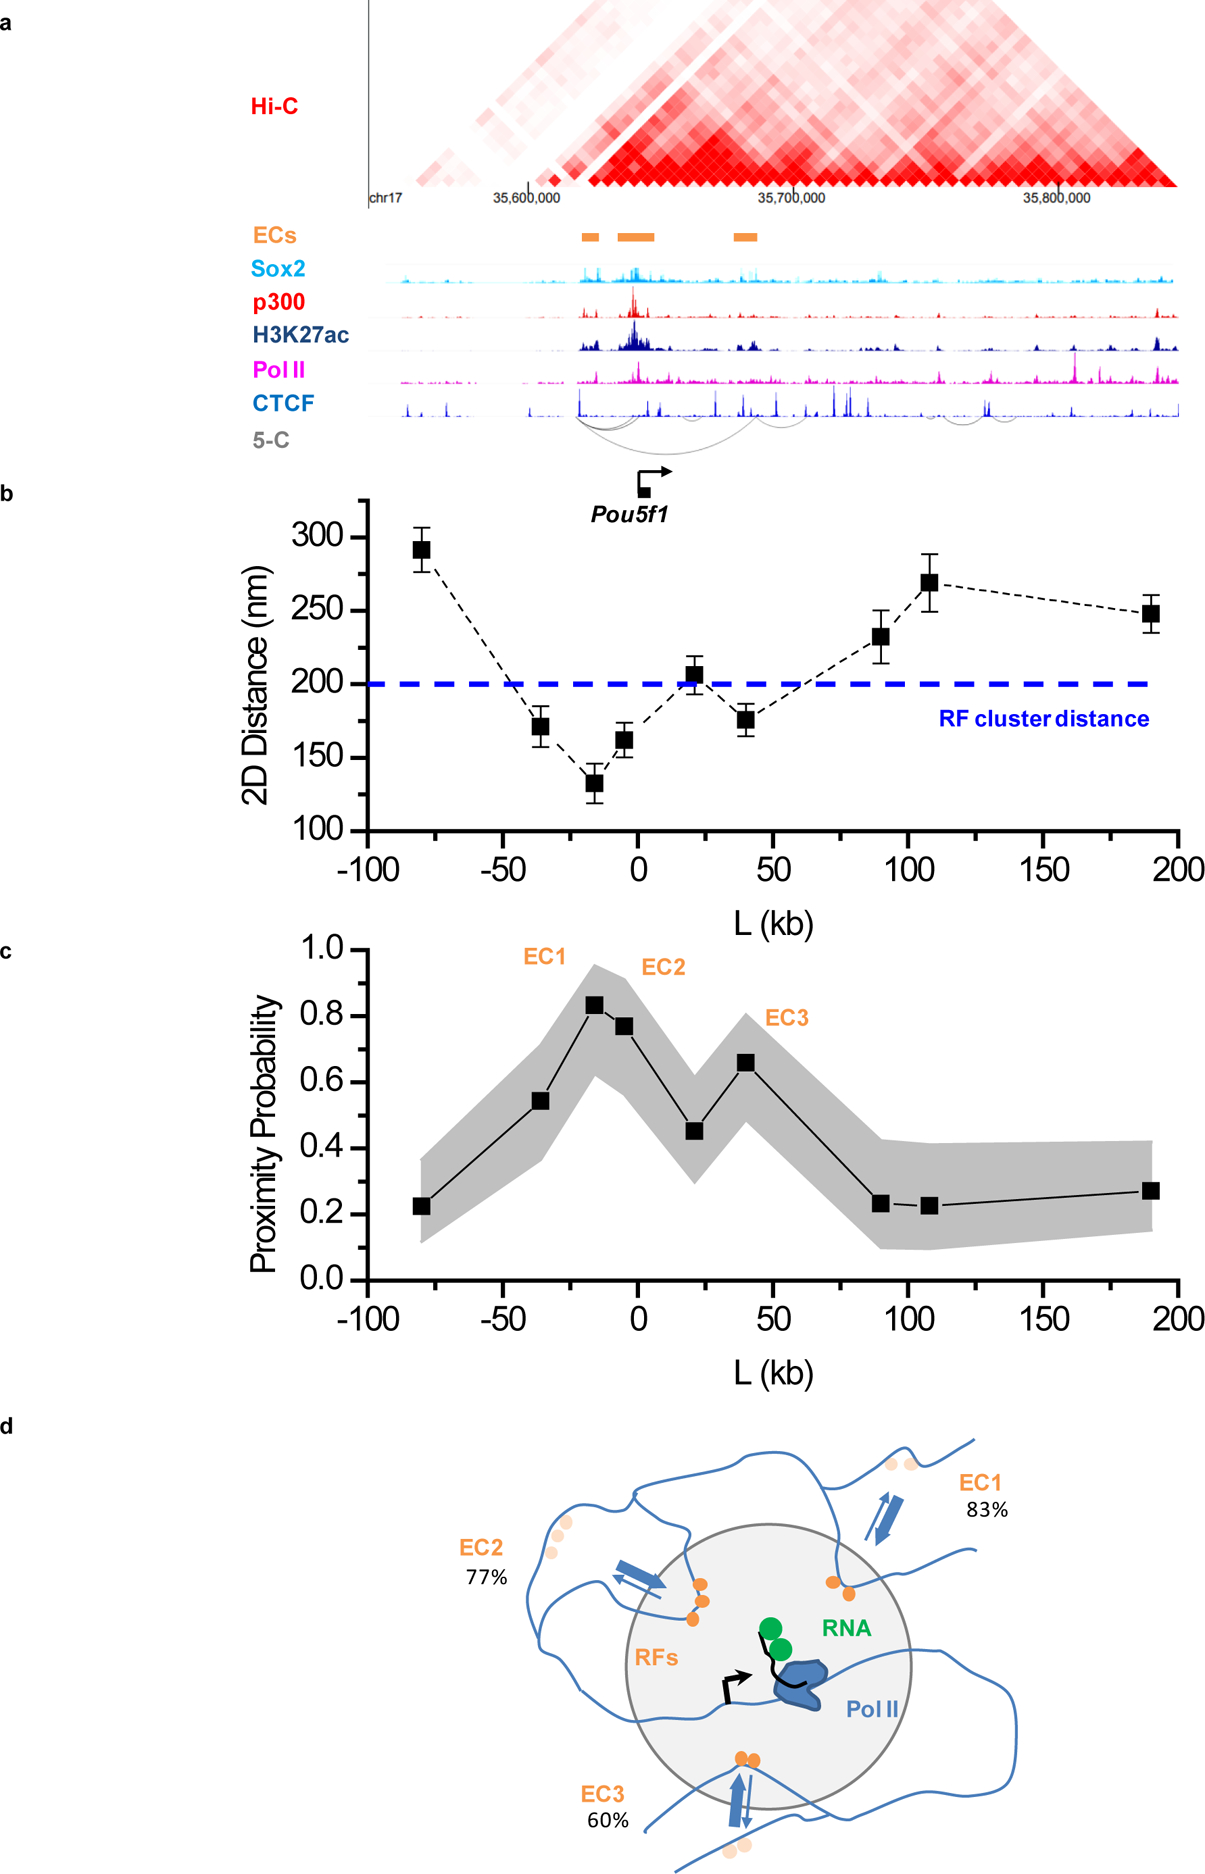
(a) Organization of the extended Pou5f1 locus from proximity ligation (Hi-C, 5-C; accession numbers GSM2533818–21, GSM883649) and ChIP-Seq assays. ECs: enhancer clusters, characterized by presence of Sox2, p300 and H3K27ac ChIP signals. Accession numbers of ChIP-seq datasets used: GSM1910642, ENCFF001LJC, ENCFF001LJI, ENCFF001LIR, and ENCFF001KDN for Sox2, p300, Pol II, Ctcf, and H3K27ac, respectively. (b,c) Average distances (mean ± S.E.M.) (b) and proximity probabilities (c) between the Pou5f1 transcription site (visualized with the 3’UTR MS2-tagged nascent RNA) and 9 regions between −100 kb and +200 kb from Pou5f1. Gray area in (c): 95% binomial distribution confidence intervals. Pooled data from 2 independent experiments with total n= 49, 46, 39, 30, 46, 38, 34, 33, and 50 individual transcription sites for the −80kb, −36kb, −16kb, −5kb, +21kb, +40kb, +90kb, +108kb, and +190kb genomic regions respectively. Dashed line in (b) indicates the 200 nm cutoff, corresponding roughly to the distance between RF clusters and the Pou5f1 transcription site. The 200nm distance cutoff is also used for the proximity probabilities shown in (c). (d) Cartoon of the Pou5f1locus, highlighting frequent proximity of distal ECs to the Pou5f1 transcription site. Data for graphs in (b, c) are available as source data online.
We extend our observations to another gene, Sox2. Sox2 is embedded in a ~2 Mb gene desert, with proximal enhancers within ~10 kb of the gene and enhancer clusters ~90–110 kb downstream51,52 (Extended Data Fig. 4a). We tag and visualize 5 loci from 20 kb to 300 kb downstream of Sox2. As in Pou5f1, we observe that the ~90–110 kb Sox2 distal enhancer clusters are frequently within the RF clustering distance around the transcription site (<180 nm) (Extended Data Fig. 4b–c). Taken together, our results for Pou5f1 and Sox2 indicate that transcription activity relates to frequent proximity of distal enhancer clusters, within ~100–200 nm of the corresponding target genes. These results also suggest that such multiple clustered distal enhancers might serve as scaffolds for the observed RF clustering at active mESC gene loci (Figure 4d, Extended Data Fig. 4d).
Transcription coordination by clustered RFs
We next investigate the relation between RF clustering and gene co-regulation and coordination. The observation of enhancers clustering within 100–200nm from target genes, together with previous results showing that the number of RF molecules per cluster relates to the kinetics of the target promoter39, suggests a model of how transcription control is achieved by the local environment. According to this picture, target genes might sense activating signals by sampling the high local RF concentration within a ~100–200 nm volume, occupied by enhancer clusters around the transcription site. Interestingly, two or more genes might simultaneously sample this local compartment or environment, similarly to models previously proposed for certain puzzling gene co-regulation phenomena: in Drosophila embryos, to explain how shared enhancers could simultaneously activate two promoters linked on the same chromosome in cis28, or on paired homologous chromosomes in trans29, it was hypothesized that the two promoters might sense a common pool of the transcription machinery, such as a shared cluster of RFs16,18,29. However, since direct experimental tests of such mechanisms have been lacking, the physical basis for promoter coordination remains elusive. Moreover, whether this type of promoter coordination applies to co-regulated genes in mammalian cells has not been investigated in detail.
In mESCs during S and G2 phases, after DNA replication, the two sister chromatids are in close proximity, providing a natural setting to address possible coordination between two physically linked promoters. Interestingly, during transcription of Nanog and Sox2, we observe instances where the transcription sites of the two sister chromatids are spatially resolved and the kinetics of the two promoters appear coordinated (Figure 5a, Extended Data Fig. 5a, Supplementary Movies 1–2). About 23% and 26% of nuclei show doublet transcription sites, compared to 6.9–8.5% and 5.7–7.1% predicted for independent bursting of the two sister chromatids of Nanog and Sox2, respectively (Methods). This 2.7–4.6-fold higher than expected occurrence of doublets further indicates correlated transcription bursts of the two sister chromatids.
Figure 5. A shared transcription nano-scale environment created by RF clustering underlies apparent transcription coordination between Nanog sister chromatids.
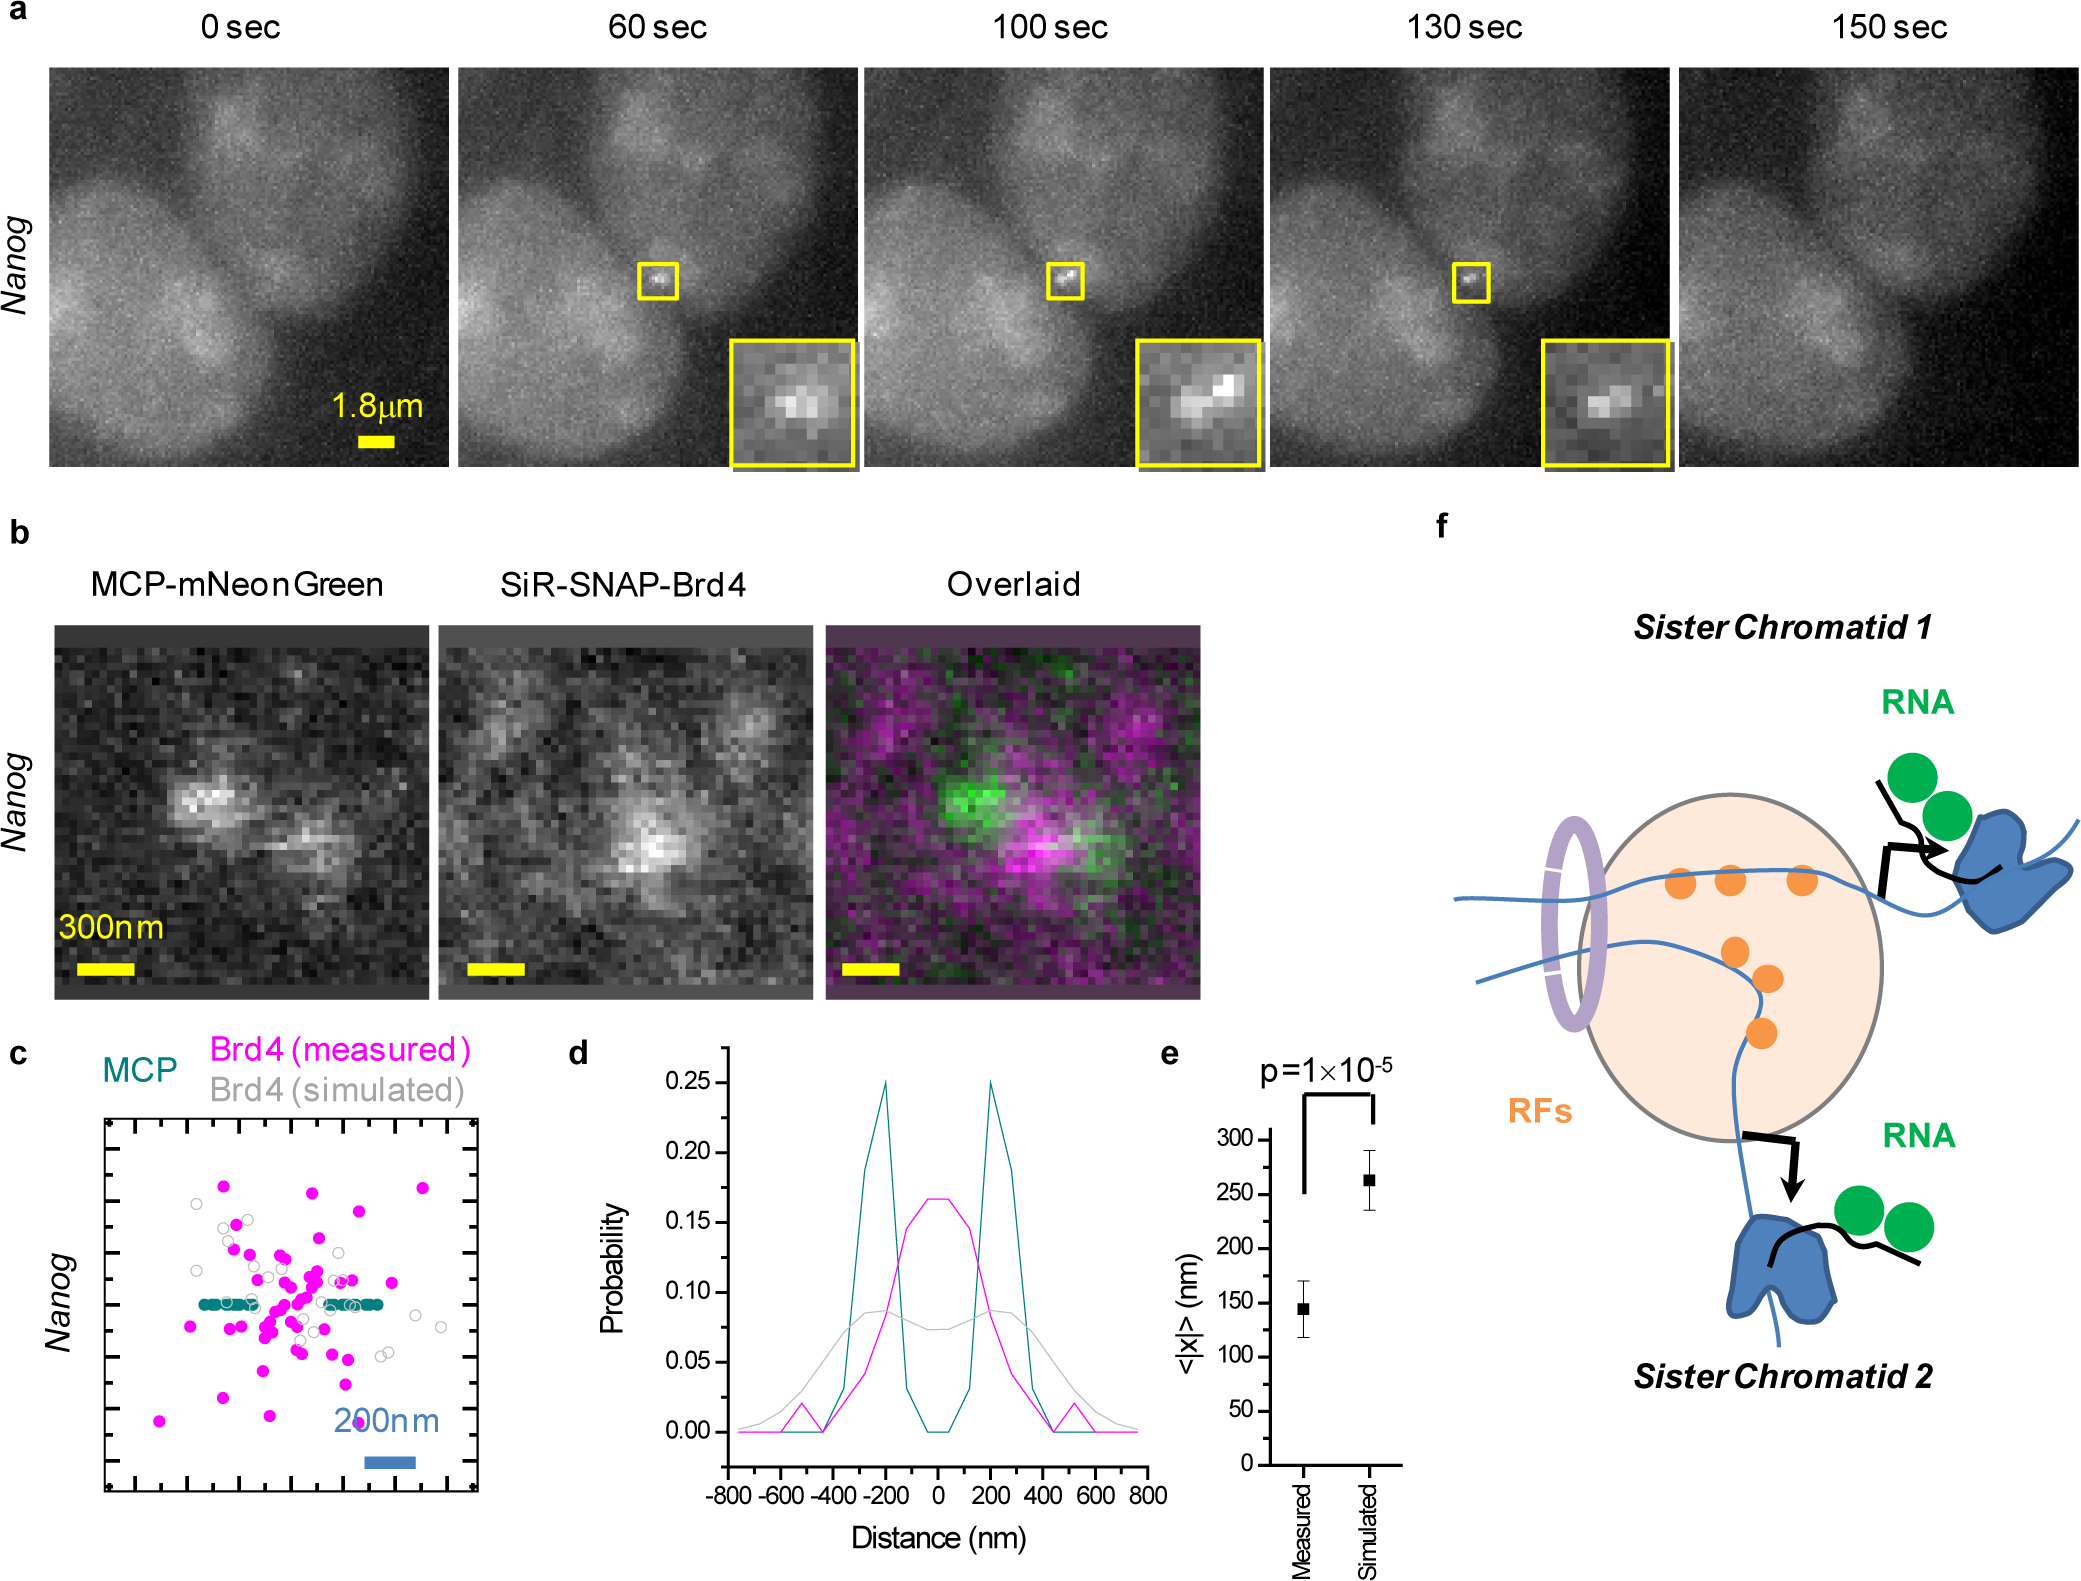
(a) Bursting of sister chromatids at the Nanog locus. Images show a resolvable MCP-mNeonGreen doublet during the burst. (b) Representative live-cell imaging of the organization of nascent RNA (MCP-mNeonGreen) and Brd4 in doublet Nanog transcription sites. (c and d) Localization of Brd4 clusters relative to the doublet Nanog transcription sites (n=16 cells from 2 independent experiments). (c) Scatter plot with the MCP doublet axis aligned along x and the doublet mid-point at the origin. Each doublet is plotted twice, once for each possible orientation. Simulated Brd4 cluster localizations are based on the experimental distribution of Brd4 clusters in singlet Nanog transcription sites39. (d) Distribution of distances along x for the experimental data in (c), as well as 105 simulations of n=16 doublets with independent Brd4 clusters. (e) Measured mean absolute deviation of the Brd4 clusters along the axis of the MCP doublet, 147±27 nm (mean±S.E.M., n=16 cells from 2 independent experiments), compared to the expected 263±27 nm based on simulations (mean±S.D., 105 simulations of n=16 doublets with independent Brd4 clusters, p=1×10⁻⁵ estimated from the numerical simulations). (f) Cartoon of proposed organization, highlighting how the two sister chromatids might sense overlapping signals from a common nano-scale environment created by distal enhancer clusters and associated RF clustering. Data for graphs in (c, d, e) are available as source data online.
Previous experiments indicated that Brd4 clustering at Nanog controls the frequency of transcription bursts (i.e. the burst initiation rate)39. These observations prompt us to further investigate the underlying spatial Brd4 organization in doublet transcription sites. We visualize Brd4 relative to MCP-mNeonGreen nascent RNA doublets (Figure 5b, Extended Data Fig. 5b). Intriguingly, we observe that Brd4 is concentrated in the space between the two resolved transcription sites. The majority of such nascent RNA doublets (~60%−70%; Supplementary Figure 1a, b) contain a joint pool of high local Brd4 concentration between the two transcription sites. Further quantifying the localization of Brd4 clusters at doublet transcription sites shows that a Brd4 cluster is preferentially positioned close to the mid-point of the doublet axis (Figure 5c, Extended Data Fig. 5c). The experimental Brd4 distribution clearly shows Brd4 density in-between the MCP doublet, contrary to the expected bi-modal distribution if the two transcription sites each have an independent Brd4 cluster. This is in stark contrast to the expected doublet of Brd4 clusters if each transcription site contained its own independent pool of clustered Brd4 (Figure 5d–e, Extended Data Fig. 5d–e). Thus, we conclude that at Nanog and Sox2, the two sister chromatids likely often share the same transcription activation signals by sampling overlapping local nano-scale environments, created by RFs clustered on one chromosome or by intermingled RF clusters from both chromosomes (Figure 5f).
DISCUSSION
Our direct imaging of RFs, nascent transcription and cis-elements at pluripotency genes in mESCs suggests a much more dynamic picture than the classical depictions of stable, binary promoter-enhancer interactions. Rather, target genes like Pou5f1, Sox2 and Nanog, likely sense activating signals by dynamically sampling a (~100–200 nm)3 volume, characterized by high-local RF concentration and created by frequent proximity of distal enhancer clusters to the target gene. Single tagged genomic loci in live cells exhibit anomalous sub-diffusive motions, with mean-squared-displacement MSD≈Dtα and an anomalous exponent α≈0.5. For active loci, D~3×10⁻² μm2/sec0.5 39,50, resulting in ~100 nm and ~500 nm r.m.s. displacements in t~0.1 sec and t~100 sec respectively. This observation suggests that within the minute-long timescales of transcription responses, a target gene would sample a region similar to the sizes of these RF clusters. It remains to be investigated whether such “exploration” of a regulatory domain relies purely on 3D diffusion or involves additional mechanisms of reduced dimensionality, such as loop extrusion53. Further developments of 3D single-molecule tracking54 with nanometer spatial and millisecond temporal resolution could directly visualize the detailed relative movements of the individual cis-elements within the cluster. Future work on multi-color live-cell imaging of three-way and higher-order genomic configurations could also elucidate possible cooperativity in the observed interactions.
Mutations that abolish the specific recognition of DNA and chromatin targets prevent Sox2 and Brd4 from concentrating into clusters of the endogenous WT proteins. At the same time, IDR deletion Sox2 and Brd4 mutants incorporate into clusters with efficiencies similar to WT proteins. Thus, although transcription factors, Mediator, and Brd4 can form phase-separated droplets driven by IDR-IDR interactions in vitro44,45, most of the clusters of Sox2 and Brd4 in mESC nuclei, as well as at the Pou5f1 and Sox2 loci, are not dependent on recruitment through the IDRs. Rather, the observed focal RF accumulation reflects the 3D organization and clustering of specific DNA and chromatin binding sites. Our genomic interaction imaging results further substantiate the idea that focal RF accumulation at single active gene loci is achieved through frequent close proximity of multiple distal enhancer clusters and target genes. As such, RF clustering more likely represents the result of organizing proteins that are generally involved in controlling genome organization and promoter-enhancer communication11,55,56. Similar imaging approaches could also elucidate nano-assemblies of clustered effector molecules proposed to facilitate other important sub-cellular processes.
The topologies we observe, with enhancers clustered within 100–200nm of the target gene, suggest two possible mechanisms for how the promoter samples this local activating nanoenvironment. RFs within the cluster might remain mostly bound to their targets at the enhancers. Pol II or the general machinery, or both, at or near the promoter might then undergo collisions with enhancer-bound RFs through frequent dynamic interactions, via subtle conformational fluctuations in the local chromatin fiber. Alternatively, the promoter might not come in direct contact with the individual enhancers within the cluster. Rather, 3D clustering of multiple DNA and chromatin binding sites might create a local environment where RFs are kinetically trapped. In this picture, once an RF molecule enters the cluster it does not efficiently diffuse away but it is retained in the cluster through frequent re-binding. Locally trapped RFs then need only diffuse through a small distance to interact with Pol II and GTFs at promoters in the cluster. Combination of molecular-scale 3D super-resolution imaging54 and single-molecule detection in crowded environments39 could enable testing these ideas, by further zooming into single gene loci and analyzing the relations of individual enhancers, the promoter, and single RF molecules, with nanometer resolution.
Previous work elaborated the importance of clustered enhancers along the genome, in 1D, for controlling key cell-identity genes, like Pou5f1, Nanog and Sox2 in mESCs27. Here we describe frequent physical proximity between the target genes and such distal 1D enhancer clusters spread over the extended genomic locus. Our results are consistent with the notion that 3D “super-clusters” of 1D enhancer clusters that frequently interact with the target gene constitute an important additional regulatory layer. This topological principle might also apply to transcription activation in other gene regulatory settings. For instance, multi-enhancer “hubs” have been described based on proximity ligation experiments for the individual elements within extended regulatory regions42,43, as well as for related enhancers at different chromosomes30,32. Importantly, our imaging experiments now link these underlying genome topologies to focal RF accumulation and transcription activation: these ~100–200 nm-sized enhancer cluster “super-clusters” locally concentrate Pol II regulatory factors and create local nano-scale environments that can be sampled by multiple promoters. These features are attractive for explaining enhancer redundancy and additive effects, and could have important implications for our understanding of distributed regulatory logic over extended and complex genomic loci, as well as mechanisms behind transcription robustness and coordinated gene regulation.
METHODS
Cell lines.
Mouse embryonic stem cell lines for imaging the Pou5f1 and Nanog loci were derived from Bruce 4 mESCs (Millipore Sigma CMTI-2; murine strain C57/BL6J, male – species/sex verified by karyotyping, no additional cell line authentification performed). OMG mESCs39 contain a 24 × MS2 cassette integrated in the 3′-UTR of one of the two Pou5f1 alleles57 and also stably express MCP-mNeonGreen39. NMG mESCs contain 24 × MS2 cassettes integrated in the 3′-UTR of both Nanog alleles and also stably express MCP-mNeonGreen58. NMG SNAP-Brd4 clone 7 cells also contain bi-allelic integrations of SNAP-tag at the Brd4 locus39. mESC lines for imaging the Sox2 locus were derived from B6 albino mESCs (B6(Cg)-Tyrc-2J/J, Jackson Lab 000058; male - species/sex verified by karyotyping, no additional cell line authentification performed). All cell lines tested negative for mycoplasma.
Cell culture.
Cell culture was performed at 37°C, in 5% v/v CO2 atmosphere, in a humidified incubator. As previously described39, mESCs were cultured and maintained in +2i media with appropriate selection drugs, on 0.1% gelatin-coated dishes, at 37°C in a humidified 5% CO2 incubator. +2i media contain D-MEM (Thermo Fisher Scientific 10313021), 15% fetal bovine serum (Gemini Bio 100–500), 0.1 mM 2-mercaptoethanol (Thermo Fisher Scientific 21985023), 2 mM L-alanyl-L-glutamine (Thermo Fisher Scientific 35050079), 1× MEM nonessential amino acids (Thermo Fisher Scientific 11140076), 1000 U/mL LIF (Millipore ESG1107), 3 μM CHIR99021 (Millipore 361559) and 1 μM PD0325901 (Axon Medchem 1408) and 100U/mL Penicillin-Streptomycin (Thermo Fisher Scientific, 15140122).
Generation of stable cell lines expressing inducible SNAP-tagged WT and mutant Sox2.
Flag-SNAP-Sox2 WT, 2M, 2D, and TAD were amplified from gene-Blocks (Genscript) and cloned into an empty piggyback transposon vector PB-TRE-AgeI-ORF-XbaI50, resulting PB-TRE-Flag-SNAP-Sox2 WT, 2M, 2D, and TAD. All constructs were verified by DNA sequencing.
OMG cells39 (1×10⁶) were transfected with 10 μg PB-TRE-Flag-SNAP-Sox2 WT, 2M, 2D, or TAD and 1 μg pCMV-hyPBase vectors58 using Lipofectamine 2000 (Invitrogen 11668019). After incubation for 5 days, cells were subjected to 1 μg/ml Puromycin (Thermo Fisher Scientific A1113803) selection. Individual colonies were picked, expanded, and imaged after 24 hr induction with 1 μg/ml Tetracycline. Positive clones showing SNAP signal after staining were selected for all further experiments.
Transient ectopic expression of SNAP-tagged WT and mutant Brd4.
Brd4 WT and mutant transient expression constructs were assembled in multiple steps. For generating BD mutants, two point mutations (S140A, S434A) were introduced through three rounds of PCR using primer sets with site-directed mutations. The resulting PCR fragments with the two point mutations were then cut and pasted into RSV-Flag-Brd4-WT vector (Addgene 86616), resulting in RSV-Flag-Brd4-BDmut.
For generating the IDR deletion mutant, a PCR fragment of Brd4 with the IDR deleted was used to replace Brd4-WT, resulting in RSV-Flag-Brd4-IDRdel.
Next, SNAP-tag was PCR amplified and cloned into the RSV-Flag-Brd4-WT, -BDmut, and -IDRdel vectors, resulting in RSV-SNAP-Flag-Brd4-WT, -BDmut, and -IDRdel. Finally, the EF1α promoter was cloned and introduced into the vector, resulting in RSV-EF1α- SNAP-Flag-Brd4-WT, -BDmut, and -IDRdel. All constructs were verified by DNA sequencing.
OMG39 or SMG (see below) cells (1×10⁶) were transfected with 10 μg RSV-EF1α- SNAP-Flag-Brd4-WT, -BDmut, and -IDRdel using Lipofectamine 2000 (Invitrogen 11668019). Transfected cells were seeded on a laminin-coated 8-chamber coverglass. After incubation for 1–2 days, cells were stained with SiR-BG and used for imaging experiments.
Generation of mESCs with 24×MS2 integration at the Sox2 3’UTR and stable expression of MCP-mNeonGreen.
gRNAs were designed using an online tool (http://crispr.mit.edu/)59, with targeting regions near the 3’UTR region of the mouse Sox2. As previously described39, to test the efficiencies of the gRNAs, 0.25 μg of espCas9-gRNA-Sox2 were transfected into 1×10⁴ WT mESCs (Bruce 4 C57BL/6) using Lipofectamine 2000 (Invitrogen 11668019). Genomic DNA was extracted 5 days post-transfection using High Pure PCR Template Preparation Kit (Roche 11796828001). To test the cutting efficiency, a surveyor assay was performed using Surveyor Mutation Detection Kit S100 (IDT 706020). Briefly, DNA samples were PCR-amplified by Herculase II Fusion DNA Polymerase (Agilent 600675) using site-specific primers, the PCR products were denatured by heating-up and then cooled down to form heteroduplexes. Mismatched duplexes were then cleaved by Nuclease S and cleavage products were detected by gel electrophoresis.
The targeting vector was assembled in multiple steps. First, a gene block was synthesized containing part of the Sox2 coding sequence and part of the 3’UTR (910 bp) as a HA-L, followed by part of the 3’UTR sequence (1000 bp) as a HA-R. The gene block was further inserted into the EcoRV site of pUC57, resulting in pUC57-HA-L-HA-R. Next, a 24×MS2 cassette was cut from pCR4–24×MS2SL-stable (Addgene 31865) and pasted into pUC57-HA-L-HA-R, resulting in pUC57-HA-L-24×MS2-HA-R. Finally, LoxP-PGK-Neo-LoxP was cut from the PL452 vector (a gift from the National Cancer Institute) and pasted into pUC57-HA-L-24×MS2-HA-R, resulting in pUC57-HA-L-24×MS2- LoxP-PGK-Neo-LoxP-HA-R.
B6 albino mESCs (B6(Cg)-Tyrc-2J/J, Jackson Lab 000058) (3×10⁶) were transfected with 7 μg donor vector and 3 μg espCas9-Sox2 vector using Lipofectamine 2000 (Invitrogen 11668019). After incubation for 7 days, cells were subjected to 150 μg/ml G418 (Sigma G8168) selection. Individual colonies were picked and expanded. Clones were screened by Southern blot and heterozygous clones with a correctly targeted Sox2 allele were selected for all further experiments.
To excise the PGK-Neo neomycin resistance cassette, correctly targeted clones were transfected (10×106 cells) with 6 μg pCre-Pac vector60 using Lipofectamine 2000 (Invitrogen 11668019). After incubation for 6 hrs, cells were subjected to 1 μg/ml Puromycin (Thermo Fisher Scientific A1113803) selection for 2–3 days. Puromycin was then removed and individual colonies were picked, expanded, and further confirmed with genotyping. A single clone (Sox2 Cre 3–3) with fully excised PGK-Neo was selected for all further experiments.
Sox2 Cre 3–3 cells, containing a 24×MS2 cassette integrated in the 3’-UTR of one of the two Sox2 alleles, were transfected with 10 μg pPB-LR5-CAG-MCP-mNeonGreen-IRES-Neo and 1 μg pCMV-hyPBase vectors58 using Lipofectamine 2000 (Invitrogen 11668019). After incubation for 2 days, cells were subjected to 400 μg/ml G418 (Sigma G8168) selection. Individual colonies were picked, expanded, and imaged. A single clone (Sox2 MCP clone 3, dubbed “SMG”) showed bright MCP-mNeonGreen-tagged Sox2 nascent transcription sites were selected for all further experiments.
Generation of mESCs with SNAP-tag integrations at Sox2, Brd4, Med19 and Rpb1.
For SNAP-tagging the endogenous Sox2 and Brd4 we used previously described donor and gRNA vectors39. SNAP-tag integrations at Rpb1 and Med19 were performed with similar strategies as previously described for Sox2 and Brd439. To target the endogenous Rpb1 and Med19, first gRNAs were designed using an online tool (http://crispr.mit.edu/), with targeting regions near the transcription start site of Rpb1 and Med19. The expected cut site is ~25 bp after and ~27 bp before the TSS of Rpb1 and Med19, respectively. The targeting regions are 5’- CGGGCATGCGCTGTCCCCGGAGG-3’ and 5’- AGTAATTAACGCCCGATCCCGGG-3’ for Rbp1 and Med19, respectively.
As previously described39, for gRNA cloning, oligo pairs containing partially complementary sequence were annealed and ligated into the BbsI site of espCas9 plasmid (Addgene 71814). To test the efficiencies of the gRNAs, 0.25 μg of espCas9-gRNA-Rpb1, or -Med19 were transfected into 1×10⁴ WT mESCs (Bruce 4 C57BL/6) using Lipofectamine 2000 (Invitrogen 11668019). Genomic DNA was extracted 5 days post-transfection using High Pure PCR Template Preparation Kit (Roche 11796828001). To test the cutting efficiency, a surveyor assay was performed using Surveyor Mutation Detection Kit S100 (IDT 706020). Briefly, DNA samples were PCR-amplified by Herculase II Fusion DNA Polymerase (Agilent 600675) using site-specific primers, the PCR products were denatured by heating-up and then cooled down to form heteroduplexes. Mismatched duplexes were then cleaved by Nuclease S and cleavage products were detected by gel electrophoresis.
To achieve CRISPR-Cas9 mediated knock-in of SNAP-tag at the Rpb1 locus, an Rpb1 targeting construct was generated (Integrated DNA Technologies). The synthesized construct contains 409bp of the Rpb1 5’ UTR as the left homology arm, followed by Flag-spacer-SNAP-tag, and part of Rpb1 exon 1 (750 bp) with 3 silent mutations (to prevent gRNA re-cutting) as the right homology arm. Then the synthetic DNA was inserted into a pUCIDT (Amp) vector.
To achieve CRISPR-Cas9 mediated knock-in of SNAP-tag at the Med19 locus, a Med19 targeting construct was generated. First, a gene block was synthesized containing part of the Med19 promoter and the 5’ UTR (500 bp) as the left homology arm, followed by Flag-spacer-SNAP- tag, and Med19 exon 1 and part of intron 1 (750 bp) with 3 mutations (to prevent gRNA re-cutting) as the right homology arm. Then the gene block was inserted into the EcoRV site of the pUC57 vector.
To generate SMG cells expressing endogenous SNAP-tagged Sox2, SMG cells (1×10⁶) were transfected with 10 μg SNAP-Sox2 donor vector and 0.6 μg espCas9-gRNA-Sox2 vector. Ten days after transfection, the cells were trypsinized, labeled with 0.3 μM SiR-BG for 10 minutes, rinsed three times with new media, followed by immediate fluorescence-activated cell sorting (FACS). All the SiR-positive cells were collected, expanded for ~2 weeks, trypsinized, labeled with SiR-BG and sorted again. Individual clones were picked from the second round pool and expanded. Homozygous clones (dubbed “SMG SNAP-Sox2 clone 5”) with both Sox2 alleles correctly targeted with SNAP-tag integrations and that show SiR nuclear staining were selected for all further experiments.
To generate SMG cells expressing endogenous SNAP-tagged Brd4, SMG cells (1×10⁶) were transfected with 10 μg SNAP-Brd4 donor vector and 0.6 μg espCas9-gRNA-Brd4 vector. Ten days after transfection, the cells were trypsinized, labeled with SiR-BG and subjected to FACS, generating a first-round SiR-positive pool. This pool was then expanded, stained with SiR-BG and subjected to second FACS round and individual clones were picked and expanded. Homozygous clones (dubbed “SMG SNAP-Brd4 clone 7”) with two Brd4 alleles correctly targeted with a SNAP-tag integration and that shows SiR nuclear staining was selected for all further experiments.
To generate SMG cells expressing endogenous SNAP-tagged Rpb1, SMG cells (1×10⁶) were transfected with 10 μg SNAP-Rpb1 donor vector and 0.6 μg espCas9-gRNA-Rpb1 vector. Ten days after transfection, the cells were trypsinized, labeled with SiR-BG and subjected to FACS, generating a first-round SiR-positive pool. This pool was then expanded, stained with SiR-BG and subjected to second FACS round and individual clones were picked and expanded. Homozygous clones (dubbed “SMG SNAP-Rpb1 clone 4”) with two Rpb1 alleles correctly targeted with a SNAP-tag integration and that shows SiR nuclear staining was selected for all further experiments.
To generate SMG cells with endogenously SNAP-tagged Med19, SMG cells (1×10⁶) were transfected with 10 μg SNAP-Med19 donor vector and 0.6 μg espCas9-gRNA-Med19 vector. Ten days after transfection, the cells were trypsinized, labeled with SiR-BG and subjected to FACS, generating a first-round SiR-positive pool. This pool was then expanded, stained with SiR-BG and subjected to second FACS round and individual clones were picked and expanded. Homozygous clones (dubbed “SMG SNAP-Med19 clone 5”) with two Med19 alleles correctly targeted with a SNAP-tag integration and that shows SiR nuclear staining was selected for all further experiments.
Chimeric gRNA array cloning.
gRNAs were designed using an online tool (https://www.atum.bio/eCommerce/cas9/input) for different genomic regions. All the gRNAs with score above 20 were further selected and, based on targeting regions and scores, the top 12–18 scored non-overlapping gRNAs were picked for cloning into multi-guide arrays (listed in Supplementary Data Tables 1 and 2).
Multi-gRNA arrays were cloned following a published method61. Briefly, sgRNA scaffold and U6 promoter were cloned from Lenti-multi-Guide (Addgene 85401) with primers having additional BsmBI sites. The gel purified PCR products and vector Lenti-multi-Guide were further digested with BsmBI (NEB). Ligation reactions were performed with equimolar amounts of vector and insert fragments. T4 DNA ligase (NEB) was used following the manufacturer’s protocol. Ligation products were transformed into 50 μl Stbl3 competent cells (Thermo Fisher Scientific C737303) following the manufacturer’s protocol. Positive clones were screened base on PCR and were further verified by their NotI and XhoI (NEB) digestion pattern. Finally, positive clones were confirmed by Sanger sequencing.
Generation of stable cell lines expressing inducible dCas9-Halo.
A fragment of dCas9-Halo was amplified from gene-Blocks (Genscript) and cloned into a Piggybac transposon vector, PB-TRE-dCas9-EGFP50, resulting in PB-TRE-dCas9-Halo.
OMG cells (1×10⁶) and SMG cells (1×10⁶) were transfected with 10 μg PB-TRE-dCas9-Halo and 1 μg pCMV-hyPBase vectors58 using Lipofectamine 2000 (Invitrogen 11668019). After incubation for 5 days, cells were subjected to 1 μg/ml Puromycin (Thermo Fisher Scientific A1113803) selection. Individual colonies were picked, expanded, and imaged after 24hr treatment of 1 μg/ml Tetracycline. Positive clones showing positive dCas9-Halo signal after staining were selected for all further experiments.
Preparation of mESCs for live-cell imaging.
Before imaging, cells were seeded onto 5 μg/ml laminin (BioLamina LN511) coated 8-chamber coverglass (LabTek, 155411) with media and appropriate drugs. For SiR staining, cells were labeled with media containing 0.3 μM SiR-BG for 10 min, at 37°C, followed by three times rinsing with new media. For all the NMG and NMG derivative cell lines, cells were seeded with +2i media with appropriate drugs, for all the OMG and SMG cell lines, cells were seeded with −2i media with appropriate drugs. For inducible Sox2 WT and mutant expression, cells were induced one day after seeding, using 300 ng/mL or 1 μg/mL tetracycline. SiR-BG staining and imaging was performed 12–48hrs after induction. For dCas9 imaging, cells were transfected with gRNA arrays, seeded on coverglass, and then dCas9-Halo expression was induced one day after using 300 or 1000 ng/mL. JF646-Halo62 staining and imaging was performed 12–72 hrs after induction.
Imaging.
High resolution and high sensitivity imaging of single transcription sites (Figures 2, 3, 4, 5b–e and Extended Data Figures 2, 3, 4, 5b–e) was performed with a previously described home-built system39. Point-scanning two-color imaging was performed in this setup with a 60× silicon oil 1.30 NA objective lens (Olympus UPLSAPO60XS) at 490nm and 640nm excitation (Piqo-Quant LDH-P-C-485B and LDH-P-C-640B) and two Avalanche Photo-Diode (APD) detectors (Pico-Quant, Tau SPAD). We scanned an xyz volume of 2×2×2.5 μm3 around the transcription site, using 100nm z steps. Scanning was performed with a 3D nanopositioning stage (Physik Instrumente, P-561.3DD and E-712 controller). At each 100nm z-slice, an xy scan was completed in 1 second, resulting in ≈25sec/volume total time. Live-cell imaging was performed at 37°C and 5% CO2 atmosphere, inside a home-built temperature-controlled stage incubator, with independent control of N2, O2 and CO2 using mass-flow controllers and with a separate heater and temperature controller for the objective lens39.
Whole mESC nuclei were imaged (Figure 1, Extended Data Fig. 1) with a modified Leica TCS SP8 confocal setup, featuring far-red-sensitive Avalanche-Photo-Diode detectors (Excelitas) and a white-light super-continuum laser excitation source (NKT Photonics SuperK EXTREME EXW-12). Imaging was performed with a 63× 1.20 NA water immersion objective lens (Leica 15506346 HC PL APO 63×/1.20 W CORR CS2) at 648nm excitation. We scanned an xyz volume ≈20.54×20.54×4–9 μm3 encompassing the whole nucleus of one cell, using 40.1nm xy pixel size and 300nm z steps. At each 300 nm z-slice, an xy scan was completed in ≈1.8 seconds, resulting in 25–57sec/volume total time. Live-cell imaging was performed with the whole microscope enclosed inside a temperature-controlled box. An additional stage incubator (Tokai-Hit) was used to regulate temperature and atmosphere of the sample at 37°C and 5% CO2 respectively.
Wide-field imaging (Figures 5a, Extended Data Fig. 5a, Supplementary Movies 1–2) was performed with a previously described single-molecule home-built setup39. We used a 60× 1.49 NA oil-immersion objective lens (Nikon MRD01691), a 488nm laser excitation source (Coherent Sapphire HP 500) and a back-illuminated EM-CCD detector (Andor, Ixon3 897). We imaged an xyz volume ≈82×82×2.5–5 μm3 containing multiple cells, using 250nm z steps. Stepping in z was performed with a 3D nanopositioning stage (Physik Instrumente, P-517.3CD, with E-710.3CD controller). Camera exposure times were 1 second at each z position, resulting in 10–20 sec/volume total time. Live-cell imaging was performed at 37°C and 5% CO2 atmosphere, inside a home-built temperature-controlled stage incubator, with independent control of N2, O2 and CO2 using mass-flow controllers and with a separate heater and temperature controller for the objective lens39.
Image processing and data analysis.
Image processing was performed using custom MATLAB 2010b and 2019b (MathWorks) and IDL 6.4 (Harris Geospatial Solutions) routines, as well as Fiji (ImageJ 1.52a).
Cluster analysis of Brd4 and Sox2 in mESC nuclei.
For 3D cluster analysis, we used the IDL version of a particle tracking package63 to identify features and obtain centroids and radii of gyration for putative Sox2 and Brd4 clusters in the nuclear volumetric datasets. Putative clusters were further quantified with a custom MATLAB routine that calculates the total signal and local background (values of voxels in the periphery) for each feature identified in IDL. The total signal and local background values are calculated from the sum of the voxel intensities inside a volume of 0–5 and 5–8 voxels from the cluster centroid, respectively. To estimate the statistical significance for each putative cluster, the MATLAB routine reports the p-value of a Wilcoxon rank-sum test that compares the values of the voxels inside the cluster (at distances 0–5 voxels from the cluster centroid) vs. the values of the background in the periphery (at distances 5–8 voxels from the cluster centroid). Finally, clusters with p<0.001 are counted for estimating the nuclear cluster density.
Analysis of individual transcription sites.
Movement of the transcription site during the ~1 second period between successive scans, as well as the lower z optical resolution compared to xy, blurs 3D distances and makes 3D quantification with nanometer accuracy challenging. Thus, individual z-slices close to the focal plane with both MCP and SNAP or Halo visible spots were picked for 2D analysis. We note that at typical separations of ~100–300 nm, both features are well within the ~600–800 nm focal range of the 1.3 NA objective lens in use.
Analysis of RFs and dCas9 at singlet transcription sites.
For individual singlet transcription site analysis, transcription sites were identified in MCP-mNeonGreen images using the particle tracking package. Then 19×19 pixels sub-ROIs centered on the transcription site were fitted to a 2D Gaussian peak function, of the form I(x,y)=B+A0·exp[-(x-x0)2/(sx2)-(y-y0)2/(sy2)]. If the transcription site was close to the image edge or to avoid background in-homogeneities that might affect position estimates, the sub-ROIs were further trimmed (down to 13×13 pixels) or shifted manually (by up to ± 6 pixels), or both.
Quantification of number of RF molecules clustered at the transcription site.
We first obtained the number of SNAP-SiR-tagged Pol II molecules clustered at the Pou5f1 locus using single-molecule detection by target-locking39. Briefly, the MCP-mNeonGreen signal from the nascent RNA was used to lock the position of the transcription site at the (common) center of the excitation beams. Then an intense red excitation beam was turned on to quickly (<30 sec) bleach SiR-tagged molecules clustered in the center. The brightness of a single SNAP-SiR molecule was determined from the average photobleaching step-size, under conditions where ~25% of the molecules are labeled with SiR, to increase the detection SNR39. The total number of clustered molecules was estimated from bleaching curves under conditions where ~100% of the molecules are labeled, as follows: photobleaching traces from single transcription sites where fit to a stretched exponential curve and the total number of clustered Pol II molecules was estimated from the initial SiR signal at t=0 (before any bleaching has occurred), minus the steady-state plateau at t→∞ (once all the clustered molecules have bleached).
Once the estimated average cluster size for SNAP-SiR Pol II (~9 molecules) is obtained by target locking, it can serve as a calibration standard for quantifying clusters visualized in point-scanning images39. The number of SNAP-SiR-tagged RF molecules contained in each cluster was thus estimated from the point-scanning images, by comparing the peak amplitude (A0) and integrated signal (π⋅A0⋅sx⋅sy) parameters to those of point-scanning images of Pol II clusters at Pou5f1 obtained under the same excitation intensity and imaging conditions.
Calculation of SNR for dCas9-tagged genomic loci.
To quantify the SNR for tagged genomic loci detection, we estimated the signal, background level, and background noise, using a 19×19 pixel ROI of the dCas9-Halo-JF646 images that contains the dCas9-tagged genomic locus. We calculated the signal, S5×5, in a 5×5 region centered on the dCas9-Halo-JF646 spot. The background level B and noise σB is estimated from the mean and standard deviation of the rest of the pixels in the 19×19 ROI. Finally, the SNR is estimated as SNR = (S5×5-B) / (σB/sqrt(5×5)) = 5 × (S5×5-B) / σB.
Two-color distance measurements.
The 2D distances between MCP-tagged RNA and SNAP-tagged RF clusters or dCas9-Halo-tagged genomic loci were estimated from the coordinates of the fitted 2D Gaussians in the respective images. The two colors were aligned and overlapped first by measuring the back-scattered light of the 490nm and 642nm laser excitation beams from ~100nm Au nanoparticles, and then by imaging 40nm-diameter TransFluoSpheres (488/645; ThermoFisher Scientific, T10711). Residual systematic offsets (typically < 30nm) were then subtracted for the final 2D distance measurements. The effect of chromatic aberrations for 2D distance measurements in live cells was further estimated by measuring transcription sites with doubly-tagged nascent RNA. Specifically, we tagged the 24×PP7 nascent RNA of a mini-gene, driven by the CMV promoter in U-2 OS cells39, simultaneously with tdPCP-EGFP and tdPCP-Halo-JF646. From this type of measurements, we estimate ≤29 nm r.m.s. registration errors between EGFP or mNeonGreen and SiR or JF646, well below the range of typical genomic distances measured (~100–300 nm).
Analysis of Brd4 clusters at doublet transcription sites.
For doublet transcription sites, first the MCP-mNeonGreen images were used to identify the transcription sites with the particle tracking package. Then a 29×29 pixels sub-ROI centered between the two MCP spots was fitted to a double 2D Gaussian peak function of the form I(x,y)=B+A0·exp[-(x-x0)2/(sx02)-(y-y0)2/(sy02)]+ A1·exp[-(x-x1)2/(sx12)-(y-y1)2/(sy12)]. If the transcription site was close to the image edge or to avoid background in-homogeneities that might affect position estimates, the sub-ROIs were further trimmed (down to 23×23 pixels) or shifted manually (by up to ± 6 pixels), or both.
Plotting and curve fitting.
Plotting and curve fitting was performed in Origin 8.5.0 (OriginLab Corporation). In the box plots, boxes indicate inter-quartile range (IQR: 25%75% intervals) and the median line, whiskers indicate 1.5× the IQR; ‘×’ symbols indicate 1% and 99% percentiles; square symbols indicate the mean.
Statistics.
Statistical comparisons were made using a two-sided Wilcoxon rank-sum test (MATLAB ranksum routine), except for the detection of nuclear clusters of Brd4 and Sox2, where one-sided Wilcoxon rank-sum tests were performed. The p-values for the tendency of Brd4 to cluster close to the mid-point of the doublet axis at doublet transcription sites were estimated by numerical simulations. Specifically, the experimental Brd4 cluster distribution at doublet transcription sites was compared to 105 randomly generated doublets with independently positioned Brd4 clusters. For independently positioned Brd4 clusters, we assumed a normal distribution of x,y coordinates relative to each MCP spot, with standard deviation equal to the experimental standard deviation obtained from imaging singlet transcription sites (Nanog: 183 nm, reference39; Sox2: 117 nm, Extended Data Fig. 2a,b).
Visualization of previously published ChIP-Seq, Hi-C and 5C data.
mESC Hi-C data (mm9 assembly, 5kb resolution)64 were plotted using the 3D Genome Browser tool65. ChIP-Seq data for Sox2 (GSM1910642)66 were plotted using the Integrative Genomics Viewer tool67. 5C (GSM883649)55 and ChIP-Seq data for p300 (ENCFF001LJC), Pol II (ENCFF001LJI), Ctcf (ENCFF001LIR) and H3K27ac (ENCFF001KDN) were visualized using the WashU Epigenome Browser68.
Predicted occurrence of doublet transcription sites based on independent sister chromatid bursting.
The predicted occurrence of doublet transcription sites in the mixed population of exponentially growing mESCs, based on independent sister chromatid bursting, can be estimated based on the following parameters: burst duration, τburst, burst frequency in cells with replicated loci, fS-G2, fraction of cells with replicated loci ndouble-loci, and burst frequency in the mixed cell population, fmix.
Measurement of burst duration.
The intensity trace I(t) of MCP-mNeonGreen-tagged nascent transcription sites was fitted to a segmented line of the following form, using non-linear least-squares fitting in MATLAB:
The bust duration was then estimated from the fit parameters as τburst=t4-t1. We obtain τburst= 329±164 sec and 410±157 sec (mean±S.D., n=46 and 36 bursts) for Nanog and Sox2 respectively.
Estimation of fraction of cells with replicated loci.
Since the experiments are performed with an exponentially growing population of cells, a fraction of cells nsingle-loci contain single loci, before DNA replication, while a fraction ndouble-loci cells has duplicated loci. The relative percentages of mESCs in different phases of the cell cycle are ~10–20% in G1, 65–75% in S and ~15% in G269,70. Since pluripotency genes like Nanog and Sox2 are replicated in early S phase (first quartile)71, we estimate that 25–40% of cells contain single loci (nsingle-loci~0.25–0.4), with the rest containing replicated loci (ndouble-loci~0.6–0.75).
Probability of simultaneous bursting of independent sister chromatids.
We first measure experimentally the bursting frequency, fS-G2, in cells that contain doublet transcription sites (presumably in late S-G2, after DNA replication). We obtain 0.00095/sec (12 cells, 41 total bursts for 2 tagged alleles in 1800sec) and 0.00091/sec (11 cells, 27 total bursts for 1 tagged allele in 2700sec) for Nanog and Sox2 respectively. Using the experimental parameters, we then simulate bursting traces of the two sister chromatids, using the experimental τburst and assuming that each sister chromatid bursts with a frequency fS-G2/2. The simulation conditions are 1 sec time interval and 3.6·107 sec total time. From the simulated traces we obtain the predicted probability, Pdoublet_S-G2;predicted, that transcription sites post-replication would appear as doublets, if the two sister chromatids were bursting independently. We obtain Pdoublet_S-G2;predicted = 0.079±0.001 and 0.094 ±0.002 (mean ± S.D., n=5), in agreement with the expected values based on joint probability calculations, Pdoublet_S-G2;predicted ≈ (fS-G2·τburst)/4 = 0.079 and 0.092, for Nanog and Sox2 respectively.
Calculation of predicted fraction of doublet transcription sites in exponentially growing mESCs.
To estimate the expected occurrence of doublet transcription sites in exponentially growing mESCs, we measure the bursting frequency, fmix, in the mixed cell population. We obtain 0.00067/sec (42 cells, 101 total bursts for 2 tagged alleles in 1800sec) and 0.00088/sec (38 cells, 90 total bursts for 1 tagged allele in 2700sec) for Nanog and Sox2 respectively. We can then obtain the fraction of active transcription sites in the mixed cell population that are expected to appear as doublets, Pdoublet_mix;predicted ≈Pdoublet_S-G2;predicted · (fS-G2/ fmix) · ndouble-loci. Based on the simulated Pdoublet_S-G2;predicted, the measured fS-G2 and fmix and a range of ndouble-loci~0.6–0.75, we obtain a Pdoublet_mix;predicted range of 6.9–8.5% and 5.7–7.1%, for Nanog and Sox2 respectively.
Comparison of measured and predicted frequency of doublet transcription sites.
To test the predictions of independent sister chromatid bursting, we measure the percentage of doublet transcription sites using high-resolution confocal imaging, in a mixed population of cells. We obtain Pdoublet_mix;measured = 22.7% (14.5%,32.9%) and 25.9% (15.3%, 39.0%) for Nanog and Sox2, respectively (20/88 and 15/58 cells respectively; 95% confidence intervals for a binomial distribution calculated using the MATLAB binofit function). The measured occurrence of doublet transcription sites is 2.7–3.3 and 3.7–4.6-fold higher than what would be expected from independent bursting of sister chromatids, for Nanog and Sox2 respectively.
Numerical simulations of Brd4 cluster distribution for independent doublet transcription sites.
We simulated the expected distribution of independent Brd4 clusters around doublet transcription sites using the experimental parameters for Brd4 clustering at singlet transcription sites. For each measured MCP doublet (n=16 and 11 for Nanog and Sox2 respectively) we place two Brd4 clusters, each at a random (dx,dy) displacement from coordinates of the two resolved MCP spots. (dx,dy) are random numbers selected from a normal distribution with σ equal to the experimental standard deviation for Brd4 at singlet Nanog and Sox2 transcription sites. To account for the optical resolution of the setup in the SiR/JF-646 channel, if the two Brd4 clusters are closer than 290nm, we replace them with a single Brd4 cluster at their mid-point. Finally, we calculate the distribution and the mean absolute deviation of the simulated Brd4 clusters along the MCP doublet axis and compare with the experimental values (Figures 5d–e and Extended Data Fig. 5d–e).
Extended Data
Extended Data Figure 1. Quantification of Brd4 and Sox2 clustering throughout mESC nuclei.
(a, b) Normalized nuclear level for endogenous as well as ectopically expressed WT and mutant SNAP-tagged proteins. SNAP-SiR fluorescence was quantified over the whole nucleus, and then the data were normalized to the mean nuclear level of the endogenous SNAP-tagged factors. (a) Endogenous, as well as ectopically expressed WT, BDmut and IDRdel Brd4. Data points are from 2 independent experiments with total n= 29, 18, 21, and 16 cells for endogenous, WT, Bdmut, and IDRdel, respectively. (b) Endogenous, as well as ectopically expressed WT, 2M, TAD, and 2D Sox2. Data points are from 2 independent experiments with total n= 43, 15, 21, 18, and 20 cells for endogenous, WT, 2M, TAD, and 2D, respectively. (c, d) Scatter plots of total intensity vs. detection significance (p-value from a Wilcoxon rank-sum test) for each identified nuclear cluster. Representative data from 1 experiment are shown. (c) WT and mutant Brd4 (n=9, 8, 11, and 10 cells, for Endogenous, WT, Bdmut and IDRdel, respectively). (d) WT and mutant Sox2 (n=14, 13, 11, 10, and 11 cells, for Endogenous, WT, HMG point mutant (Sox2M) and HMG, and TAD deletion mutants (Sox2 TAD and Sox2D), respectively). Dashed lines in (c,d): p-value=0.001 cutoff. Box-plots in (a, b): boxes indicate inter-quartile range (IQR: 25%75% intervals) and the median line, whiskers indicate 1.5× the IQR; ‘×’ symbols indicate 1% and 99% percentiles; square symbols indicate the mean. Data for graphs in (a-d) are available as source data online.
Extended Data Figure 2. Pol II and RF clustering at the endogenous Sox2 locus in mESCs.
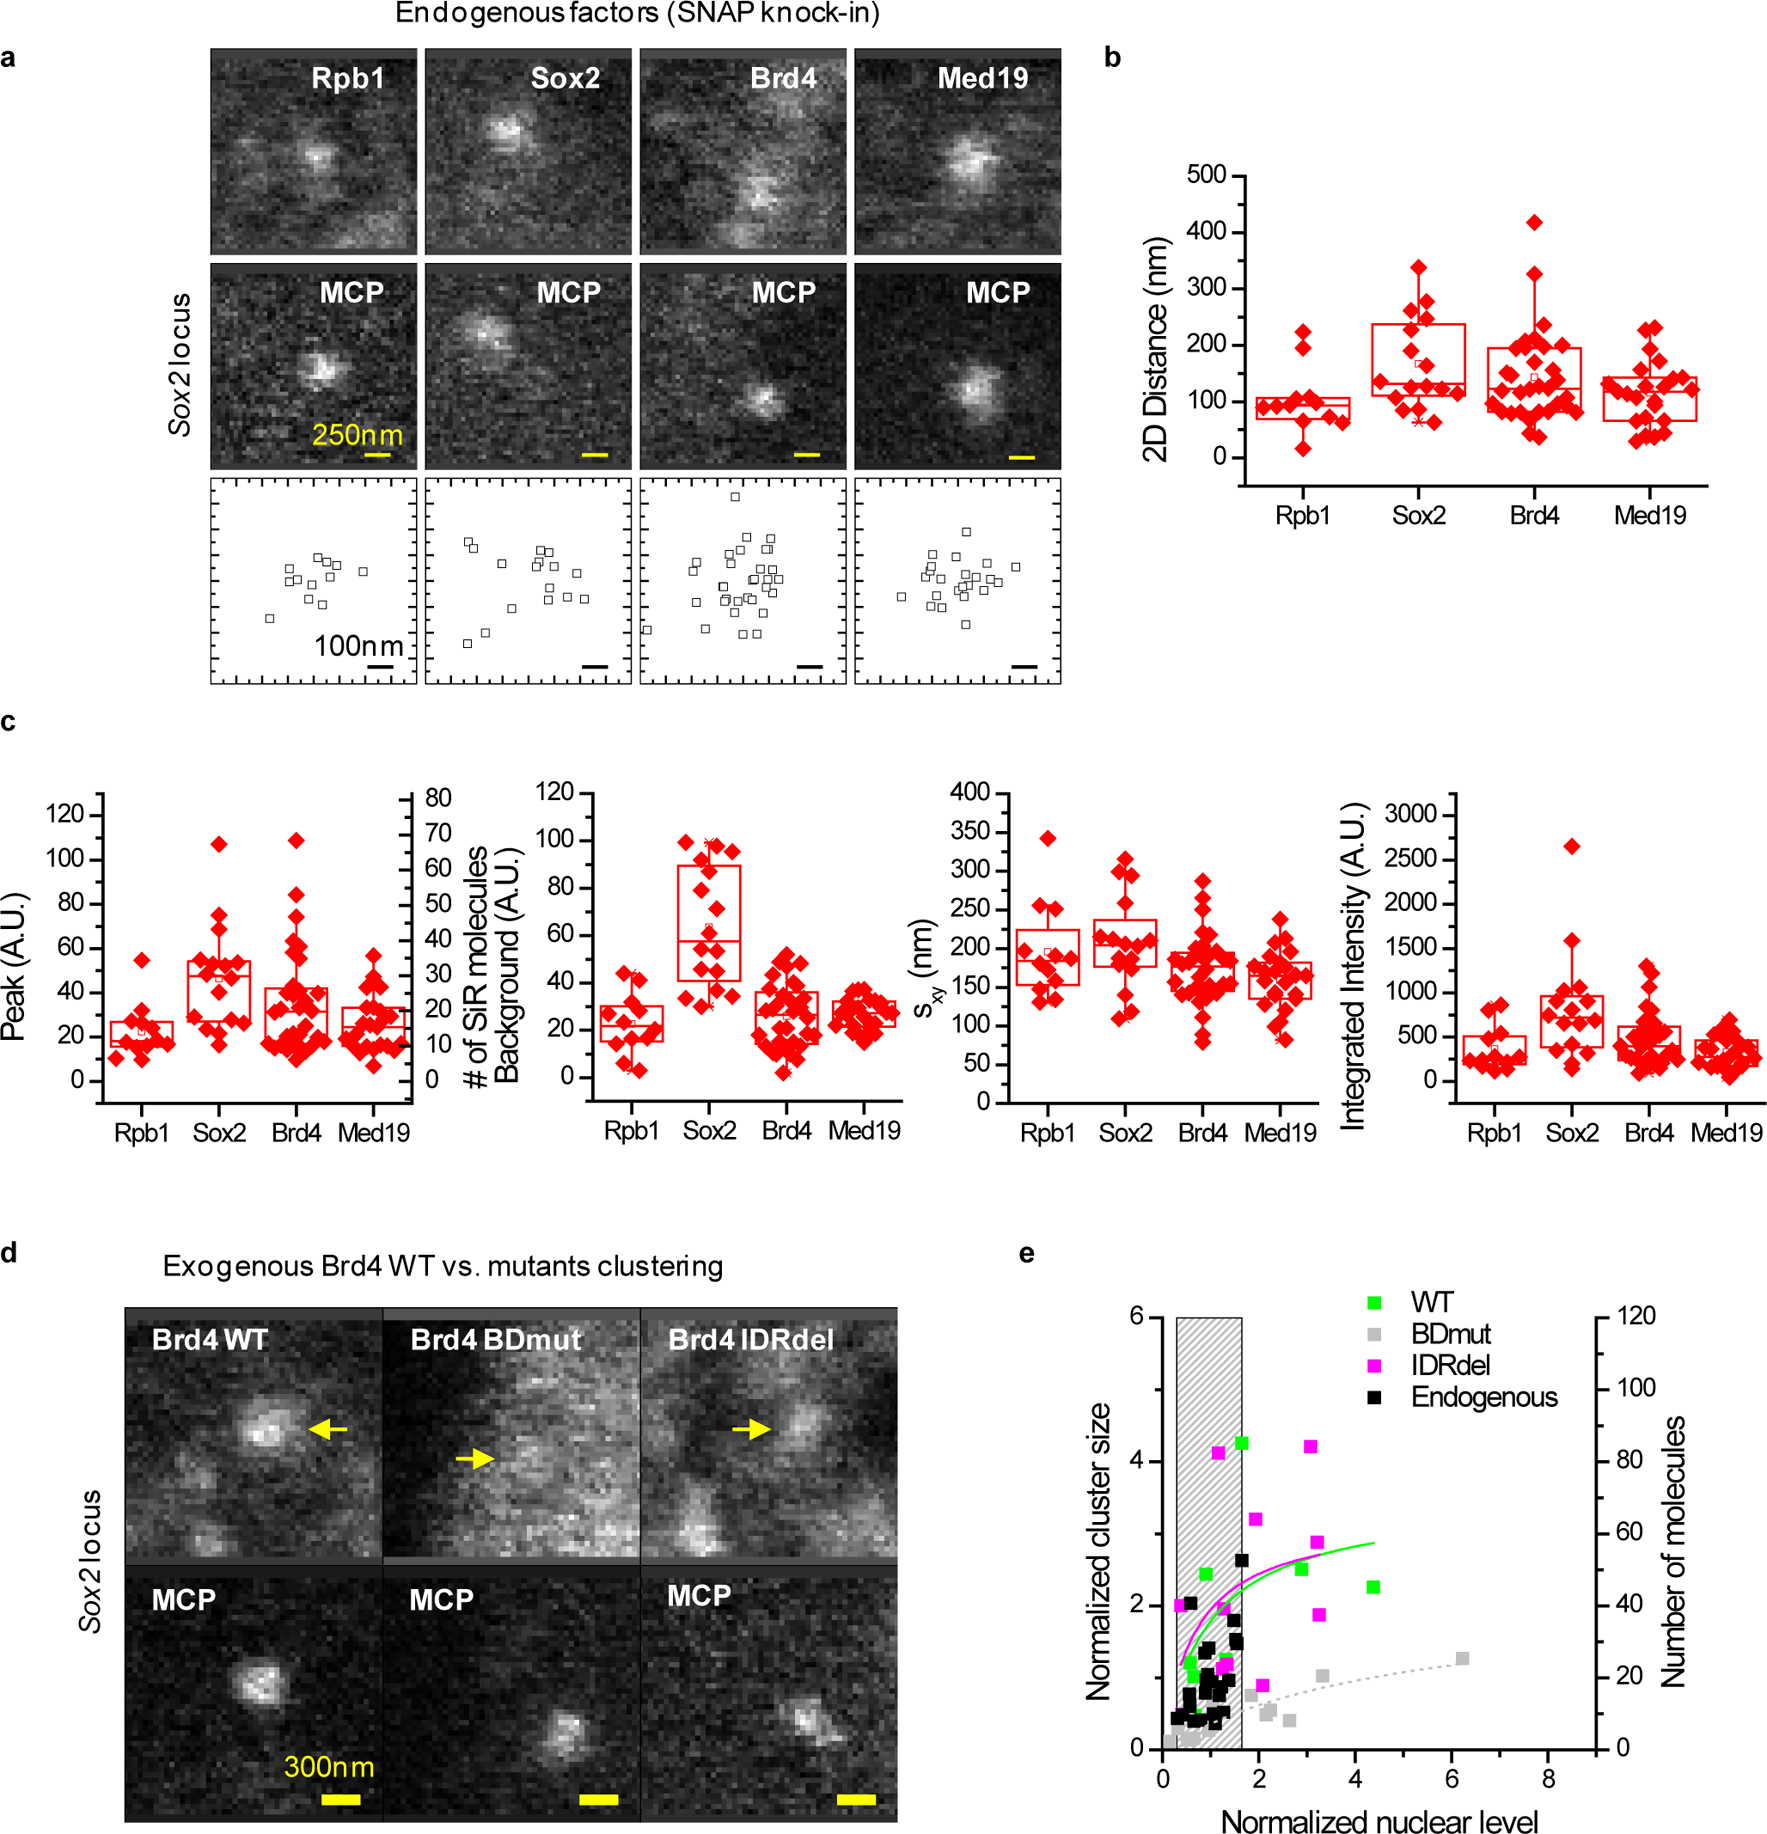
(a) Live-cell imaging (2 μm × 2 μm ROIs, 0.8 s/scan) shows co-localized MCP-mNeonGreen and SiR-Rpb1, -Sox2, -Brd4, and –Med19 foci (yellow arrows). Bottom panels: relative MCP-Rpb1, -Sox2, -Brd4, and -Med19 xy coordinates. (b) 2D distances between MCP and factors (mean ± SD): Rpb1 102 ± 56 nm, Sox2 167 ± 81nm, Brd4 143 ± 80 nm, Med19 115 ± 57 nm (n = 12, 16, 32, and 23 cells, respectively). (c) Relative peak amplitude (A0), background level (B), r.m.s. width sxy = (sxsy)0.5, and integrated signal (πA0sxsy), for the Rpb1, Sox2, Brd4, and Med19 foci, respectively. Peak parameters are obtained by fitting to an elliptical 2D Gaussian function of the form I(x,y) = B + A0·exp[-x2/(2sx)2-y2/(2sy)2]. In the peak amplitude graph, the right-hand y-axis shows the number of molecules, calibrated based on the Pol II counts obtained by target-locking. (d and e) Organization of SNAP-Brd4 at the Sox2 locus. (d) Live-cell imaging reveals co-localized SNAP-tagged Brd4 foci with MCP-mNeonGreen-tagged nascent RNA, for WT and IDRdel, but not for BDmut Brd4. Yellow arrows indicate colocalized Brd4 clusters. (e) Quantification of Brd4 clustering at the Sox2 locus. Each data point corresponds to a single time-point measurement in a single cell (n=23, 8, 13, and 12 total cells for endogenous, WT, BDmut, and IDRdel Brd4, respectively). The left y-axis shows the size of individual clusters, normalized to the average cluster size of endogenous Brd4 at the Sox2 locus (~20 molecules). The right y-axis shows the absolute number of Brd4 molecules per cluster. The x-axis shows the nuclear level, estimated from the fitted local background level in the Sox2 ROI, normalized to the average nuclear level of endogenous Brd4. Solid lines: apparent binding curves by fitting to the function y = Ax/(x + K). Grey bar: endogenous Brd4 expression level. Box-plots in (b, c): boxes indicate inter-quartile range (IQR: 25%75% intervals) and the median line, whiskers indicate 1.5× the IQR; ‘×’ symbols indicate 1% and 99% percentiles; square symbols indicate the mean. Data for graphs in (b, c, e) are available as source data online.
Extended Data Figure 3. Precision and reproducibility of dCas9 imaging and 2D distance measurements.
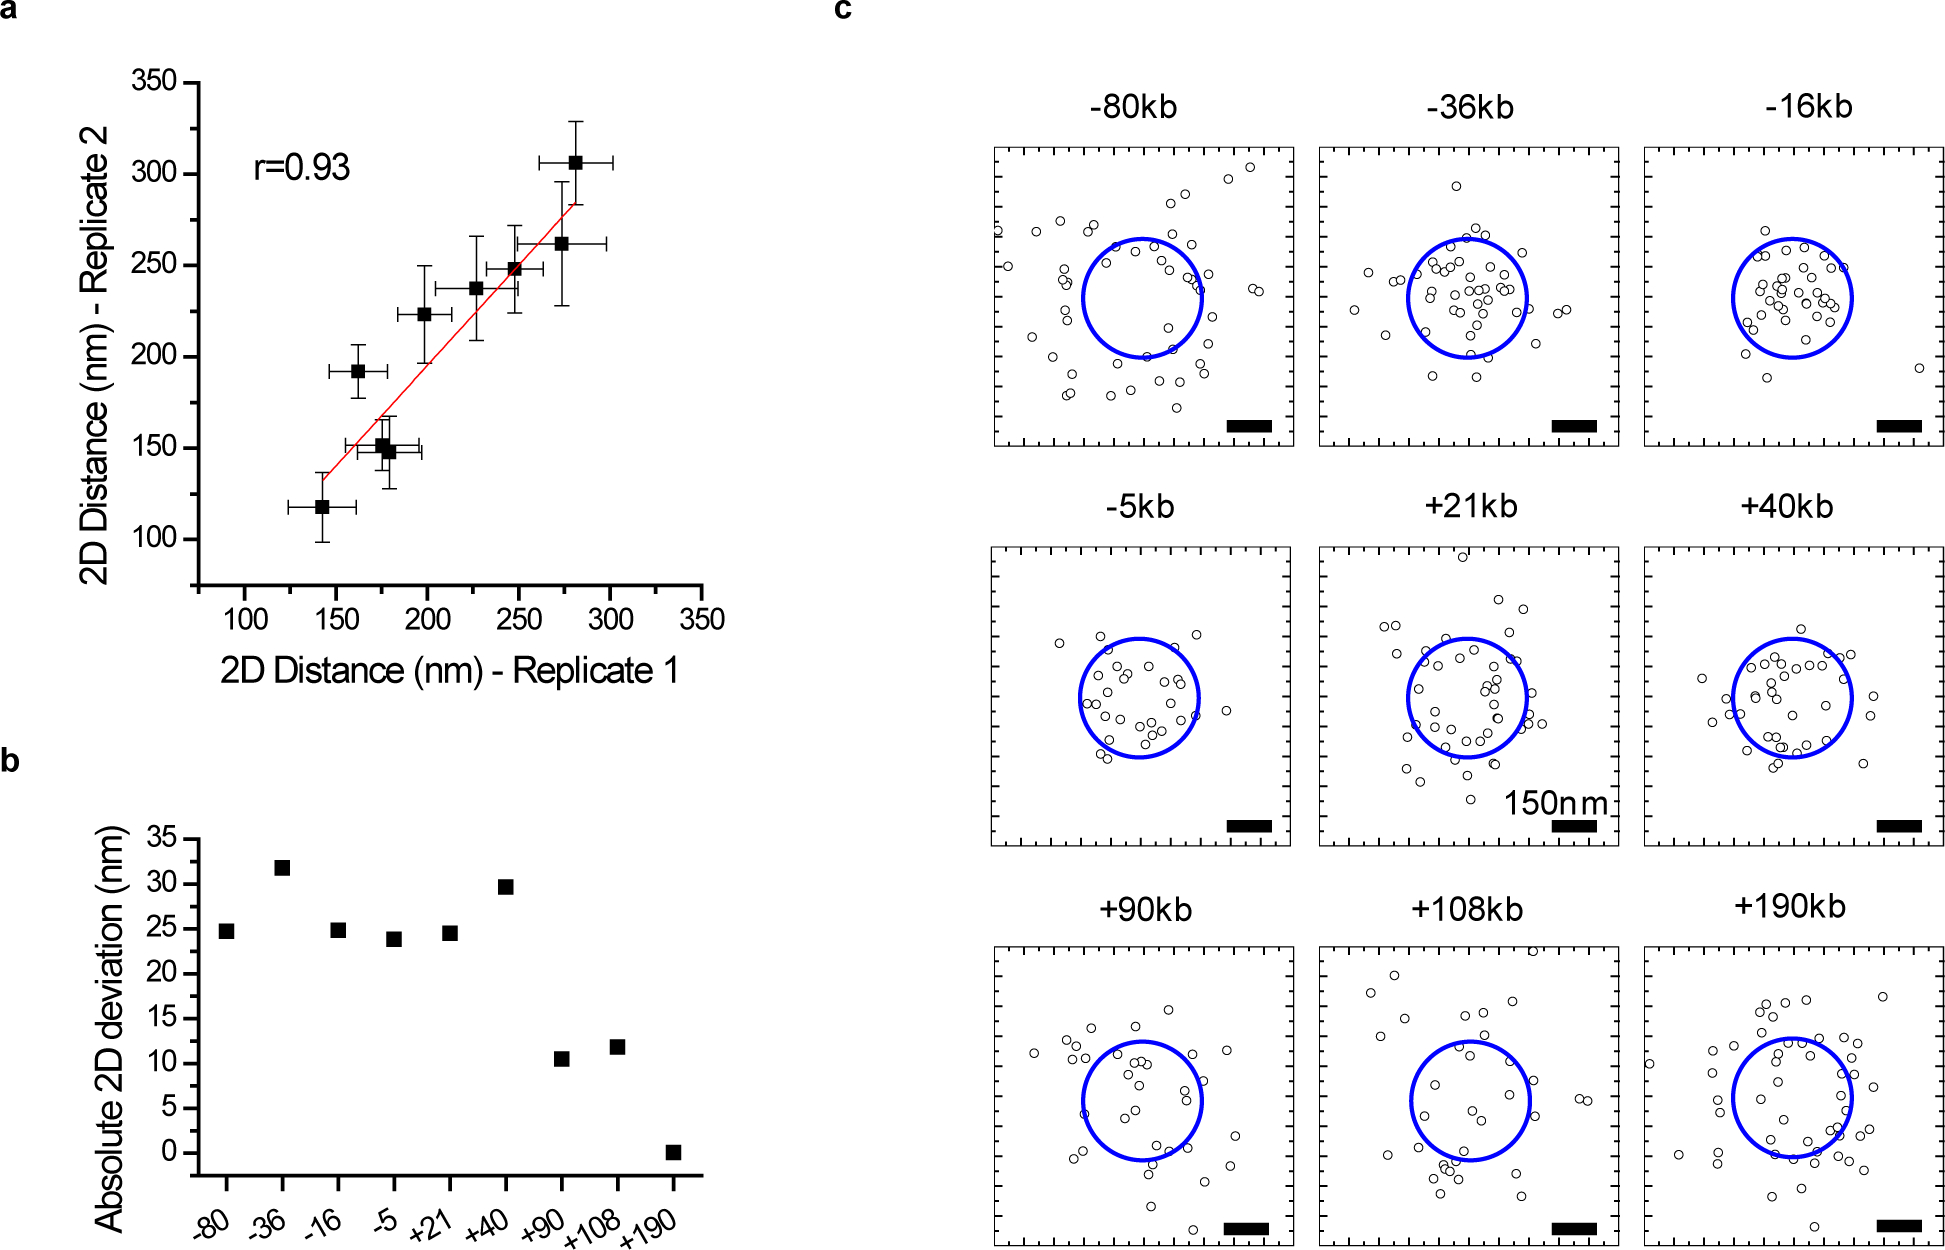
(a) Correlation between dCas9-Halo-JF646 – MCP-mNeongreen 2D distance measurements from 2 independent experiments in the extended Pou5f1 locus. Points: mean distances, error bars: S.E.M.. Solid line: linear fit. Pearson’s r = 0.93, indicates the reproducibility of the measurements. Total n= (29, 34, 23, 13, 32, 21, 17, 20, and 34) and (20, 12, 16, 17, 14, 17, 17, 13, and 16) individual transcription sites were measured in experiments 1 and 2, respectively, for the −80kb, −36kb, −16kb, −5kb, +21kb, +40kb, +90kb, +108kb, and +190kb genomic regions, respectively. (b) Absolute deviation between n=2 independent experiments. The mean absolute deviation is 20.8 nm. (c) xy scatter plots of the positions of the 9 tagged loci relative to the Pou5f1 transcription site. Dashed circles indicate the cutoff 2D distance (200 nm), used in Figure 4c. Data for graphs in (a-c) are available as source data online.
Extended Data Figure 4. Imaging genomic interactions in the extended Sox2 locus reveals frequent proximity of distal enhancer clusters and the target gene.
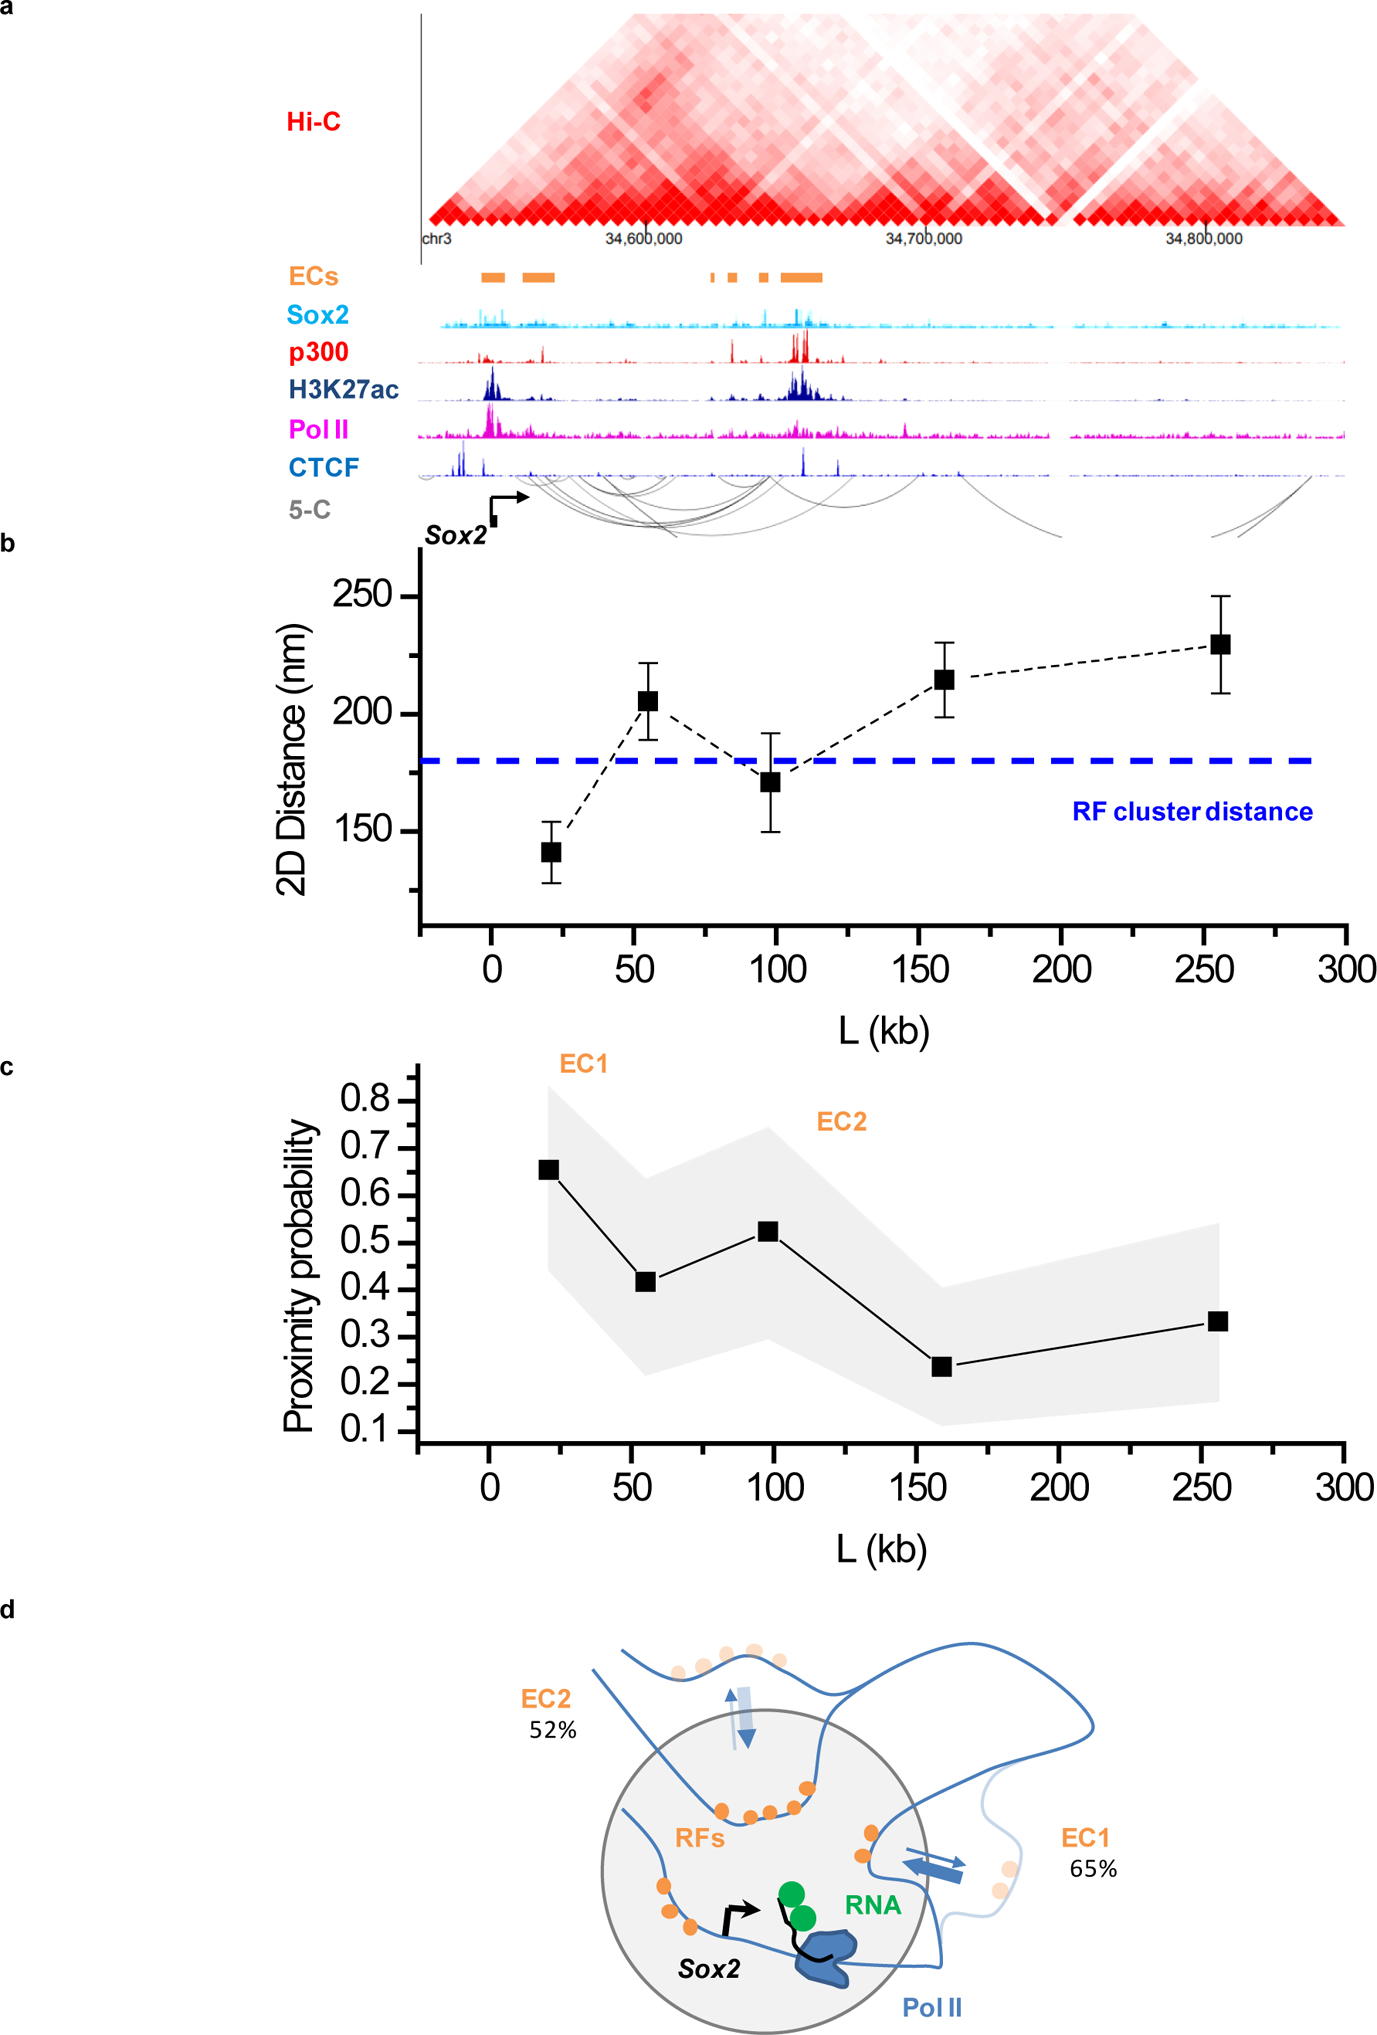
(a) Organization of the extended Sox2 locus from previously published proximity ligation (Hi-C, 5-C; accession numbers GSM2533818–21, GSM883649) and ChIP-Seq assays. ECs: enhancer clusters, characterized by presence of Sox2, p300 and H3K27ac ChIP signals. Accession numbers of ChIP-seq datasets used: GSM1910642, ENCFF001LJC, ENCFF001LJI, ENCFF001LIR, and ENCFF001KDN for Sox2, p300, Pol II, Ctcf, and H3K27ac, respectively. (b) Average distances and (c) proximity probabilities between the Sox2 transcription site (visualized with the 3’UTR MS2-tagged nascent RNA) and 5 regions between +20 kb and +300 kb from Sox2. (b) Data points: mean, error bars: S.E.M.. (c) Gray area: 95% binomial distribution confidence intervals. (b,c) Pooled data from 2 independent experiments with total n= 26, 24, 21, 38, and 27 individual transcription sites for the +21kb, +55kb, +98kb, +159kb, and +256kb genomic regions, respectively. In (b) Dashed line, indicates the 180 nm cutoff, corresponding to roughly the distance between RF clusters and the Pou5f1 transcription site. The 180nm distance cutoff is also used for the proximity probabilities shown in (c). (d) Cartoon of Sox2, highlighting frequent proximity of distal ECs to the Sox2 transcription site. Data for graphs in (b, c) are available as source data online.
Extended Data Figure 5. A shared transcription nano-scale environment created by RF clustering underlies apparent transcription coordination between Sox2 sister chromatids.
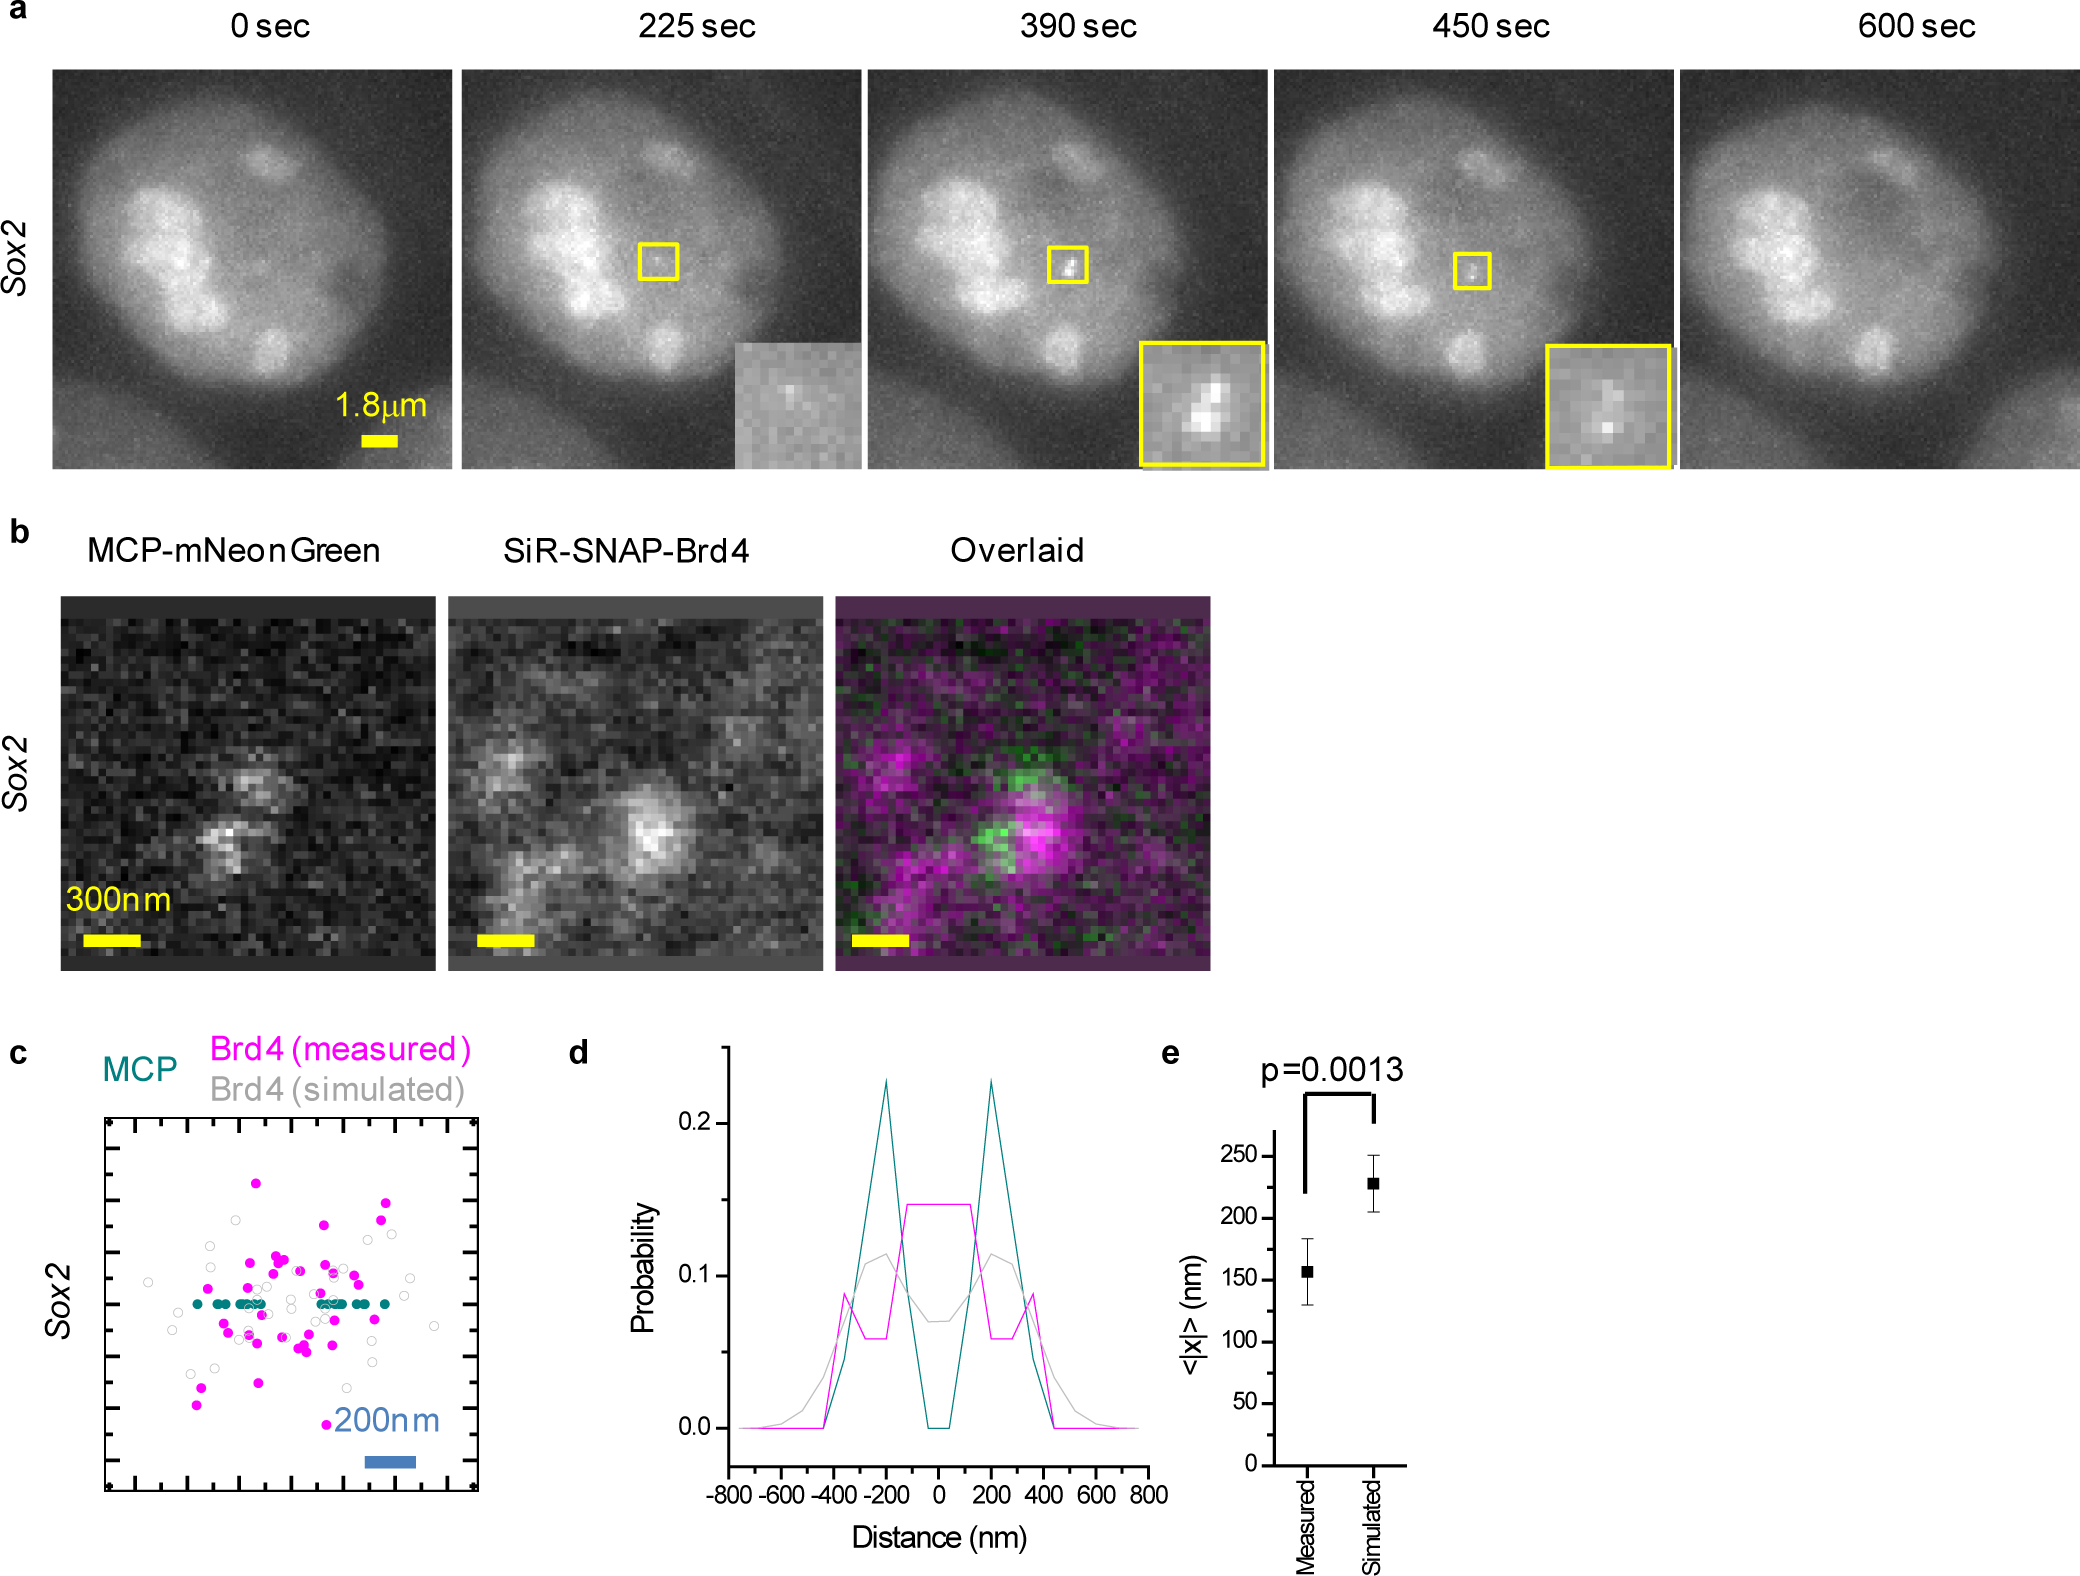
(a) Bursting of sister chromatids at Sox2. Images show a resolvable MCP-mNeongreen doublet during the burst. (b) Representative live-cell imaging of the organization of nascent RNA and Brd4 in doublet Sox2 transcription sites. Brd4 is concentrated in the space between the two resolved transcription sites. (c and d) Localization of Brd4 clusters relative to the doublet Sox2 transcription sites (n=11 cells from 2 independent experiments). (c) Scatter plot with the MCP doublet axis aligned along x and the doublet mid-point at the origin. Each doublet is plotted twice, once for each possible orientation. Simulated Brd4 cluster localizations are based on the experimental distribution of Brd4 clusters in singlet Sox2 transcription sites (Extended Data Fig. 2a–b). (d) Distribution of distances along x for the experimental data in (c), as well as 105 simulations of n=11 doublets with independent Brd4 clusters. The experimental Brd4 distribution clearly shows Brd4 density in-between the MCP doublet, contrary to the expected bi-modal distribution if the two transcription sites each have an independent Brd4 cluster. (e) The measured mean absolute deviation of the Brd4 clusters along the axis of the MCP doublet, 157±27 nm (mean±S.E.M., n=11 cells from 2 independent experiments), is significantly smaller than the expected 228±23 nm (mean±S.D., 105 simulations of n=11 doublets with independent Brd4 clusters, p=0.0013 estimated from the numerical simulations). Data for graphs in (c, d, e) are available as source data online.
Supplementary Material
ACKNOWLEDGEMENTS
We thank Jing Gao, Chia-Yun Han, Dorjee Shola and Chingwen Yang (Rockefeller University Gene Targeting Resource Center) for 24×MS2 targeting at the Sox2 locus. We thank Bo Gu and Joanna Wysocka (Stanford University) for providing reagents and advice regarding dCas9 imaging. We thank Luke Lavis (HHMI-Janelia) for dye-labeling reagents. This work is supported by a NYSTEM Postdoctoral Training Award (C32599GG; J.L.), the JST PRESTO program (Japan) (JPMJPR15F2; H.O. ) and JSPS KAKENHI (Japan) (JP18H05531 and JP19K06612; H.O.) and partially by JST CREST (Japan) (JPMJCR16G1; H.O.), the Louis V. Gerstner, Jr. Young Investigators Fund (A.P.), a National Cancer Institute grant (P30 CA008748), a National Institutes of Health (NIH) Director’s New Innovator Award (1DP2GM105443-01; A.P.) and the National Institute of General Medical Sciences of NIH (1R01GM135545-01 and 1R21GM134342-01; A.P.).
Footnotes
COMPETING INTERESTS
The authors declare no competing interests.
Reporting Summary Statement. Further information on experimental design is available in the Nature Research Reporting Summary linked to this article.
Code Availability. Custom-written analysis code is available in the Zenodo repository, DOI: 10.5281/zenodo.3960997.
Data Availability. Datasets that support the findings in the paper are available in the Zenodo repository, DOI: 10.5281/zenodo.3960997. Source data are available online.
REFERENCES
- 1.Levine M Transcriptional enhancers in animal development and evolution. Curr Biol 20, R754–63 (2010). [DOI] [PMC free article] [PubMed] [Google Scholar]
- 2.Long HK, Prescott SL & Wysocka J Ever-Changing Landscapes: Transcriptional Enhancers in Development and Evolution. Cell 167, 1170–1187 (2016). [DOI] [PMC free article] [PubMed] [Google Scholar]
- 3.Ptashne M Gene regulation by proteins acting nearby and at a distance. Nature 322, 697–701 (1986). [DOI] [PubMed] [Google Scholar]
- 4.Blackwood EM & Kadonaga JT Going the distance: a current view of enhancer action. Science 281, 60–3 (1998). [DOI] [PubMed] [Google Scholar]
- 5.Bulger M & Groudine M Looping versus linking: toward a model for long-distance gene activation. Genes Dev 13, 2465–77 (1999). [DOI] [PubMed] [Google Scholar]
- 6.Jin F et al. A high-resolution map of the three-dimensional chromatin interactome in human cells. Nature 503, 290–4 (2013). [DOI] [PMC free article] [PubMed] [Google Scholar]
- 7.Li G et al. Extensive promoter-centered chromatin interactions provide a topological basis for transcription regulation. Cell 148, 84–98 (2012). [DOI] [PMC free article] [PubMed] [Google Scholar]
- 8.Rao SSP et al. A 3D map of the human genome at kilobase resolution reveals principles of chromatin looping. Cell 159, 1665–80 (2014). [DOI] [PMC free article] [PubMed] [Google Scholar]
- 9.Sanyal A, Lajoie BR, Jain G & Dekker J The long-range interaction landscape of gene promoters. Nature 489, 109–13 (2012). [DOI] [PMC free article] [PubMed] [Google Scholar]
- 10.Bartman CR, Hsu SC, Hsiung CC, Raj A & Blobel GA Enhancer Regulation of Transcriptional Bursting Parameters Revealed by Forced Chromatin Looping. Mol Cell 62, 237–247 (2016). [DOI] [PMC free article] [PubMed] [Google Scholar]
- 11.Deng W et al. Controlling long-range genomic interactions at a native locus by targeted tethering of a looping factor. Cell 149, 1233–44 (2012). [DOI] [PMC free article] [PubMed] [Google Scholar]
- 12.Deng W et al. Reactivation of developmentally silenced globin genes by forced chromatin looping. Cell 158, 849–860 (2014). [DOI] [PMC free article] [PubMed] [Google Scholar]
- 13.Morgan SL et al. Manipulation of nuclear architecture through CRISPR-mediated chromosomal looping. Nature communications 8, 15993 (2017). [DOI] [PMC free article] [PubMed] [Google Scholar]
- 14.Kim JH et al. LADL: light-activated dynamic looping for endogenous gene expression control. Nat Methods 16, 633–639 (2019). [DOI] [PMC free article] [PubMed] [Google Scholar]
- 15.Alexander JM et al. Live-cell imaging reveals enhancer-dependent Sox2 transcription in the absence of enhancer proximity. elife 8(2019). [DOI] [PMC free article] [PubMed] [Google Scholar]
- 16.Heist T, Fukaya T & Levine M Large distances separate coregulated genes in living Drosophila embryos. Proc Natl Acad Sci U S A 116, 15062–15067 (2019). [DOI] [PMC free article] [PubMed] [Google Scholar]
- 17.Benabdallah NS et al. Decreased Enhancer-Promoter Proximity Accompanying Enhancer Activation. Mol Cell 76, 473–484 e7 (2019). [DOI] [PMC free article] [PubMed] [Google Scholar]
- 18.Furlong EEM & Levine M Developmental enhancers and chromosome topology. Science 361, 1341–1345 (2018). [DOI] [PMC free article] [PubMed] [Google Scholar]
- 19.Kim S & Shendure J Mechanisms of Interplay between Transcription Factors and the 3D Genome. Mol Cell 76, 306–319 (2019). [DOI] [PubMed] [Google Scholar]
- 20.Misteli T Beyond the sequence: cellular organization of genome function. Cell 128, 787–800 (2007). [DOI] [PubMed] [Google Scholar]
- 21.Dixon JR et al. Topological domains in mammalian genomes identified by analysis of chromatin interactions. Nature 485, 376–80 (2012). [DOI] [PMC free article] [PubMed] [Google Scholar]
- 22.Nora EP et al. Spatial partitioning of the regulatory landscape of the X-inactivation centre. Nature 485, 381–5 (2012). [DOI] [PMC free article] [PubMed] [Google Scholar]
- 23.Symmons O et al. The Shh Topological Domain Facilitates the Action of Remote Enhancers by Reducing the Effects of Genomic Distances. Developmental Cell 39, 529–543 (2016). [DOI] [PMC free article] [PubMed] [Google Scholar]
- 24.Lupianez DG et al. Disruptions of topological chromatin domains cause pathogenic rewiring of gene-enhancer interactions. Cell 161, 1012–1025 (2015). [DOI] [PMC free article] [PubMed] [Google Scholar]
- 25.de Laat W & Duboule D Topology of mammalian developmental enhancers and their regulatory landscapes. Nature 502, 499–506 (2013). [DOI] [PubMed] [Google Scholar]
- 26.Amandio AR, Lopez-Delisle L, Bolt CC, Mascrez B & Duboule D A complex regulatory landscape involved in the development of mammalian external genitals. elife 9(2020). [DOI] [PMC free article] [PubMed] [Google Scholar]
- 27.Whyte WA et al. Master transcription factors and mediator establish super-enhancers at key cell identity genes. Cell 153, 307–19 (2013). [DOI] [PMC free article] [PubMed] [Google Scholar]
- 28.Fukaya T, Lim B & Levine M Enhancer Control of Transcriptional Bursting. Cell 166, 358–68 (2016). [DOI] [PMC free article] [PubMed] [Google Scholar]
- 29.Lim B, Heist T, Levine M & Fukaya T Visualization of Transvection in Living Drosophila Embryos. Mol Cell 70, 287–296 e6 (2018). [DOI] [PMC free article] [PubMed] [Google Scholar]
- 30.Tan L, Xing D, Daley N & Xie XS Three-dimensional genome structures of single sensory neurons in mouse visual and olfactory systems. Nat Struct Mol Biol 26, 297–307 (2019). [DOI] [PubMed] [Google Scholar]
- 31.Lomvardas S et al. Interchromosomal interactions and olfactory receptor choice. Cell 126, 403–13 (2006). [DOI] [PubMed] [Google Scholar]
- 32.Markenscoff-Papadimitriou E et al. Enhancer interaction networks as a means for singular olfactory receptor expression. Cell 159, 543–57 (2014). [DOI] [PMC free article] [PubMed] [Google Scholar]
- 33.Iborra FJ, Pombo A, Jackson DA & Cook PR Active RNA polymerases are localized within discrete transcription “factories’ in human nuclei. J Cell Sci 109 (Pt 6), 1427–36 (1996). [DOI] [PubMed] [Google Scholar]
- 34.Zabidi MA & Stark A Regulatory Enhancer-Core-Promoter Communication via Transcription Factors and Cofactors. Trends Genet 32, 801–814 (2016). [DOI] [PMC free article] [PubMed] [Google Scholar]
- 35.Pennacchio LA, Bickmore W, Dean A, Nobrega MA & Bejerano G Enhancers: five essential questions. Nature reviews Genetics 14, 288–95 (2013). [DOI] [PMC free article] [PubMed] [Google Scholar]
- 36.van Steensel B et al. Localization of the glucocorticoid receptor in discrete clusters in the cell nucleus. J Cell Sci 108 (Pt 9), 3003–11 (1995). [DOI] [PubMed] [Google Scholar]
- 37.Ghamari A et al. In vivo live imaging of RNA polymerase II transcription factories in primary cells. Genes Dev 27, 767–77 (2013). [DOI] [PMC free article] [PubMed] [Google Scholar]
- 38.Mir M et al. Dense Bicoid hubs accentuate binding along the morphogen gradient. Genes Dev 31, 1784–1794 (2017). [DOI] [PMC free article] [PubMed] [Google Scholar]
- 39.Li J et al. Single-Molecule Nanoscopy Elucidates RNA Polymerase II Transcription at Single Genes in Live Cells. Cell 178, 491–506 e28 (2019). [DOI] [PMC free article] [PubMed] [Google Scholar]
- 40.Crocker J et al. Low affinity binding site clusters confer hox specificity and regulatory robustness. Cell 160, 191–203 (2015). [DOI] [PMC free article] [PubMed] [Google Scholar]
- 41.Farley EK et al. Suboptimization of developmental enhancers. Science 350, 325–8 (2015). [DOI] [PMC free article] [PubMed] [Google Scholar]
- 42.Tolhuis B, Palstra RJ, Splinter E, Grosveld F & de Laat W Looping and interaction between hypersensitive sites in the active beta-globin locus. Mol Cell 10, 1453–65 (2002). [DOI] [PubMed] [Google Scholar]
- 43.Allahyar A et al. Enhancer hubs and loop collisions identified from single-allele topologies. Nat Genet 50, 1151–1160 (2018). [DOI] [PubMed] [Google Scholar]
- 44.Sabari BR et al. Coactivator condensation at super-enhancers links phase separation and gene control. Science 361(2018). [DOI] [PMC free article] [PubMed] [Google Scholar]
- 45.Boija A et al. Transcription Factors Activate Genes through the Phase-Separation Capacity of Their Activation Domains. Cell 175, 1842–1855 e16 (2018). [DOI] [PMC free article] [PubMed] [Google Scholar]
- 46.Remenyi A et al. Crystal structure of a POU/HMG/DNA ternary complex suggests differential assembly of Oct4 and Sox2 on two enhancers. Genes Dev 17, 2048–59 (2003). [DOI] [PMC free article] [PubMed] [Google Scholar]
- 47.Nowling TK, Johnson LR, Wiebe MS & Rizzino A Identification of the transactivation domain of the transcription factor Sox-2 and an associated co-activator. J Biol Chem 275, 3810–8 (2000). [DOI] [PubMed] [Google Scholar]
- 48.Dey A et al. A bromodomain protein, MCAP, associates with mitotic chromosomes and affects G(2)-to-M transition. Mol Cell Biol 20, 6537–49 (2000). [DOI] [PMC free article] [PubMed] [Google Scholar]
- 49.Shin Y et al. Liquid Nuclear Condensates Mechanically Sense and Restructure the Genome. Cell 175, 1481–1491 e13 (2018). [DOI] [PMC free article] [PubMed] [Google Scholar]
- 50.Gu B et al. Transcription-coupled changes in nuclear mobility of mammalian cis-regulatory elements. Science 359, 1050–1055 (2018). [DOI] [PMC free article] [PubMed] [Google Scholar]
- 51.Li Y et al. CRISPR reveals a distal super-enhancer required for Sox2 expression in mouse embryonic stem cells. PLoS One 9, e114485 (2014). [DOI] [PMC free article] [PubMed] [Google Scholar]
- 52.Zhou HY et al. A Sox2 distal enhancer cluster regulates embryonic stem cell differentiation potential. Genes Dev 28, 2699–711 (2014). [DOI] [PMC free article] [PubMed] [Google Scholar]
- 53.Fudenberg G et al. Formation of Chromosomal Domains by Loop Extrusion. Cell Rep 15, 2038–49 (2016). [DOI] [PMC free article] [PubMed] [Google Scholar]
- 54.Wang G, Hauver J, Thomas Z, Darst SA & Pertsinidis A Single-Molecule Real-Time 3D Imaging of the Transcription Cycle by Modulation Interferometry. Cell 167, 1839–1852 e21 (2016). [DOI] [PMC free article] [PubMed] [Google Scholar]
- 55.Phillips-Cremins JE et al. Architectural protein subclasses shape 3D organization of genomes during lineage commitment. Cell 153, 1281–95 (2013). [DOI] [PMC free article] [PubMed] [Google Scholar]
- 56.Rao SSP et al. Cohesin Loss Eliminates All Loop Domains. Cell 171, 305–320 e24 (2017). [DOI] [PMC free article] [PubMed] [Google Scholar]
- 57.Ochiai H, Sugawara T & Yamamoto T Simultaneous live imaging of the transcription and nuclear position of specific genes. Nucleic Acids Res 43, e127 (2015). [DOI] [PMC free article] [PubMed] [Google Scholar]
- 58.Ochiai H, Sugawara T, Sakuma T & Yamamoto T Stochastic promoter activation affects Nanog expression variability in mouse embryonic stem cells. Scientific reports 4, 7125 (2014). [DOI] [PMC free article] [PubMed] [Google Scholar]
- 59.Hsu PD et al. DNA targeting specificity of RNA-guided Cas9 nucleases. Nat Biotechnol 31, 827–32 (2013). [DOI] [PMC free article] [PubMed] [Google Scholar]
- 60.Taniguchi M et al. Efficient production of Cre-mediated site-directed recombinants through the utilization of the puromycin resistance gene, pac: a transient gene-integration marker for ES cells. Nucleic Acids Res 26, 679–80 (1998). [DOI] [PMC free article] [PubMed] [Google Scholar]
- 61.Cao J et al. An easy and efficient inducible CRISPR/Cas9 platform with improved specificity for multiple gene targeting. Nucleic Acids Res 44, e149 (2016). [DOI] [PMC free article] [PubMed] [Google Scholar]
- 62.Grimm JB et al. A general method to improve fluorophores for live-cell and single-molecule microscopy. Nat Methods 12, 244–50, 3 p following 250 (2015). [DOI] [PMC free article] [PubMed] [Google Scholar]
- 63.Crocker JC & Grier DG Methods of digital video microscopy for colloidal studies. Journal of Colloid and Interface Science 179, 298–310 (1996). [Google Scholar]
- 64.Bonev B et al. Multiscale 3D Genome Rewiring during Mouse Neural Development. Cell 171, 557–572 e24 (2017). [DOI] [PMC free article] [PubMed] [Google Scholar]
- 65.Wang Y et al. The 3D Genome Browser: a web-based browser for visualizing 3D genome organization and long-range chromatin interactions. Genome Biol 19, 151 (2018). [DOI] [PMC free article] [PubMed] [Google Scholar]
- 66.Liu Z & Kraus WL Catalytic-Independent Functions of PARP-1 Determine Sox2 Pioneer Activity at Intractable Genomic Loci. Mol Cell 65, 589–603 e9 (2017). [DOI] [PMC free article] [PubMed] [Google Scholar]
- 67.Robinson JT et al. Integrative genomics viewer. Nat Biotechnol 29, 24–6 (2011). [DOI] [PMC free article] [PubMed] [Google Scholar]
- 68.Zhou X et al. The Human Epigenome Browser at Washington University. Nat Methods 8, 989–90 (2011). [DOI] [PMC free article] [PubMed] [Google Scholar]
- 69.Ahuja AK et al. A short G1 phase imposes constitutive replication stress and fork remodelling in mouse embryonic stem cells. Nature communications 7, 10660 (2016). [DOI] [PMC free article] [PubMed] [Google Scholar]
- 70.Fujii-Yamamoto H, Kim JM, Arai K & Masai H Cell cycle and developmental regulations of replication factors in mouse embryonic stem cells. J Biol Chem 280, 12976–87 (2005). [DOI] [PubMed] [Google Scholar]
- 71.Jorgensen HF et al. The impact of chromatin modifiers on the timing of locus replication in mouse embryonic stem cells. Genome Biol 8, R169 (2007). [DOI] [PMC free article] [PubMed] [Google Scholar]
Associated Data
This section collects any data citations, data availability statements, or supplementary materials included in this article.