

Summary
Although a rising concentration of cytosolic Ca2+ has long been recognized as an essential signal for apoptosis, the dynamical mechanisms by which Ca2+ regulates apoptosis are not clear yet. To address this, we constructed a computational model that integrates known biochemical reactions and can reproduce the dynamical behaviors of Ca2+-induced apoptosis as observed in experiments. Model analysis shows that oscillating Ca2+ signals first convert into gradual signals and eventually transform into a switch-like apoptotic response. Via the two processes, the apoptotic signaling pathway filters the frequency of Ca2+ oscillations effectively but instead responds acutely to their amplitude. Collectively, our results suggest that Ca2+ regulates apoptosis mainly via oscillation amplitude, rather than frequency, modulation. This study not only provides a comprehensive understanding of how oscillatory Ca2+ dynamically regulates the complex apoptotic signaling network but also presents a typical example of how Ca2+ controls cellular responses through amplitude modulation.
Subject Areas: Biological Sciences, Cell Biology, Mathematical Biosciences
Graphical Abstract
Highlights
-
•
A signaling network of cytosolic Ca2+-induced apoptosis is constructed
-
•
The network is converted into a mathematical model composed of four modules
-
•
Oscillatory signals first transform into gradual ones and then into switch-like ones
-
•
Ca2+ regulates apoptosis mainly via amplitude, rather than frequency, modulation
Biological Sciences; Cell Biology; Mathematical Biosciences
Introduction
Calcium ion (Ca2+) is one of the most versatile and universal signaling agents to translate extra- and intracellular information into specific cellular outcomes (Berridge et al., 1998; Giorgi et al., 2018a). Upon stimulation, Ca2+ is released from the endoplasmic reticulum (ER) into the cytosol through inositol 1,4,5-trisphosphate receptor (IP3R) channels. Changes in cytosolic Ca2+ concentration ([Ca2+]) of a moderate level can govern a myriad of vital cell functions, including fertilization, proliferation, and differentiation, and are essential for cell survival (Berridge et al., 2003). However, excessive elevations of [Ca2+] typically result in cell death, including apoptosis (Orrenius et al., 2003).
A cytosolic Ca2+ overload initiates the mitochondrial apoptotic pathway as follows. Ca2+ can activate calpain and calcineurin, causing the activation of BH3-only proteins (Chen et al., 2001; Wang et al., 1999). This results in the sequestering of anti-apoptotic Bcl-2 proteins and the activation of the pro-apoptotic effectors Bax and Bak (Czabotar et al., 2014; Youle and Strasser, 2008). These interaction patterns among Bcl-2 protein family culminate in Bax and Bak oligomerization and mitochondrial outer membrane permeabilization (MOMP) (Tait and Green, 2010). Subsequently, several apoptogenic factors are released from the mitochondrial intermembrane space, particularly cytochrome c (Cyt c) (Ow et al., 2008). In the cytosol, Cyt c engages Apaf1 and forms the apoptosome, which recruits caspase 9 and promotes caspase 3 activation. Active caspase 3 cleaves several hundred proteins, resulting in apoptosis (Shi, 2004). In addition, mitochondria retain cytosolic Ca2+ and this massive mitochondrial Ca2+ accumulation causes the opening of mitochondrial permeability transition pore, which leads to the Cyt c release and cell death (Qi and Shuai, 2016). Despite this detailed characterization of the molecular sequence of events, we still lack a comprehensive understanding of how Ca2+ dynamics control this complex apoptosis signaling network.
Differential equation modeling can simulate the dynamic output of individual proteins and can identify critical players in a signaling network, thus often providing novel insights to our understanding of cellular dynamics (Spencer and Sorger, 2011; Yao et al., 2016). Such modeling efforts have been devoted to understand intracellular Ca2+ dynamics (Dupont and Sneyd, 2017; Goldbeter et al., 1990; Li and Rinzel, 1994; Qi et al., 2015; Shuai and Jung, 2003; Sneyd et al., 2017) and the mechanistic details of the apoptotic pathway (Albeck et al., 2008; Anderson et al., 2019; Legewie et al., 2006; Qi et al., 2018; Rehm et al., 2006; Santos et al., 2019; Spencer and Sorger, 2011; Yin et al., 2017; Zhao et al., 2015). However, so far, Ca2+ signaling has not been mathematically integrated into models of apoptosis yet.
Two major types of Ca2+ temporal profiles have been reported in apoptotic cells, including a high plateau and oscillations (Boehning et al., 2003, Lee et al., 2010; Garcia et al., 2017). Oscillations of [Ca2+] in individual cells often occur as repetitive spikes or sinusoid-like oscillations (Berridge, 1990; Oancea and Meyer, 1998). In our study, we focused on investigating how cytosolic Ca2+ oscillations, especially sinusoidal oscillations, regulate apoptosis from a network dynamics perspective.
Typically, Ca2+ oscillations occur with periods from seconds to minutes (Uhlén and Fritz, 2010), whereas the apoptotic program normally takes between a few and several tens of hours (Garcia et al., 2017; Márquez-Jurado et al., 2018). Owing to technical limitations in producing distinct long-term Ca2+ oscillations in experimental setups of apoptotic processes, the switch from a fast oscillatory Ca2+ signal to a switch-like apoptotic response with a long latency remains unclear.
Ca2+ oscillations contain information in their amplitude and frequency, thus providing two ways to selectively activate downstream signaling pathways (Berridge, 1997; Parekh, 2011). It has been shown that some gene expression events (Li et al., 1998) and the activations of CaMKII (De Koninck and Schulman, 1998), PKC (Oancea and Meyer, 1998), and Ras (Kupzig et al., 2005), as well as ATP production (Hajnóczky et al., 1995), are regulated by the frequency of Ca2+ oscillations. These experimental observations, together with a well-known engineering principle that frequency modulation (FM) signaling is more precise than amplitude modulation (AM) signaling, have led to the prevailing view that Ca2+ controls cellular functions typically by an FM mode (Dupont and Combettes, 2016; Dupont and Sneyd, 2017; Goldbeter et al., 1990; Smedler and Uhlén, 2014). We have decided to investigate whether this is also the case during Ca2+-induced apoptosis.
To solve these two basic issues, we constructed a four-module network model, including Ca2+ oscillations, Ca2+-activated proteins, Bcl-2 family proteins, and Cyt c-induced caspase cascade. We transformed the biochemical reactions of the network into a set of ordinary differential equations (ODEs). The simulation results reveal that oscillatory Ca2+ signals will be first converted into gradual signals, i.e., the slowly and monotonically changed signals, and then be transformed into a switch-like apoptotic response. Furthermore, our results show that, with such converting processes, Ca2+ regulates apoptosis mainly through an AM mode, rather than through an FM mode. Our work provides crucial insight in the understanding of the modulatory role of Ca2+ signals on the apoptotic process.
Results
Model Construction
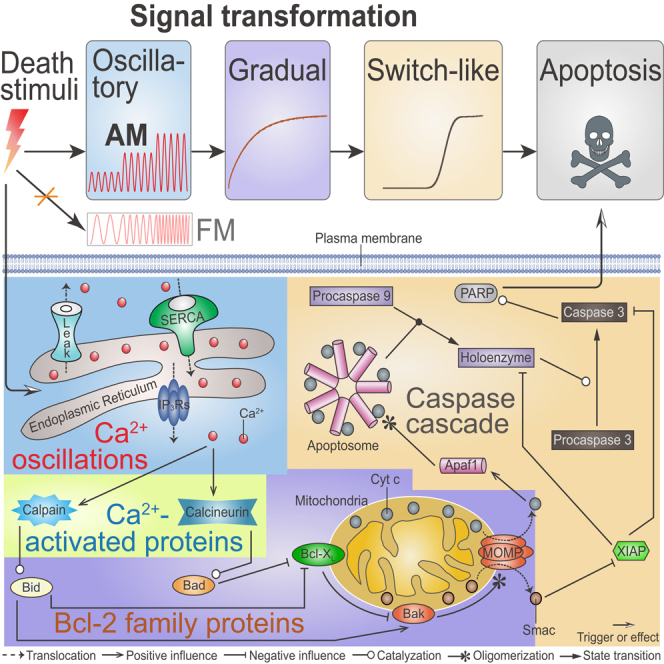
A complete picture of the role of Ca2+ as a mechanistic trigger of apoptosis is still missing. Based on previous works (Albeck et al., 2008; Rehm et al., 2006) and our recent studies (Qi et al., 2018; Qi and Shuai, 2016; Yin et al., 2017), we developed an integrative signaling network comprising four modules (Figure 1): (1) ER-involved Ca2+ oscillations, (2) Ca2+-activated proteins, (3) MOMP controlled by Bcl-2 family proteins on mitochondria, and (4) Cyt c-induced caspase cascade. The brief descriptions of each module are presented below (see details in Supplemental Information).
Figure 1.

Model Topology Scheme
The four modules are highlighted by different background colors. The blue region is for the module of Ca2+ oscillations, the green for the module of Ca2+-activated proteins, the purple for the module of MOMP controlled by Bcl-2 family proteins, and the yellow for the module of the Cyt c-induced caspase cascade. More details can be found in the main text.
Extracellular stimuli result in the formation of IP3 (inositol 1,4,5-trisphosphate), which binds to the IP3 receptors (IP3Rs) to release Ca2+ from the ER. Cytosolic Ca2+ oscillations derive from three mechanisms of ions exchange between the ER and the cytoplasm: IP3Rs-mediated Ca2+ release from the ER into the cytosol, SERCA (sarco/ER Ca2+-ATPase)-dependent Ca2+ uptake from the cytosol into the ER, and Ca2+ leakage from the ER into the cytosol (Shuai and Jung, 2003). An important machinery linking cytosolic Ca2+ signal and apoptosis is the activation of two Ca2+-regulated enzymes, i.e., calpain and calcineurin. In the presence of high [Ca2+], calcineurin dephosphorylates Bad, thus allowing Bad to inhibit the anti-apoptotic Bcl-XL (Wang et al., 1999). Calpain, which is normally inhibited by calpastatin (Hanna et al., 2008), cleaves Bid to form truncated Bid (tBid), which in turn can directly activate Bak or inhibit Bcl-XL that then indirectly activates Bak (Chen et al., 2001). Active Bak monomers form oligomers to trigger MOMP. Following MOMP, Smac and Cyt c are released from the mitochondria into the cytosol. In the cytosol, Cyt c binds Apaf1 to form the heptameric apoptosome, which interacts with procaspase 9 to induce the formation of holoenzyme, thereby triggering caspase 3 activation (Li et al., 2017). Caspase 3 can cleave a series of substrates (a process represented in the model by cleavage of PARP to form cPARP [Albeck et al., 2008]) and orchestrate the demolition of the cell. Smac assists this function by neutralizing the caspase inhibitor XIAP.
Using well-established kinetics approaches (Anderson et al., 2019; Qiao et al., 2019; Zhang et al., 2011), we translated these biochemical processes into a set of ODEs. Every variable represents the amount or concentration of a molecular species, which is dynamically controlled by the combination of all processes that increase and decrease the level of that particular molecular species. Each process is described by chemical kinetics, i.e., the mass action law or Hill function. The ODEs are numerically solved and the total simulation time was set to 18 h, the typical length of cell cycle (Spiller et al., 2010), reflecting the fact that a cell ultimately adopts one of two fates, either to survive by cell division or to die by apoptosis at the end of 18 h. In our model we assumed that the cell fate depends on the concentration of cleaved PARP ([cPARP]) within 18 h. A detailed description of all biochemical reactions, ODEs, and parameters is provided in Transparent Methods.
Dynamics of Ca2+ and cPARP
The simulation results we obtained are qualitatively consistent with the reported dynamics of Ca2+ (Dupont and Goldbeter, 1993; Gerasimenko et al., 2002; Jacob et al., 1988; Scorrano et al., 2003) and cPARP (Albeck et al., 2008; Rehm et al., 2006; Spencer and Sorger, 2011) upon incubation with apoptotic triggers. In many cell types, Ca2+ oscillations occur within an appropriate range of stimulus levels (Dupont and Goldbeter, 1993; Jacob et al., 1988). The time course plot (Figure 2A) and bifurcation diagram, i.e., the maximal and minimal value of Ca2+ oscillations (Figure 2B) show that, as the stimulus strength increases, the cytosolic Ca2+ changes from a stationary to an oscillatory behavior, before returning to a stationary state. The oscillation period is about 200 s (Figure 2C), as seen both in healthy and apoptotic cells (Gerasimenko et al., 2002; Scorrano et al., 2003). To define the apoptotic cell from the healthy cell, we proposed that apoptosis occurs when [cPARP] is above the apoptosis threshold of 1.02 μM, a value that corresponds to 60% substrate cleavage (dotted line in Figure 2D). This result agrees with the experimental result that apoptosis is triggered only when the level of substrate cleavage exceeds a high value (Rehm et al., 2006). Accordingly, when the multiple maximal concentration of sustained Ca2+ oscillations exceeds a critical threshold of about 3 μM (Figure 2B), apoptosis is initiated, which is compatible with the experimental observation for [Ca2+] under resting conditions and after stimulation (Giorgi et al., 2018b). Figure 2D also shows that the latency from the exposure to the apoptotic stimulus to the actual initiation of apoptosis is about 10 h, but the cleavage of PARP is sudden and switch-like, again in agreement with experimental observation (Albeck et al., 2008; Spencer and Sorger, 2011). The reasons for the selection of critical threshold of [Ca2+] and [cPARP] are detailed in Supplemental Information.
Figure 2.

The Dynamical Behavior of Ca2+ and cPARP at Different Stimulus Strengths
(A) Different kinetic behaviors of Ca2+ in response to different stimuli lasting for 18 h.
(B) Bifurcation diagram of Ca2+ in response to different stimuli. Solid/dashed lines represent stable/unstable fixed point; filled/empty circles represent minimal (orange) and maximal (green) [Ca2+] during a stable/unstable oscillation.
(C) Periods of Ca2+ oscillations within the stable oscillation range.
(D) The kinetic behavior of cPARP responding to different stimuli.
(E and F) The final [cPARP] (E) and the apoptosis latency (F) at different stimulus strengths.
The dotted lines in (B), (D), and (E) depict the apoptosis threshold.
It should be pointed out that, in order to provide a global view of the dynamical behavior of the system, the bifurcation diagram of Ca2+ is obtained mathematically with the steady states of the system (Figure 2B). However, considering the biological fact that a cell ultimately commits to apoptosis or to division at a limited time duration, we simply limited the discussion of the cell fate within 18 h for all the simulation results.
Two Indexes for Apoptosis
The relationship between the stimulus strength and the corresponding final [cPARP] yields an ultrasensitive signal-response curve (Figure 2E). Here [cPARP] at 18 h is defined as the final [cPARP], which is used as an index for cell fate. In detail, the fate of a cell is survival if the final [cPARP]<1.02 μM; otherwise, the apoptosis process is initiated. This result is insensitive to the variations in the cell cycle, i.e., total simulation time (Figure S2C). If apoptosis is triggered, another index, i.e., the apoptosis latency is introduced to evaluate how quickly apoptosis can be induced. In other words, it measures the interval between the time when the stimulus is applied and the time when the increasing [cPARP] crosses the apoptosis threshold of 1.02 μM. As shown in Figure 2F, the stronger the stimulus intensity is, the shorter the apoptosis latency becomes.
Signal Transduction
Given the different dynamics of Ca2+ and cPARP (Figures 2A and 2D), it is curious how the fast oscillatory Ca2+ signal is converted into a slow but switch-like apoptotic signal. To address this question, we analyzed the time series of the main reaction species along the reaction pathway (Figure 3A). These species include Ca2+, aCalp (activated calpain), Bid, tBid, MOMP, Cyt c, holoenzyme, caspase 3, and cPARP. According to the kinetic patterns of these species, we observed that the oscillatory patterns starting with Ca2+ signal first become gradual for proteins such as Bid, and then become switch-like for proteins such as caspase 3.
Figure 3.

Transition from Oscillatory to Switch-like Kinetics
(A) Time courses of the main species in the signaling network. The vertical dashed line indicates the time at which the stimulus (strength = 0.73) is introduced. The green and orange shaded regions denote the transient time and the switch time, respectively. The time at which mitochondrial Cyt c begins to release into the cytosol is marked by an asterisk.
(B and C) (B) Oscillation coefficient (COsc) and (C) transient time (TTra) of five upstream species. SMax and SMin are the maximal and minimal concentrations of a certain species at the steady state, respectively.
(D) Time series and COsc of Bid and tBid with the association rate of aCalp and Bid increased by 1,000-fold.
(E) Switch time (TSwi) of gradual and switch-like signals. The horizontal dashed line at 2 h is applied to distinguish the switch-like signals from the gradual ones.
(F) Time series of Casp3 and cPARP when the association rate of holoenzyme and procaspase 3 is decreased by 10% (broken lines). The results obtained under standard parameter are the same as in (A) and are shown to facilitate comparison. The insets in (A) and (D) show representative time courses of 1.5 h. The units of y axes in (A), (D), and (F) are nM. Abbreviation: aCalp, activated calpain; Holo, holoenzyme; Casp3, caspase 3.
As shown in Figure 3A, the transition from oscillatory to gradual pattern involves two changes. First, the oscillation amplitudes of the upstream species become successively smaller. In detail, it is about 3,000 nM for Ca2+, nearly 3 nM for aCalp, only 0.03 nM for Bid and tBid, and barely perceptible for MOMP. To compare the oscillation strength among different species with a uniform standard, an oscillation coefficient, which is the ratio of oscillation amplitude to mean (looks like the deterministic version of the coefficient of variation), is calculated (Figure 3B). As a consequence, the oscillation coefficients of Ca2+ and aCalp are far larger than those of Bid, tBid, and MOMP. Here we define a signal as oscillatory if the oscillation coefficient of a species is larger than 0.1. Accordingly, the signals of Bid, tBid, and MOMP are not considered oscillatory. Second, upon stimulation, the system transitions from a resting steady state to a new equilibrium state, generating a transient time, which is defined as the time required for oscillatory species to reach steady oscillation or for other species to reach 90% of their peaks. As a result, the transient times for Ca2+, aCalp, Bid, tBid, and MOMP are about 0.1, 0.5, 6, 6, and 12 h, respectively (Figure 3C), becoming successively longer. Compared with the length of cell cycle (18 h), a transient time longer than 6 h is a duration that is not negligible. Therefore, we suggest that such a non-oscillatory signal with long transient time should be labeled as gradual. According to the oscillation coefficient and transient time, we therefore classify Ca2+ and aCalp as oscillatory signals and Bid, tBid, and MOMP as gradual signals.
Obviously the most dramatic change in the kinetics from Ca2+ to MOMP occurs upon the truncation of Bid by aCalp. The result of parameter sensitivity analysis also shows that this step indeed exerts a substantial influence on the output of the system (Figure S2B). Interestingly, the kinetics of Bid owns two distinct timescales. On the one hand, Bid oscillates at a fast timescale of around 200 s. On the other hand, a gradually decreasing trend occurs for Bid in a slower timescale of about 6 h as a transient process (Figure 3A). Meanwhile, the oscillation amplitude is far smaller than the mean value of its steady oscillations. This is mainly due to the slow truncation reaction of Bid by aCalp, which directly results in a long transient time and also generates a small oscillation amplitude for Bid by averaging aCalp over a long duration with slow association rate of aCalp with Bid (5 × 10⁻⁶ nM−1s−1). If this rate is increased 1,000-fold, Bid will achieve its new equilibrium very quickly and its oscillation coefficient will be 0.44 (Figure 3D), thus becoming an oscillatory signal. The slow truncation of Bid by aCalp, therefore, plays a significant role to convert the oscillatory signals to gradual signals in this pathway.
The kinetics from Bid to cPARP (Figure 3A) shows a transition from a gradual pattern to a switch-like pattern. Here, we distinguish a switch-like signal from gradual signal according to their switch time, which is defined as the time it takes to progress from a 30% to a 70% final concentration of any reaction species. If its switch time is longer than 2 h, it is labeled a gradual signal; otherwise, it is labeled a switch-like signal. According to this classification, Bid, tBid, MOMP, Cyt c, and holoenzyme are gradual signals, whereas caspase 3 and cPARP are switch-like signals (Figure 3E). If the switch time is defined as the time for a signal to increase from 20% to 80% of its final value, similar results are obtained, albeit with a longer switch time.
As a gradual signal, the MOMP-released Cyt c leads to a gradual accumulation of the apoptosome and thus the holoenzyme. In detail, before MOMP accumulates to reach a threshold, Cyt c cannot be released, thus maintaining Cyt c and downstream signals in an “off” state. After MOMP reaches the threshold at about 9 h (marked by asterisk in Figure 3A), the Cyt c-induced holoenzyme assembly ensures the downstream signals switch to an “on” state.
The conversion from gradual to switch-like signals is regulated by multiple reactions, including the mechanics of MOMP assembly, mitochondria-to-cytosol translocation of Smac and Cyt c (Albeck et al., 2008), the direct repression of holoenzyme and caspase 3 by XIAP (Figure S3), and holoenzyme-mediated activation of caspase 3. As seen in Figure 3A, holoenzyme activation results in a sudden and rapid cleavage of caspase 3 and thus the processing of PARP into cPARP, suggesting that the conversion from gradual to switch-like signals is strongly influenced by the interaction between holoenzyme and procaspase 3. If the association rate of holoenzyme and procaspase 3 (1.0 μM−1s−1) is decreased to 10%, the original switch-like signals, i.e., caspase 3 and cPARP, will become gradual signals (Figure 3F). Thus, the holoenzyme-mediated activation of caspase 3 has a crucial influence on the conversion from gradual into switch-like signals.
Three Ideal Ca2+ Inputs
Since both the amplitude and frequency of the ER-involved Ca2+ oscillations largely increase with stimulus strength (Figures 2B and 2C), it is hard to dissect the individual contributions of amplitude and frequency to apoptosis. To explore whether amplitude or frequency of Ca2+ oscillations is the critical determinant for Ca2+-induced apoptosis, three ideal Ca2+ waveforms and their effects on the two indexes for evaluating apoptosis are presented in Figure 4.
Figure 4.

Three Ideal Ca2+ Inputs and Their Impact on Apoptosis
(A and B) The final [cPARP] (A) and apoptosis latency (B) as a function of the amplitude of constant Ca2+ input. (C) The final [cPARP] in response to the amplitude and period (varying Tw with the unchanged Ti) of square-wave Ca2+ input. (D and E) The final [cPARP] (D) and apoptosis latency (E) in response to the amplitude and Tw with the fixed period of square-wave Ca2+ input. (F and G) The dependence of the final [cPARP] (F) and apoptosis latency (G) on the amplitude and period of sinusoidal Ca2+ input. (C), (D), and (F) have the same color bar at the bottom, whereas (E) and (G) share the same color bar on the right.
First a constant Ca2+ input is imposed to assess its efficacy in triggering apoptosis. Figure 4A shows that, as the amplitude of the constant Ca2+ increases, the final [cPARP] exhibits an almost all-or-none pattern. When the amplitude increases beyond an apoptotic threshold, the apoptosis latency decreases first rapidly and then slowly approaches 5 h (Figure 4B). Different from the high amplitude threshold of 3 μM [Ca2+] for apoptosis with an oscillatory Ca2+ signal, a small [Ca2+] threshold of 1.5 μM is obtained with constant Ca2+ input for apoptosis. These results suggest that Ca2+ amplitude alone is sufficient to cause a low or high final [cPARP], corresponding to survival or apoptosis of cells.
Second, we used a square-wave Ca2+ input to investigate the roles of its amplitude and frequency in regulating apoptosis. For such a pulsating Ca2+ signal, besides the amplitude, we can define the wave width (Tw) and inter-wave interval (Ti), which can be varied separately, as well as the period (Tw + Ti). Such type of signal has been used experimentally (De Koninck and Schulman, 1998) and in mathematical models (Marhl et al., 2006; Salazar et al., 2008). In the case of varied wave width but fixed inter-wave interval, the contour map in Figure 4C shows that the final [cPARP] mainly depends on the Ca2+ amplitude but not on the wave width and of course not on its period. Figure 4D shows the dependence of final [cPARP] on the Ca2+ amplitude and wave width, while keeping the period constant. From the apoptosis threshold (dashed line) shown in Figure 4D, one can see that the final [cPARP] is high when the Ca2+ amplitude is large (>1.5 μM) and the wave width is long (>75 s). Thus, the Ca2+ amplitude is the dominant pro-apoptotic factor.
The comparison of the results in Figures 4C and 4D reveals that the final [cPARP] depends less on oscillation period than on its wave width. Next, we examined the influence of the Ca2+ amplitude and wave width on apoptosis latency. The result plotted in Figure 4E indicates that apoptosis latency is less sensitive to wave width than to wave amplitude. A similar but more obvious trend for apoptosis latency can be found when comparing Ca2+ amplitude and period (Figure S4). Together, the results obtained in Figures 4C–4E and S4 indicate that apoptosis is mainly modulated by amplitude, rather than frequency of a square-wave Ca2+ input.
Third we used sinusoidal Ca2+ input to further strengthen the conclusion that apoptosis depends more on amplitude than on frequency. The sinusoidal input mimics more closely biological Ca2+ oscillations, and its oscillation amplitude and period can be varied separately. Figure 4F shows that the final [cPARP] exhibits only a modest response to the change of Ca2+ oscillation period but a pronounced sensitivity to the change of oscillation amplitude. Notably, a cell remains alive when its Ca2+ amplitude is small but undergoes apoptosis when the amplitude is large, regardless of the oscillation period. This result holds true when the top two most sensitive parameters are varied in a limited range (Figures S5). In addition, the change in Ca2+ amplitude significantly influences apoptosis latency, whereas its period does not (Figure 4G). These results reveal that AM is the dominant mechanism for Ca2+-regulated apoptosis.
In summary, by virtue of three ideal Ca2+ waveforms, we demonstrated that cytosolic Ca2+ regulates apoptosis mainly via AM but not via FM. Although the Ca2+ amount or average Ca2+ and action time of Ca2+ input also have impacts on apoptosis (Figures S6 and S7), these factors appear insignificant.
Signal Transduction of Sinusoidal Ca2+ Input
Given that sinusoidal Ca2+ oscillations can mimic one of the two biologically oscillatory patterns (the sinusoid-like oscillations and the repetitive spikes) in vivo (Berridge, 1990; Putney and Bird, 1993), we explored the roles of amplitude and frequency of sinusoidal Ca2+ oscillations in the apoptotic signal transduction pathway. Figure 5A presents the temporal evolution of four key species in the signal transduction process where the Ca2+ amplitude is 2.5 μM and its period is 200 s. Here, aCalp is an oscillatory signal, tBid and holoenzyme are gradual signals, and cPARP is a switch-like signal, which are almost the same as those induced by the ER-involved Ca2+ oscillations (Figure 3A).
Figure 5.

Effects of Amplitude and Period of Sinusoidal Ca2+ Input on Signal Transduction
(A-C) Time series of representative species such as aCalp, tBid, Holo, and cPARP (A) at amplitude = 2.5 μM and period = 200 s, (B) at amplitude = 2.5 μM and period = 50 s or 200 s, and (C) at period = 200 s and amplitude = 2 μM or 3 μM. The units of y axes are nM.
(D) Oscillation coefficient (COsc) of aCalp and tBid, transient time (TTra) of MOMP and cPARP, and switch time (TSwi) of Casp3 and cPARP, keeping the amplitude constant at 2.5 μM and changing the period.
(E) COsc, TTra, and TSwi of the main species are normalized to the corresponding value at amplitude = 2.5 μM and period = 200 s, as indicated by the arrows in (D).
(F and G) (F) and (G) are the counterparts of (D) and (E), respectively, but at fixed period of 200 s and varying amplitude. In the box plot, the middle line denotes the median; the top and bottom of the box denote 75th and 25th percentiles, respectively; whiskers denote 1.5×interquartile range; and diamonds denote outliers. Abbreviation: aCalp, activated calpain; Holo, holoenzyme; Casp3, caspase 3.
If the period of sinusoidal Ca2+ input becomes significantly shorter or longer, i.e., 50 s or 500 s, the kinetics of the four species change slightly (Figure 5B). The frequency information carried in Ca2+ oscillations becomes largely suppressed within the gradual signal of tBid. In contrast, if the amplitude of sinusoidal Ca2+ input becomes smaller or bigger, i.e., 2 or 3 μM, the kinetics of the four species change significantly, especially for the holoenzyme and cPARP (Figure 5C). A decreased amplitude causes the original switch-like cPARP signal to become a gradual signal, and the eventual cell fate changes from apoptosis to survival. An increased amplitude transforms the original gradual holoenzyme signal into a switch-like signal, and the apoptosis latency becomes dramatically shorter. The time course study suggests that the signal transduction from Ca2+ to tBid acts as a frequency filter of the Ca2+ oscillation information. Moreover, the information of the Ca2+ amplitude is important to determine the final intensity of the gradual signals, which is in turn crucial to determine the curve pattern of cPARP.
To gain further insights into these mechanisms, we analyzed how the changes in the period and amplitude of a sinusoidal Ca2+ input affect the oscillation coefficient, transient time, and switch time of the key species.
First, we considered the situation where the sinusoidal Ca2+ period changes from 10 to 1,000 s, while keeping the amplitude constant at 2.5 μM. Figure 5D depicts the change of the oscillation coefficients of aCalp and tBid, the transient times of MOMP and cPARP, and the switch times of caspase 3 and cPARP against the sinusoidal Ca2+ period. In order to clearly describe the process of information transformation, Figure S8A shows the distribution of the values of the three characteristic times of all key species. To accommodate the wide range of values, these values are normalized with respect to the corresponding value at period = 200 s, and each box plot in Figure 5E exhibits the distribution of the normalized values. Then, we considered the situation where the sinusoidal Ca2+ amplitude varies from 2 to 4 μM, while keeping the period constant at 200 s. Figures 5F, 5G, and S8B are the counterparts of Figures 5D, 5E, and S8A, respectively.
Figures 5D and 5F show that the oscillation coefficient of aCalp is far larger than that of tBid, which indicates that the frequency attribute of Ca2+ oscillations is only well retained in the aCalp signal, whereas it is largely lost in the gradual signals. When comparing Figures 5E and 5G, it is evident that the change in the period of a sinusoidal Ca2+ input only significantly affects the oscillation coefficients of the two upstream gradual signals, i.e., Bid and tBid, whereas the change in the Ca2+ amplitude dramatically modulates both the transient times and switch times of the downstream species, especially for the switch-like signals, i.e., caspase 3 and cPARP. Together, these results imply that the Ca2+-regulated apoptotic transduction pathway is capable of efficiently filtering the frequency attribute during the transformation from oscillatory signals to gradual signals but capable of sensitively responding to the amplitude attribute of the Ca2+ oscillations. Hence, the results here reveal the underlying mechanism that Ca2+ signal regulates apoptosis mainly via the Ca2+ oscillation amplitude, rather than via its frequency.
Discussion
Given the difficulties of experimentally tracking long-term Ca2+ signaling dynamics simultaneously with apoptotic protein processing, it is currently unknown how a fast and oscillatory Ca2+ signal transforms into a slow but switch-like apoptotic response. How Ca2+ signaling regulates apoptosis has also remained elusive because the amplitude and period of Ca2+ oscillations cannot be manipulated independently within a biological system. We address these two fundamental questions with a mathematical model for deciphering the mechanism underlying Ca2+-induced apoptosis.
Our results indicate that the conversion of an oscillatory Ca2+ signal into a switch-like apoptotic signal requires two steps. In the first step, oscillatory signals transform into gradual signals during which the oscillation amplitudes of the upstream species in signal cascade decrease successively, meanwhile their transient times to the new equilibrium increase successively. During this transformation, the slow truncation of Bid by aCalp plays a significant role. In the second step, gradual signals are converted into switch-like signals, during which the switch times of the downstream species in the apoptotic signaling pathway decrease dramatically. This process critically depends on the fast activation of caspase 3 by the holoenzyme.
Cellular information can be encoded in the amplitude and frequency of Ca2+ oscillations, and that information can then be decoded by distinct downstream effectors to achieve different cellular outcomes (Berridge, 1997; Monteith et al., 2017). The predominant view is that the cellular function is determined by the frequency of Ca2+ oscillations (Dupont and Combettes, 2016; Dupont and Sneyd, 2017; Goldbeter et al., 1990; Smedler and Uhlén, 2014). In contrast, our results show that the amplitude of Ca2+ oscillations is primarily used to modulate apoptosis in three different systems, that is, in the constant, square-wave, and sinusoidal Ca2+ input systems. Of note, the elucidation in the last system is compelling not only because sinusoidal Ca2+ input has separable amplitude and period but also because it can largely mimic the biologically oscillatory pattern observed in cells. Strikingly, by employing sinusoidal Ca2+ input, we revealed that the frequency property of Ca2+ oscillations is filtered but the amplitude property is retained during the apoptotic signal transduction process. During the process to translate these oscillatory signals into gradual signals, the oscillatory Ca2+ signal is converted into a non-oscillatory signal by filtering out the frequency information. Thus, the amplitude, other than the frequency, of Ca2+ oscillations, functions as the more important attribute for apoptosis induction.
The mechanisms by which cells encode the dynamic properties of oscillatory signaling (e.g., amplitude and/or frequency) into their decision-making processes are the subject of very intense investigation (Benzinger and Khammash, 2018; Cai et al., 2008; Hannanta-anan and Chow, 2016; Hansen and O'Shea, 2015). For a Ca2+ signal, it is generally believed that AM is less reliable than FM, owing to the difficulty of distinguishing small Ca2+ changes from the background noise level (Berridge et al., 1998). However, the fidelity of apoptotic Ca2+ signal can by guaranteed through AM mode because the apoptotic Ca2+ levels are much higher than those produced by spontaneous fluctuation. Indeed, a recent experiment revealed that individual cells exhibit high amplitude Ca2+ release events but significant heterogeneity in the frequency of these events after treatment with apoptosis-inducing drugs (Garcia et al., 2017). In addition, Monteith et al. recently proposed that it is the amplitude of Ca2+ oscillations that controls cell fate (e.g., proliferation or cell death), whereas it is their frequency that controls gene transcription (Monteith et al., 2017). Our finding demonstrates that Ca2+-regulated apoptosis is a typical example of AM fashion, which is a key perspective in the field of Ca2+ signaling.
Limitations of the Study
Although Ca2+ oscillations are intrinsically stochastic because of stochastic IP3R channel dynamics (Powell et al., 2020; Thul, 2014; Thurley et al., 2012), the Ca2+ oscillations at the cellular level can be effectively treated as deterministic (Cao et al., 2014; Sneyd et al., 2017; Voorsluijs et al., 2019). As a result, we only used the two-variable Li-Rinzel model as the simplest but useful model to produce Ca2+ oscillations. The focus of this work is on cytosolic Ca2+-induced apoptosis, and for simplicity, we did not take mitochondrial Ca2+ into account. In addition, the prediction of AM given in the paper largely depends on a sinusoidal type of Ca2+ oscillations. Thus, whether our prediction can be generalized to other types of Ca2+ oscillations such as repetitive spikes remains an open question for future study. Furthermore, the test of this prediction will rely on the experimental design that can compare directly the effects of the amplitude and period of cytosolic Ca2+ oscillations on the apoptosis.
Resource Availability
Lead Contact
Jianwei Shuai
Materials Availability
This study did not generate new unique reagents.
Data and Code Availability
All data needed to evaluate the conclusions in the paper are present in the paper and/or the Supplemental Information. The code related to this paper may be requested from the authors.
Methods
All methods can be found in the accompanying Transparent Methods supplemental file.
Acknowledgments
This work was supported by National Natural Science Foundation of China (Grants 11675134, 11874310, 11504214, 11704318, and 61873154), Shanxi Province Science Foundation for Youths (Grant 201901D211159), Scientific and Technological Innovation Programs of Higher Education Institutions in Shanxi (Grant 2019L0015), Natural Sciences and Engineering Research Council of Canada (Grant RGPIN-2015-04105)
Author Contributions
H.Q. and J.S. designed research; H.Q. and X.L. performed research; X.L., Z.J., and T.S. analyzed data; H.Q., T.S., and J.S. wrote the paper.
Declaration of Interests
The authors declare no conflict of interest.
Published: November 20, 2020
Footnotes
Supplemental Information can be found online at https://doi.org/10.1016/j.isci.2020.101671.
Contributor Information
Hong Qi, Email: hongqi@sxu.edu.cn.
Jianwei Shuai, Email: jianweishuai@xmu.edu.cn.
Supplemental Information
References
- Albeck J.G., Burke J.M., Spencer S.L., Lauffenburger D.A., Sorger P.K. Modeling a snap-action, variable-delay switch controlling extrinsic cell death. PLoS Biol. 2008;6:e299. doi: 10.1371/journal.pbio.0060299. [DOI] [PMC free article] [PubMed] [Google Scholar]
- Anderson M.W., Moss J.J., Szalai R., Lane J.D. Mathematical modeling highlights the complex role of AKT in TRAIL-induced apoptosis of colorectal carcinoma cells. iScience. 2019;12:182–193. doi: 10.1016/j.isci.2019.01.015. [DOI] [PMC free article] [PubMed] [Google Scholar]
- Benzinger D., Khammash M. Pulsatile inputs achieve tunable attenuation of gene expression variability and graded multi-gene regulation. Nat. Commun. 2018;9:3521. doi: 10.1038/s41467-018-05882-2. [DOI] [PMC free article] [PubMed] [Google Scholar]
- Berridge M.J. Calcium oscillations. J. Biol. Chem. 1990;265:9583–9586. [PubMed] [Google Scholar]
- Berridge M.J. The AM and FM of calcium signalling. Nature. 1997;386:759–760. doi: 10.1038/386759a0. [DOI] [PubMed] [Google Scholar]
- Berridge M.J., Bootman M.D., Lipp P. Calcium - a life and death signal. Nature. 1998;395:645–648. doi: 10.1038/27094. [DOI] [PubMed] [Google Scholar]
- Berridge M.J., Bootman M.D., Roderick H.L. Calcium signalling: dynamics, homeostasis and remodelling. Nat. Rev. Mol. Cell Biol. 2003;4:517–529. doi: 10.1038/nrm1155. [DOI] [PubMed] [Google Scholar]
- Boehning D., Patterson R.L., Sedaghat L., Glebova N.O., Kurosaki T., Snyder S.H. Cytochrome c binds to inositol (1, 4, 5) trisphosphate receptors, amplifying calcium-dependent apoptosis. Nat. Cell Biol. 2003;5:1051–1061. doi: 10.1038/ncb1063. [DOI] [PubMed] [Google Scholar]
- Cai L., Dalal C.K., Elowitz M.B. Frequency-modulated nuclear localization bursts coordinate gene regulation. Nature. 2008;455:485–490. doi: 10.1038/nature07292. [DOI] [PMC free article] [PubMed] [Google Scholar]
- Cao P., Tan X., Donovan G., Sanderson M.J., Sneyd J. A deterministic model predicts the properties of stochastic calcium oscillations in airway smooth muscle cells. PLoS Comput. Biol. 2014;10:e1003783. doi: 10.1371/journal.pcbi.1003783. [DOI] [PMC free article] [PubMed] [Google Scholar]
- Chen M., He H., Zhan S., Krajewski S., Reed J.C., Gottlieb R.A. Bid is cleaved by calpain to an active fragment in vitro and during myocardial ischemia/reperfusion. J. Biol. Chem. 2001;276:30724–30728. doi: 10.1074/jbc.M103701200. [DOI] [PubMed] [Google Scholar]
- Czabotar P.E., Lessene G., Strasser A., Adams J.M. Control of apoptosis by the Bcl-2 protein family: implications for physiology and therapy. Nat. Rev. Mol. Cell Biol. 2014;15:49–63. doi: 10.1038/nrm3722. [DOI] [PubMed] [Google Scholar]
- Dupont G., Combettes L. Fine tuning of cytosolic Ca2+ oscillations. F1000Res. 2016;5:1–9. doi: 10.12688/f1000research.8438.1. [DOI] [PMC free article] [PubMed] [Google Scholar]
- Dupont G., Goldbeter A. One-pool model for Ca2+ oscillations involving Ca2+ and inositol 1,4,5-trisphosphate as co-agonists for Ca2+ release. Cell Calcium. 1993;14:311–322. doi: 10.1016/0143-4160(93)90052-8. [DOI] [PubMed] [Google Scholar]
- Dupont G., Sneyd J. Recent developments in models of calcium signalling. Curr. Opin. Syst. Biol. 2017;3:15–22. [Google Scholar]
- Garcia M.I., Chen J.J., Boehning D. Genetically encoded calcium indicators for studying long-term calcium dynamics during apoptosis. Cell Calcium. 2017;61:44–49. doi: 10.1016/j.ceca.2016.12.010. [DOI] [PMC free article] [PubMed] [Google Scholar]
- Gerasimenko J.V., Gerasimenko O.V., Palejwala A., Tepikin A.V., Petersen O.H., Watson A.J. Menadione-induced apoptosis: roles of cytosolic Ca2+ elevations and the mitochondrial permeability transition pore. J. Cell Sci. 2002;115:485–497. doi: 10.1242/jcs.115.3.485. [DOI] [PubMed] [Google Scholar]
- Giorgi C., Marchi S., Pinton P. The machineries, regulation and cellular functions of mitochondrial calcium. Nat. Rev. Mol. Cell Biol. 2018;19:713–730. doi: 10.1038/s41580-018-0052-8. [DOI] [PubMed] [Google Scholar]
- Giorgi C., Danese A., Missiroli S., Patergnani S., Pinton P. Calcium dynamics as a machine for decoding signals. Trends Cell Biol. 2018;28:258–273. doi: 10.1016/j.tcb.2018.01.002. [DOI] [PubMed] [Google Scholar]
- Goldbeter A., Dupont G., Berridge M.J. Minimal model for signal-induced Ca2+ oscillations and for their frequency encoding through protein phosphorylation. Proc. Natl. Acad. Sci. U S A. 1990;87:1461–1465. doi: 10.1073/pnas.87.4.1461. [DOI] [PMC free article] [PubMed] [Google Scholar]
- Hajnóczky G., Robb-Gaspers L.D., Seitz M.B., Thomas A.P. Decoding of cytosolic calcium oscillations in the mitochondria. Cell. 1995;82:415–424. doi: 10.1016/0092-8674(95)90430-1. [DOI] [PubMed] [Google Scholar]
- Hanna R.A., Campbell R.L., Davies P.L. Calcium-bound structure of calpain and its mechanism of inhibition by calpastatin. Nature. 2008;456:409–412. doi: 10.1038/nature07451. [DOI] [PubMed] [Google Scholar]
- Hannanta-anan P., Chow B.Y. Optogenetic control of calcium oscillation waveform defines NFAT as an integrator of calcium load. Cell Syst. 2016;2:283–288. doi: 10.1016/j.cels.2016.03.010. [DOI] [PMC free article] [PubMed] [Google Scholar]
- Hansen A.S., O'Shea E.K. Limits on information transduction through amplitude and frequency regulation of transcription factor activity. Elife. 2015;4:e06559. doi: 10.7554/eLife.06559. [DOI] [PMC free article] [PubMed] [Google Scholar]
- Jacob R., Merritt J.E., Hallam T.J., Rink T.J. Repetitive spikes in cytoplasmic calcium evoked by histamine in human endothelial cells. Nature. 1988;335:40–45. doi: 10.1038/335040a0. [DOI] [PubMed] [Google Scholar]
- De Koninck P., Schulman H. Sensitivity of CaM kinase II to the frequency of Ca2+ oscillations. Science. 1998;279:227–230. doi: 10.1126/science.279.5348.227. [DOI] [PubMed] [Google Scholar]
- Kupzig S., Walker S.A., Cullen P.J. The frequencies of calcium oscillations are optimized for efficient calcium-mediated activation of Ras and the ERK/MAPK cascade. Proc. Natl. Acad. Sci. U S A. 2005;102:7577–7582. doi: 10.1073/pnas.0409611102. [DOI] [PMC free article] [PubMed] [Google Scholar]
- Lee J.K., Lu S., Madhukar A. Real-time dynamics of Ca2+, caspase-3/7, and morphological changes in retinal ganglion cell apoptosis under elevated pressure. PloS one. 2010;5:e13437. doi: 10.1371/journal.pone.0013437. [DOI] [PMC free article] [PubMed] [Google Scholar]
- Legewie S., Blüthgen N., Herzel H. Mathematical modeling identifies inhibitors of apoptosis as mediators of positive feedback and bistability. PLoS Comput. Biol. 2006;2:e120. doi: 10.1371/journal.pcbi.0020120. [DOI] [PMC free article] [PubMed] [Google Scholar]
- Li Y.-X., Rinzel J. Equations for InsP3 receptor-mediated [Ca2+]i oscillations derived from a detailed kinetic model: a Hodgkin-Huxley like formalism. J. Theor. Biol. 1994;166:461–473. doi: 10.1006/jtbi.1994.1041. [DOI] [PubMed] [Google Scholar]
- Li W.-h., Llopis J., Whitney M., Zlokarnik G., Tsien R.Y. Cell-permeant caged InsP3 ester shows that Ca2+ spike frequency can optimize gene expression. Nature. 1998;392:936–941. doi: 10.1038/31965. [DOI] [PubMed] [Google Scholar]
- Li Y., Zhou M., Hu Q., Bai X.-c., Huang W., Scheres S.H., Shi Y. Mechanistic insights into caspase-9 activation by the structure of the apoptosome holoenzyme. Proc. Natl. Acad. Sci. U S A. 2017;114:1542–1547. doi: 10.1073/pnas.1620626114. [DOI] [PMC free article] [PubMed] [Google Scholar]
- Marhl M., Perc M., Schuster S. A minimal model for decoding of time-limited Ca2+ oscillations. Biophys. Chem. 2006;120:161–167. doi: 10.1016/j.bpc.2005.11.005. [DOI] [PubMed] [Google Scholar]
- Márquez-Jurado S., Díaz-Colunga J., Das Neves R.P., Martinez-Lorente A., Almazán F., Guantes R., Iborra F.J. Mitochondrial levels determine variability in cell death by modulating apoptotic gene expression. Nat. Commun. 2018;9:389. doi: 10.1038/s41467-017-02787-4. [DOI] [PMC free article] [PubMed] [Google Scholar]
- Monteith G.R., Prevarskaya N., Roberts-Thomson S.J. The calcium-cancer signalling nexus. Nat. Rev. Cancer. 2017;17:367–380. doi: 10.1038/nrc.2017.18. [DOI] [PubMed] [Google Scholar]
- Oancea E., Meyer T. Protein kinase C as a molecular machine for decoding calcium and diacylglycerol signals. Cell. 1998;95:307–318. doi: 10.1016/s0092-8674(00)81763-8. [DOI] [PubMed] [Google Scholar]
- Orrenius S., Zhivotovsky B., Nicotera P. Regulation of cell death: the calcium–apoptosis link. Nat. Rev. Mol. Cell Biol. 2003;4:552–565. doi: 10.1038/nrm1150. [DOI] [PubMed] [Google Scholar]
- Ow Y.-L.P., Green D.R., Hao Z., Mak T.W. Cytochrome c: functions beyond respiration. Nat. Rev. Mol. Cell Biol. 2008;9:532–542. doi: 10.1038/nrm2434. [DOI] [PubMed] [Google Scholar]
- Parekh A.B. Decoding cytosolic Ca2+ oscillations. Trends Biochem. Sci. 2011;36:78–87. doi: 10.1016/j.tibs.2010.07.013. [DOI] [PubMed] [Google Scholar]
- Powell J., Falcke M., Skupin A., Bellamy T., Kypraios T., Thul R. A statistical view on calcium oscillations. Adv. Exp. Med. Biol. 2020;1131:799–826. doi: 10.1007/978-3-030-12457-1_32. [DOI] [PubMed] [Google Scholar]
- Putney J.W., Jr., Bird G.S.J. The inositol phosphate-calcium signaling system in nonexcitable cells. Endocr. Rev. 1993;14:610–631. doi: 10.1210/edrv-14-5-610. [DOI] [PubMed] [Google Scholar]
- Qi H., Shuai J. Alzheimer's disease via enhanced calcium signaling caused by the decrease of endoplasmic reticulum–mitochondrial distance. Med. Hypotheses. 2016;89:28–31. doi: 10.1016/j.mehy.2016.01.022. [DOI] [PubMed] [Google Scholar]
- Qi H., Li L., Shuai J. Optimal microdomain crosstalk between endoplasmic reticulum and mitochondria for Ca2+ oscillations. Sci. Rep. 2015;2015:7984. doi: 10.1038/srep07984. [DOI] [PMC free article] [PubMed] [Google Scholar]
- Qi H., Jiang Y., Yin Z., Jiang K., Li L., Shuai J. Optimal pathways for the assembly of the Apaf-1·cytochrome c complex into apoptosome. Phys. Chem. Chem. Phys. 2018;20:1964–1973. doi: 10.1039/c7cp06726g. [DOI] [PubMed] [Google Scholar]
- Qiao L., Zhao W., Tang C., Nie Q., Zhang L. Network topologies that can achieve dual function of adaptation and noise attenuation. Cell Syst. 2019;9:271–285.e7. doi: 10.1016/j.cels.2019.08.006. [DOI] [PMC free article] [PubMed] [Google Scholar]
- Rehm M., Huber H.J., Dussmann H., Prehn J.H. Systems analysis of effector caspase activation and its control by X-linked inhibitor of apoptosis protein. EMBO J. 2006;25:4338–4349. doi: 10.1038/sj.emboj.7601295. [DOI] [PMC free article] [PubMed] [Google Scholar]
- Salazar C., Politi A.Z., Höfer T. Decoding of calcium oscillations by phosphorylation cycles: analytic results. Biophys. J. 2008;94:1203–1215. doi: 10.1529/biophysj.107.113084. [DOI] [PMC free article] [PubMed] [Google Scholar]
- Santos L.C., Vogel R., Chipuk J.E., Birtwistle M.R., Stolovitzky G., Meyer P. Mitochondrial origins of fractional control in regulated cell death. Nat. Commun. 2019;10:1–10. doi: 10.1038/s41467-019-09275-x. [DOI] [PMC free article] [PubMed] [Google Scholar]
- Scorrano L., Oakes S.A., Opferman J.T., Cheng E.H., Sorcinelli M.D., Pozzan T., Korsmeyer S.J. Bax and Bak regulation of endoplasmic reticulum Ca2+: a control point for apoptosis. Science. 2003;300:135–139. doi: 10.1126/science.1081208. [DOI] [PubMed] [Google Scholar]
- Shi Y. Caspase activation: revisiting the induced proximity model. Cell. 2004;117:855–858. doi: 10.1016/j.cell.2004.06.007. [DOI] [PubMed] [Google Scholar]
- Shuai J., Jung P. Optimal ion channel clustering for intracellular calcium signaling. Proc. Natl. Acad. Sci. U S A. 2003;100:506–510. doi: 10.1073/pnas.0236032100. [DOI] [PMC free article] [PubMed] [Google Scholar]
- Smedler E., Uhlén P. Frequency decoding of calcium oscillations. Biochem. Biophys. Acta. 2014;1840:964–969. doi: 10.1016/j.bbagen.2013.11.015. [DOI] [PubMed] [Google Scholar]
- Sneyd J., Han J.M., Wang L., Chen J., Yang X., Tanimura A., Sanderson M.J., Kirk V., Yule D.I. On the dynamical structure of calcium oscillations. Proc. Natl. Acad. Sci. U S A. 2017;114:1456–1461. doi: 10.1073/pnas.1614613114. [DOI] [PMC free article] [PubMed] [Google Scholar]
- Spencer S.L., Sorger P.K. Measuring and modeling apoptosis in single cells. Cell. 2011;144:926–939. doi: 10.1016/j.cell.2011.03.002. [DOI] [PMC free article] [PubMed] [Google Scholar]
- Spiller D.G., Wood C.D., Rand D.A., White M.R.H. Measurement of single-cell dynamics. Nature. 2010;465:736–745. doi: 10.1038/nature09232. [DOI] [PubMed] [Google Scholar]
- Tait S.W., Green D.R. Mitochondria and cell death: outer membrane permeabilization and beyond. Nat. Rev. Mol. Cell Biol. 2010;11:621–632. doi: 10.1038/nrm2952. [DOI] [PubMed] [Google Scholar]
- Thul R. Translating intracellular calcium signaling into models. CSH Protoc. 2014;2014:463–471. doi: 10.1101/pdb.top066266. [DOI] [PubMed] [Google Scholar]
- Thurley K., Skupin A., Thul R., Falcke M. Fundamental properties of Ca2+ signals. Biochem. Biophys. Acta. 2012;1820:1185–1194. doi: 10.1016/j.bbagen.2011.10.007. [DOI] [PubMed] [Google Scholar]
- Uhlén P., Fritz N. Biochemistry of calcium oscillations. Biochem. Bioph. Res. Commun. 2010;396:28–32. doi: 10.1016/j.bbrc.2010.02.117. [DOI] [PubMed] [Google Scholar]
- Voorsluijs V., Dawson S.P., De Decker Y., Dupont G. Deterministic limit of intracellular calcium spikes. Phys. Rev. Lett. 2019;122:088101. doi: 10.1103/PhysRevLett.122.088101. [DOI] [PubMed] [Google Scholar]
- Wang H.-G., Pathan N., Ethell I.M., Krajewski S., Yamaguchi Y., Shibasaki F., McKeon F., Bobo T., Franke T.F., Reed J.C. Ca2+-induced apoptosis through calcineurin dephosphorylation of BAD. Science. 1999;284:339–343. doi: 10.1126/science.284.5412.339. [DOI] [PubMed] [Google Scholar]
- Yao J., Pilko A., Wollman R. Distinct cellular states determine calcium signaling response. Mol. Syst. Biol. 2016;12:894. doi: 10.15252/msb.20167137. [DOI] [PMC free article] [PubMed] [Google Scholar]
- Yin Z., Qi H., Liu L., Jin Z. The optimal regulation mode of Bcl-2 apoptotic switch revealed by bistability analysis. BioSystems. 2017;162:44–52. doi: 10.1016/j.biosystems.2017.09.011. [DOI] [PubMed] [Google Scholar]
- Youle R.J., Strasser A. The Bcl-2 protein family: opposing activities that mediate cell death. Nat. Rev. Mol. Cell Biol. 2008;9:47–59. doi: 10.1038/nrm2308. [DOI] [PubMed] [Google Scholar]
- Zhang X.-P., Liu F., Wang W. Two-phase dynamics of p53 in the DNA damage response. Proc. Natl. Acad. Sci. U S A. 2011;108:8990–8995. doi: 10.1073/pnas.1100600108. [DOI] [PMC free article] [PubMed] [Google Scholar]
- Zhao L., Sun T., Pei J., Ouyang Q. Mutation-induced protein interaction kinetics changes affect apoptotic network dynamic properties and facilitate oncogenesis. Proc. Natl. Acad. Sci. U S A. 2015;112:E4046–E4054. doi: 10.1073/pnas.1502126112. [DOI] [PMC free article] [PubMed] [Google Scholar]
Associated Data
This section collects any data citations, data availability statements, or supplementary materials included in this article.
Supplementary Materials
Data Availability Statement
All data needed to evaluate the conclusions in the paper are present in the paper and/or the Supplemental Information. The code related to this paper may be requested from the authors.