

Abstract
Introduction
Chronic pain assessment and post-treatment evaluation continues to be challenging due to a lack of validated, objective tools to measure patient outcomes. Validation of mechanistic pain biomarkers would allow clinicians to objectively identify abnormal biochemistry contributing to painful symptoms.
Methods
We describe the clinical validation of a multi-biomarker assay with algorithmic analysis known as the Foundation Pain Index (FPI) in diverse cohorts of chronic pain patients in a prospective, cross-sectional, observational validation study. Levels of 11 urinary pain biomarkers were measured and tabulated using a proprietary algorithm to generate FPI scores for chronic pain subjects (N = 153) and age- and sex-matched pain-free controls (N = 334).
Results
FPI scores were significantly correlated with the 36-Item Short Form Health Survey (SF-36) scores among chronic pain subjects (P value < 0.015) and specific components of SF-36, including emotional well-being, limitations due to emotional problems, and general health (P value < 0.05). Area under ROC analysis (AUROC) revealed FPI to accurately distinguish biomarker profiles between pain-free and chronic pain cohorts (AUROC: 0.7490, P value < 0.0001) as well as the SF-36 scores between chronic pain subjects with low vs. high FPI scores (AUROC: 0.7715, P value < 0.01).
Conclusions
Our findings establish the validity and discriminatory power of a novel multi-biomarker test that evaluates the role of biochemistry in chronic pain and correlates with clinical assessments of patients. This test provides novel, reproducible, objective data which may pave the way for non-opioid therapeutic strategies to treat chronic pain.
Keywords: Biomarker, Inflammation, Kynurenine, Micronutrient, Pain
Key Summary Points
| Chronic pain assessment and post-treatment evaluation continues to be challenging for medical providers due to a lack of validated, objective tools to measure patient outcomes. |
| Validation of mechanistic pain biomarkers would allow clinicians to objectively identify abnormal biochemistry contributing to painful symptoms in patients. |
| The Foundation Pain Index (FPI) is a multi-biomarker assay derived from algorithmic analysis of abnormal urinary metabolites observed in a cross-sectional observational study. |
| FPI scores strongly segregate biomarker profiles of healthy control subjects and chronic pain patients and correlate with worsening clinical assessments of chronic pain. |
| This test provides novel, objective data that evaluates the role of biochemistry in chronic pain, which may pave the way for targeted, non-opioid therapeutic strategies. |
Introduction
Pain is a subjective sensation with objective, biochemical underpinnings that continues to challenge healthcare providers and regulatory bodies worldwide. This is mainly due to the risks associated with opioid analgesics commonly used in chronic pain treatment. The relatively high efficacy of opioids for the management of acute pain has been a major driver in the evolution of the current opioid crisis, due mainly to well-documented risks such as tolerance, dependence, and addiction [1]. Unfortunately, a simple solution to the opioid crisis does not exist, as simply removing these addictive analgesics from the clinic has led to a host of additional challenging issues for the healthcare community. The lack of strong evidence for alternative medications to replace opioids in chronic pain adds fuel to this dilemma. Instead, a greater understanding of the biochemical mechanisms that underlie and drive the subjective sensation of chronic pain would allow for novel, personalized, non-opioid therapies that directly modulate pain pathways. Mechanistic pain biomarkers revealing biochemical derangement driving the development or worsening of pain may represent one potential solution to the opioid crisis. Such biomarkers would not only provide physicians with novel, objective data pertaining to the biochemical origin of pain, but could also directly indicate safe, non-opioid therapies aimed at correcting the biochemical dysfunction to alleviate pain and improve function. Biomarker monitoring would also allow for longitudinal evaluation of the efficacy of modulating therapies. This will also provide patients and healthcare providers with objective updates on the biochemical status in a non-invasive manner, which would certainly aid with treatment compliance.
In previous work, we established a high prevalence of abnormal biochemical function in a population of chronic pain patients. We proposed that identifying and correcting such abnormalities would provide a safe and novel treatment modality for the management of pain [2]. As a follow-up to this study, we introduce a novel, multi-biomarker assay, known as the Foundation Pain Index (FPI), which evaluates diverse biochemical pathways involved in the pathogenesis of chronic pain to provide clinicians with objective and reproducible measures of the biochemical, metabolic, and nutritional drivers of chronic pain. This assay with algorithmic analysis is comprised of 11 well-characterized urinary biomarkers associated with nerve health, chronic inflammation, oxidative stress, and neurotransmitter turnover [3–10]. Clinical interpretations of abnormal biomarker findings in the context of chronic pain are detailed in Table 1.
Table 1.
Component biomarkers of the FPI and clinical interpretation in the context of chronic pain
| Biomarker | Clinical interpretation | Relevance to pain and clinical features | Notes | References |
|---|---|---|---|---|
| Methylmalonic acid | Elevated levels indicate a vitamin B12 deficiency | Vitamin B12 deficiency leads to nerve damage and degeneration of the spinal cord. Peripheral neuropathy is the most common pain presentation |
Deficiency can be precipitated by: Medications which lower stomach acidity (such as proton pump inhibitors, H2 receptor antagonists) Metformin Gastric surgery or resection Vegan or vegetarian diets Exposure to nitrous oxide |
[3, 11–13] |
| Xanthurenic acid | Elevated levels indicate a vitamin B6 deficiency | Neuropathy to due to vitamin B6 deficiency starts with numbness, paraesthesias, or burning pain in the feet, which then ascends to affect the legs and hands |
Vitamin B6 deficiency can be precipitated by: Use of vitamin B6 antagonists (isoniazid, phenelzine, hydralazine, penicillamine, and carbidopa) Hemodialysis Inflammatory or autoimmune disease |
[13–17] |
| Homocysteine | Elevated levels commonly indicate a B-vitamin (B6/B9/B12) deficiency | Elevated homocysteine results from B-vitamin deficiencies. Elevated homocysteine levels cause inflammation by increasing arachidonic acid and the proinflammatory prostaglandin E2 production |
Elevated homocysteine levels result from: B-vitamin (B6/B9/B12) deficiencies Use of diuretic medications Chronic alcohol consumption |
[18–20] |
| 3-HPMA | Elevated levels indicate increased exposure to acrolein | Acrolein contributes to inflammatory pain sensitivities through its binding and activation of the transient receptor potential ankyrin 1 receptor (TRPA1) in nerve fibers |
Increased acrolein exposure can result from: Chronic tobacco use Foods cooked or fried at very high temperatures Use of certain anti-cancer drugs Spinal cord injury |
[21–23] |
| Pyroglutamate | Elevated levels indicate glutathione depletion | Glutathione depletion renders nerve cells susceptible to oxidative damage which can lead to neuropathic pain |
Glutathione depletion can be precipitated by: Chronic use of acetaminophen Poorly controlled diabetes |
[24–26] |
| Ethylmalonate | Elevated levels indicate a carnitine deficiency | Carnitine deficiencies cause muscle aches and fatigue |
Carnitine deficiency can be precipitated by: Valproic acid High-fat diets Treatment with acetyl-l-carnitine has been shown to improve nerve conduction and neuropathic pain symptoms |
[27, 28] |
| Hydroxymethylglutarate | Elevated levels indicate a Coenzyme Q10 deficiency | Coenzyme Q10 deficiencies can cause muscle weakness and pain |
Coenzyme Q10 deficiency can be precipitated by: Use of statin medications Coenzyme Q10 supplementation ameliorates statin-associated muscle symptoms such as muscle pain and weakness |
[29, 30] |
| 5-HIAA | Abnormally low levels indicate decreased synthesis/turnover of serotonin | Abnormally low synthesis/turnover of serotonin can heighten pain sensitivity |
Abnormally low synthesis/turnover of serotonin can be precipitated by: Chronic inflammation upregulates indoleamine 2,3-dioxygenase which redirects dietary tryptophan down the kynurenine pathway and away from serotonin synthesis Insufficient intake of high-quality protein Vitamin B6 deficiency |
[7, 31, 32] |
| Vanilmandelate | Abnormally low levels indicate decreased synthesis/turnover of norepinephrine | Abnormally low synthesis/turnover of norepinephrine can heighten pain sensitivity |
Abnormally low synthesis/turnover of norepinephrine can be precipitate by: Chronic alcohol use Insufficient intake of high-quality protein Adrenal insufficiency |
[33, 34] |
| Quinolinic acid | Elevated levels indicate cytokine-mediated chronic inflammation | Quinolinic acid is a neuroactive kynurenine pathway (KP) metabolite which serves as a sensitive marker of chronic, systemic inflammation. Upregulation of this pathway has been shown to play a central role in the comorbidity of pain and depression. Quinolinic acid induces its depressive effects through its action on NMDA receptors |
Chronic, systemic inflammation can be precipitated by: Autoimmune disease Exposure to LPS from Gram-negative bacteria |
[35–39] |
| Kynurenate | Elevated levels indicate cytokine-mediated chronic inflammation | Kynurenate is a neuroactive kynurenine pathway (KP) metabolites which serves as a sensitive marker of chronic, systemic inflammation. Upregulation of this pathway has been shown to play a central role in the comorbidity of pain and depression |
Chronic, systemic inflammation can be precipitated by: Autoimmune disease Exposure to LPS from Gram-negative bacteria |
[35–39] |
3-HPMA 3-hydroxypropylmercapturic acid, 5-HIAA 5-hydroxyindoleacetic acid
In the present study, we sought to validate the FPI as an indicator of abnormal biochemical function in a chronic pain population. We also sought to determine the discriminant validity by comparing FPI scores of chronic pain subjects to age- and sex-matched pain-free controls. We established the validity criterion of the FPI by demonstrating a significant correlation between FPI scores and standard clinical assessments of chronic pain (i.e., SF-36 survey). We also discuss in detail the face validity of this innovative test offering. This study provides valuable insight into the validity and utility of the FPI in a clinical setting.
Methods
Study Subjects
A total of 153 chronic pain patients were enrolled in the ERD2019-02 prospective, multi-center clinical study. This study (ERD2019-02) was reviewed and approved by the Quorum Institutional Review Board (QIRB) and was performed in accordance with the Helsinki Declaration of 1964 and its later amendments. All participants provided informed consent prior to their inclusion of the study. All subjects completed the SF-36 short-form survey and the Hospital Anxiety and Depression Scale (HADS) at the time of sample collection. A single urine sample was obtained from each subject following enrolment and completion of all study questionnaires. Samples were packaged and shipped to Ethos R&D (Newport, KY, USA) where they were accessioned, prepared, and analyzed according to standard operating procedures. The number of samples provided from pain clinics satisfied criteria of adequate power for data analysis (80%, P value < 0.05).
FPI Scoring Structure
Quantitative results for each of the 11 biomarkers (methylmalonic acid [MMA], homocysteine [HCYS], xanthurenic acid [XAN], 3-hydroxypropylmercapturic acid [3-HPMA], quinolinic acid [QA], kynurenic acid [KA], pyroglutamic acid [PGA], ethylmalonate [EMA], hydroxymethylglutarate [HMG], vanilmandelate [VMA], and 5-hydroxyindoleacetic acid [5-HIAA]) are first normalized using creatinine concentrations and then analyzed via our proprietary algorithm to generate a single numerical score (FPI score) on a scale of 0–100, which describes the severity of abnormal findings. In the pre-validation model, FPI scores were subclassified into tiers that further describe the severity of the abnormal findings based on the severity and number of detected abnormalities (Table 2).
Table 2.
Tiers used to categorize FPI scores
| FPI score | Likelihood of detected abnormalities being pain determinants | Minimum number of expected abnormal biomarkers |
|---|---|---|
| 0–19 | Low | 0 |
| 20–49 | Moderate | 1 |
| 50–79 | Moderately high | 2 |
| 80–100 | High | 3 |
Our working hypothesis is that higher FPI scores, which are represented by a greater number of biochemical abnormalities, are more likely to be contributing to painful symptoms. Patients who exhibit higher FPI scores are therefore more likely to benefit from correction therapy aimed at lowering their baseline FPI score. Conversely, low FPI scores indicate that biochemical function is unremarkable and less likely to be contributing to painful symptomologies. Patients who exhibit low FPI scores at baseline are unlikely to benefit from correction therapy. Low FPI scores indicate that abnormal biochemical function is less likely to be a causative factor in a patient’s pain but in no way invalidates a patient’s complaint of pain. Such a test could be used in combination with standard clinical assessments and could prove particularly useful in complex cases involving pain of unknown etiology. The assay may also be helpful in cohorts of patients with comorbidities (anxiety, depression, T2D), unresponsive to traditional treatments and poor candidates for opioid therapy.
Inclusion/Exclusion Criteria
Table 3 describes the inclusion/exclusion criteria used for subject enrolment during the ERD2019-02 clinical study.
Table 3.
Inclusion/exclusion criteria for the ERD2019-02 study
| Inclusion criteria | Exclusion criteria |
|---|---|
| Men and women between the ages of 21 and 75 | Severe or untreated psychiatric disturbance |
| Long-term use (> 6 months) of an opioid analgesic at a current daily dose of 30 mg morphine equivalents (MME) or greater | Liver and/or kidney disease |
| Currently under the care of a participating investigator | Pregnancy |
| Understands and complies with all sample collection procedures | Use of corticosteroid or another immunosuppressive drug during or 1 month prior to sample collection |
| Diagnosed with bacterial or viral infection during or 3 months prior to the study | |
| Being prescribed anti-cytokine therapies | |
| Use of the following dietary supplements in the previous 3 months: B vitamins (B1, B2, B3, B5, B6, B12); folate or folic acid; magnesium; N-acetyl-cysteine (NAC); ashwagandha; curcumin or turmeric; alpha-lipoic acid; coenzyme Q10; carnitine; tryptophan or other amino acid powder |
Pain-Free Control Samples
Control samples from individuals with no history of chronic pain or opioid use, were collected prospectively from Lee Biosolutions (Maryland Heights, MO, USA) and their associated clinical collection sites across the United States. All pain-free control samples were shipped frozen to Ethos R&D (Newport, KY, USA) where they were prepared and analyzed according to standard operating procedures.
Analytical Methodologies
Samples were accessioned into the Laboratory Information System (LIS) and frozen at − 20 °C on the date of receipt and remained frozen until the time they were thawed at room temperature and prepared for analysis. Each sample underwent only one freeze/thaw cycle. Samples were prepared on 96-well plates with four-point calibrators, two quality controls, and one negative sample per plate. The urinary biomarkers and creatinine were each analyzed in separate liquid chromatography tandem mass spectrometry (LC–MS/MS) assays. All analytes were quantified using isotopic dilution and analyzed with MassHunter software. Biomarker concentrations were corrected for urinary dilution using creatinine and normalized values reported as µg/mg creatinine. Samples from healthy and pain subjects were prepared and analyzed in tandem to eliminate any instrument or user bias during LC–MS/MS analysis.
FPI Algorithm and Score Derivation
With the intent to distinguish between chronic pain and pain-free populations, the FPI was developed to represent an algorithm based on binary logistic regression. Individual biomarker results that deviate from previously established normal concentrations collectively contribute to a decision-making process that sorts samples as either normal (pain free) or abnormal (pain). Various types of supervised machine learning techniques, including principal component analysis, clustering, and linear discriminant analysis (LDA) were compared among randomly selected pain-free and chronic pain samples. The LDA proved to provide the most robust segregation between groups (P value < 0.001). This model of multiple analysis of variance (MANOVA) with LDA generated weighted coefficients for each biomarker according to the function below:
Y refers to the model output, E–K… refer to metabolite concentrations as normalized to creatinine levels (µg/mg) in urine, β0 is the y-intercept, and β1–β6… are coefficients generated by analysis that most distinguishes control (pain free) and experimental (chronic pain) groups for each metabolite.
Biomarkers used in the development of the FPI model were transformed for normal distribution by Box-cox transformations (xλ, where λ = lambda, R 3.5.1 programming) and verified by normality analysis (D’Agostino and Pearson test, GraphPad Prism 8.3.0).
Statistical Methods
To compare univariate patient characteristics between groups, non-parametric t tests were used to compare means of variables. Multivariate analysis (least squares) were used to determine distinguishable power of the multi-biomarker score. To achieve normal distributions of data prior to MANOVA and correlation analyses, box-cox transformations (λ, lambda) and outlier analyses (determined by > 2.5 × standard deviation) were applied (Table 4). Biomarkers are expressed as normalized to creatinine concentrations (µg/mg) for each urine sample. Data was analyzed with the level of significance at α = 0.05.
Table 4.
Lamba (λ) conversion table for biomarkers (x)
| X | Lamba (λ) | X | Lamba (λ) |
|---|---|---|---|
| MMA | 1/(log10(x)) | QA | x1 |
| HCYS | x− 0.25 | KYNA | log10(x) |
| XAN | x− 0.01 | HMG | log10(x) |
| PGA | x1 | EMA | x− 0.05 |
| VMA | x− 0.25 | 3-HPMA | x− 0.5 |
| 5-HIA | x0.8 |
Receiver operating characteristics (ROC) and its area under the curve (AUROC) were performed to determine sensitivity and specificity of FPI of pain-free vs. pain subjects and low vs. high FPI among pain patient SF-36 scores.
To account for non-normal distribution of clinical assessments among chronic pain patients, Spearman rank’s coefficient (r) was used. Correlation analysis was performed for group characteristics (age, sex, creatinine levels, biomarker concentrations) between pain-free and chronic pain subjects, as well as among chronic pain patients (biomarker levels, FPI, BMI, daily MME, current VAS, SF-36 score, HADS Anxiety and Depression scores). Components within the SF-36 used for analysis include assessments of physical functioning, limits due to physical health and emotional problems, energy/fatigue, emotional well-being, social functioning, pain, general health, and health change.
Results
Cohort Characteristics
FPI scores were calculated using creatinine-normalized biomarker results from 153 chronic pain patients meeting all inclusion criteria and 334 age- and sex-matched pain-free controls with no history of chronic pain or opioid use. The mean age of chronic pain subjects was 55.5 (55.5 ± 11.4) with a 52% female population. Mean BMI in the chronic pain cohort was 30.9 (30.9 ± 7.57) and 24.8% reported smoking cigarettes. Primary pain diagnoses across the pain cohort included, but were not limited to, low back pain, lumbar radiculopathy, chronic pain syndrome, and cervicalgia. The mean daily dose of opioid medication was 65.3 morphine milligram equivalents (MME) (65.3 ± 42.8). At the time of sample collection, the mean self-reported VAS score was 5.92 (5.92 ± 1.9), while the mean SF-36 score across the pain cohort was 1674 (1674 ± 667). Hospital anxiety and depression surveys revealed a mean anxiety score of 7.12 (7.12 ± 4.11) and a mean depression score of 7.43 (7.43 ± 12.05). Mean component scores from the SF-36 assessment are detailed further in Table 5. Age, sex, and creatinine levels did not correlate with biomarker concentrations or FPI scores among pain-free and pain subjects. Prescription medications, daily MME, current VAS, and HADS Anxiety and Depression scores did not correlate with biomarker concentrations or FPI scores in subjects with chronic pain.
Table 5.
Characteristics of patients suffering from chronic pain
| Patient characteristics | |
|---|---|
| Number of subjects | 153 |
| Male (%) | 48 |
| Female (%) | 52 |
| Cigarette smoker (%) | 24.8 |
| Mean ± SD | |
|---|---|
| Age | 55.5 ± 11.4 |
| BMI | 30.9 ± 7.57 |
| Daily MME | 65.3 ± 42.8 |
| Current VAS | 5.92 ± 1.9 |
| SF-36 score | 1674 ± 667 |
| HADS A score | 7.12 ± 4.11 |
| HADS D score | 7.43 ± 12.05 |
| SF-36 score assessment (%) | |
| Physical functioning | 45 ± 29 |
| Limits due to physical health | 26 ± 33 |
| Limits due to emotional problems | 61 ± 45 |
| Energy/fatigue | 36 ± 23 |
| Emotional well-being | 67 ± 32 |
| Social functioning | 54 ± 33 |
| Pain | 33 ± 20 |
| General health | 47 ± 26 |
| Health change | 42 ± 26 |
Data includes patients' characteristics suffering from chronic pain (n = 153) and prescribed long-term opioids (> 6 months prescription) used for multi-biomarker score training
FPI Performance and Validation
Abnormal biomarker results were detected in a large majority of the chronic pain cohort with significant deviation from normal ranges observed across most individual biomarkers (Table 6).
Table 6.
Biomarker validation across patient and healthy cohorts
| Healthy | Pain | ||||
|---|---|---|---|---|---|
| Number of subjects | 334 | 153 | |||
| Male (%) | 50 | 48 | |||
| Female (%) | 50 | 52 |
| Mean ± SD | Mean ± SD | P value | AUROC | P value | |
|---|---|---|---|---|---|
| Age | 54.6 ± 11.6 | 54.6 ± 11.6 | 0.4273 | ||
| Creatinine | 125 ± 76 | 109 ± 73 | 0.0255 | ||
| Biomarker (µg/mg of creatinine) | |||||
| Methylmalonic acid | 1.06 ± 0.99 | 1.49 ± 2.00 | 0.0031 | 0.6191 | < 0.0001 |
| Homocysteine | 0.32 ± 0.40 | 0.36 ± 0.29 | 0.3074 | 0.5717 | 0.0124 |
| Xanthurenic acid | 0.46 ± 0.31 | 0.61 ± 0.41 | < 0.0001 | 0.6381 | < 0.0001 |
| Pyroglutamate | 31.2 ± 12.3 | 44.0 ± 39.1 | < 0.0001 | 0.6317 | < 0.0001 |
| Vanilmandelate | 3.25 ± 1.29 | 3.42 ± 2.30 | 0.2841 | 0.5560 | 0.0517 |
| 5-HIAA | 3.49 ± 3.83 | 3.82 ± 3.55 | 0.3723 | 0.5076 | 0.7930 |
| Quinolinic acid | 5.38 ± 2.34 | 6.54 ± 3.59 | < 0.0001 | 0.5735 | 0.0150 |
| Kynurenic acid | 1.64 ± 0.68 | 2.26 ± 1.13 | < 0.0001 | 0.6852 | < 0.0001 |
| Hydroxymethylglutarate | 3.12 ± 1.38 | 4.00 ± 2.44 | < 0.0001 | 0.6512 | < 0.0001 |
| Ethylmalonic acid | 3.02 ± 2.64 | 3.29 ± 3.08 | 0.3266 | 0.5146 | 0.6232 |
| 3-HPMA | 1.44 ± 2.54 | 2.19 ± 3.31 | 0.0061 | 0.5825 | 0.0052 |
| FPI | 20.4 ± 20.6 | 43.9 ± 28.0 | < 0.0001 | 0.7490 | < 0.0001 |
Comparison of means (non-parametric t test) and ROC curve of discriminating algorithm (heathy vs. pain). Multivariate analysis (least squares) was used to determine distinguishable power of the multi-biomarker score, FPI. To achieve normal distributions of biomarkers, box-cox transformations (λ, lambda) and outlier analyses (determined by > 2.5 × SD) were applied. Subjects were matched for age and sex to control for collection variation between cohorts. Biomarkers are expressed as normalized to creatinine concentrations (µg/mg) for each urine sample. Data were analyzed with level of significance at α = 0.05
AUROC area under receiver operating characteristic curve, 5-HIA 5-hydroxyindoleacetatic acid, 3-HPMA 3-hydroxypropyl mercapturic acid
The majority of pain subjects (86%) exhibited at least one abnormal biomarker (outside of the double-sided, 95% confidence interval reference range). Mean comparisons of individual biomarkers using non-parametric t testing revealed extremely strong discriminatory power (P < 0.0001) of five of the 11 biomarkers (methylmalonic acid, xanthurenic acid, pyroglutamate, kynurenic acid, and hydroxymethylglutarate) while an additional three biomarkers (homocysteine, quinolinic acid, and 3-HPMA) exhibited statistically significant discriminatory power (P < 0.05) between the pain and pain-free cohorts. Multi-biomarker statistical models (FPI) outperformed individual biomarkers when discriminating between pain-free and chronic pain cohorts (AUROC: 0.7490, P < 0.0001) (Fig. 1). Mean FPI scores were evaluated across pain-free and chronic pain cohorts and confirm a greater degree of pain-relevant biochemical perturbations in chronic pain subjects (Fig. 1). Mean FPI scores (0-100 scale) among the chronic pain cohort was 43.9 (43.9 ± 28.0) while the pain-free cohort exhibited a mean FPI score of 20.4 (20.4 ± 20.6) (P < 0.0001) (Fig. 2).
Fig. 1.
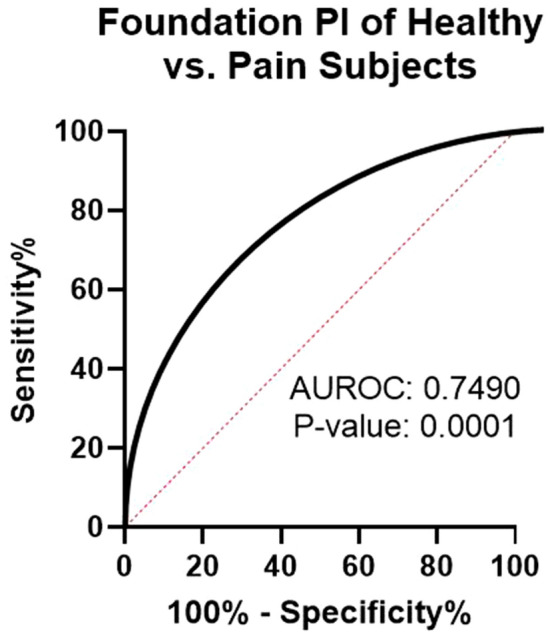
ROC curve of FPI. Healthy (n = 334) and pain (n = 153) subjects were matched for sex (female: 50%) and age (avg per group: 55 years old). AUROC area under the receiver operating characteristic
Fig. 2.
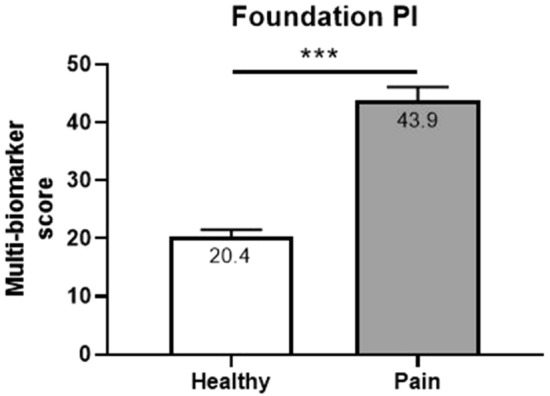
Comparison of means (non-parametric t test) of FPI. Healthy (n = 334) and pain (n = 153) subjects were matched for sex (female: 50%) and age (avg per group: 55 years old). ***P value < 0.0001
Association of FPI Scores with Clinical Assessments of Pain
Criterion validation analysis evaluated the significance of any correlations between FPI scores and validated clinical assessments for chronic pain. FPI scores were significantly associated with overall SF-36 scores (P = 0.0141) (Fig. 2), general health (P = 0.0457) and even more significantly, with emotional well-being (P = 0.0044), and limitations due to emotional problems (P = 0.0011) (Table 7).
Table 7.
Relationship between the FPI score and clinical assessments of chronic pain
| FPI severity (Spearman’s r) | P value | |
|---|---|---|
| Limitations due to emotional problems | 0.520 | 0.0011 |
| Emotional well-being | 0.463 | 0.0044 |
| General health | 0.345 | 0.0457 |
| SF-36 score | 0.406 | 0.0141 |
Clinical evaluations were compared between pain patients with moderately high to high FPI severity scores (> 75 FPI) and low FPI severity scores (< 20 FPI)
In the pre-validation model of FPI, scores (0–100 scale) were further categorized into tiers that represent the likelihood of detected abnormalities being pain determinants (Table 2). Validation of scoring tiers was carried out by examining associations between SF-36 scores and FPI tiers (low, moderate, moderately high, and high). We hypothesized that subjects with severe biochemical disarrangement evident by higher FPI scores would be more impacted, both physically and emotionally by their pain. The SF-36 was selected as the most appropriate, validation clinical assessment to evaluate both the physical and emotional impact of pain on subjects. Validation analysis was conducted by first comparing SF-36 scores in pain subjects who exhibited LOW FPI scores (< 20) to those who exhibited moderately high and high FPI scores (> 75). Comparison of SF-36 means (non-parametric t test) for the LOW FPI cohort and the high PI cohort reveal a strong discrimination between SF-36 scores of low and high FPI scores (AUROC: 0.7715; P = 0.0088) (Figs. 3 and 4).
Fig. 3.
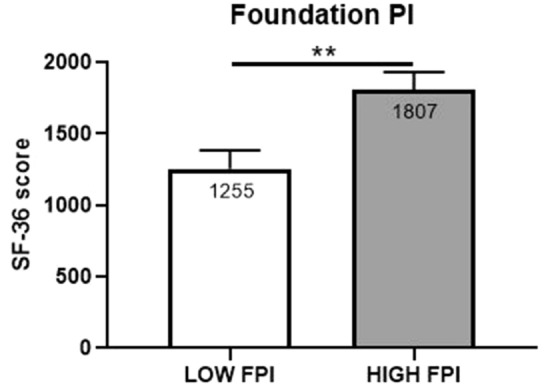
Comparison of means (non-parametric t test) of FPI severity and SF-36 scores. Clinical evaluations were compared between randomly selected pain patients with moderately high and high FPI severity scores (> 75 FPI; n = 20) and low FPI severity scores (< 20 FPI; n = 20). **P value < 0.001
Fig. 4.
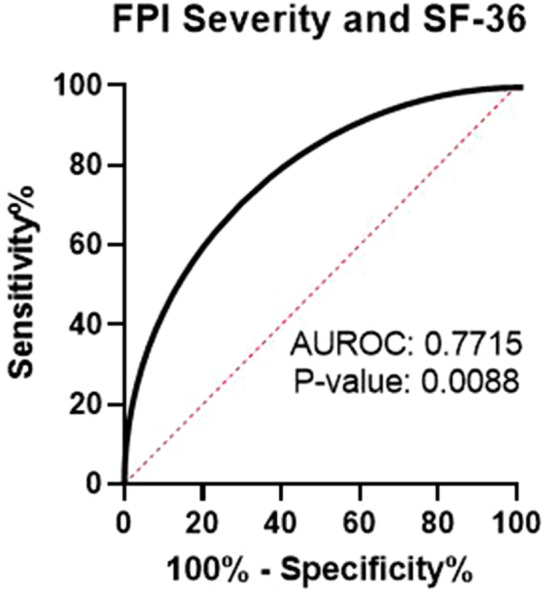
ROC curve of FPI severity and SF-36 scores. ROC analysis was performed between randomly selected pain patients with moderately high and high FPI severity scores (> 75 FPI; n = 20) and low FPI severity scores (< 20 FPI; n = 20). AUROC area under the receiver operating characteristic curve
Further validation analysis was conducted to evaluate the association between overall SF-36 scores and FPI as a continuous score. Figure 5 illustrates the continuous, significant association (P = 0.0177) between FPI scores and overall SF-36 scores across the four tiers of FPI scores (low, moderate, moderately high, and high) (Fig. 5).
Fig. 5.
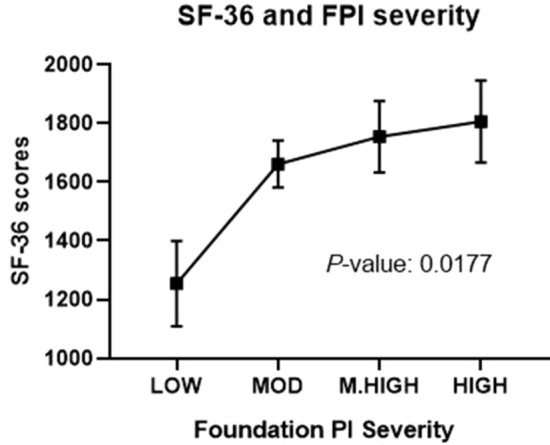
Association between SF-36 scores and FPI severity among chronic pain patients. Data is represented as mean ± SEM and was analyzed by linear trend analysis of one-way ANOVA. MOD moderate, M.HIGH moderately high
Final validation of the scoring tiers was conducted by evaluating both the biomarker and clinical (SF-36) characteristics of subjects within each tier (Table 8). Criteria for validation required a significant (P value < 0.05) difference between the number of abnormal biomarker findings and SF-36 scores across all four categories with a linear trend confirming that worsening clinical assessments correlate with worsening FPI scores.
Table 8.
Biomarker and clinical characteristics of subjects across all four FPI scoring tiers
| Minimum number of expected abnormal biomarkers | Low | Moderate | Moderately high | HIGH | P value | |
|---|---|---|---|---|---|---|
| 0 | 1 | 2 | 3 | ANOVA | Linear trend | |
| Average number of abnormal biomarkers | 0.24 ± 0.44 | 1.84 ± 0.74 | 3.24 ± 0.51 | 4.72 ± 0.46 | < 0.0001 | < 0.0001 |
| SF-36 Scores | 1255 ± 579 | 1662 ± 644 | 1754 ± 555 | 1806 ± 560 | 0.0436 | 0.0177 |
Grouped, categorical data were analyzed as linear trend analysis of one-way ANOVA
Discussion
These results demonstrate the clinical validity and associated correlations between FPI scores and validated clinical assessments of chronic pain (limitations due to emotional problems, emotional well-being, general health, and overall SF-36 scores) in a heterogenous cohort of chronic pain patients across multiple sites. The FPI score describes the degree and severity of underlying metabolic derangement that may be driving painful symptomology, and therefore, provides novel objective information that will compliment current subjective assessments. In addition to providing mechanistic insight into underlying biochemical derangement in chronic pain, the FPI also directly underscores the potential for novel non-opioid therapies that have been shown to modulate component biomarkers. Novel, biochemical intelligence combined with safe, personalized, non-opioid therapy options will increase the likelihood of successful and prolonged pain control, while reducing healthcare costs and reliance on opioid medications.
During criterion validation analysis, the FPI was strongly associated with limitations due to emotional problems (P = 0.0011) and emotional well-being (P = 0.0044), both components of the SF-36 survey. The validity and importance of these findings is further supported by examining the component biomarkers and the diverse set of biochemical and metabolic pathways represented by these surrogate markers. Component biomarkers exhibiting the strongest distinguishing power between pain-free and pain cohorts included methylmalonic acid, xanthurenic acid, pyroglutamic acid and the kynurenine pathway metabolites, quinolinic acid, and kynurenic acid. While each of these biomarkers lies along pathways that can directly impact the development, worsening and/or perception of pain, they are also intimately linked to mental health and emotional well-being.
Methylmalonic acid is a sensitive and specific marker of intracellular vitamin B12 status. Elevated levels of this urinary metabolite indicate an increased demand for this critical micronutrient. Vitamin B12 deficiencies are commonly detected in the chronic pain population and can drive painful and neuropsychiatric symptomologies [2, 3, 40–43]. Xanthurenic acid is a metabolomic biomarker of vitamin B6 status. Elevated levels of this kynurenine pathway metabolite indicate an increased demand for vitamin B6. Vitamin B6 deficiencies have long been recognized as causes of painful peripheral neuropathies, migraine, chronic pain, depression, and other neuropsychiatric diseases [13, 44, 45]. Pyroglutamic acid is a well-characterized metabolomic biomarker of glutathione depletion or a reduced glutathione response capacity. Elevated levels of this urinary marker, indicating a need for glutathione support, is a common finding in chronic pain patients taking daily doses of acetaminophen (APAP). APAP is capable of directly depleting glutathione stores [2, 26]. A reduced glutathione response capacity renders nerve cells susceptible to oxidative damage, which can cause or worsen peripheral neuropathies and drive the development of neuropsychiatric disease [28, 46, 47]. Quinolinic and kynurenine acid are neuroactive metabolites of the kynurenine pathway (KP), which can impact the development of pain hypersensitivity and depression through their direct action on NMDA receptors and relationship to serotonin synthesis. The KP is the major pathway responsible for the catabolic degradation of dietary tryptophan. Chronic activation of the KP occurs under conditions of systemic inflammation due to the ability of pro-inflammatory cytokines to directly upregulate this critical pathway. Under normal conditions, a small percentage of dietary tryptophan is utilized for serotonin synthesis but in the presence of a persistent inflammatory response, tryptophan is preferentially shunted down the KP, at the cost of serotonin synthesis. This phenomenon leads to the accumulation of quinolinic acid (leading to NDMA-mediated excitotoxicity and depression) and decreased serotonin synthesis, which further amplifies heightened pain and depressive symptoms [35, 48–50].
Considering the high prevalence of mental health disorders including anxiety, depression, bipolar disorder, and post-traumatic stress disorder in chronic pain populations, it is timely and significant that we observe and report prevalent perturbations in biochemical pathways capable of afflicting both physical and mental health. Our results provide evidence of criterion validity for the FPI by demonstrating a significant association with the SF-36 and multiple sub-components of this validated assessment for chronic pain. The clinical significance of specific objective markers of pain, which provide mechanistic insight into subjective reports, cannot be overstated, and it has long been recognized that such tools, capable of encompassing self-reported pain scores, would represent a significant advancement for the field of pain management [51]. Figure 5 and Table 8 illustrate the potential clinical significance of the FPI and its associated treatments. To the best of our knowledge, this is the first report of a validated pain biomarker panel that shows association with validated clinical assessments of pain. Strong association between higher FPI scores and worsening SF-36 responses provides mechanistic insight into the potential role of deranged biochemistry in the worsening and emotional impact of chronic pain. Potentially more exciting than the prospect of objective measures encompassing self-report is the fact that perturbed biochemistry can be corrected with appropriate low-cost therapies and supplementation. If metabolic correction proves capable of improving SF-36 scores, while simultaneously improving FPI scores, it will represent the first laboratory tool of its kind by allowing providers to truly modulate the course of disease.
Face validity of the FPI is supported by the direct relationships between component biomarkers and biochemical pathways known to be involved in the pathogenesis of chronic pain. Many of the metabolic, biochemical, and nutritional abnormalities indicated by the FPI test have been described in the literature as being the underlying causes of pain [13, 22, 25, 27, 52–55]. FPI biomarkers represent and evaluate cytokine-mediated chronic inflammation (kynurenine pathway metabolites), oxidative stress (pyroglutamic acid, ethylmalonate, and hydroxymethylglutarate), micronutrient deficiencies (methylmalonic acid, xanthurenic acid, homocysteine), and neurotransmitter turnover (5-hydroxyindoleacetic acid and vanilmandelic acid), all of which have direct links to the development, worsening, or heightened perception of pain. In addition, many of the non-opioid, biomarker-modulating compounds that would be directly indicated by the FPI test have exhibited significant pain-relieving effects in numerous randomized controlled clinical trials [28, 56–62]. FPI testing will facilitate and simplify patient selection for these important compounds by affording providers the ability to objectively identify patients who exhibit abnormalities and hence require metabolic correction therapies.
Mean comparison testing of FPI scores in pain and pain-free cohorts also provides evidence of discriminant validity by demonstrating significant differences in the mean FPI scores from pain-free subjects, when compared to the chronic pain cohort (P value < 0.0001). Despite strong discriminatory power, this assay is not intended to diagnose chronic pain. Rather, this innovative assay has been designed and validated to identify patients whose pain complaints may be due, at least in part, to biochemical, metabolic, and nutritional abnormalities. The importance of identifying such patients with a non-invasive, cost-effective test cannot be overstated, as these abnormalities can be treated and corrected with safe, widely available compounds. In addition, patients whose pain is due, at least in part, to underlying biochemical derangement will likely experience no long-term benefit from opioid therapy, as this class of medication is in no way addressing the underlying pathology driving the painful symptoms. Only with objective identification of abnormalities and targeted metabolic correction will these patients experience prolonged pain relief. Therefore, identification of such patients prior to the initiation of opioid therapy represents an immediately available and cost-effective strategy to reduce the opioid burden.
Validation study subjects were recruited from diverse geographic locations and exhibited a wide variety of primary pain complaints including, but not limited to, low back pain, lumbar radiculopathy, chronic pain syndrome, and cervicalgia (43%, 31%, 22%, and 14% of pain cohort, respectively). Study subjects were also prescribed a variety of opioid analgesics for pain control. Because of these diverse characteristics, which reflect real-world demographics, the FPI test can be considered a valid objective assessment for chronic pain patients in the clinic. Considering the complexity and biopsychosocial nature of chronic pain, it is not surprising that composite, multi-biomarker statistical models outperformed individual biomarkers during discriminant validation.
Limitations
Chronic pain subjects exhibited abnormal biochemical function across various relevant pathways indicating systemically perturbed biochemistry. While these abnormalities may be responsible for the onset of pain in some patients, other detected abnormalities may reflect the long-term metabolic cost of chronic pain. Regardless of whether detected abnormalities drove the acute onset of pain or its subsequent chronification, the evidence suggests biologically comprehensive test panels, evaluating multiple pathways are better equipped to characterize pain biochemistry than single marker assays. Furthermore, as biomarkers and FPI scores were assessed by single-point, cross-sectional analysis, longitudinal monitoring through repeat FPI testing in future studies will provide data on the efficacy of modulating therapies, as well as provide patients with objective updates on their biochemical status over time. Such tools will likely improve compliance and motivate patients to adhere to the metabolic correction protocols.
Conclusions
Objective identification of patients exhibiting high FPI scores will enable providers to initiate novel conversations and implement innovative treatment plans to correct underlying abnormalities and modulate the course of the disease. Ongoing research efforts will seek to determine the impact of FPI testing and subsequent metabolic correction on patients’ outcomes in both new and long-term chronic pain patients. Studies will also investigate the impact of FPI testing and metabolic correction following acute injury in order to determine whether the transition from acute to chronic pain can be slowed, or even prevented, by optimizing biochemical function to ensure an appropriate inflammatory response.
Acknowledgements
The authors would like to express their gratitude to the patients, site investigators, study coordinators, and associated staff for their tireless contributions and participation.
Funding
The study and the journal’s Rapid Service Fee were self-funded by Ethos Research and Development.
Authorship
All named authors meet the International Committee of Medical Journal Editors (ICMJE) criteria for authorship for this article, take responsibility for the integrity of the work as a whole, and have given their approval for this version to be published.
Disclosures
Melissa M. Hill, Bradley M. Cotten, John E. Beresh and Nathan Miller have nothing to disclose. Joshua Gunn is Chief Scientific Officer and co-founder (part owner) of Ethos Research & Development. Joshua Gunn also has a patent pending application relating to the use of pain biomarkers. Timothy R. Deer is a consultant for Ethos, Abbott, Vertos, Flowonix, Axonics, SpineThera, Saluda, Mainstay, Nalu, Vertiflex and Cornerlock and possesses equity in Bioness, Vertos, Axonics, SpineThera, Saluda, Nalu, Vertiflex, Cornerloc and SPR Therapeutics. Timothy R. Deer also has a patent pending on DRG leads with Abbott. Douglas Dobecki is a consultant for Boston Scientific Neuromodulation, Milestone Scientific and Nalu Medical. Pankaj Mehta and Kasra Amirdelfan are consultants for Ethos Laboratories. George Girardi is a consultant for Abbott, Boston Scientific, and Staylean. Jason E. Pope is a consultant for Abbott, Medtronic, Saluda, Flowonix, Tersera, Ethos Laboratories, Vertiflex, Genetech, Insightec, Stoke, Vertos, WISE, Biogen and the State Medical Board of California and possesses equity in Celeri Health, Stimgenics, SPR Therapeutics, Painteq, Thermaquil, Vertos, Neural Integrative Solutions and SpineThera.
Compliance with Ethics Guidelines
This study (ERD2019-02) was reviewed and approved by the Quorum Institutional Review Board (QIRB) and was performed in accordance with the Helsinki Declaration of 1964 and its later amendments. All participants provided informed consent prior to their inclusion of the study.
Data Availability
The datasets generated during and/or analyzed during the current study are available from the corresponding author on reasonable request.
Footnotes
Digital Features
To view digital features for this article go to 10.6084/m9.figshare.12339059.
References
- 1.Woolf CJ. Capturing novel non-opioid pain targets. Biol Psychiatry. 2020;87:74–81. doi: 10.1016/j.biopsych.2019.06.017. [DOI] [PMC free article] [PubMed] [Google Scholar]
- 2.Gunn J, Hill MM, Cotten BM, Deer TR. An analysis of biomarkers in chronic pain patients. Pain Physician. 2020;23:E41–E49. doi: 10.36076/ppj.2020/23/E41. [DOI] [PubMed] [Google Scholar]
- 3.Sun AL, Ni YH, Li XB, et al. Urinary methylmalonic acid as an indicator of early vitamin B12 deficiency and its role in polyneuropathy in type 2 diabetes. J Diabetes Res. 2014;2014:921616. doi: 10.1155/2014/921616. [DOI] [PMC free article] [PubMed] [Google Scholar]
- 4.Diaz-Arrastia R. Homocysteine and neurologic disease. Arch Neurol. 2000;57:1422–1428. doi: 10.1001/archneur.57.10.1422. [DOI] [PubMed] [Google Scholar]
- 5.Vitamin B6 deficiency and tryptophan metabolism. NUTR REV. 2009; 21:89-91.
- 6.Carmella SG, Chen M, Zhang Y, Zhang S, Hatsukami DK, Hecht SS. Quantitation of acrolein-derived (3-hydroxypropyl)mercapturic acid in human urine by liquid chromatography-atmospheric pressure chemical ionization tandem mass spectrometry: effects of cigarette smoking. Chem Res Toxicol. 2007;20:986–990. doi: 10.1021/tx700075y. [DOI] [PMC free article] [PubMed] [Google Scholar]
- 7.Sforzini L, Nettis MA, Mondelli V, Pariante CM. Inflammation in cancer and depression: a starring role for the kynurenine pathway. Psychopharmacology. 2019;2(36):2997–3011. doi: 10.1007/s00213-019-05200-8. [DOI] [PMC free article] [PubMed] [Google Scholar]
- 8.Gamarra Y, Santiago FC, Molina-López J, et al. Pyroglutamic acidosis by glutathione regeneration blockage in critical patients with septic shock. Crit Care. 2019;23:162. doi: 10.1186/s13054-019-2450-5. [DOI] [PMC free article] [PubMed] [Google Scholar]
- 9.Accioly MF, Leite CF. Statin-induced myopathy. In: Travers ER, editor. Statins: medical uses, mechanisms of action and clinical outcomes. Hauppauge, NY: Nova Science Publishers; 2014. pp. 183–195. [Google Scholar]
- 10.Réus GZ, Jansen K, Titus S, Carvalho AF, Gabbay V, Quevedo J. Kynurenine pathway dysfunction in the pathophysiology and treatment of depression: evidences from animal and human studies. J Psychiatr Res. 2015;68:316–328. doi: 10.1016/j.jpsychires.2015.05.007. [DOI] [PMC free article] [PubMed] [Google Scholar]
- 11.Langan R, Goodbred A. Vitamin B12 deficiency: recognition and management. Am Fam Phys. 2017;96:384–389. [PubMed] [Google Scholar]
- 12.Gürsoy AE, Kolukısa M, Babacan-Yıldız G, Çelebi A. Subacute combined degeneration of the spinal cord due to different etiologies and improvement of MRI findings. Case Rep Neurol Med. 2013;2013:1–5. doi: 10.1155/2013/159649. [DOI] [PMC free article] [PubMed] [Google Scholar]
- 13.Hammond N, Wang Y, Dimachkie MM, Barohn RJ. Nutritional neuropathies. Neurol Clin. 2013;31:477–489. doi: 10.1016/j.ncl.2013.02.002. [DOI] [PMC free article] [PubMed] [Google Scholar]
- 14.Heller CA, Friedman PA. Pyridoxine deficiency and peripheral neuropathy associated with long-term phenelzine therapy. Am J Med. 1983;75:887–888. doi: 10.1016/0002-9343(83)90422-9. [DOI] [PubMed] [Google Scholar]
- 15.Raskin NH, Fishman RA. Pyridoxine-deficiency neuropathy due to hydralazine. N Engl J Med. 1965;273:1182–1185. doi: 10.1056/NEJM196511252732203. [DOI] [PubMed] [Google Scholar]
- 16.Corken M, Porter J. Is vitamin B 6 deficiency an under-recognized risk in patients receiving haemodialysis? A systematic review: 2000-2010. Nephrology. 2011;16:619–625. doi: 10.1111/j.1440-1797.2011.01479.x. [DOI] [PubMed] [Google Scholar]
- 17.Ueland P, Mccann A, Midttun Ø, Ulvik A. Inflammation, vitamin B6 and related pathways. Mol Asp Med. 2017;53:10–27. doi: 10.1016/j.mam.2016.08.001. [DOI] [PubMed] [Google Scholar]
- 18.Kohlstadt I, editor. Food and nutrients in disease management. 1. Boca Raton: CRC Press; 2009. [Google Scholar]
- 19.Kamat PK, Mallonee CJ, George AK, Tyagi SC, Tyagi N. Homocysteine, alcoholism, and its potential epigenetic mechanism. Alcohol Clin Exp Res. 2016;40:2474–2481. doi: 10.1111/acer.13234. [DOI] [PMC free article] [PubMed] [Google Scholar]
- 20.Morrow LE, Grimsley EW. Long-term diuretic therapy in hypertensive patients: effects on serum homocysteine, vitamin B6, vitamin B12, and red blood cell folate concentrations. South Med J. 1999;92:866–870. doi: 10.1097/00007611-199909000-00003. [DOI] [PubMed] [Google Scholar]
- 21.Butler B, Acosta G, Shi R. Exogenous Acrolein intensifies sensory hypersensitivity after spinal cord injury in rat. J Neurol Sci. 2017;379:29–35. doi: 10.1016/j.jns.2017.05.039. [DOI] [PubMed] [Google Scholar]
- 22.Lin Y, Chen Z, Tang J, Cao P, Shi R. Acrolein contributes to the neuropathic pain and neuron damage after ischemic-reperfusion spinal cord injury. Neuroscience. 2018;384:120–130. doi: 10.1016/j.neuroscience.2018.05.029. [DOI] [PubMed] [Google Scholar]
- 23.Moghe A, Ghare S, Lamoreau B, et al. Molecular mechanisms of acrolein toxicity: relevance to human disease. Toxicol Sci. 2015;143:242–255. doi: 10.1093/toxsci/kfu233. [DOI] [PMC free article] [PubMed] [Google Scholar]
- 24.Figueroa-Romero C, Sadidi M, Feldman EL. Mechanisms of disease: the oxidative stress theory of diabetic neuropathy. Rev Endocr Metab Disord. 2008;9:301–314. doi: 10.1007/s11154-008-9104-2. [DOI] [PMC free article] [PubMed] [Google Scholar]
- 25.Darmaun D, Smith SD, Sweeten S, Sager BK, Welch S, Mauras N. Evidence for accelerated rates of glutathione utilization and glutathione depletion in adolescents with poorly controlled type 1 diabetes. Diabetes. 2005;54:190–196. doi: 10.2337/diabetes.54.1.190. [DOI] [PubMed] [Google Scholar]
- 26.Emmett M. Acetaminophen toxicity and 5-oxoproline (pyroglutamic acid): a tale of two cycles, one an ATP-depleting futile cycle and the other a useful cycle. Clin J Am Soc Nephrol. 2014;9:191–200. doi: 10.2215/CJN.07730713. [DOI] [PMC free article] [PubMed] [Google Scholar]
- 27.Flanagan JL, Simmons PA, Vehige J, Willcox MD, Garrett Q. Role of carnitine in disease. Nutr Metab. 2010;7:30. doi: 10.1186/1743-7075-7-30. [DOI] [PMC free article] [PubMed] [Google Scholar]
- 28.Miranda-Massari JR, Gonzalez MJJ, Jimenez FJ, Allende-Vigo MZ, Duconge J. Metabolic correction in the management of diabetic peripheral neuropathy: improving clinical results beyond symptom control. Curr Clin Pharmacol. 2011;6:260–273. doi: 10.2174/157488411798375967. [DOI] [PMC free article] [PubMed] [Google Scholar]
- 29.Qu H, Guo M, Chai H, Wang WT, Ga ZY, Shi DZ. Effects of coenzyme Q10 on statin-induced myopathy: an updated meta-analysis of randomized controlled trials. J Am Heart Assoc. 2018;7:e009835. doi: 10.1161/JAHA.118.009835. [DOI] [PMC free article] [PubMed] [Google Scholar]
- 30.Hernández-Camacho JD, Bernier M, López-Lluch G, Navas P. Coenzyme Q10 supplementation in aging and disease. Front Physiol. 2018;9:44. doi: 10.3389/fphys.2018.00044. [DOI] [PMC free article] [PubMed] [Google Scholar]
- 31.Lapin IP, Oxenkrug GF. Intensification of the central serotoninergic processes as a possible determinant of the thymoleptic effect. Lancet. 1969;293:132–136. doi: 10.1016/S0140-6736(69)91140-4. [DOI] [PubMed] [Google Scholar]
- 32.Martin SL, Power A, Boyle Y, Anderson IM, Silverdale MA, Jones AKP. 5-HT modulation of pain perception in humans. Psychopharmacology. 2017;234:2929–2939. doi: 10.1007/s00213-017-4686-6. [DOI] [PMC free article] [PubMed] [Google Scholar]
- 33.Pertovaara A. Noradrenergic pain modulation. Prog Neurobiol. 2006;80:53–83. doi: 10.1016/j.pneurobio.2006.08.001. [DOI] [PubMed] [Google Scholar]
- 34.Bannister K, Dickenson AH. What do monoamines do in pain modulation? Curr Opin Support Palliat Care. 2016;10:143–148. doi: 10.1097/SPC.0000000000000207. [DOI] [PMC free article] [PubMed] [Google Scholar]
- 35.Kim H, Chen L, Lim G, et al. Brain indoleamine 2,3-dioxygenase contributes to the comorbidity of pain and depression. UEG Week 2013 Oral Presentations. J Clin Invest. 2013;2012(122):2940–2954. doi: 10.1172/JCI61884. [DOI] [PMC free article] [PubMed] [Google Scholar]
- 36.Dantzer R, O’Connor JC, Lawson MA, Kelley KW. Inflammation-associated depression: from serotonin to kynurenine. Psychoneuroendocrinology. 2011;36:426–436. doi: 10.1016/j.psyneuen.2010.09.012. [DOI] [PMC free article] [PubMed] [Google Scholar]
- 37.Dantzer R. Role of the kynurenine metabolism pathway in inflammation-induced depression: preclinical approaches. Curr Top Behav Neurosci. 2017;31:117–138. doi: 10.1007/7854_2016_6. [DOI] [PMC free article] [PubMed] [Google Scholar]
- 38.de Oliveira FR, Fantucci MZ, Adriano L, et al. Neurological and inflammatory manifestations in Sjögren's syndrome: the role of the kynurenine metabolic pathway. Int J Mol Sci. 2018;19:3953. doi: 10.3390/ijms19123953. [DOI] [PMC free article] [PubMed] [Google Scholar]
- 39.Savitz J. The kynurenine pathway: a finger in every pie. Mol Psychiatry. 2020;25:131–147. doi: 10.1038/s41380-019-0414-4. [DOI] [PMC free article] [PubMed] [Google Scholar]
- 40.Hoffbrand AE. Megaloblastic Anemias. In: Jameson JL, Fauci AS, Kasper DL, Hauser SL, Longo DL, Loscalzo J, editors. Harrison’s principles of internal medicine, 20 edition AccessMedicine. New York: McGraw-Hill Medical; 2018. chap. 95.
- 41.Oberlin BS, Tangney CC, Gustashaw KAR, Rasmussen HE. Vitamin B12 deficiency in relation to functional disabilities. Nutrients. 2013;5:4462–4475. doi: 10.3390/nu5114462. [DOI] [PMC free article] [PubMed] [Google Scholar]
- 42.Briani C, Torre CD, Citton V, et al. Cobalamin deficiency: clinical picture and radiological findings. Nutrients. 2013;5:4521–4539. doi: 10.3390/nu5114521. [DOI] [PMC free article] [PubMed] [Google Scholar]
- 43.Metin O, Özcan Ö, Gültepe M, Tekeli H, Güney M. Functional vitamin B12 deficiency represented by elevated urine methylmalonic acid levels in patients with migraine. Turk J Med Sci. 2008;38:409–414. [Google Scholar]
- 44.Levenson JL, editor. American Psychiatric Publishing textbook of psychosomatic medicine. 3. Arlington, VA: American Psychiatric Publishing; 2018. [Google Scholar]
- 45.Breecher MM, Dworken AM. In: The Merck Manual. Medical Heritage. Berkow R, editor. New Jersey: Merck and Co.; 1986. pp. 229–321. [PubMed] [Google Scholar]
- 46.Nucifora LG, Tanaka T, Hayes LN, et al. Reduction of plasma glutathione in psychosis associated with schizophrenia and bipolar disorder in translational psychiatry. Transl Psychiatry. 2017;7:e1215. doi: 10.1038/tp.2017.178. [DOI] [PMC free article] [PubMed] [Google Scholar]
- 47.Diniz BS, Mendes-Silva AP, Silva LB, et al. Oxidative stress markers imbalance in late-life depression. J Psychiatr Res. 2018;102:29–33. doi: 10.1016/j.jpsychires.2018.02.023. [DOI] [PubMed] [Google Scholar]
- 48.Miura H, Ozaki N, Sawada M, Isobe K, Ohta T, Nagatsu T. A link between stress and depression: shifts in the balance between the kynurenine and serotonin pathways of tryptophan metabolism and the etiology and pathophysiology of depression. Stress. 2008;11:198–209. doi: 10.1080/10253890701754068. [DOI] [PubMed] [Google Scholar]
- 49.Myint AM, Kim YK. Cytokine-serotonin interaction through IDO: a neurodegeneration hypothesis of depression. Med Hypotheses. 2003;61:519–525. doi: 10.1016/S0306-9877(03)00207-X. [DOI] [PubMed] [Google Scholar]
- 50.Stone TW, Perkins MN. Quinolinic acid: a potent endogenous excitant at amino acid receptors in CNS. Eur J Pharmacol. 1981;72:411–412. doi: 10.1016/0014-2999(81)90587-2. [DOI] [PubMed] [Google Scholar]
- 51.Cowen R, Stasiowska MK, Laycock H, Bantel C. Assessing pain objectively: the use of physiological markers. Anaesthesia. 2015;70:828–847. doi: 10.1111/anae.13018. [DOI] [PubMed] [Google Scholar]
- 52.Ummer K, Noone M. Prevalence of B12 deficiency in patients presenting with non-specific pain and other sensory symptoms: a clinical observational study (P3.307) Neurology. 2015;84(14 Supplement):p3.307. doi: 10.1212/WNL.84.14_supplement.P3.307. [DOI] [Google Scholar]
- 53.Huang L, Ou R, de Souza RG, et al. Virus infections incite pain hypersensitivity by inducing indoleamine 2,3 dioxygenase. PLoS Pathog. 2016;12:e1005615. doi: 10.1371/journal.ppat.1005615. [DOI] [PMC free article] [PubMed] [Google Scholar]
- 54.Emmanuele V, López LC, Berardo A, et al. Heterogeneity of coenzyme Q 10 deficiency: patient study and literature review. Arch Neurol. 2012;69:978–983. doi: 10.1001/archneurol.2012.206. [DOI] [PMC free article] [PubMed] [Google Scholar]
- 55.Sagalajev B, Wei H, Chen Z, Albayrak I, Koivisto A, Pertovaara A. Oxidative stress in the amygdala contributes to neuropathic pain. Neuroscience. 2018;387:92–103. doi: 10.1016/j.neuroscience.2017.12.009. [DOI] [PubMed] [Google Scholar]
- 56.Batooei M, Roudsari AT, Basiri Z, et al. Evaluating the effect of oral N-acetylcysteine as an adjuvant treatment on clinical outcomes of patients with rheumatoid arthritis: a randomized, double-blind clinical trial. Rev Recent Clin Trials. 2018;13:132–138. doi: 10.2174/1574887113666180307151937. [DOI] [PubMed] [Google Scholar]
- 57.Chiu CK, Low TH, Tey YS, Singh VA, Shong HK. The efficacy and safety of intramuscular injections of methylcobalamin in patients with chronic nonspecific low back pain: a randomised controlled trial. Singap Med J. 2011;52:868–873. [PubMed] [Google Scholar]
- 58.Magaña-Villa MC, Rocha-González HI, Fernández Del Valle-Laisequilla C, et al. B-vitamin mixture improves the analgesic effect of diclofenac in patients with osteoarthritis: a double blind study. Drug Res (Stuttg). 2013;63:289–292. doi: 10.1055/s-0033-1334963. [DOI] [PubMed] [Google Scholar]
- 59.Geller M, Mibielli MA, Nunes CP, da Fonseca ADS, Goldberg SW, Oliveira L. Comparison of the action of diclofenac alone versus diclofenac plus B vitamins on mobility in patients with low back pain. J Drug Assess. 2016;5:1–3. doi: 10.3109/21556660.2016.1163263. [DOI] [PMC free article] [PubMed] [Google Scholar]
- 60.Wang JY, Wu YH, Liu SJ, Lin YS, Lu PH. Vitamin B12 for herpetic neuralgia: a meta-analysis of randomised controlled trials. Complement Ther Med. 2018;41:277–282. doi: 10.1016/j.ctim.2018.10.014. [DOI] [PubMed] [Google Scholar]
- 61.Derosa G, D’Angelo A, Maffioli P. Coenzyme q10 liquid supplementation in dyslipidemic subjects with statin-related clinical symptoms: a double-blind, randomized, placebo-controlled study. Drug Des Devel Ther. 2019;13:3647–3655. doi: 10.2147/DDDT.S223153. [DOI] [PMC free article] [PubMed] [Google Scholar]
- 62.Agathos E, Tentolouris A, Eleftheriadou I, et al. Effect of α-lipoic acid on symptoms and quality of life in patients with painful diabetic neuropathy. J Int Med Res. 2018;46:1779–1790. doi: 10.1177/0300060518756540. [DOI] [PMC free article] [PubMed] [Google Scholar]
Associated Data
This section collects any data citations, data availability statements, or supplementary materials included in this article.
Data Availability Statement
The datasets generated during and/or analyzed during the current study are available from the corresponding author on reasonable request.