

Abstract
Chemotherapeutic agents are notoriously known to have a narrow therapeutic range that often results in life‐threatening toxicity. Hence, it is clinically important to identify the patients who are at high risk for severe toxicity to certain chemotherapy through a pharmacogenomics approach. In this study, we carried out multiple genome‐wide association studies (GWAS) of 13 122 cancer patients who received different chemotherapy regimens, including cyclophosphamide‐ and platinum‐based (cisplatin and carboplatin), anthracycline‐based (doxorubicin and epirubicin), and antimetabolite‐based (5‐fluorouracil and gemcitabine) treatment, antimicrotubule agents (paclitaxel and docetaxel), and topoisomerase inhibitors (camptothecin and etoposide), as well as combination therapy with paclitaxel and carboplatin, to identify genetic variants that are associated with the risk of severe neutropenia/leucopenia in the Japanese population. In addition, we used a weighted genetic risk scoring system to evaluate the cumulative effects of the suggestive genetic variants identified from GWAS in order to predict the risk levels of individuals who carry multiple risk alleles. Although we failed to identify genetic variants that surpassed the genome‐wide significance level (P < 5.0 × 10⁻⁸) through GWAS, probably due to insufficient statistical power and complex clinical features, we were able to shortlist some of the suggestive associated loci. The current study is at the relatively preliminary stage, but does highlight the complexity and problematic issues associated with retrospective pharmacogenomics studies. However, we hope that verification of these genetic variants through local and international collaborations could improve the clinical outcome for cancer patients.
It is now widely and well recognized that medication can cause distinct heterogeneity in terms of its efficacy and toxicity among individuals. These inter‐individual differences could be explained in part by the common and/or rare genetic variants in the human genome. Pharmacogenomics aims to discover how genetic variations in the human genome can affect a drug's efficacy or toxicity, and thus brings great promise for personalized medicine in which genetic information can be used to predict the safety, toxicity, and/or efficacy of drugs.1 Pharmacogenomics study for chemotherapeutic therapies is particularly important because these drugs are known to have a narrow therapeutic window; in general, a higher concentration causes toxicity and a lower concentration reduces the efficacy of the drug. Two of the well‐described examples are the association of genetic variants in TPMT with 6‐mercaptopurine‐induced myelosuppression in treatment of pediatric acute lymphoblastic leukemia and that of UGT1A1 variants with camptothecin‐related neutropenia and diarrhea in treatment of colorectal and lung cancers. The US Food and Drug Administration have recommended that variants on these two genes should be helpful for the prediction of severe adverse reactions prior to use of the drugs.2, 3, 4, 5, 6, 7
With advances in various technologies in the life sciences, it is now possible to accurately genotype more than a million common genetic variations by genome‐wide high‐density SNP array or to characterize all genetic variants in our genome by the next generation DNA sequencing methods. Although one of the greatest drawbacks of GWAS is the requirement of the large number of samples to achieve high statistical power,8 this issue could be overcome by the establishment of Biobank Japan in 2003 (http://biobankjp.org/).9 Biobank Japan collected approximately 330 000 disease cases (200 000 individuals) that had either one or multiples of 47 different diseases including cancers from a collaborative network of 66 hospitals throughout Japan, with the major aim to identify genetic variants associated with susceptibility to complex diseases or those related to drug toxicity. By using the samples from Biobank Japan, a significant number of insightful findings have been published in recent years for identification of common genetic variants associated with complex diseases including cancer.10, 11, 12, 13, 14, 15, 16, 17, 18, 19 With a reasonable number of samples, it is also feasible to carry out pharmacogenomics studies on chemotherapy‐induced toxicity.
Neutropenia and/or leucopenia are two of the most common drug adverse events after treatment with chemotherapeutic agents, which often cause life‐threatening infections and the delay of treatment schedule that subsequently affect the treatment outcome. Although prophylactic granulocyte colony‐stimulating factor has been given to the patients as a preventive measure,20 the underlying mechanism and susceptible risk factors that cause neutropenia have not been fully elucidated. In this study, we carried out a total of 17 sets of GWAS using 13 122 cancer patients, who received various drug regimens, to identify genetic variants associated with the risk of chemotherapeutic agent‐induced severe neutropenia/leucopenia in the Japanese population.
Subjects and Method
Study subjects
A total of 13 122 DNA samples from cancer patients, who received various chemotherapeutic agents, stored in Biobank Japan (University of Tokyo, Tokyo, Japan), were used in this study. Among them, 805 patients developed severe neutropenia and/or leucopenia (≥grade 3), and 4804 patients were not reported to develop any adverse reactions after being given chemotherapeutic agents. The samples could be classified into subgroups according to the drugs used: an alkylating agent (cyclophosphamide); platinum‐based (cisplatin and carboplatin), anthracycline‐based (doxorubicin and epirubicin); antimetabolite‐based (5‐fluorouracil and gemcitabine), antimicrotubule‐based (paclitaxel and docetaxel); and topoisomerase inhibitor‐based (camptothecin and etoposide). The grade of toxicity was classified in accordance with the US National Cancer Institute's Common Toxicity Criteria version 2.0. The adverse event description is based on the medical records collected by the medical coordinator. The patients' demographic details are summarized in Table 1. Participants of this study provided written inform consent and this project was approved by the ethical committee from the Institute of Medical Sciences, University of Tokyo and the RIKEN Center for Genomic Medicine (Yokohama, Japan).
Table 1.
Demographic details of cancer patients treated with chemotherapeutic agents, whose DNA samples are stored in Biobank Japan (The University of Tokyo, Tokyo, Japan)
| Category | Controlsa | Grade 1/2 | Grade 3/4 | Category | Controlsa | Grade 1/2 | Grade 3/4 |
|---|---|---|---|---|---|---|---|
| All | 4804 | 1253 | 805 | Drug subtype | |||
| Age, years (mean) | 62.9 | 58.7 | 59.6 | Alkylating agent | 346 | 266 | 176 |
| Gender | Cyclophosphamide | 335 | 255 | 168 | |||
| Male | 2604 | 424 | 318 | Platinum‐based | 743 | 429 | 428 |
| Female | 2200 | 829 | 487 | Cisplatin | 471 | 191 | 176 |
| Cancer subtype | Carboplatin | 262 | 207 | 261 | |||
| Lung cancer | 587 | 259 | 266 | Anthracycline | 459 | 240 | 184 |
| Breast cancer | 876 | 388 | 204 | Doxorubicin | 66 | 85 | 83 |
| Ovarian cancer | 140 | 124 | 74 | Epirubicin | 370 | 132 | 83 |
| Gastric cancer | 827 | 100 | 56 | Antimetabolite | 2249 | 512 | 294 |
| Esophageal cancer | 208 | 65 | 53 | 5‐Fluorouracil | 952 | 331 | 177 |
| Colorectal cancer | 1573 | 161 | 50 | Gemcitabine | 226 | 111 | 80 |
| Endometrial cancer | 78 | 72 | 45 | Antimicrotubule agent | 825 | 468 | 371 |
| Cervical cancer | 129 | 57 | 35 | Paclitaxel | 364 | 321 | 218 |
| Prostate cancer | 91 | 13 | 21 | Docetaxel | 233 | 143 | 147 |
| Pancreatic cancer | 83 | 36 | 20 | Topoisomerase inhibitor | 187 | 123 | 106 |
| Liver cancer | 366 | 16 | 9 | Camptothecin | 155 | 106 | 59 |
| Gallbladder cancer | 56 | 9 | 1 | Etoposide | 39 | 19 | 54 |
| Paclitaxel + carboplatin | 166 | 161 | 150 | ||||
Individuals who did not develop any adverse drug reactions after chemotherapy.
Genotyping and quality controls
DNAs obtained from the patients' blood were genotyped using Illumina OmniExpress BeadChip (San Diego, CA, USA) that contained 733 202 SNPs. Sample quality control was carried out by methods including identity‐by‐state to evaluate cryptic relatedness for each sample and population stratification by the use of principal component analysis to exclude genetically heterogeneous samples from further analysis.21, 22 Then, our standard SNP quality control was carried out by excluding SNPs deviating from the Hardy–Weinberg equilibrium (P ≤ 1.0 × 10⁻⁶), non‐polymorphic SNPs, SNPs with a call rate of <0.99, and those on the X chromosome.21, 22 Q–Q plot and lambda values, which were calculated between observed P‐values from Fisher's test allelic model against expected P‐values, were used to further evaluate population substructure.
Statistical analysis
Genome‐wide case–control association analyses were evaluated using Fisher's exact method considering allelic, dominant, and recessive genetic models. Manhattan plots of the study were generated using the minimum P‐value among the three genetic models for each SNP.
Scoring system using wGRS
The scoring analysis was carried out using SNPs with Pmin of <1.0 × 10⁻⁵ after exclusion of SNPs that are in strong linkage disequilibrium (r 2 > 0.8) in each GWAS. The wGRS were calculated according to De Jager et al.23 Briefly, we first calculated the weight of each SNP that is the natural log of the odds ratio for each allele/genotype, considering the associated genetic model. For an additive model, we assigned a score of 2 to an individual with two risk alleles, 1 to that with one risk allele, and 0 to that with no risk allele. For a dominant model, we assigned a score of 1 to an individual with one or two risk alleles, and 0 to that with no risk allele. For a recessive model, we assigned a score of 1 to an individual with two risk alleles, and 0 to that with no or one risk allele. Then the cumulative genetic risk scores were determined by multiplying the number of risk alleles/genotype of each SNP by its corresponding weight, and subsequently took the sum across the total number of SNPs that were taken into consideration of each GWAS set. We classified the genetics risk score into four different groups created from the mean and SD: group 1, <mean − 1SD; group 2, mean − 1SD to mean; group 3, mean to mean + 1SD; and group 4, >mean + 1SD. Odds ratio, 95% confidence interval, P‐value, sensitivity, and specificity were calculated using group 1 as a reference. To calculate the OR in which one of the cells in the contingency table is zero, we applied the Haldane correction, used to avoid error in the calculation by adding 0.5 to all of the cells of a contingency table.
Results
After subdividing the patients by administered drugs/major drug subgroups, as previously mentioned, a total of 17 GWAS analyses were carried out by comparing the allele/genotype frequency between the patients who had developed severe neutropenia/leucopenia (grade 3/4) to those who had not developed any adverse drug reactions. The Q–Q plots of each GWAS and the calculated lambda value of below 1.00 indicated no significant population stratification in each of these GWAS analyses (Fig. S1). From this study, although we could not identify any SNPs that surpassed the genome‐wide significant threshold (P‐value < 5 × 10⁻⁸) for showing association with the risk of neutropenia/leucopenia induced by the certain type of drug or regimen, several possible candidate loci were identified. The results of the GWAS are summarized in Table 2, Table S1, and Figure S2; the results of wGRS are summarized in Table S2.
Table 2.
Association analysis of single nucleotide polymorphisms (SNPs) with different chemotherapeutic drugs/drug subgroups known to induce severe neutropenia/leucopenia
| CHR | SNP | BP | RA | NRA | RAF_Case | RAF_Ctrl | P_allelic | P_dom | P_rec | Pmin | OR | L95 | U95 | Gene | rel.loci |
|---|---|---|---|---|---|---|---|---|---|---|---|---|---|---|---|
| Cyclophosphamide | |||||||||||||||
| 16 | rs2519974a | 22889186 | T | C | 0.503 | 0.381 | 2.52E‐04 | 4.35E‐06 | 2.77E‐01 | 4.35E‐06 | 1.647 | 1.264 | 2.146 | HS3ST2 | 0 |
| 1 | rs10922438a | 198469162 | T | C | 0.214 | 0.106 | 6.01E‐06 | 1.71E‐05 | 7.10E‐02 | 6.01E‐06 | 2.301 | 1.608 | 3.293 | ATP6V1G3 | 23190 |
| 19 | rs3745571a | 6475613 | T | C | 0.778 | 0.670 | 4.05E‐04 | 7.72E‐06 | 1.00E+00 | 7.72E‐06 | 1.730 | 1.276 | 2.345 | DENND1C | 0 |
| All platinum‐based drugs | |||||||||||||||
| 15 | rs4886670a | 75449674 | A | C | 0.320 | 0.227 | 9.86E‐07 | 1.43E‐05 | 8.14E‐04 | 9.86E‐07 | 1.605 | 1.330 | 1.937 | RPL36AP45 | 29318 |
| 19 | rs33428a | 30937843 | G | A | 0.481 | 0.403 | 2.71E‐04 | 2.78E‐06 | 3.11E‐01 | 2.78E‐06 | 1.375 | 1.160 | 1.629 | ZNF536 | 0 |
| 14 | rs12589282a | 22937656 | G | T | 0.535 | 0.437 | 6.30E‐06 | 5.42E‐03 | 4.11E‐06 | 4.11E‐06 | 1.480 | 1.250 | 1.752 | TRA@ | 0 |
| 3 | rs3845905a | 66525963 | G | A | 0.915 | 0.850 | 4.12E‐06 | 7.45E‐05 | 3.65E‐04 | 4.12E‐06 | 1.894 | 1.433 | 2.503 | LRIG1 | 0 |
| 5 | rs1895302a | 169542600 | C | T | 0.551 | 0.478 | 6.95E‐04 | 7.41E‐06 | 4.11E‐01 | 7.41E‐06 | 1.340 | 1.132 | 1.587 | FOXI1 | 5871 |
| 1 | rs16825455a | 21837755 | T | C | 0.686 | 0.605 | 8.85E‐05 | 8.62E‐06 | 1.90E‐01 | 8.62E‐06 | 1.425 | 1.193 | 1.702 | ALPL | 0 |
| Cisplatin | |||||||||||||||
| 7 | rs10253216a | 16861849 | T | C | 0.565 | 0.468 | 2.18E‐03 | 1.68E‐07 | 1.00E+00 | 1.68E‐07 | 1.478 | 1.155 | 1.891 | AGR2 | −17111 |
| 4 | rs11944965a | 63424089 | T | C | 0.807 | 0.678 | 3.45E‐06 | 1.68E‐06 | 6.65E‐02 | 1.68E‐06 | 1.986 | 1.475 | 2.676 | LOC644534 | 47600 |
| 7 | rs7797977a | 16862235 | C | A | 0.668 | 0.580 | 4.06E‐03 | 5.23E‐01 | 2.17E‐06 | 2.17E‐06 | 1.457 | 1.127 | 1.883 | AGR2 | −17497 |
| 18 | rs2406342a | 74488280 | T | G | 0.605 | 0.475 | 3.59E‐05 | 2.48E‐06 | 6.71E‐02 | 2.48E‐06 | 1.697 | 1.323 | 2.177 | ZNF236 | −47836 |
| 20 | rs6077251a | 7752366 | T | C | 0.271 | 0.153 | 2.50E‐06 | 3.64E‐06 | 3.06E‐02 | 2.50E‐06 | 2.065 | 1.537 | 2.773 | SFRS13AP2 | 59982 |
| 8 | rs11774576a | 27740417 | A | G | 0.702 | 0.581 | 6.78E‐05 | 2.82E‐06 | 2.62E‐01 | 2.82E‐06 | 1.699 | 1.307 | 2.208 | SCARA5 | 0 |
| 11 | rs4627050a | 18822037 | G | A | 0.781 | 0.649 | 4.43E‐06 | 9.01E‐06 | 2.17E‐02 | 4.43E‐06 | 1.932 | 1.452 | 2.572 | PTPN5 | −8648 |
| 1 | rs12142335a | 108302922 | A | G | 0.040 | 0.004 | 9.91E‐06 | 8.45E‐06 | 1.00E+00 | 8.45E‐06 | 9.713 | 3.175 | 29.710 | VAV3 | 0 |
| Carboplatin | |||||||||||||||
| 15 | rs11071200a | 55950082 | T | G | 0.060 | 0.008 | 1.25E‐06 | 8.51E‐07 | 1.00E+00 | 8.51E‐07 | 8.241 | 2.888 | 23.520 | PRTG | 0 |
| 5 | rs3822735a | 35799994 | G | A | 0.862 | 0.752 | 7.24E‐06 | 1.68E‐06 | 3.50E‐01 | 1.68E‐06 | 2.062 | 1.500 | 2.834 | SPEF2 | 0 |
| 3 | rs1623879a | 58027197 | G | A | 0.441 | 0.321 | 7.69E‐05 | 1.89E‐02 | 3.75E‐06 | 3.75E‐06 | 1.669 | 1.297 | 2.148 | FLNB | 0 |
| 15 | rs936229a | 75132319 | G | A | 0.713 | 0.595 | 7.27E‐05 | 4.41E‐06 | 3.01E‐01 | 4.41E‐06 | 1.685 | 1.302 | 2.180 | ULK3 | 0 |
| 13 | rs7989332a | 21050575 | G | T | 0.853 | 0.738 | 5.47E‐06 | 1.16E‐04 | 1.74E‐03 | 5.47E‐06 | 2.056 | 1.507 | 2.806 | CRYL1 | 0 |
| 3 | rs3845905a | 66525963 | G | A | 0.921 | 0.828 | 5.99E‐06 | 2.20E‐05 | 1.50E‐02 | 5.99E‐06 | 2.433 | 1.645 | 3.598 | LRIG1 | 0 |
| 8 | rs1714746a | 4105147 | G | A | 0.554 | 0.435 | 1.59E‐04 | 6.63E‐02 | 7.44E‐06 | 7.44E‐06 | 1.610 | 1.261 | 2.056 | CSMD1 | 0 |
| 16 | rs12446319a | 81774798 | A | G | 0.253 | 0.143 | 8.97E‐06 | 1.27E‐04 | 3.16E‐04 | 8.97E‐06 | 2.026 | 1.480 | 2.774 | CMIP | 29431 |
| 1 | rs1277203a | 109392837 | A | G | 0.730 | 0.626 | 3.50E‐04 | 3.51E‐02 | 9.38E‐06 | 9.38E‐06 | 1.615 | 1.243 | 2.098 | AKNAD1 | 0 |
| All anthracycline‐based drugs | |||||||||||||||
| 5 | rs10040979a | 158424391 | G | A | 0.701 | 0.618 | 4.68E‐03 | 5.35E‐01 | 4.60E‐07 | 4.60E‐07 | 1.452 | 1.120 | 1.883 | EBF1 | 0 |
| 2 | rs12615435a | 200638509 | T | G | 0.883 | 0.773 | 3.95E‐06 | 4.09E‐06 | 9.17E‐02 | 3.95E‐06 | 2.214 | 1.555 | 3.154 | LOC348751 | 0 |
| 5 | rs7720283a | 158459721 | C | T | 0.775 | 0.706 | 1.29E‐02 | 3.37E‐01 | 4.15E‐06 | 4.15E‐06 | 1.431 | 1.078 | 1.898 | EBF1 | 0 |
| 1 | rs1367448a | 68633924 | C | T | 0.633 | 0.526 | 5.02E‐04 | 5.32E‐06 | 5.12E‐01 | 5.32E‐06 | 1.554 | 1.212 | 1.993 | LOC100289178 | 0 |
| 6 | rs2505059a | 98495952 | G | A | 0.538 | 0.398 | 5.41E‐06 | 2.29E‐04 | 2.04E‐04 | 5.41E‐06 | 1.765 | 1.383 | 2.252 | MIR2113 | 23455 |
| 12 | rs4149639a | 6442001 | C | T | 0.120 | 0.047 | 7.39E‐06 | 1.52E‐05 | 8.16E‐02 | 7.39E‐06 | 2.763 | 1.781 | 4.287 | TNFRSF1A | 0 |
| 19 | rs1654260a | 20329111 | A | G | 0.625 | 0.488 | 8.49E‐06 | 3.03E‐03 | 2.18E‐05 | 8.49E‐06 | 1.749 | 1.365 | 2.240 | LOC100421704 | −3576 |
| Doxorubicin | |||||||||||||||
| 15 | rs11857176a | 78164706 | A | G | 0.657 | 0.515 | 1.74E‐02 | 1.00E+00 | 8.08E‐07 | 8.08E‐07 | 1.800 | 1.127 | 2.874 | LOC100302666 | −6274 |
| 2 | rs4380275a | 773278 | G | A | 0.392 | 0.152 | 4.99E‐06 | 1.54E‐05 | 2.05E‐02 | 4.99E‐06 | 3.604 | 2.041 | 6.365 | LOC339822 | 6559 |
| 11 | rs2512987a | 86414282 | T | C | 0.681 | 0.417 | 7.02E‐06 | 6.04E‐03 | 3.42E‐05 | 7.02E‐06 | 2.985 | 1.855 | 4.803 | ME3 | −30604 |
| Epirubicin | |||||||||||||||
| 12 | rs4149639a | 6442001 | C | T | 0.163 | 0.042 | 2.89E‐07 | 8.31E‐07 | 3.32E‐02 | 2.89E‐07 | 4.443 | 2.571 | 7.677 | TNFRSF1A | 0 |
| 5 | rs2964475a | 5407814 | C | A | 0.615 | 0.415 | 4.13E‐06 | 3.95E‐04 | 1.10E‐04 | 4.13E‐06 | 2.248 | 1.592 | 3.174 | KIAA0947 | −14993 |
| 13 | rs1923834a | 28360487 | G | A | 0.916 | 0.770 | 9.40E‐06 | 4.61E‐06 | 3.33E‐01 | 4.61E‐06 | 3.236 | 1.823 | 5.744 | GSX1 | −6293 |
| 10 | rs908366a | 126144839 | A | G | 0.518 | 0.328 | 7.04E‐06 | 1.08E‐04 | 8.69E‐04 | 7.04E‐06 | 2.199 | 1.564 | 3.092 | LHPP | −5502 |
| 3 | rs1553091a | 187716886 | G | A | 0.452 | 0.358 | 2.65E‐02 | 8.04E‐01 | 7.46E‐06 | 7.46E‐06 | 1.480 | 1.053 | 2.080 | LOC100505844 | −22691 |
| All antimetabolite drugs | |||||||||||||||
| 18 | rs7228133a | 4539085 | C | A | 0.733 | 0.686 | 2.26E‐02 | 6.64E‐01 | 1.70E‐06 | 1.70E‐06 | 1.255 | 1.034 | 1.522 | LOC284215 | 243085 |
| 21 | rs8127977a | 26826514 | A | G | 0.804 | 0.722 | 1.30E‐05 | 2.11E‐06 | 2.67E‐01 | 2.11E‐06 | 1.587 | 1.282 | 1.966 | NCRNA00158 | −22501 |
| 12 | rs894734a | 54319727 | G | A | 0.849 | 0.776 | 3.84E‐05 | 3.97E‐06 | 6.63E‐01 | 3.97E‐06 | 1.619 | 1.279 | 2.050 | HOXC13 | −12849 |
| 13 | rs9580312a | 22754093 | G | A | 0.480 | 0.409 | 1.35E‐03 | 8.09E‐06 | 6.25E‐01 | 8.09E‐06 | 1.330 | 1.120 | 1.581 | LOC100506622 | −30331 |
| 21 | rs2055011a | 19481354 | C | T | 0.184 | 0.143 | 1.12E‐02 | 2.12E‐01 | 8.82E‐06 | 8.82E‐06 | 1.347 | 1.075 | 1.686 | CHODL | −135796 |
| 12 | rs12582168a | 124894184 | C | T | 0.333 | 0.256 | 8.50E‐05 | 9.31E‐06 | 2.84E‐01 | 9.31E‐06 | 1.454 | 1.210 | 1.748 | NCOR2 | 0 |
| 5‐Fluorouracil | |||||||||||||||
| 7 | rs10488226a | 12713070 | A | C | 0.195 | 0.107 | 1.09E‐05 | 3.54E‐06 | 2.98E‐01 | 3.54E‐06 | 2.026 | 1.500 | 2.737 | LOC100505995 | −12175 |
| 2 | rs6740660a | 224943685 | G | A | 0.966 | 0.894 | 4.10E‐06 | 8.83E‐06 | 2.40E‐01 | 4.10E‐06 | 3.386 | 1.870 | 6.131 | SERPINE2 | −39649 |
| 4 | rs1567482a | 36026747 | G | A | 0.952 | 0.875 | 6.26E‐06 | 1.44E‐05 | 9.14E‐02 | 6.26E‐06 | 2.846 | 1.716 | 4.719 | LOC651644 | 39948 |
| 2 | rs6706693a | 192465598 | A | G | 0.328 | 0.219 | 1.62E‐05 | 2.12E‐03 | 9.45E‐06 | 9.45E‐06 | 1.743 | 1.362 | 2.232 | OBFC2A | −77200 |
| Gemcitabine | |||||||||||||||
| 18 | rs9961113a | 75605399 | C | T | 0.625 | 0.403 | 1.43E‐06 | 3.83E‐04 | 3.73E‐05 | 1.43E‐06 | 2.473 | 1.706 | 3.584 | LOC100421527 | −260017 |
| 5 | rs2547917a | 58713680 | A | G | 0.350 | 0.212 | 9.06E‐04 | 8.79E‐02 | 3.33E‐06 | 3.33E‐06 | 1.997 | 1.345 | 2.965 | PDE4D | 0 |
| 15 | rs12900463a | 85415386 | C | T | 0.219 | 0.115 | 2.24E‐03 | 1.02E‐01 | 4.03E‐06 | 4.03E‐06 | 2.154 | 1.342 | 3.457 | ALPK3 | 0 |
| 22 | rs9609078a | 31153276 | T | C | 0.089 | 0.009 | 4.32E‐06 | 9.97E‐06 | 2.59E‐01 | 4.32E‐06 | 10.890 | 3.528 | 33.610 | OSBP2 | 0 |
| 5 | rs6863418a | 173625154 | A | G | 0.175 | 0.055 | 1.37E‐05 | 6.98E‐06 | 4.55E‐01 | 6.98E‐06 | 3.623 | 2.042 | 6.429 | HMP19 | 88972 |
| 20 | rs6037430a | 344079 | G | A | 0.894 | 0.730 | 9.74E‐06 | 1.75E‐05 | 7.92E‐02 | 9.74E‐06 | 3.109 | 1.805 | 5.359 | NRSN2 | 8567 |
| All antimicrotubule drugs | |||||||||||||||
| 17 | rs11651483a | 12777402 | C | T | 0.729 | 0.665 | 1.69E‐03 | 2.60E‐01 | 3.37E‐07 | 3.37E‐07 | 1.357 | 1.120 | 1.643 | RICH2 | 0 |
| 6 | rs4235898a | 77266188 | A | G | 0.830 | 0.740 | 1.05E‐06 | 3.34E‐06 | 6.50E‐03 | 1.05E‐06 | 1.718 | 1.377 | 2.142 | LOC100131680 | −103976 |
| 13 | rs4771859a | 93088651 | G | A | 0.764 | 0.709 | 5.49E‐03 | 2.60E‐01 | 1.47E‐06 | 1.47E‐06 | 1.328 | 1.088 | 1.623 | GPC5 | 0 |
| 1 | rs12145418a | 216716320 | T | G | 0.334 | 0.274 | 3.04E‐03 | 3.17E‐01 | 2.35E‐06 | 2.35E‐06 | 1.331 | 1.104 | 1.604 | ESRRG | 0 |
| 6 | rs9386485a | 106329055 | T | C | 0.596 | 0.492 | 2.65E‐06 | 2.85E‐05 | 8.59E‐04 | 2.65E‐06 | 1.524 | 1.279 | 1.817 | PRDM1 | −205140 |
| 16 | rs12935229a | 77328895 | A | G | 0.249 | 0.182 | 1.83E‐04 | 2.23E‐02 | 4.40E‐06 | 4.40E‐06 | 1.495 | 1.214 | 1.840 | ADAMTS18 | 0 |
| 7 | rs6961860a | 17085321 | G | A | 0.557 | 0.495 | 5.33E‐03 | 8.87E‐01 | 4.67E‐06 | 4.67E‐06 | 1.283 | 1.078 | 1.527 | LOC100131425 | 156806 |
| 14 | rs12882718a | 86902054 | T | C | 0.737 | 0.643 | 5.91E‐06 | 5.55E‐06 | 2.03E‐02 | 5.55E‐06 | 1.555 | 1.283 | 1.884 | LOC100421119 | −42891 |
| 12 | rs1043763a | 122630909 | T | C | 0.668 | 0.574 | 1.36E‐05 | 6.51E‐06 | 3.10E‐02 | 6.51E‐06 | 1.496 | 1.248 | 1.795 | MLXIP | 1920 |
| 2 | rs4591358a | 196365890 | C | T | 0.302 | 0.215 | 6.60E‐06 | 6.89E‐04 | 1.89E‐04 | 6.60E‐06 | 1.578 | 1.297 | 1.920 | LOC391470 | 81627 |
| 14 | rs8022296a | 97987857 | G | A | 0.663 | 0.608 | 1.06E‐02 | 6.54E‐01 | 7.29E‐06 | 7.29E‐06 | 1.269 | 1.058 | 1.521 | LOC100129345 | 111127 |
| 4 | rs6817170a | 154374984 | G | A | 0.377 | 0.286 | 9.29E‐06 | 4.61E‐05 | 3.27E‐03 | 9.29E‐06 | 1.517 | 1.264 | 1.822 | KIAA0922 | −12514 |
| Paclitaxel | |||||||||||||||
| 1 | rs922106a | 90025519 | T | G | 0.298 | 0.202 | 2.17E‐04 | 1.95E‐02 | 9.28E‐07 | 9.28E‐07 | 1.679 | 1.277 | 2.207 | LRRC8B | 0 |
| 6 | rs9386485a | 106329055 | T | C | 0.624 | 0.477 | 1.17E‐06 | 1.43E‐05 | 5.24E‐04 | 1.17E‐06 | 1.821 | 1.429 | 2.320 | PRDM1 | −205140 |
| 8 | rs2444896a | 99022009 | T | G | 0.727 | 0.603 | 1.58E‐05 | 2.43E‐06 | 7.41E‐02 | 2.43E‐06 | 1.754 | 1.355 | 2.269 | MATN2 | 0 |
| 2 | rs4666360a | 20335709 | C | T | 0.216 | 0.114 | 4.62E‐06 | 3.24E‐06 | 2.27E‐01 | 3.24E‐06 | 2.136 | 1.546 | 2.950 | RPS16P2 | 19625 |
| 9 | rs3138083a | 35648950 | A | G | 0.220 | 0.117 | 3.78E‐06 | 1.24E‐05 | 1.09E‐02 | 3.78E‐06 | 2.136 | 1.551 | 2.942 | SIT1 | 345 |
| 17 | rs3786094a | 9875205 | C | T | 0.528 | 0.422 | 5.30E‐04 | 1.80E‐01 | 5.83E‐06 | 5.83E‐06 | 1.531 | 1.206 | 1.944 | GAS7 | 0 |
| 15 | rs4886670a | 75449674 | A | C | 0.353 | 0.229 | 7.26E‐06 | 5.38E‐05 | 4.26E‐03 | 7.26E‐06 | 1.835 | 1.412 | 2.383 | RPL36AP45 | 29318 |
| 5 | rs792975a | 172271007 | T | C | 0.654 | 0.519 | 7.66E‐06 | 1.19E‐04 | 6.08E‐04 | 7.66E‐06 | 1.746 | 1.366 | 2.232 | ERGIC1 | 0 |
| Docetaxel | |||||||||||||||
| 9 | rs3747851a | 124521260 | T | C | 0.337 | 0.176 | 5.61E‐07 | 1.12E‐05 | 5.63E‐04 | 5.61E‐07 | 2.377 | 1.693 | 3.339 | DAB2IP | 0 |
| 7 | rs4727963a | 122759980 | C | T | 0.772 | 0.618 | 7.99E‐06 | 1.04E‐06 | 1.69E‐01 | 1.04E‐06 | 2.094 | 1.505 | 2.914 | SLC13A1 | 0 |
| 14 | rs1756650a | 87741025 | G | A | 0.211 | 0.162 | 9.95E‐02 | 9.10E‐01 | 1.74E‐06 | 1.74E‐06 | 1.386 | 0.954 | 2.014 | GALC | 658333 |
| 13 | rs488248a | 106596719 | T | C | 0.918 | 0.795 | 3.29E‐06 | 3.23E‐05 | 1.17E‐02 | 3.29E‐06 | 2.896 | 1.802 | 4.655 | LOC728192 | −432192 |
| 6 | rs12660691a | 130008445 | A | C | 0.935 | 0.819 | 3.62E‐06 | 4.99E‐06 | 1.62E‐01 | 3.62E‐06 | 3.199 | 1.899 | 5.391 | ARHGAP18 | 0 |
| 18 | rs4553720a | 62170726 | T | C | 0.377 | 0.281 | 7.77E‐03 | 4.56E‐01 | 6.77E‐06 | 6.77E‐06 | 1.547 | 1.131 | 2.116 | LOC284294 | 79890 |
| 6 | rs2157460a | 130021128 | T | C | 0.932 | 0.820 | 7.07E‐06 | 1.07E‐05 | 1.62E‐01 | 7.07E‐06 | 3.013 | 1.806 | 5.025 | ARHGAP18 | 0 |
| 2 | rs837841a | 130034012 | T | G | 0.714 | 0.662 | 1.49E‐01 | 5.26E‐01 | 8.34E‐06 | 8.34E‐06 | 1.279 | 0.930 | 1.759 | LOC151121 | −33653 |
| All topoisomerase inhibitors | |||||||||||||||
| 5 | rs10074959a | 104208013 | T | C | 0.321 | 0.237 | 3.23E‐02 | 8.08E‐01 | 1.13E‐06 | 1.13E‐06 | 1.524 | 1.048 | 2.217 | RAB9P1 | −227162 |
| 7 | rs1035147a | 12094966 | T | G | 0.981 | 0.877 | 4.01E‐06 | 4.75E‐06 | 5.56E‐01 | 4.01E‐06 | 7.294 | 2.587 | 20.559 | TMEM106B | −155882 |
| 1 | rs303386a | 99589379 | A | G | 0.585 | 0.444 | 1.10E‐03 | 4.30E‐06 | 3.88E‐01 | 4.30E‐06 | 1.766 | 1.256 | 2.483 | LOC100129620 | 0 |
| 14 | rs7494275a | 56231800 | C | A | 0.543 | 0.406 | 1.86E‐03 | 4.26E‐01 | 8.50E‐06 | 8.50E‐06 | 1.732 | 1.232 | 2.433 | RPL13AP3 | −1163 |
| 3 | rs480409a | 7010081 | G | A | 0.495 | 0.348 | 6.08E‐04 | 1.63E‐01 | 9.28E‐06 | 9.28E‐06 | 1.842 | 1.307 | 2.596 | GRM7 | 0 |
| Camptothecin | |||||||||||||||
| 6 | rs17318866a | 3837198 | G | A | 0.966 | 0.790 | 1.47E‐06 | 1.78E‐06 | 1.91E‐01 | 1.47E‐06 | 7.559 | 2.689 | 21.263 | FAM50B | −12434 |
| 2 | rs17027130a | 41273631 | C | T | 0.644 | 0.387 | 2.54E‐06 | 8.03E‐04 | 3.91E‐05 | 2.54E‐06 | 2.865 | 1.844 | 4.452 | LOC729984 | −110074 |
| 1 | rs303386a | 99589379 | A | G | 0.627 | 0.429 | 3.34E‐04 | 3.61E‐06 | 1.06E‐01 | 3.61E‐06 | 2.238 | 1.448 | 3.460 | LOC100129620 | 0 |
| Etoposide | |||||||||||||||
| 20 | rs6039763a | 10183517 | A | G | 0.370 | 0.090 | 1.27E‐05 | 1.54E‐06 | 4.61E‐01 | 1.54E‐06 | 5.966 | 2.502 | 14.230 | LOC100131208 | 0 |
| 1 | rs2506991a | 48098406 | G | A | 0.593 | 0.269 | 1.39E‐05 | 1.11E‐02 | 2.28E‐06 | 2.28E‐06 | 3.948 | 2.101 | 7.418 | LOC388630 | 127794 |
| 2 | rs12987465a | 49715021 | A | G | 0.593 | 0.359 | 1.87E‐03 | 6.26E‐01 | 6.61E‐06 | 6.61E‐06 | 2.597 | 1.424 | 4.737 | FSHR | –333355 |
| 7 | rs3095008a | 20255705 | T | C | 1.000 | 0.846 | 1.74E‐05 | 9.39E‐06 | 1.00E+00 | 9.39E‐06 | inf | N/A | N/A | MACC1 | 0 |
| Paclitaxel + carboplatin | |||||||||||||||
| 12 | rs12310399a | 95490248 | A | G | 0.708 | 0.567 | 2.60E‐04 | 1.08E‐01 | 2.46E‐07 | 2.46E‐07 | 1.852 | 1.329 | 2.580 | FGD6 | 0 |
| 9 | rs10785877a | 137125501 | T | C | 0.833 | 0.660 | 7.38E‐07 | 1.54E‐05 | 1.98E‐04 | 7.38E‐07 | 2.580 | 1.766 | 3.769 | RXRA | ‐92815 |
| 19 | rs995834a | 28866596 | C | T | 0.580 | 0.425 | 1.28E‐04 | 1.20E‐06 | 1.51E‐01 | 1.20E‐06 | 1.871 | 1.364 | 2.566 | LOC100420587 | 307385 |
| 1 | rs922107a | 90022796 | G | A | 0.323 | 0.211 | 1.55E‐03 | 9.07E‐02 | 2.73E‐06 | 2.73E‐06 | 1.788 | 1.250 | 2.558 | LRRC8B | 0 |
| 7 | rs1425132a | 37562368 | T | C | 0.740 | 0.666 | 4.55E‐02 | 7.35E‐01 | 4.68E‐06 | 4.68E‐06 | 1.430 | 1.013 | 2.017 | LOC442668 | 62349 |
| 1 | rs6429703a | 15339960 | T | C | 0.200 | 0.078 | 8.40E‐06 | 2.59E‐05 | 5.61E‐02 | 8.40E‐06 | 2.942 | 1.802 | 4.804 | RP1‐21O18.1 | 0 |
SNPs used for weighted genetic risk score analyses. BP, SNP genomic location; CHR, chromosome; inf, infinity; L95, lower 95% confidence interval; N/A, not applicable; NRA, non‐risk allele; OR, odds ratio; P_allelic, P‐value from allelic model; P_dom, P‐value from dominant model; P_min, minimum P‐value among the three models; P_rec, P‐value from recessive model; RA, risk allele; RAF, risk allele frequency; rel.loci, distance of the SNP from the gene; U95, upper 95% confidence interval.
Among these datasets, GWAS carried out using samples who were given: (i) any kind of platinum‐based chemotherapy (428 cases vs 743 controls); (ii) cisplatin‐based chemotherapy (176 cases vs 471 controls); or (iii) carboplatin‐based chemotherapy (261 cases vs 262 controls) identified SNPs showing the most significant association with chemotherapy‐induced severe neutropenia/leucopenia are: rs4886670 (P min = 9.86 × 10⁻⁷, OR = 1.61, 95% CI = 1.33–1.94) near RPL36AP45 for (i); rs10253216 (P min = 1.68 × 10⁻⁷, OR = 1.48, 95% CI = 1.16–1.89) near AGR2 for (ii); and rs11071200 (P min = 8.51 × 10⁻⁷, OR = 8.24, 95% CI = 2.89–23.5) on PRTG for (iii) (Table 2, Table S1, Fig. S2b). For the anthracycline‐based regimen, we carried out GWAS with individuals given all anthracycline‐based (184 cases vs 459 controls), doxorubicin‐based (83 cases vs 66 controls), and epirubicin‐based (83 cases vs 370 controls) chemotherapy, and identified three SNPs, rs10040979 (P min = 4.60 × 10⁻⁷, OR = 1.45, 95% CI = 1.12–1.88) in EBF1, rs11857176 (P min = 8.08 × 10⁻⁷, OR = 1.80, 95% CI = 1.13–2.87) near a hypothetical gene LOC100302666, and rs4149639 (P min = 2.89 × 10⁻⁷, OR = 4.44, 95% CI = 2.57–7.68) in TNFRSF1A, to be most significantly associated with the risk of high‐grade neutropenia/leucopenia, respectively (Table 2, Table S1, Fig. S2c). In the case of antimicrotubule agents, we carried out three different GWAS with individuals who were treated with antimicrotubule (371 cases vs 825 controls), paclitaxel‐based (218 cases vs 364 controls), or docetaxel‐based (147 cases vs 233 controls) regimens. We identified three SNPs, rs11651483 (P min = 3.37 × 10⁻⁷, OR = 1.36, 95% CI = 1.12–1.64) in RICH2, rs922106 (P min = 9.28 × 10⁻⁷, OR = 1.68, 95% CI = 1.28–2.21) in LRRC8B and rs3747851 (P min = 5.61 × 10⁻⁷, OR = 2.38, 95% CI = 1.69–3.34) in DAB2IP, to be those most significantly associated with the increased risk of severe neutropenia/leucopenia, respectively (Table 2, Table S1, Fig. S2e). Our previous report by Kiyotani et al.24 identified four SNPs to be associated with gemcitabine‐induced hematological toxicities. Three of the four SNPs were included in the current study with suggestive association, rs12046844 (P min = 5.84 × 10⁻⁴, OR = 2.53, 95% CI = 1.45–4.43), rs6430443 (P min = 8.61 × 10⁻⁴, OR = 6.33, 95% CI = 1.90–22.2; r 2 = 0.895 with rs1901440) and rs11719165 (P min = 1.16 × 10⁻², OR = 2.36, 95% CI = 1.18–4.70) (Table S4). However, it is noted that some of the samples used in this study overlapped with those in the study reported by Kiyotani et al., as both sourced samples from Biobank Japan.
Lastly, we also attempted to identify genetic variants associated with combined treatment of paclitaxel and carboplatin‐induced severe neutropenia/leucopenia (150 cases vs 166 controls), as this combined treatment is commonly used as the standard therapy for both ovarian and lung cancers. We found the most significant association with the SNP rs12310399 (P min = 2.46 × 10⁻⁷, OR = 1.85, 95% CI = 1.33–2.58) near the FGD6 gene (Table 2, Table S1, Fig. S2a), which is suggested to activate CDC42, a member of the Ras‐like family of Rho and Rac proteins, and has a critical role in regulating the actin cytoskeleton. The second strongest association was observed at the locus encoding RXRA (P min = 7.38 × 10⁻⁷, OR = 2.58, 95% CI = 1.77–3.77), an important transcriptional factor. We also calculated the cumulative genetic scores using SNPs on six loci and identified that individuals in group 4 could have 188 times (95% CI = 36.1–979) higher risk of developing severe neutropenia/leucopenia than those belonging to group 1 with the sensitivity of 95.9% and the specificity of 88.9% (Table S2). Because this drug combination is of clinical importance, we further investigated the association of these six selected loci using 161 individuals who developed grade 1/2 neutropenia/leucopenia, using cases registered in the Biobank Japan. Interestingly, the association results for the six loci were moderate for grade 1/2 neutropenia/leucopenia, with intermediate allele frequency and OR between individuals without any adverse reactions and those with neutropenia/leucopenia of ≥grade 3 (Table S3). In addition, as shown in Table 3 and Figure 1, the higher the calculated score becomes, the higher the proportion and grade of neutropenia/leucopenia. The intermediate scores for patients with grade 1/2 neutropenia/leucopenia could imply the possible usefulness of this scoring system for the prediction.
Table 3.
Weighted genetic risk score (wGRS) analysis of cancer patients who received combination treatment with paclitaxel and carboplatin
| wGRS group | Score | G3G4 | G1G2 | G0 | %_G3G4 | %_G1G2 | %_G0 | G3/4 versus G0 | G1/2 versus G0 | ||||
|---|---|---|---|---|---|---|---|---|---|---|---|---|---|
| OR | 95%_CI | P‐value | OR | 95%_CI | P‐value | ||||||||
| 1 | <5.802 | 2 | 21 | 48 | 0.03 | 0.29 | 0.68 | REF | REF | ||||
| 2 | 5.802–7.665 | 36 | 58 | 77 | 0.21 | 0.34 | 0.45 | 11.2 | 2.58–48.70 | 8.69E‐05 | 1.72 | 0.93–3.19 | 9.55E‐02 |
| 3 | 7.665–9.528 | 64 | 62 | 33 | 0.40 | 0.39 | 0.21 | 46.5 | 10.60–204.00 | 2.36E‐13 | 4.29 | 2.21–8.35 | 1.61E‐05 |
| 4 | >9.528 | 47 | 20 | 6 | 0.64 | 0.28 | 0.08 | 188.0 | 36.10–979.00 | 4.78E‐20 | 7.62 | 2.68–21.70 | 6.08E‐05 |
| Total | 149 | 161 | 164 | ||||||||||
95%_CI, 95% confidence interval; G0, individuals who did not develop any adverse drug reaction; G1G2, grade 1 and grade 2 neutropenia (mild); G3G4, grade 3 and grade 4 neutropenia (severe); OR, odds ratio; REF, reference.
Figure 1.
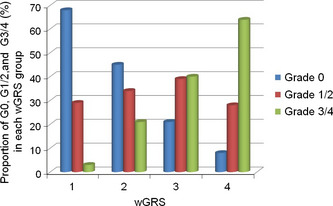
Proportions of cancer patients who developed no adverse reaction (G0), mild neutropenia/leucopenia (G1/2), or severe neutropenia/leucopenia (G3/4) in each of the weighted genetic risk score (wGRS) score groups. All patients received combined treatment with paclitaxel and carboplatin and were registered with Biobank Japan. The total numbers of patients in scores 1, 2, 3, and 4 are 71, 171, 159, and 73, respectively.
Furthermore, we used simulation to estimate how many samples are required to validate this scoring result. We started off by estimating the incidence of neutropenia/leucopenia by the combined treatment of paclitaxel and carboplatin. In Biobank Japan, a total of 477 individuals received this combined treatment; among them, 166 individuals (35%) did not develop any adverse drug reactions, 161 (35%) developed mild neutropenia/leucopenia (grade 1 or 2) and 150 (30%) developed severe neutropenia/leucopenia (grade 3 or higher). The frequency of developing severe neutropenia/leucopenia is in agreement with a multicenter study reported by Guastalla et al.25 When we assume that 100 patients who receive this combination therapy are prospectively registered, the incidences of the adverse drug reactions are estimated as shown in Table 4. If we categorize the patients by wGRS according to the proportions indicated in Table 3 (and our hypothesis is right), the statistical power should be enough to validate by this small subset of patients. Even if two individuals in both group 1 and group 4 are incorrectly predicted, the calculated P‐value is still 0.03 by Fisher's exact test.
Table 4.
Simulation of weighted genetic risk score (wGRS) analysis for a prospective study of 100 patients who received combination treatment with paclitaxel and carboplatin
| Estimated verification samples (n = 100; 35 expected to have grade 1/2 neutropenia) | |||||
|---|---|---|---|---|---|
| wGRS group | G3G4 | G0 | OR | 95%_CI | P‐value |
| 1 | 0 | 10 | |||
| 2 | 7 | 17 | 9.0 | 0.47–174.00 | 7.82E‐02 |
| 3 | 13 | 7 | 37.8 | 1.93–740.00 | 1.06E‐03 |
| 4 | 10 | 1 | 147.0 | 5.35–4040.00 | 3.40E‐05 |
| Total | 30 | 35 | |||
95%_CI, 95% confidence interval; G0, individuals without any adverse drug reaction; G3G4, grade 3 and 4 neutropenia (severe); OR, odds ratio.
Discussion
In this study, we carried out GWAS analyses for a total of 17 subsets of chemotherapies to identify genetic variants that might be associated with chemotherapeutic‐induced neutropenia/leucopenia with grades 3 and 4, however, we could not identify any SNPs that surpassed the genome‐wide significant threshold (P‐value < 5 × 10⁻⁸). Through this study, we encountered several important issues, which are now common problems in pharmacogenomics studies using retrospective clinical data, including confounding factors and heterogeneous treatments for individual patients (often given different combinations of drugs, different dosage of drugs, and different time‐periods of treatment), that increase the complexity of studies and generate various noises in the analyses, and diminished the statistical power in the case–control association studies. We understand that our current approach was not an ideal study design, but it is not easy to perfectly standardize therapy in the daily clinical practice of cancer treatment. There are several factors contributing to the variability in treatments: (i) there is some preference by doctors or by hospitals to select a particular regimen among the various recommended standard treatments; (ii) the modifications (adjustments) of the dosage or schedule according to the patient's conditions (performance status, results of laboratory tests, etc.); and (iii) although we have been collecting the clinical information, it is not perfect to collect complete clinical information in some hospitals, particularly those that do not use electronic medical records. One can say that this kind of study should be performed as a prospective design, however, due to the very rapid advances in the development of novel molecular‐targeted drugs and new regimens in the oncology area, the protocols have been and will be modified or improved. Hence, spending many years and a huge budget on a prospective study may result in a clinically useless outcome, because the results are unable to be applied due to the replacement of the study protocol with a new protocol, when the results of association studies are available. Nevertheless, retrospective pharmacogenomic studies could be improved by implementing electronic medical record systems that could include detailed descriptions of patients' conditions and their responses to various drugs.
Although we understand the pitfalls in study designs like our present study, we need to seek possible ways to identify candidate genetic variants that might contribute to improvement in the clinical management of cancer patients, including chemotherapy‐induced severe neutropenia/leucopenia. Nevertheless, some of the candidate genes that we identified are of interest, considering their known functions as well as their relations with drug actions. For example, the proto‐oncogene AGR2, whose genetic variants were suggested to associate with cisplatin‐induced neutropenia/leucopenia, encodes an anterior gradient 2 homolog (Xenopus laevis) that is known to play a critical role in cell migration, cell differentiation, and cell growth.26 Cells stably expressing AGR2 confer resistance to cisplatin in vivo, compared with control cells (empty vector) in a xenograft animal model.27 The second example is TNFRSF1A, suggested to be associated with anthracycline‐based and epirubicin‐induced neutropenia/leucopenia. This gene encodes TNFRSF1A, which is a major receptor for TNF‐α. The soluble TNFRSF1A level was found to be elevated after 1 month of anthracycline‐based chemotherapy.28 Additionally, both TNF‐α and TNFRSF1A are known to play a critical role in doxorubicin‐induced cardiotoxicity, in which doxorubicin stimulates an increase in circulating TNF and upregulates TNFRSF1A.29, 30 Furthermore, genetic variants on PDE4D, which encodes for phosphodiesterase 4D, cAMP‐specific, showed suggestive association with gemcitabine‐induced severe neutropenia/leucopenia. Ablation of PDE4D has been reported to impair the neutrophil function with altered chemotaxis ability and adhesion capability as well as to reduce neutrophil recruitment to the site of inflammation.31 Besides, genetic variants on RXRA identified to be associated with combined treatment of paclitaxel and carboplatin‐induced severe neutropenia/leucopenia, encodes retinoid X receptor alpha. Disruption of this gene in mouse models moderately alters lymphocyte proliferation and survival, and affects the T helper type1/type 2 balances.32 All of these genes might provide some important insights into the mechanism of various chemotherapy‐induced severe neutropenia/leucopenia, however, further validations are definitely essential.
As already described, the GWAS approach could provide a list of genetic variants that might be associated with complex phenotypes (drug responsiveness or drug‐induced adverse reactions) in pharmacogenomics studies. One of the clinically important aims for identification of the associated genetic variants is to establish a prediction model to identify individuals who are at risk of adverse reactions with certain drugs or protocols. In this study, we have applied the wGRS system, by which we could distinguish high‐risk patients from low‐risk individuals by counting the number of risk alleles of the suggestively‐associated SNPs in combination with estimating the effect size of each SNP. One of the best examples from this study was indicated by a scoring system using six candidate SNP loci that were identified through the GWAS of severe neutropenia/leucopenia caused by combination treatment of paclitaxel and carboplatin; among 53 individuals in the high‐risk group (group 4) by this scoring method, 47 (89%) revealed high‐grade neutropenia/leucopenia. In contrast, among 50 individuals in the low‐risk group (group 1), only 2 (4%) revealed high‐grade neutropenia/leucopenia, and the odds ratio to have the severe adverse reaction in individuals belonging to group 4 was calculated to be 188 times higher than those categorized to group 1 (Table 3). Interestingly, individuals who developed grade 1/2 (mild neutropenia/leucopenia) were found to show intermediate risk scores between patients with severe neutropenia/leucopenia and those without any adverse reactions. Hence, we suggest that wGRS is an applicable method to evaluate the clinical utility of possible variants with specific phenotypes. However, the data are preliminary and require verification by an independent test sample(s) before any definitive conclusions can be drawn. But, considering that the OR of the high‐risk group is very high, the number of samples required for the verification (if our hypothesis is right) is not so large. In fact, we have tried to simulate a prospective study design using a model of 100 patients according to the assumption that 35% individuals will not develop any adverse drug reactions, 35% individuals will develop mild neutropenia/leucopenia (grade 1/2), and 30% will develop severe neutropenia/leucopenia (grade 3/4). As shown in Table 4, the study of 100 patients should have very strong statistical power to verify. If this is verified, as we expect, it should improve the quality of lives of cancer patients and also contribute to reducing medical care costs by avoiding unnecessary adverse events. However, to achieve success in pharmacogenomics and personalized medicine, both local and international collaborative efforts are essential.
Disclosure Statement
The authors have no conflict of interest.
Abbreviations
- GWAS
genome‐wide association study
- OR
odds ratio
- SD
standard deviation
- SNP
single nucleotide polymorphism
- TNFRSF1A
tumor necrosis factor receptor superfamily, member 1A
- TNF‐α
tumor necrosis factor‐α
- wGRS
weighted genetic risk score
Supporting information
Fig. S1. Quantile–quantile plots of 17 genome‐wide association studies of drug‐induced or drug subgroup‐induced severe neutropenia and their corresponding lambda (λ) value.
Fig. S2. (a) Manhattan plot for genome‐wide association study of cyclophosphamide and paclitaxel + carboplatin induced severe neutropenia/leucopenia. (b) Manhattan plot for genome‐wide association study of severe neutropenia/leucopenia induced by all types of platinum‐based agents, cisplatin, or carboplatin. (c) Manhattan plot for genome‐wide association study of severe neutropenia/leucopenia induced by all types of anthracycline‐based agents, doxorubicin, or epirubicin. (d) Manhattan plot for genome‐wide association study of severe neutropenia/leucopenia induced by all types of antimetabolite agents, 5‐fluorouracil, or gemcitabine. (e) Manhattan plot for genome‐wide association study of severe neutropenia induced by all types of antimicrotubule agents, paclitaxel, or docetaxel. (f) Manhattan plot for genome‐wide association study severe neutropenia/leucopenia induced by all types of topoisomerase inhibitors, camptothecin, or etoposide.
Table S1. Genome‐wide association study of each chemotherapy regimen with P < 1 × 10⁻⁴.
Table S2. Weighted genetic risk score of each genome‐wide association study of specific chemotherapeutic‐based induced severe neutropenia/leucopenia.
Table S3. Association study of cancer patients who do not develop any adverse drug reaction and those who developed neutropenia/leucopenia after being given combination treatment with paclitaxel and carboplatin.
Table S4. Association of previously reported SNPs that associated with gemcitabine induced hematological toxicity.
Acknowledgments
We would like to express our heartfelt gratitude to all the patients who participated in this study. We convey our sincere appreciation to Dr Teruhiko Yoshida and Dr Hiromi Sakamoto from the National Cancer Center Research Institute for their kind support. Our thanks also goes to the members of the laboratory for statistical analysis and the laboratory for the genotyping development from the Center for Genomic Medicine for their kind support and fruitful discussions. We would like to extend our gratitude to the staff of Biobank Japan for their outstanding assistance. This work was carried out as part of the Biobank Japan Project, supported by the Ministry of Education, Culture, Sports, Sciences and Technology, Japan. In addition, this project was supported by the JSPS postdoctoral fellowship.
(Cancer Sci 2013; 104: 1074–1082)
References
- 1. Wheeler HE, Maitland ML, Dolan ME, Cox NJ, Ratain MJ. Cancer pharmacogenomics: strategies and challenges. Nat Rev Genet 2013; 14: 23–34. [DOI] [PMC free article] [PubMed] [Google Scholar]
- 2. Relling MV, Hancock ML, Rivera GK et al Mercaptopurine therapy intolerance and heterozygosity at the thiopurine S‐methyltransferase gene locus. J Natl Cancer Inst 1999; 91: 2001–8. [DOI] [PubMed] [Google Scholar]
- 3. Weinshilboum RM, Sladek SL. Mercaptopurine pharmacogenetics: monogenic inheritance of erythrocyte thiopurine methyltransferase activity. Am J Hum Genet 1980; 32: 651–62. [PMC free article] [PubMed] [Google Scholar]
- 4. Relling MV, Klein TE. CPIC: clinical Pharmacogenetics Implementation Consortium of the Pharmacogenomics Research Network. Clin Pharmacol Ther 2011; 89: 464–7. [DOI] [PMC free article] [PubMed] [Google Scholar]
- 5. Innocenti F, Undevia SD, Iyer L et al Genetic variants in the UDP‐glucuronosyltransferase 1A1 gene predict the risk of severe neutropenia of irinotecan. J Clin Oncol 2004; 22: 1382–8. [DOI] [PubMed] [Google Scholar]
- 6. Iyer L, Das S, Janisch L et al UGT1A1*28 polymorphism as a determinant of irinotecan disposition and toxicity. Pharmacogenomics J 2002; 2: 43–7. [DOI] [PubMed] [Google Scholar]
- 7. Hoskins JM, Goldberg RM, Qu P, Ibrahim JG, McLeod HL. UGT1A1*28 genotype and irinotecan‐induced neutropenia: dose matters. J Natl Cancer Inst 2007; 99: 1290–5. [DOI] [PubMed] [Google Scholar]
- 8. McCarthy MI, Abecasis GR, Cardon LR et al Genome‐wide association studies for complex traits: consensus, uncertainty and challenges. Nat Rev Genet 2008; 9: 356–69. [DOI] [PubMed] [Google Scholar]
- 9. Triendl R. Japan launches controversial Biobank project. Nat Med 2003; 9: 982. [DOI] [PubMed] [Google Scholar]
- 10. Takata R, Akamatsu S, Kubo M et al Genome‐wide association study identifies five new susceptibility loci for prostate cancer in the Japanese population. Nat Genet 2010; 42: 751–4. [DOI] [PubMed] [Google Scholar]
- 11. Akamatsu S, Takata R, Haiman CA et al Common variants at 11q12, 10q26 and 3p11.2 are associated with prostate cancer susceptibility in Japanese. Nat Genet 2012; 44: 426–9, S1. [DOI] [PubMed] [Google Scholar]
- 12. Cui R, Kamatani Y, Takahashi A et al Functional variants in ADH1B and ALDH2 coupled with alcohol and smoking synergistically enhance esophageal cancer risk. Gastroenterology 2009; 137: 1768–75. [DOI] [PubMed] [Google Scholar]
- 13. Cui R, Okada Y, Jang SG et al Common variant in 6q26‐q27 is associated with distal colon cancer in an Asian population. Gut 2011; 60: 799–805. [DOI] [PMC free article] [PubMed] [Google Scholar]
- 14. Kumar V, Kato N, Urabe Y et al Genome‐wide association study identifies a susceptibility locus for HCV‐induced hepatocellular carcinoma. Nat Genet 2011; 43: 455–8. [DOI] [PubMed] [Google Scholar]
- 15. Low SK, Kuchiba A, Zembutsu H et al Genome‐wide association study of pancreatic cancer in Japanese population. PLoS ONE 2010; 5: e11824. [DOI] [PMC free article] [PubMed] [Google Scholar]
- 16. Elgazzar S, Zembutsu H, Takahashi A et al A genome‐wide association study identifies a genetic variant in the SIAH2 locus associated with hormonal receptor‐positive breast cancer in Japanese. J Hum Genet 2012; 57: 766–71. [DOI] [PubMed] [Google Scholar]
- 17. Miki D, Ochi H, Hayes CN et al Variation in the DEPDC5 locus is associated with progression to hepatocellular carcinoma in chronic hepatitis C virus carriers. Nat Genet 2011; 43: 797–800. [DOI] [PubMed] [Google Scholar]
- 18. Miki D, Kubo M, Takahashi A et al Variation in TP63 is associated with lung adenocarcinoma susceptibility in Japanese and Korean populations. Nat Genet 2010; 42: 893–6. [DOI] [PubMed] [Google Scholar]
- 19. Cha PC, Zembutsu H, Takahashi A, Kubo M, Kamatani N, Nakamura Y. A genome‐wide association study identifies SNP in DCC is associated with gallbladder cancer in the Japanese population. J Hum Genet 2012; 57: 235–7. [DOI] [PubMed] [Google Scholar]
- 20. Silvestris N, Del Re M, Azzariti A et al Optimized granulocyte colony‐stimulating factor prophylaxis in adult cancer patients: from biological principles to clinical guidelines. Expert Opin Ther Targets 2012; 16(Suppl 2): S111–7. [DOI] [PubMed] [Google Scholar]
- 21. Yamaguchi‐Kabata Y, Nakazono K, Takahashi A et al Japanese population structure, based on SNP genotypes from 7003 individuals compared to other ethnic groups: effects on population‐based association studies. Am J Hum Genet 2008; 83: 445–56. [DOI] [PMC free article] [PubMed] [Google Scholar]
- 22. Low SK, Takahashi A, Cha PC et al Genome‐wide association study for intracranial aneurysm in the Japanese population identifies three candidate susceptible loci and a functional genetic variant at EDNRA. Hum Mol Genet 2012; 21: 2102–10. [DOI] [PubMed] [Google Scholar]
- 23. De Jager PL, Chibnik LB, Cui J et al Integration of genetic risk factors into a clinical algorithm for multiple sclerosis susceptibility: a weighted genetic risk score. Lancet Neurol 2009; 8: 1111–9. [DOI] [PMC free article] [PubMed] [Google Scholar]
- 24. Kiyotani K, Uno S, Mushiroda T et al A genome‐wide association study identifies four genetic markers for hematological toxicities in cancer patients receiving gemcitabine therapy. Pharmacogenet Genomics 2012; 22: 229–35. [DOI] [PubMed] [Google Scholar]
- 25. Guastalla JP, Pujade‐Lauraine E, Weber B et al Efficacy and safety of the paclitaxel and carboplatin combination in patients with previously treated advanced ovarian carcinoma. A multicenter GINECO (Group d'Investigateurs Nationaux pour l'Etude des Cancers Ovariens) phase II study. Ann Oncol 1998; 9: 37–43. [DOI] [PubMed] [Google Scholar]
- 26. Wang Z, Hao Y, Lowe AW. The adenocarcinoma‐associated antigen, AGR2, promotes tumor growth, cell migration, and cellular transformation. Cancer Res 2008; 68: 492–7. [DOI] [PubMed] [Google Scholar]
- 27. Hengel SM, Murray E, Langdon S et al Data‐independent proteomic screen identifies novel tamoxifen agonist that mediates drug resistance. J Proteome Res 2011; 10: 4567–78. [DOI] [PMC free article] [PubMed] [Google Scholar]
- 28. Perik PJ, De Vries EG, Boomsma F et al The relation between soluble apoptotic proteins and subclinical cardiotoxicity in adjuvant‐treated breast cancer patients. Anticancer Res 2006; 26: 3803–11. [PubMed] [Google Scholar]
- 29. Mukherjee S, Banerjee SK, Maulik M, Dinda AK, Talwar KK, Maulik SK. Protection against acute adriamycin‐induced cardiotoxicity by garlic: role of endogenous antioxidants and inhibition of TNF‐alpha expression. BMC Pharmacol 2003; 3: 16. [DOI] [PMC free article] [PubMed] [Google Scholar]
- 30. Gilliam LA, St Clair DK. Chemotherapy‐induced weakness and fatigue in skeletal muscle: the role of oxidative stress. Antioxid Redox Signal 2011; 15: 2543–63. [DOI] [PMC free article] [PubMed] [Google Scholar]
- 31. Ariga M, Neitzert B, Nakae S et al Nonredundant function of phosphodiesterases 4D and 4B in neutrophil recruitment to the site of inflammation. J Immunol 2004; 173: 7531–8. [DOI] [PubMed] [Google Scholar]
- 32. Stephensen CB, Borowsky AD, Lloyd KC. Disruption of Rxra gene in thymocytes and T lymphocytes modestly alters lymphocyte frequencies, proliferation, survival and T helper type 1/type 2 balance. Immunology 2007; 121: 484–98. [DOI] [PMC free article] [PubMed] [Google Scholar]
Associated Data
This section collects any data citations, data availability statements, or supplementary materials included in this article.
Supplementary Materials
Fig. S1. Quantile–quantile plots of 17 genome‐wide association studies of drug‐induced or drug subgroup‐induced severe neutropenia and their corresponding lambda (λ) value.
Fig. S2. (a) Manhattan plot for genome‐wide association study of cyclophosphamide and paclitaxel + carboplatin induced severe neutropenia/leucopenia. (b) Manhattan plot for genome‐wide association study of severe neutropenia/leucopenia induced by all types of platinum‐based agents, cisplatin, or carboplatin. (c) Manhattan plot for genome‐wide association study of severe neutropenia/leucopenia induced by all types of anthracycline‐based agents, doxorubicin, or epirubicin. (d) Manhattan plot for genome‐wide association study of severe neutropenia/leucopenia induced by all types of antimetabolite agents, 5‐fluorouracil, or gemcitabine. (e) Manhattan plot for genome‐wide association study of severe neutropenia induced by all types of antimicrotubule agents, paclitaxel, or docetaxel. (f) Manhattan plot for genome‐wide association study severe neutropenia/leucopenia induced by all types of topoisomerase inhibitors, camptothecin, or etoposide.
Table S1. Genome‐wide association study of each chemotherapy regimen with P < 1 × 10⁻⁴.
Table S2. Weighted genetic risk score of each genome‐wide association study of specific chemotherapeutic‐based induced severe neutropenia/leucopenia.
Table S3. Association study of cancer patients who do not develop any adverse drug reaction and those who developed neutropenia/leucopenia after being given combination treatment with paclitaxel and carboplatin.
Table S4. Association of previously reported SNPs that associated with gemcitabine induced hematological toxicity.