

ABSTRACT
Background
Aging is associated with skeletal muscle anabolic resistance (i.e., reduced muscle protein synthesis during anabolic conditions such as hyperaminoacidemia). The results from studies conducted in cell culture systems and animals suggest that both vitamin D and conjugated linoleic acids (CLAs) stimulate muscle protein synthesis.
Objectives
To conduct a randomized, double-blind, placebo-controlled clinical trial to determine the independent and combined effects of dietary vitamin D and CLA supplementation on myofibrillar protein synthesis rates in sedentary older adults.
Methods
Thirty-two sedentary, older adults were randomized to receive either: 1) 2000 IU vitamin D-3 (Vit D) per day; 2) 4000 mg CLA per day; 3) both Vit D (2000 IU/d) and CLA (4000 mg/d); or 4) placebo for 8 wk. Myofibrillar protein synthesis rates were evaluated by using intravenous [ring-2H5]phenylalanine infusion in conjunction with muscle biopsies during basal, postabsorptive conditions and during combined amino acid and insulin infusion before and after the supplementation period.
Results
Before the intervention, basal myofibrillar protein synthesis rates were not different among groups (Placebo: 0.033 ± 0.003; Vit D: 0.034 ± 0.002; CLA: 0.029 ± 0.005; Vit D + CLA: 0.038 ± 0.005 %·h-1), and hyperinsulinemia–hyperaminoacidemia increased myofibrillar protein synthesis rates by ∼35%. Compared with placebo, neither Vit D nor CLA nor combined Vit D + CLA supplementation affected the basal myofibrillar protein synthesis rates (placebo: 0.040 ± 0.004%/h; Vit D: 0.044 ± 0.006%/h; CLA: 0.039 ± 0.006%/h; Vit D + CLA: 0.040 ± 0.007%/h) or the hyperinsulinemia–hyperaminoacidemia–induced increase in myofibrillar protein synthesis (percentage increase from basal before and after the interventions: placebo, 30 ± 11 and 36 ± 11; Vit D, 38 ± 8 and 34 ± 10; CLA, 50 ± 14 and 51 ± 16; Vit D + CLA, 29 ± 15 and 35 ± 8).
Conclusions
Vitamin D and/or CLA supplementation, at the doses provided in our study, does not have muscle anabolic effects in sedentary older adults.
The study was registered at clinicaltrials.gov (NCT03115775).
Keywords: vitamin D, conjugated linoleic acids, aging, sarcopenia, skeletal muscle, dietary supplements, protein synthesis
Introduction
Aging is associated with a progressive decline in muscle mass (1, 2), which is at least partly due to age-associated anabolic resistance (i.e., reduced muscle protein synthesis during anabolic conditions such as hyperaminoacidemia) (3–8). The results from studies conducted in cell culture systems and animals suggest that both vitamin D and conjugated linoleic acids (CLAs) can increase muscle protein synthesis and attenuate or even prevent the age-associated decline in muscle mass. First, vitamin D enhanced the stimulating effect of leucine and insulin on protein synthesis in murine C2C12 myotubes in a dose-dependent manner (9). Second, mice with deletion of the vitamin D receptor in myocytes had ∼10% lower muscle mass compared with controls (10), and dietary vitamin D depletion decreased the rate of muscle protein synthesis by ∼40% in healthy old rats (11). Third, adding CLA to the diet of healthy old mice and rats increased the muscle protein synthesis rate (12) and prevented the age-associated decline in skeletal muscle mass (13, 14). Although the mechanisms responsible for the anabolic effects of vitamin D and CLA are unclear, they are likely different, and therefore most likely additive, because CLA increased the basal rate of muscle protein synthesis only (12), whereas vitamin D increased the basal rate of muscle protein synthesis and augmented the amino acid–induced increase in muscle protein synthesis rate (9, 11). The effects of vitamin D and CLA on muscle protein turnover in people are unknown, and the results from studies that evaluated the effect of vitamin D on muscle mass are equivocal, most likely because they used a cross-sectional study design and/or short-term interventions (15–28), which makes it difficult to detect small changes in muscle mass. However, treatment-induced changes in the rate of muscle protein synthesis that cause an increase in muscle mass typically occur quickly and are readily detectable (6, 29–31). To fill this gap, we conducted a randomized, double-blind, placebo-controlled clinical trial to determine the independent and combined effects of dietary vitamin D and CLA supplementation on the rate of muscle protein synthesis in older adults. Participants received either:1) 2000 IU vitamin D-3 (Vit D)/d; 2) 4000 mg CLA/d; 3) both Vit D (2000 IU/d) and CLA (4000 mg/d); or 4) placebo for 8 wk. Myofibrillar protein synthesis rates were evaluated by using an intravenous [ring-2H5]phenylalanine infusion in conjunction with muscle biopsies during basal, postabsorptive conditions and during combined amino acid and insulin infusion before and after 8 wk of consuming the supplements.
Methods
Study participants
Participant recruitment and flow is shown in Supplemental Figure 1. A total of 70 men and women were assessed for eligibility and 32 completed this randomized, double-blind, placebo-controlled trial between July 2017 and July 2019. All participants were considered in good health (i.e., no evidence of significant cardiovascular disease or organ dysfunction) after completing a comprehensive medical evaluation, which included a health history and physical examination and standard blood tests. Furthermore, all participants fulfilled the following inclusion criteria: ≥60 and ≤85 y old, BMI ≥18.5 or ≤35 kg/m2, stable body weight, not engaged in an exercise program for ≥3 consecutive months before starting the study, and suboptimal serum 25-hydroxyvitamin D concentration, defined as <35 ng/mL (32–34). None of the participants used tobacco products, or consumed excessive amounts of alcohol (>1 drink/d), or took dietary supplements or medications that could affect muscle protein metabolism or were incompatible with the study procedures (e.g., fish oil, anticoagulants). Participants’ total body fat mass and fat-free mass (FFM) were measured by using DXA (Lunar iDXA; GE Healthcare). Written, informed consent was obtained from all participants before their participation in the study, which was approved by the Human Research Protection Office and the Clinical Research Unit Advisory Committee at Washington University School of Medicine in St Louis, MO, and registered on clinicaltrials.gov (NCT03115775).
Experimental protocol
Each participant completed 2 stable isotope-labeled tracer infusion studies to determine the effect of the interventions on the myofibrillar protein synthesis rate during basal, postabsorptive conditions and during combined amino acid and insulin infusion. The first study was performed before starting the intervention; the second took place after 8 wk of dietary supplementation with either: 1) 2000 IU Vit D/d; 2) 4000 mg CLA (Tonalin FFA 80) per day; 3) both Vit D (2000 IU/d) and CLA (4000 mg/d); or 4) placebo (corn oil). Participants were randomly assigned to the groups by the clinical research coordinator using a computerized centralized randomization scheme before baseline testing. All key study personnel and participants were blinded to the treatments. All supplements were packaged in identical-looking capsules, and were donated by BASF SE. Compliance was evaluated by pill count; in addition, we assessed changes in serum vitamin D concentration and plasma triglyceride fatty acid composition.
Participants were instructed to adhere to their usual diet and to refrain from vigorous physical activities for ≥3 d before testing. On the evening before the metabolic study, participants were admitted to the Clinical Translational Research Unit at Washington University School of Medicine. At 20:00, participants’ hand grip strength was measured by using a Jamar hydraulic dynamometer (Patterson Medical); immediately thereafter, the participants consumed a standard meal and then rested in bed and fasted (except for water) until completion of the study the next day. At ∼06:00 on the following morning, a cannula was inserted into an antecubital vein for the infusion of [ring-2H5]phenylalanine (Cambridge Isotope Laboratories Inc) to measure the rate of myofibrillar protein synthesis; another cannula was inserted into a vein of the contralateral hand, which was warmed to 50°C for blood sampling. At ∼06:45, a primed, constant infusion of [ring-2H5]phenylalanine (priming dose: 7.9 µmol/kg FFM; infusion rate: 0.07 µmol/kg FFM/min) was started and maintained for 7 h. Four hours after the start of the tracer infusion, a hyperaminoacidemic–hyperinsulinemic clamp was started and maintained for 3 h. Human insulin (Novolin R; Novo Nordisk) was infused at a rate of 20 mU/m2 body surface area (BSA)·per minute (initiated with priming doses of 80 mU/m2 BSA/min for 5 min and then 40 mU/m2 BSA/min for an additional 5 min) and Travasol 10% (Baxter) was infused at a rate of 105 mg amino acids/kg FFM/h (priming dose: 35 mg amino acids/kg FFM) to raise plasma insulin and amino acid concentrations to within the range normally seen after meal consumption (35–37). Euglycemia (blood glucose concentration of ∼100 mg/dL) was maintained during the clamp procedure by variable-rate infusion of 20% dextrose (Baxter). To minimize changes in plasma phenylalanine isotopic enrichment during the clamp due to the increased amino acid rate of appearance in plasma, the [ring-2H5]phenylalanine infusion rate was increased to 0.14 µmol/kg FFM/min during the clamp.
Blood samples were obtained before beginning the tracer infusions and at 60, 120, 180, 210, 220, 230, 240, 300, 360, 390, 400, 410, and 420 min to determine the labeling of phenylalanine in plasma and plasma glucose, amino acid, and insulin concentrations. Additional blood was obtained every 10 min during the clamp to monitor plasma glucose concentration. Muscle tissue (∼100 mg) was obtained under local anesthesia (lidocaine, 2%) from the vastus lateralis portion of the quadriceps femoris by using a Tilley–Henkel forceps at 60 min and 240 min (to determine the basal myofibrillar protein synthesis rate) and at 420 min, that is, 3 h after starting the clamp procedure (to determine the myofibrillar protein synthesis rate during hyperaminoacidemia–hyperinsulinemia). The first and second biopsies were obtained from the same incision but the forceps was directed in a proximal and distal direction, respectively, so that the 2 biopsies were collected ∼5–10 cm apart. The third biopsy was obtained from the contralateral leg. Muscle samples were immediately washed in ice-cold saline solution (0.9% NaCl), snap frozen in liquid nitrogen, and stored at –80°C until further analysis.
Sample processing and analyses
Plasma glucose concentration was measured on an automated glucose analyzer (Yellow Spring Instruments). Plasma insulin concentration was determined by using an immunoassay (Elecsys; Roche Diagnostics). Plasma amino acid concentrations, phenylalanine tracer-to-tracee ratios (TTR), and plasma triglyceride fatty acid composition were determined by using GC-MS (6, 38, 39). To determine phenylalanine labeling in myofibrillar proteins, frozen muscle samples (∼50 mg) were homogenized in 10× w/v of cell lysis buffer (Cell Signaling, #9803) containing 1:100× protease and phosphatase inhibitor cocktail (Cell Signaling, #5870 and #5871, respectively); samples were heated to 50°C with 0.3M NaOH for 30 min and then centrifuged (10,000 × g for 5 min) and the supernatants transferred to glass tubes containing 1M perchloric acid (PCA) to precipitate myofibrillar proteins, which were hydrolyzed overnight with 6N HCl. Amino acids in the protein hydrolysate were purified on cation-exchange columns (Dowex 50W-X8–200, Millipore/Sigma, #217514), and the tertiary ButylDiMethylSilyl (t-BDMS) derivative of phenylalanine prepared to determine its TTR by GC-MS analysis (38, 40).
Calculations
The muscle protein fractional synthesis rate (FSR) was calculated from the rate of incorporation of [ring-2H5]phenylalanine into muscle protein using a standard precursor-product model as follows: FSR = ΔEprotein/Eplasma × 1/t × 100, where ΔEprotein is the change in protein-bound phenylalanine enrichment between 2 consecutive biopsies, Eplasma is the average free phenylalanine TTR in plasma, and t is the time between biopsies. We used the average plasma phenylalanine labeling between 60 and 240 min (basal) and 270 and 420 min (clamp) as surrogate for the phenylalanine labeling in the precursor pool (i.e., aminoacyl-tRNA) (41, 42).
Statistical analysis
Data analysis
Statistical analysis was performed by using GraphPad prism 8 (GraphPad Software) and RStudio version 1.2.1335 (RStudio, Inc). After normal data distribution was confirmed, 1-factor ANOVA was performed to examine whether differences among groups existed in subject characteristics at baseline. Repeated measures ANOVA with group and condition (basal compared with clamp) as factors were used to compare myofibrillar protein FSRs, the primary study outcome, and other metabolic outcomes (e.g., plasma glucose, insulin, and amino acid concentrations) among groups at baseline (before the intervention). ANCOVA with the pretreatment value as covariate was used to evaluate treatment effects on study outcomes (e.g., myofibrillar protein synthesis rates during basal conditions). A P value ≤0.05 was considered statistically significant. Data are presented as means ± SEM unless otherwise noted.
Sample size estimation
In a study we conducted to evaluate the effect of fish oil–derived n–3 PUFA supplementation on the rate of muscle protein synthesis in older adults by using the same study design as in the present study (6), the muscle protein synthesis rates at baseline in the intervention and control groups were 0.036 ± 0.008 and 0.029 ± 0.013%/h, respectively, during basal conditions, and 0.051 ± 0.017 and 0.047 ± 0.018%/h, respectively, during hyperinsulinemia–hyperaminoacidemia. The n–3 PUFA treatment effect during hyperinsulinemia–hyperaminoacidemia was 0.022%/h. Assuming the larger SD during both basal conditions and during hyperinsulinemia-hyperaminoacidemia (0.013%/h and 0.018%/h, respectively), a power ≥0.8, and a significance cut-off value of α ≤ 0.05, we estimated that we could detect a 0.018%/h increase during basal conditions and a 0.025%/h increase during insulin and amino acid infusion with 8 subjects per group. Assuming the smaller SDs (0.008%/h and 0.017%/h), we estimated that we could detect increases of 0.011%/h and 0.023%/h during basal conditions and during hyperinsulinemia–hyperaminoacidemia, respectively, with 8 subjects per group. The power to detect main effects of Vit D or CLA treatment (i.e., Vit D alone and combined Vit D + CLA compared with placebo or CLA alone, and combined Vit D + CLA compared with placebo) exceeds the power to detect treatment effects in each of the groups because of the larger samples size (n = 8 + 8 = 16).
Results
Subject characteristics
Participants in the 4 groups were matched on age, sex, body weight, and body composition (Table 1). Basic metabolic health status and serum vitamin D concentration were not different among groups (Table 1). The calendar month when participants started the interventions, which could affect the vitamin D status due to seasonal differences in exposure to sunlight, was not different among the 4 groups (Vit D: 6.6 ± 1.1; CLA: 5.7 ± 1.2; combined Vit D + CLA: 6.5 ± 1.2; placebo: 6.5 ± 1.2, where January = 1 and December = 12).
TABLE 1.
Subjects’ age, body weight, body composition, and plasma glucose, lipid, and vitamin D concentrations at baseline, before starting the interventions1
| Placebo | Vit D | CLA | Vit D + CLA | |
|---|---|---|---|---|
| Men/women | 3/5 | 3/6 | 4/3 | 3/5 |
| Race (C/AA/other) | 8/0/0 | 8/1/0 | 7/0/0 | 8/0/0 |
| Age, y | 69 ± 1 | 69 ± 2 | 67 ± 2 | 70 ± 2 |
| BMI, kg/m2 | 28 ± 2 | 28 ± 1 | 27 ± 2 | 28 ± 2 |
| Weight, kg | 79 ± 5 | 78 ± 4 | 79 ± 4 | 82 ± 5 |
| Fat-free mass, kg | 48 ± 3 | 46 ± 3 | 50 ± 3 | 48 ± 4 |
| Body fat, % | 38 ± 4 | 41 ± 2 | 36 ± 4 | 40 ± 2 |
| Glucose, mg/dL | 100 ± 4 | 101 ± 3 | 98 ± 4 | 95 ± 3 |
| Triglycerides, mg/dL | 95 ± 13 | 104 ± 11 | 119 ± 25 | 107 ± 12 |
| LDL-cholesterol, mg/dL | 120 ± 14 | 121 ± 9 | 101 ± 14 | 111 ± 6 |
| HDL-cholesterol, mg/dL | 66 ± 6 | 65 ± 4 | 54 ± 7 | 56 ± 5 |
| Vitamin D-3, ng/mL | 29 ± 1 | 23 ± 2 | 27 ± 2 | 23 ± 3 |
Data are mean ± SEM. One-factor ANOVA was used to compare outcomes among groups. AA, African American; C, Caucasian; CLA, conjugated linoleic acid; Vit D, vitamin D.
Compliance with treatment and biomarkers of supplement intake
Average compliance, as judged by the leftover pill count, was 96 ± 2% in the Vit D group, 99 ± 1% in the CLA group, 95 ± 4% in the combined Vit D + CLA group, and 96 ± 5% in the placebo group. The serum vitamin D concentration increased by ∼25% in the Vit D alone and combined Vit D + CLA groups and slightly decreased in the CLA alone and placebo groups (Figure 1). The contribution of linoleic acid to total plasma triglyceride fatty acid content increased in the CLA alone and combined Vit D + CLA groups but remained unchanged in the Vit D alone and placebo groups (Figure 1).
FIGURE 1.
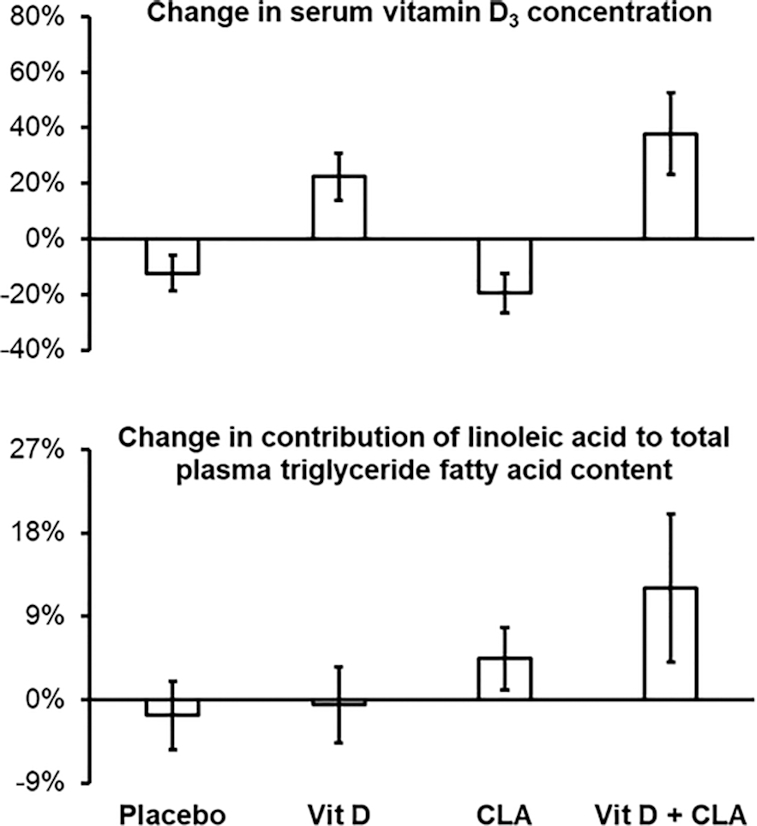
Treatment-induced changes in serum vitamin D-3 concentration (top) and contribution of linoleic acid to total plasma triglyceride fatty acid content (bottom) in the placebo (n = 8), vitamin D (Vit D, n = 9), conjugated linoleic acid (CLA, n = 7), and combined Vit D + CLA (n = 8) supplementation groups. Values are means ± SEM.
Plasma glucose, insulin, and amino acid concentrations and enrichment
Basal plasma glucose, insulin, and amino acid concentrations were not different among the groups before starting the intervention (Table 2). During the hyperinsulinemic–euglycemic clamp with concomitant amino acid infusion, plasma glucose was successfully maintained at ∼100 mg/dL, insulin increased from ∼10 to ∼50 mU/L, and amino acids increased from ∼2300 to ∼3200 µM with no differences among groups (Table 2). Glucose, insulin, and amino acid concentrations were not affected by the treatments (Table 2). Plasma phenylalanine enrichment was stable from the time of the first muscle biopsy to the time of the third muscle biopsy, both before and after the interventions (Supplemental Figure 2).
TABLE 2.
Plasma glucose, insulin, and amino acid concentrations during basal conditions and during the hyperinsulinemic euglycemic clamp with concomitant amino acid infusion before and after the interventions1
| Before | After | |||
|---|---|---|---|---|
| Basal | Clamp | Basal | Clamp | |
| Glucose, mg/dL | ||||
| Placebo | 96 ± 4 | 99 ± 2 | 95 ± 4 | 99 ± 2 |
| Vit D | 96 ± 2 | 99 ± 1 | 95 ± 3 | 97 ± 1 |
| CLA | 95 ± 3 | 98 ± 2 | 95 ± 4 | 100 ± 3 |
| Vit D + CLA | 94 ± 2 | 96 ± 3 | 94 ± 3 | 103 ± 3 |
| Insulin, mU/L | ||||
| Placebo | 8.8 ± 1.7 | 50 ± 6* | 7.8 ± 1.1 | 50 ± 7* |
| Vit D | 9.2 ± 1.0 | 46 ± 2* | 10.0 ± 1.1 | 48 ± 4* |
| CLA | 10.4 ± 3.6 | 47 ± 6* | 9.8 ± 3.3 | 45 ± 5* |
| Vit D + CLA | 9.7 ± 1.2 | 52 ± 6* | 9.3 ± 1.2 | 48 ± 7* |
| Total amino acids, µM | ||||
| Placebo | 2400 ± 275 | 3197 ± 185* | 2327 ± 172 | 3188 ± 137* |
| Vit D | 2242 ± 138 | 3358 ± 195* | 2330 ± 141 | 3313 ± 181* |
| CLA | 2212 ± 76 | 3154 ± 110* | 2347 ± 95 | 3261 ± 114* |
| Vit D + CLA | 2329 ± 128 | 3281 ± 142* | 2537 ± 230 | 3380 ± 206* |
| Essential amino acids, µM | ||||
| Placebo | 1108 ± 153 | 1568 ± 96* | 1086 ± 77 | 1586 ± 73* |
| Vit D | 1081 ± 69 | 1694 ± 113* | 1127 ± 76 | 1710 ± 112* |
| CLA | 1061 ± 40 | 1600 ± 60* | 1123 ± 38 | 1672 ± 64* |
| Vit D + CLA | 1121 ± 68 | 1672 ± 85* | 1158 ± 115 | 1676 ± 110* |
| Phenylalanine, µM | ||||
| Placebo | 113 ± 9 | 210 ± 11* | 117 ± 11 | 211 ± 14* |
| Vit D | 101 ± 5 | 190 ± 9* | 109 ± 5 | 193 ± 10* |
| CLA | 104 ± 6 | 198 ± 12* | 109 ± 6 | 206 ± 9* |
| Vit D + CLA | 109 ± 10 | 196 ± 10* | 109 ± 8 | 201 ± 8* |
Data are mean ± SEM. *Different from corresponding basal value (p<0.05). Repeated measures ANOVA with group and condition (basal and clamp) as factors were used to evaluate the effect of hyperaminoacidemia–hyperinsulinemia among the groups before and after the interventions. ANCOVA with the pretreatment value as covariate was used to evaluate treatment effects. No between group differences were observed (all P > 0.05). Sample sizes: placebo, n = 8; Vit D, n = 9; CLA, n = 7; Vit D + CLA, n = 8. CLA, conjugated linoleic acid; Vit D, vitamin D.
Myofibrillar protein synthesis rate
Basal myofibrillar protein synthesis rates before the interventions were not different among groups (placebo: 0.033 ± 0.003%/h; Vit D: 0.034 ± 0.002%/h; CLA: 0.029 ± 0.005%/h; and Vit D + CLA: 0.038 ± 0.005%/h); hyperinsulinemia–hyperaminoacidemia increased myofibrillar protein synthesis rates by ∼35% without a difference among the groups (placebo: 0.042 ± 0.005%/h; Vit D: 0.048 ± 0.006%/h; CLA: 0.048 ± 0.005%/h; and Vit D + CLA: 0.047 ± 0.005%/h) (Figure 2). Compared with placebo, the treatments had no effect on basal myofibrillar protein synthesis rates (placebo: 0.040 ± 0.004%/h; Vit D: 0.044 ± 0.006%/h; CLA: 0.039 ± 0.006%/h; and Vit D + CLA: 0.040 ± 0.007%/h), myofibrillar protein synthesis rates during hyperinsulinemia–hyperaminoacidemia (placebo: 0.056 ± 0.007%/h; Vit D: 0.056 ± 0.005%/h; CLA: 0.057 ± 0.009%/h; and Vit D + CLA: 0.055 ± 0.011%/h), or the hyperinsulinemia–hyperaminoacidemia–induced increase in myofibrillar protein synthesis rates (percentage increase from basal before and after the interventions: placebo, 30 ± 11 and 36 ± 11; Vit D, 38 ± 8 and 34 ± 10; CLA, 50 ± 14 and 51 ± 16; Vit D + CLA, 29 ± 15 and 35 ± 8) (Figure 2). It is unlikely that our study lacked sufficient statistical power to detect beneficial treatment effects because there was no trend (neither statistically nor numerically) for increased myofibrillar protein synthesis rates in any of the treatment groups compared with the placebo group; moreover, we did not observe a treatment effect even when we combined the Vit D alone and the Vit D + CLA groups or the CLA alone and the Vit D + CLA groups compared with those that did not receive Vit D or CLA, respectively (data not shown).
FIGURE 2.
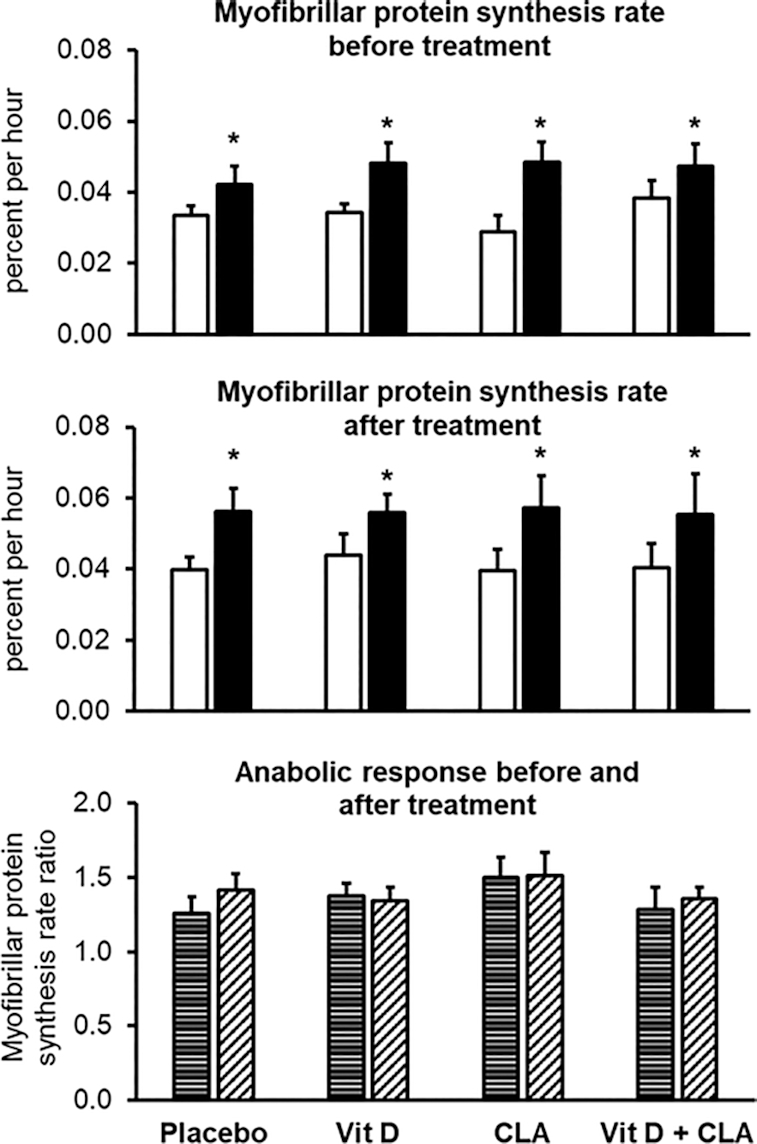
Myofibrillar protein synthesis rates during basal conditions (white bars) and during the hyperinsulinemic–euglycemic clamp procedure with concomitant amino acid infusion (black bars) before (top) and after (middle) the interventions, and the anabolic response (bottom), assessed as the ratio of myofibrillar protein synthesis rate during the hyperinsulinemic–euglycemic clamp to the myofibrillar protein synthesis rate during basal conditions, before (horizontally striped bars) and after (diagonally striped bars) the interventions in the placebo (n = 8), vitamin D (Vit D, n = 9), conjugated linoleic acid (CLA, n = 7), and combined Vit D + CLA (n = 8) supplementation groups. Values are mean ± SEM. Repeated measures ANOVA with group and condition (basal and clamp) as factors was used to evaluate the effect of hyperaminoacidemia–hyperinsulinemia among the groups before and after the interventions. *Different from corresponding basal value, P < 0.05. ANCOVA with the pretreatment value as covariate was used to evaluate treatment effects. No differences in treatment responses were observed among groups.
Hand-grip strength
Hand-grip strength was not different among groups at baseline and did not change during the interventions (Figure 3).
FIGURE 3.
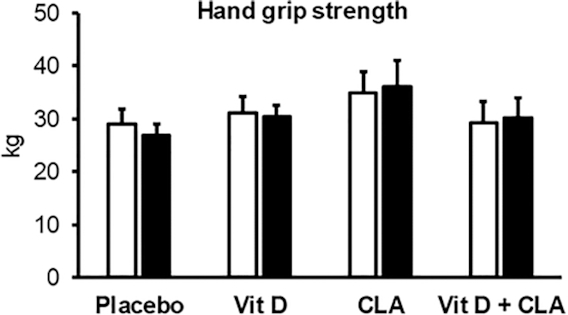
Hand-grip strength before (white bars) and after (black bars) the interventions in the placebo (n = 8), vitamin D (Vit D, n = 9), conjugated linoleic acid (CLA, n = 7), and combined Vit D + CLA (n = 8) supplementation groups. Values are mean ± SEM. One-factor ANOVA was used to compare outcomes among groups at baseline. ANCOVA with the pretreatment value as covariate was used to evaluate treatment effects. No differences in treatment responses were observed among groups.
Discussion
The age-associated decline in muscle mass is a significant public health problem because it can negatively affect activities of daily living and quality of life (1, 2). Interventions to prevent and treat the age-associated decline in muscle mass focus on increasing the stimulatory effect of amino acids on myofibrillar protein synthesis to overcome the anabolic resistance of skeletal muscle in older adults (3–8). Studies conducted in cultured myocytes and in vivo in animals suggest both vitamin D and CLA stimulate muscle protein synthesis and increase muscle mass (9–14). We evaluated the independent and combined effects of dietary vitamin D (2000 IU/d) and CLA (4000 mg/d) supplementation on myofibrillar protein synthesis rates during basal, postabsorptive conditions and during combined amino acid and insulin infusion in sedentary older adults. We found that, compared with placebo treatment, neither vitamin D nor CLA treatment alone or combined vitamin D + CLA treatment increased the myofibrillar protein synthesis rates. Therefore, we conclude that neither vitamin D nor CLA have muscle anabolic effects in sedentary older adults at the doses used in our study.
We studied sedentary older adults who did not engage in any physical activities, except normal activities of daily living, because the majority of older adults do not regularly engage in more strenuous physical activities and/or structured exercise programs. It is possible that a positive treatment effect on muscle protein synthesis would have been observed in exercising muscles. It is also possible, but unlikely, that we did not observe a treatment effect in our study because of the specific population we studied. Even though none of our participants had vitamin D deficiency (serum vitamin D concentration <12 ng/mL) and not all had insufficiency (<20 ng/mL) according to guidelines published by the Institute of Medicine (43), we studied older adults with serum vitamin D concentrations (grand mean: 25.6 ± 1.1 ng/mL) that are considered insufficient according to guidelines published by the American Geriatrics Society and the Endocrine Society (33, 34). In fact, 42% of our participants who received vitamin D treatment even had vitamin D concentrations that are considered insufficient according to the more stringent (<20 ng/mL) guidelines published by the Institute of Medicine (43). Furthermore, we found no differences in baseline (before intervention) rates of muscle protein synthesis in participants with vitamin D insufficiency (serum vitamin D <20 ng/mL) compared with those with serum vitamin D concentrations >20 ng/mL (basal conditions: 0.035 ± 0.001 compared with 0.034 ± 0.002%/h; combined amino acid and insulin infusion: 0.050 ± 0.001 compared with 0.046 ± 0.003%/h, respectively). We also found no effect of treatment with vitamin D in participants with vitamin D insufficiency (Vit D alone and Vit D + CLA groups combined) at baseline (basal conditions: 0.034 ± 0.003 compared with 0.036 ± 0.004%/h; combined amino acid and insulin infusion: 0.048 ± 0.006 compared with 0.048 ± 0.005%/h, before and after treatment, respectively), even though serum vitamin D increased by 53 ± 14%. It is unlikely that the duration of the interventions in our study was too short. We chose the 8-wk intervention period because we (6, 29) and others (30, 31) found known anabolic treatments, such as resistance exercise, testosterone, and fish oil–derived n–3 PUFAs, increase the rate of muscle protein synthesis within ≤8 wk.
The Institute of Medicine's recommended daily intake for vitamin D, which is expected to achieve a serum vitamin D concentration of ≥20 ng/mL in ≥97.5% of the population, is 600 IU/d for 18–70-y-old adults and 800 IU/d for those aged >70 y (43). The American Geriatrics Society recommends a daily intake of 4000 IU, including ≥1000 IU/d from dietary vitamin D supplements (33). The supplements used in our study provided 2000 IU vitamin D/d and resulted in a ∼45% increase in serum vitamin D in study participants who received vitamin D compared with those who did not. The increase in serum vitamin D we observed is consistent with the increases observed in other studies that provided similar doses of vitamin D (16, 44). These findings demonstrate that our participants were compliant with the treatment, which we also confirmed by pill count, and support the notion that our participants’ baseline vitamin D status had not reached a ceiling above which there would be no further increase in body vitamin D stores or biological effects. There are no guidelines for CLA intake. We provided 4000 mg CLA, which is about 10 times as much as typically consumed in the diet and represents an amount that was found to have biological effects (i.e., reduce body fat) in randomized clinical trials (45–47).
It is possible, but unlikely, that we did not observe a treatment effect because our participants did not demonstrate age-associated anabolic resistance in muscle. We used the same experimental protocol we had previously used to evaluate the effect of fish oil–derived n–3 PUFAs on the rate of muscle protein synthesis (6) and found that the combined amino acid and insulin infusion in the present study increased the myofibrillar protein synthesis rate by ∼45% above basal values. This is consistent with the results from our previous study (6) and demonstrates anabolic resistance because the same amino acid and insulin infusion protocol approximately doubled the muscle protein synthesis rate in healthy young adults (6). We also carefully considered the amino acid and insulin infusion rate and chose a dose that submaximally stimulates the muscle protein synthesis rate (48) to avoid a ceiling effect, which could mask a beneficial effect of treatment.
The results from our study are consistent with the results from most randomized controlled trials that evaluated the effect of vitamin D supplementation on muscle mass. The authors of a systematic review and meta-analysis published in 2014 found no effect of vitamin D on muscle mass (15). In more recent prospective, randomized, controlled trials that lasted 3–6 mo, vitamin D in doses that ranged from 400 IU to 2000 IU/d or 40,000 IU/wk, also did not increase muscle mass compared with placebo (16, 49, 50). In addition, a secondary analysis of data from a randomized controlled trial found that a monthly dose of 50,000 IU (equivalent to ∼ 1700 IU/d) of vitamin D for 12 mo did not affect muscle mass (assessed as thickness and cross-sectional area by using ultrasound) in 50–79-y-old men and women with low serum vitamin D (<25 ng/mL) (51). However, it was found that 10,000 IU of vitamin D consumed 3 times per week (equivalent to ∼4300 IU/d) for 6 mo increased muscle mass in a subset of lean older adults (17). In addition, an inverse association between serum vitamin D concentration and indices of muscle mass was observed in both cross-sectional and prospective observational studies (18–24, 52). However, these studies included people with vitamin deficiency (52) and the associations were often not significant when statistical adjustments for important confounding variables were made (18–21, 24). In fact, several studies found no association between vitamin D status and muscle mass or found that even people with normal muscle mass had vitamin D insufficiency (22, 25–28). The results from our study are different from those observed in animals, most likely because the animal studies compared the muscle protein synthesis rates in animals with normal vitamin D status and animals with severe vitamin D deficiency induced by using a vitamin D–depleted diet (11) or animals with muscle vitamin D receptor knock-out (10).
In summary, we conducted a double-blind, randomized, placebo-controlled clinical trial to evaluate the independent and combined effects of vitamin D and CLA supplementation on myofibrillar protein synthesis rates during basal, postabsorptive conditions and during amino acid and insulin infusion in sedentary older adults. We found neither vitamin D nor CLA nor their combination affected muscle protein synthesis rates. Therefore, we conclude that neither vitamin D nor CLA have muscle anabolic effects in sedentary older adults at the doses provided in our study.
Supplementary Material
ACKNOWLEDGEMENTS
We thank the staff of the Center for Human Nutrition and the Clinical Translational Research Unit for help with participant recruitment, scheduling, and testing and technical assistance with sample processing and data analysis, and the study subjects for their time and effort.
The authors’ responsibilities were as follows—BM: designed the study and obtained funding; SvV, AF, BM: conducted the study; DNR: provided medical supervision for the study; SvV, AF, BM: analyzed the data and drafted the manuscript; DNR: critically revised the manuscript for important intellectual content; BM: was responsible for overall study supervision and had primary responsibility for the final content; and all authors: read and approved the final manuscript.
BM received funding from BASF SE for this project. All other authors report no conflicts of interest.
Notes
The work presented in this article was supported by NIH grants DK56341 (Nutrition Obesity Research Center), DK020579 (Diabetes Research Center), and UL1TR000448 (Clinical Translational Science Award), and a grant (investigator-initiated) from BASF SE, which included monetary support and the dietary supplements. BASF was not involved in the implementation of the study or in the analysis and interpretation of the data.
Data described in the manuscript, code book, and analytic code will be made available upon request.
Supplemental Figures 1 and 2 are available from the “Supplementary data” link in the online posting of the article and from the same link in the online table of contents at https://academic.oup.com/ajcn/.
Abbreviations used: BSA, body surface area; CLA, conjugated linoleic acid; FFM, fat-free mass; FSR, fractional synthesis rate, TTR, tracer-to-tracee ratio; Vit D, vitamin D (intervention).
Contributor Information
Stephan van Vliet, Center for Human Nutrition, Washington University School of Medicine, St Louis, MO, USA.
Alan Fappi, Center for Human Nutrition, Washington University School of Medicine, St Louis, MO, USA.
Dominic N Reeds, Center for Human Nutrition, Washington University School of Medicine, St Louis, MO, USA.
Bettina Mittendorfer, Center for Human Nutrition, Washington University School of Medicine, St Louis, MO, USA.
References
- 1. Cruz-Jentoft AJ, Baeyens JP, Bauer JM, Boirie Y, Cederholm T, Landi F, Martin FC, Michel JP, Rolland Y, Schneider SM et al. Sarcopenia: European consensus on definition and diagnosis: report of the European Working Group on Sarcopenia in Older People. Age Ageing. 2010;39(4):412–23. [DOI] [PMC free article] [PubMed] [Google Scholar]
- 2. Fielding RA, Vellas B, Evans WJ, Bhasin S, Morley JE, Newman AB, Abellan van Kan G, Andrieu S, Bauer J, Breuille D et al. Sarcopenia: an undiagnosed condition in older adults. Current consensus definition: prevalence, etiology, and consequences. International Working Group on Sarcopenia. J Am Med Dir Assoc. 2011;12(4):249–56. [DOI] [PMC free article] [PubMed] [Google Scholar]
- 3. Morton RW, Traylor DA, Weijs PJM, Phillips SM. Defining anabolic resistance: implications for delivery of clinical care nutrition. Curr Opin Crit Care. 2018;24(2):124–30. [DOI] [PubMed] [Google Scholar]
- 4. Wilkinson DJ, Piasecki M, Atherton PJ. The age-related loss of skeletal muscle mass and function: measurement and physiology of muscle fibre atrophy and muscle fibre loss in humans. Ageing Res Rev. 2018;47:123–32. [DOI] [PMC free article] [PubMed] [Google Scholar]
- 5. Cuthbertson D, Smith K, Babraj J, Leese G, Waddell T, Atherton P, Wackerhage H, Taylor PM, Rennie MJ. Anabolic signaling deficits underlie amino acid resistance of wasting, aging muscle. FASEB J. 2005;19(3):1. [DOI] [PubMed] [Google Scholar]
- 6. Smith GI, Atherton P, Reeds DN, Mohammed BS, Rankin D, Rennie MJ, Mittendorfer B. Dietary omega-3 fatty acid supplementation increases the rate of muscle protein synthesis in older adults: a randomized controlled trial. Am J Clin Nutr. 2011;93(2):402–12. [DOI] [PMC free article] [PubMed] [Google Scholar]
- 7. Guillet C, Prod'homme M, Balage M, Gachon P, Giraudet C, Morin L, Grizard J, Boirie Y. Impaired anabolic response of muscle protein synthesis is associated with S6K1 dysregulation in elderly humans. FASEB J. 2004;18(13):1586–7. [DOI] [PubMed] [Google Scholar]
- 8. Wilkes EA, Selby AL, Atherton PJ, Patel R, Rankin D, Smith K, Rennie MJ. Blunting of insulin inhibition of proteolysis in legs of older subjects may contribute to age-related sarcopenia. Am J Clin Nutr. 2009;90(5):1343–50. [DOI] [PubMed] [Google Scholar]
- 9. Salles J, Chanet A, Giraudet C, Patrac V, Pierre P, Jourdan M, Luiking YC, Verlaan S, Migne C, Boirie Y et al. 1,25(OH)2-vitamin D3 enhances the stimulating effect of leucine and insulin on protein synthesis rate through Akt/PKB and mTOR mediated pathways in murine C2C12 skeletal myotubes. Mol Nutr Food Res. 2013;57(12):2137–46. [DOI] [PubMed] [Google Scholar]
- 10. Girgis CM, Cha KM, So B, Tsang M, Chen J, Houweling PJ, Schindeler A, Stokes R, Swarbrick MM, Evesson FJ et al. Mice with myocyte deletion of vitamin D receptor have sarcopenia and impaired muscle function. J Cachexia Sarcopenia Muscle. 2019;10(6):1228–40. [DOI] [PMC free article] [PubMed] [Google Scholar]
- 11. Chanet A, Salles J, Guillet C, Giraudet C, Berry A, Patrac V, Domingues-Faria C, Tagliaferri C, Bouton K, Bertrand-Michel J et al. Vitamin D supplementation restores the blunted muscle protein synthesis response in deficient old rats through an impact on ectopic fat deposition. J Nutr Biochem. 2017;46:30–8. [DOI] [PubMed] [Google Scholar]
- 12. Patureau Mirand P, Mosoni L, Arnal-Bagnard MA, Faulconnier Y, Chardigny JM, Chilliard Y. Dietary conjugated linoleic acid has limited effects on tissue protein anabolism in sedentary and exercising adult rats. Reprod Nutr Dev. 2006;46(6):621–32. [DOI] [PubMed] [Google Scholar]
- 13. Rahman M, Halade GV, El Jamali A, Fernandes G. Conjugated linoleic acid (CLA) prevents age-associated skeletal muscle loss. Biochem Biophys Res Commun. 2009;383(4):513–8. [DOI] [PMC free article] [PubMed] [Google Scholar]
- 14. Halade GV, Rahman MM, Fernandes G. Effect of CLA isomers and their mixture on aging C57Bl/6J mice. Eur J Nutr. 2009;48(7):409–18. [DOI] [PubMed] [Google Scholar]
- 15. Beaudart C, Buckinx F, Rabenda V, Gillain S, Cavalier E, Slomian J, Petermans J, Reginster JY, Bruyere O. The effects of vitamin D on skeletal muscle strength, muscle mass, and muscle power: a systematic review and meta-analysis of randomized controlled trials. J Clin Endocrinol Metab. 2014;99(11):4336–45. [DOI] [PubMed] [Google Scholar]
- 16. Mason C, Tapsoba JD, Duggan C, Imayama I, Wang CY, Korde L, McTiernan A. Effects of vitamin D3 supplementation on lean mass, muscle strength, and bone mineral density during weight loss: a double-blind randomized controlled trial. J Am Geriatr Soc. 2016;64(4):769–78. [DOI] [PMC free article] [PubMed] [Google Scholar]
- 17. El Hajj C, Fares S, Chardigny JM, Boirie Y, Walrand S. Vitamin D supplementation and muscle strength in pre-sarcopenic elderly Lebanese people: a randomized controlled trial. Arch Osteoporos. 2019;14(1):4. [DOI] [PubMed] [Google Scholar]
- 18. Liu G, Lu L, Sun Q, Ye X, Sun L, Liu X, Zong G, Jin Q, Li H, Lin X. Poor vitamin D status is prospectively associated with greater muscle mass loss in middle-aged and elderly Chinese individuals. J Acad Nutr Diet. 2014;114(10):1544–51. [DOI] [PubMed] [Google Scholar]
- 19. Conzade R, Grill E, Bischoff-Ferrari HA, Ferrari U, Horsch A, Koenig W, Peters A, Thorand B. Vitamin D in relation to incident sarcopenia and changes in muscle parameters among older adults: the KORA-Age Study. Calcif Tissue Int. 2019;105(2):173–82. [DOI] [PubMed] [Google Scholar]
- 20. Visser M, Deeg DJ, Lips P, Longitudinal Aging Study A. Low vitamin D and high parathyroid hormone levels as determinants of loss of muscle strength and muscle mass (sarcopenia): the Longitudinal Aging Study Amsterdam. J Clin Endocrinol Metab. 2003;88(12):5766–72. [DOI] [PubMed] [Google Scholar]
- 21. Iannuzzi-Sucich M, Prestwood KM, Kenny AM. Prevalence of sarcopenia and predictors of skeletal muscle mass in healthy, older men and women. J Gerontol A Biol Sci Med Sci. 2002;57(12):M772–7. [DOI] [PubMed] [Google Scholar]
- 22. Park S, Ham JO, Lee BK. A positive association of vitamin D deficiency and sarcopenia in 50 year old women, but not men. Clin Nutr. 2014;33(5):900–5. [DOI] [PubMed] [Google Scholar]
- 23. Hirani V, Cumming RG, Naganathan V, Blyth F, Le Couteur DG, Hsu B, Handelsman DJ, Waite LM, Seibel MJ. Longitudinal associations between vitamin D metabolites and sarcopenia in older Australian men: the Concord Health and Aging in Men project. J Gerontol A Biol Sci Med Sci. 2018;73(1):131–8. [DOI] [PubMed] [Google Scholar]
- 24. Iolascon G, Mauro GL, Fiore P, Cisari C, Benedetti MG, Panella L, De Sire A, Calafiore D, Moretti A, Gimigliano F. Can vitamin D deficiency influence muscle performance in postmenopausal women? A multicenter retrospective study. Eur J Phys Rehabil Med. 2018;54(5):676–82. [DOI] [PubMed] [Google Scholar]
- 25. Meng L, Man Q, Yuan L, Shen L, Li W, Guo G, Li L, Jia S, Gao Y, Song P et al. Serum 25-hydroxyvitamin D and elderly skeletal muscle mass and function in urban north China. Asia Pac J Clin Nutr. 2017;26(5):849–55. [DOI] [PubMed] [Google Scholar]
- 26. Kim MK, Baek KH, Song KH, Il Kang M, Park CY, Lee WY, Oh KW. Vitamin D deficiency is associated with sarcopenia in older Koreans, regardless of obesity: the Fourth Korea National Health and Nutrition Examination Surveys (KNHANES IV) 2009. J Clin Endocrinol Metab. 2011;96(10):3250–6. [DOI] [PubMed] [Google Scholar]
- 27. Gilsanz V, Kremer A, Mo AO, Wren TA, Kremer R. Vitamin D status and its relation to muscle mass and muscle fat in young women. J Clin Endocrinol Metab. 2010;95(4):1595–601. [DOI] [PMC free article] [PubMed] [Google Scholar]
- 28. Marantes I, Achenbach SJ, Atkinson EJ, Khosla S, Melton LJ 3rd, Amin S. Is vitamin D a determinant of muscle mass and strength?. J Bone Miner Res. 2011;26(12):2860–71. [DOI] [PMC free article] [PubMed] [Google Scholar]
- 29. Smith GI, Yoshino J, Reeds DN, Bradley D, Burrows RE, Heisey HD, Moseley AC, Mittendorfer B. Testosterone and progesterone, but not estradiol, stimulate muscle protein synthesis in postmenopausal women. J Clin Endocrinol Metab. 2014;99(1):256–65. [DOI] [PMC free article] [PubMed] [Google Scholar]
- 30. Oikawa SY, McGlory C, D'Souza LK, Morgan AK, Saddler NI, Baker SK, Parise G, Phillips SM. A randomized controlled trial of the impact of protein supplementation on leg lean mass and integrated muscle protein synthesis during inactivity and energy restriction in older persons. Am J Clin Nutr. 2018;108(5):1060–8. [DOI] [PubMed] [Google Scholar]
- 31. Yarasheski KE, Zachwieja JJ, Bier DM. Acute effects of resistance exercise on muscle protein synthesis rate in young and elderly men and women. Am J Physiol. 1993;265(2 Pt 1):E210–4. [DOI] [PubMed] [Google Scholar]
- 32. Grant WB, Cross HS, Garland CF, Gorham ED, Moan J, Peterlik M, Porojnicu AC, Reichrath J, Zittermann A. Estimated benefit of increased vitamin D status in reducing the economic burden of disease in western Europe. Prog Biophys Mol Biol. 2009;99(2-3):104–13. [DOI] [PubMed] [Google Scholar]
- 33. American Geriatrics Society Workgroup on Vitamin D Supplementation for Older Adults.. Recommendations abstracted from the American Geriatrics Society consensus statement on vitamin D for prevention of falls and their consequences. J Am Geriatr Soc. 2014;62(1):147–52. [DOI] [PubMed] [Google Scholar]
- 34. Holick MF, Binkley NC, Bischoff-Ferrari HA, Gordon CM, Hanley DA, Heaney RP, Murad MH, Weaver CM, Endocrine S. Evaluation, treatment, and prevention of vitamin D deficiency: an Endocrine Society clinical practice guideline. J Clin Endocrinol Metab. 2011;96(7):1911–30. [DOI] [PubMed] [Google Scholar]
- 35. van Vliet S, Skinner SK, Beals JW, Pagni BA, Fang HY, Ulanov AV, Li Z, Paluska SA, Mazzulla M, West DWD et al. Dysregulated handling of dietary protein and muscle protein synthesis after mixed-meal ingestion in maintenance hemodialysis patients. Kidney Int Rep. 2018;3(6):1403–15. [DOI] [PMC free article] [PubMed] [Google Scholar]
- 36. Symons TB, Schutzler SE, Cocke TL, Chinkes DL, Wolfe RR, Paddon-Jones D. Aging does not impair the anabolic response to a protein-rich meal. Am J Clin Nutr. 2007;86(2):451–6. [DOI] [PubMed] [Google Scholar]
- 37. Boirie Y, Gachon P, Beaufrere B. Splanchnic and whole-body leucine kinetics in young and elderly men. Am J Clin Nutr. 1997;65:489–95. [DOI] [PubMed] [Google Scholar]
- 38. Smith GI, Villareal DT, Mittendorfer B. Measurement of human mixed muscle protein fractional synthesis rate depends on the choice of amino acid tracer. Am J Physiol Endocrinol Metab. 2007;293(3):E666–71. [DOI] [PubMed] [Google Scholar]
- 39. Mittendorfer B, Liem O, Patterson BW, Miles JM, Klein S. What does the measurement of whole-body fatty acid rate of appearance in plasma by using a fatty acid tracer really mean?. Diabetes. 2003;52(7):1641–8. [DOI] [PubMed] [Google Scholar]
- 40. Patterson BW, Zhao G, Klein S. Improved accuracy and precision of gas chromatography/mass spectrometry measurements for metabolic tracers. Metabolism. 1998;47(6):706–12. [DOI] [PubMed] [Google Scholar]
- 41. Watt PW, Lindsay Y, Scrimgeour CM, Chien PA, Gibson JN, Taylor DJ, Rennie MJ. Isolation of aminoacyl-tRNA and its labeling with stable-isotope tracers: use in studies of human tissue protein synthesis. Proc Natl Acad Sci U S A. 1991;88(13):5892–6. [DOI] [PMC free article] [PubMed] [Google Scholar]
- 42. Smith GI, Villareal DT, Lambert CP, Reeds DN, Mohammed BS, Mittendorfer B. Timing of the initial muscle biopsy does not affect the measured muscle protein fractional synthesis rate during basal, postabsorptive conditions. J Appl Physiol. 2010;108(2):363–8. [DOI] [PMC free article] [PubMed] [Google Scholar]
- 43. Ross AC, Manson JE, Abrams SA, Aloia JF, Brannon PM, Clinton SK, Durazo-Arvizu RA, Gallagher JC, Gallo RL, Jones G et al. The 2011 report on dietary reference intakes for calcium and vitamin D from the Institute of Medicine: what clinicians need to know. J Clin Endocrinol Metab. 2011;96(1):53–8. [DOI] [PMC free article] [PubMed] [Google Scholar]
- 44. Diamond T, Wong YK, Golombick T. Effect of oral cholecalciferol 2,000 versus 5,000 IU on serum vitamin D, PTH, bone and muscle strength in patients with vitamin D deficiency. Osteoporos Int. 2013;24(3):1101–5. [DOI] [PubMed] [Google Scholar]
- 45. Whigham LD, Watras AC, Schoeller DA. Efficacy of conjugated linoleic acid for reducing fat mass: a meta-analysis in humans. Am J Clin Nutr. 2007;85(5):1203–11. [DOI] [PubMed] [Google Scholar]
- 46. Blankson H, Stakkestad JA, Fagertun H, Thom E, Wadstein J, Gudmundsen O. Conjugated linoleic acid reduces body fat mass in overweight and obese humans. J Nutr. 2000;130(12):2943–8. [DOI] [PubMed] [Google Scholar]
- 47. Lopez-Plaza B, Bermejo LM, Koester Weber T, Parra P, Serra F, Hernandez M, Palma Milla S, Gomez-Candela C. Effects of milk supplementation with conjugated linoleic acid on weight control and body composition in healthy overweight people. Nutr Hosp. 2013;28(6):2090–8. [PubMed] [Google Scholar]
- 48. Bohe J, Low A, Wolfe RR, Rennie MJ. Human muscle protein synthesis is modulated by extracellular, not intramuscular amino acid availability: a dose-response study. J Physiol. 2003;552(Pt 1):315–24. [DOI] [PMC free article] [PubMed] [Google Scholar]
- 49. Suebthawinkul C, Panyakhamlerd K, Yotnuengnit P, Suwan A, Chaiyasit N, Taechakraichana N. The effect of vitamin D2 supplementation on muscle strength in early postmenopausal women: a randomized, double-blind, placebo-controlled trial. Climacteric. 2018;21(5):491–7. [DOI] [PubMed] [Google Scholar]
- 50. Vaes AMM, Tieland M, Toussaint N, Nilwik R, Verdijk LB, van Loon LJC, de Groot L. Cholecalciferol or 25-hydroxycholecalciferol supplementation does not affect muscle strength and physical performance in prefrail and frail older adults. J Nutr. 2018;148(5):712–20. [DOI] [PubMed] [Google Scholar]
- 51. Cuellar WA, Blizzard L, Hides JA, Callisaya ML, Jones G, Cicuttini F, Wluka AE, Ding C, Winzenberg TM. Vitamin D supplements for trunk muscle morphology in older adults: secondary analysis of a randomized controlled trial. J Cachexia Sarcopenia Muscle. 2019;10(1):177–87. [DOI] [PMC free article] [PubMed] [Google Scholar]
- 52. Janssen HC, Emmelot-Vonk MH, Verhaar HJ, van der Schouw YT. Vitamin D and muscle function: is there a threshold in the relation?. J Am Med Dir Assoc. [Internet]2013;14(8):627.e13–e27. [DOI] [PubMed] [Google Scholar]
Associated Data
This section collects any data citations, data availability statements, or supplementary materials included in this article.