Abstract
Study Objectives
Accurate identification of sleep stages is essential in the diagnosis of sleep disorders (e.g. obstructive sleep apnea [OSA]) but relies on labor-intensive electroencephalogram (EEG)-based manual scoring. Furthermore, long-term assessment of sleep relies on actigraphy differentiating only between wake and sleep periods without identifying specific sleep stages and having low reliability in identifying wake periods after sleep onset. To address these issues, we aimed to develop an automatic method for identifying the sleep stages from the photoplethysmogram (PPG) signal obtained with a simple finger pulse oximeter.
Methods
PPG signals from the diagnostic polysomnographies of susptected OSA patients (n = 894) were utilized to develop a combined convolutional and recurrent neural network. The deep learning model was trained individually for three-stage (wake/NREM/REM), four-stage (wake/N1+N2/N3/REM), and five-stage (wake/N1/N2/N3/REM) classification of sleep.
Results
The three-stage model achieved an epoch-by-epoch accuracy of 80.1% with Cohen’s κ of 0.65. The four- and five-stage models achieved 68.5% (κ = 0.54), and 64.1% (κ = 0.51) accuracies, respectively. With the five-stage model, the total sleep time was underestimated with a mean bias error (SD) of of 7.5 (55.2) minutes.
Conclusion
The PPG-based deep learning model enabled accurate estimation of sleep time and differentiation between sleep stages with a moderate agreement to manual EEG-based scoring. As PPG is already included in ambulatory polygraphic recordings, applying the PPG-based sleep staging could improve their diagnostic value by enabling simple, low-cost, and reliable monitoring of sleep and help assess otherwise overlooked conditions such as REM-related OSA.
Keywords: deep learning, photoplethysmogram, obstructive sleep apnea, recurrent neural networks, sleep staging
Statement of Significance.
Sleep staging is the cornerstone of diagnosing sleep disorders. However, the diagnosis of obstructive sleep apnea is increasingly reliant on home-based recordings without the ability for sleep staging due to the lack of EEG recording. This hinders the ability to assess sleep architecture, with total sleep time having to be manually estimated from other signals. This leads to large errors in diagnostic parameters that rely on the accurate determination of sleep time. We developed a novel, deep learning-based sleep staging method relying only on photoplethysmogram measured with a finger pulse oximeter. The deep learning approach enables differentiation of sleep stages and accurate estimation of total sleep time. This could easily enhance the diagnostic yield of home-based recordings and enable cost-efficient, long-term monitoring of sleep.
Introduction
Characterization of sleep architecture via sleep staging is imperative in the diagnosis of various sleep disorders. Currently, assessment of sleep and its quality is also being integrated into an increasing number of consumer-grade health technology devices developed mainly for self-monitoring purposes. In sleep staging, the night is divided into 30-second periods, i.e. epochs, and a sleep stage is assigned to every epoch: wakefulness, light sleep (stages N1 and N2), deep sleep (stage N3), and rapid eye movement (REM) sleep [1]. These sleep stages are identified by visually inspecting electroencephalogram (EEG), electrooculogram (EOG), and submental electromyogram (EMG) signals. These bioelectric signals are usually recorded during polysomnography (PSG) in addition to cardiorespiratory signals such as respiratory airflow, cardiac activity via electrocardiography (ECG), and blood oxygen saturation via photoplethysmogram (PPG) obtained with a pulse oximeter.
Conducting an in-lab PSG is expensive, requiring the time and effort of multiple trained professionals. PSG also has a negative impact on sleep quality as the patient is forced to sleep in an unfamiliar environment with multiple electrodes and sensors attached [2]. This results in worse sleep efficiency, shorter sleep duration, and longer sleep latency during an in-lab PSG compared with home-based measurements [2, 3]. However, home-based measurements do not usually incorporate a recording of EEG. To overcome these limitations, simple ambulatory EEG recording devices with good recording quality have been introduced [4, 5]. However, despite these recent advances in ambulatory EEG measurement, actigraphy is still the preferred method for assessment of sleep over multiple nights due to its simplicity and low costs [6–8]. Actigraphy relies on sensitive wrist-worn accelerometers (motion sensors) and estimates sleep and wake periods during the night [8]. However, actigraphy tends to overestimate sleep time [8, 9] and is unable to differentiate between sleep stages. Therefore, new simple and cost-effective ambulatory methods and algorithms capable of accurately estimating sleep stages with minimal disruption to sleep are urgently needed.
With recent advances in machine learning, specifically deep learning techniques, automatic sleep staging based on EEG has been successfully demonstrated [10–15]. The EEG recording, however, requires multiple electrodes with meticulous placement. Besides changes in the electrical activity of the brain, sleep stages are reflected in the autonomic nervous system activity. Parasympathetic tone increases when progressing from wake to deep sleep [16, 17], while REM sleep is characterized by increased sympathetic tone [18]. Meanwhile, the sympathetic and parasympathetic tone of wake periods during the night is between those of NREM and REM sleep [19]. It has also been shown that heart rate variability (HRV) differs between sleep stages [16] and that sleep staging with a simpler measurement setup using ECG has the potential to differentiate between wake, light sleep, deep sleep, and REM sleep [20–22]. The ECG-based approaches have relied on HRV features [20] and are often combined with respiratory effort [21] or movement features [22]. Besides ECG, HRV features can be estimated from information contained in the PPG signal [23, 24] recorded during most polygraphic and polysomnographic recordings. Thus, PPG may provide a simpler solution for differentiating between sleep stages.
PPG can be measured with a simple finger pulse oximeter by measuring variations in the transmissive absorption of light related to arterial pulsations. Furthermore, a PPG recording based on reflective absorption is included in many consumer-grade health technology devices such as smartwatches. Recently, there have been attempts to conduct sleep staging using estimated HRV features derived from PPG [25–29]. However, these have focused only on estimating features typically calculated from ECG and have relied on a simultaneous actigraphy recording. However, changes in PPG have also been linked to increased EEG power density and cortical activity during sleep [30] and can be used to determine sympathetic activation [30, 31]. As PPG is related to various physiological characteristics and autonomic nervous system activity, we hypothesize that utilization of deep learning methodology to analyze PPG signal without any prior feature selection enables fast, easily accessible, and accurate sleep staging.
The primary aim of this study was to develop an automatic, deep learning-based sleep staging method utilizing only the PPG signal measured with a transmissive finger pulse oximeter during a full PSG. A secondary aim was to achieve this in an end-to-end manner without any manual feature extraction, i.e. by using the complete PPG signals as recorded with the pulse oximeter and providing the sleep stages automatically for each 30-second segment of the signal. Moreover, we demonstrate the performance of this deep learning approach with three-stage (wake/NREM/REM), four-stage (wake/light sleep (N1+N2)/deep sleep (N3)/REM), and five-stage (wake/N1/N2/N3/REM) classification of sleep and its ability to derive commonly used sleep parameters (total sleep time and sleep efficiency) in a large (n = 894) clinical population of patients suspected with obstructive sleep apnea (OSA).
Materials and Methods
Data set
The data set used in this study comprised 933 diagnostic full PSGs conducted due to clinical suspicion of OSA at the Princess Alexandra Hospital (Brisbane, Australia) using Compumedics Grael acquisition system (Compumedics, Abbotsford, Australia) between 2015 and 2017. Approval for data collection was obtained from the Institutional Human Research Ethics Committee of the Princess Alexandra Hospital (HREC/16/QPAH/021 and LNR/2019/QMS/54313). Complete recordings and successful sleep scorings were obtained for 894 patients, yielding the final data set used in this study (Table 1).
Table 1.
Demographic and polysomnographic information of the study population
| Whole population (n = 894) | Training set (n = 715) | Validation set (n = 90) | Test set (n = 89) | |
|---|---|---|---|---|
| Median (interquartile range) | ||||
| Age (years) | 55.9 (44.7–65.8) | 55.8 (44.7–66.0) | 56.6 (42.9–66.4) | 56.1 (45.3–63.3) |
| ArI (1/h) | 20.7 (13.9–31.4) | 21.1 (14.1–32.5) | 18.9 (13.2–26.6) | 20.5 (13.6–29.5) |
| AHI (1/h) | 15.8 (7.0–32.6) | 16.0 (7.4–33.5) | 12.3 (5.7–30.2) | 16.8 (6.5–33.2) |
| BMI (kg/m2) | 34.4 (29.4–40.4) | 34.2 (29.3–40.1) | 35.9 (28.6–41.5) | 34.8 (31.1–41.2) |
| N1 (%) | 10.9 (6.7–18.8) | 11.1 (6.9–19.3) | 10.8 (6.0–19.1) | 9.7 (5.5–16.2) |
| N2 (%) | 48.3 (41.2–56.2) | 48.2 (41.6–56.5) | 50.3 (40.3–55.2) | 48.8 (38.5–55.6) |
| N3 (%) | 18.3 (9.6–26.8) | 18.0 (9.4–26.9) | 17.7 (9.4–26.0) | 20.4 (11.4–27.8) |
| NREM (%) | 82.9 (77.8–88.1) | 83.0 (77.8–88.1) | 82.4 (78.5–88.8) | 82.4 (77.1–86.4) |
| REM (%) | 17.1 (11.8–22.0) | 16.9 (11.8–22.2) | 17.5 (11.0–21.4) | 17.6 (12.5–22.8) |
| SE (%) | 70.7 (58.1–81.9) | 70.7 (57.9–81.7) | 69.9 (55.2–83.6) | 71.9 (60.1–80.7) |
| SL (min) | 17.5 (9.0–34.5) | 17.5 (9.5–35.1) | 19.0 (7.0–29.8) | 15.0 (9.0–33.5) |
| TRT (min) | 442.3 (409.5–474.0) | 442.0 (410.3–474.5) | 449.0 (412.4–474.6) | 438.0 (403.1–464.5) |
| TST (min) | 308.8 (253.5–359.5) | 309.5 (253.0–359.5) | 304.0 (249.5–368.6) | 304.0 (259.3–347.8) |
| WASO (min) | 102.5 (61.0–149.5) | 102.8 (61.0–152.0) | 96.0 (60.6–144.4) | 100.0 (65.4–135.8) |
| n (% of the population) | ||||
| No OSA | 154 (17.2) | 117 (16.4) | 20 (22.2) | 18 (20.2) |
| Mild OSA | 278 (31.1) | 224 (31.3) | 29 (32.2) | 24 (27.0) |
| Moderate OSA | 209 (23.4) | 168 (23.5) | 17 (18.9) | 24 (27.0) |
| Severe OSA | 253 (28.3) | 206 (28.8) | 23 (25.6) | 24 (27.0) |
| Female | 398 (44.5) | 320 (44.8) | 39 (43.3) | 39 (43.8) |
| Male | 496 (55.5) | 395 (55.2) | 50 (55.6) | 51 (57.3) |
ArI, arousal index; AHI, apnea-hypopnea index; BMI, body mass index; SE, sleep efficiency; SL, sleep latency; TRT, total recording time; TST, total sleep time; WASO, wake after sleep onset. No obstructive sleep apnea (OSA): AHI < 5, mild OSA: 5 ≤ AHI < 15, moderate OSA: 15 ≤ AHI < 30, severe OSA: AHI ≥ 30.
Sleep stages were initially scored manually by experienced scorers participating regularly in intra- and interlaboratory scoring concordance activities. A total of 10 scorers participated in the scoring of the whole data set, and each recording was scored once by a single scorer. In a previous study on the interrater reliability at the Princess Alexandra Hospital, the mean (SEM) Cohen’s κ of sleep staging was 0.74 (0.02) [32]. As for the individual sleep stages, the κ-values were 0.88 (0.03) for wake, 0.47 (0.08) for N1, 0.68 (0.03) for N2, 0.60 (0.08) for N3, and 0.92 (0.01) for REM [32]. The manual sleep staging was conducted based on EEG, EOG, and chin EMG signals. The sleep stages, arousals, and respiratory events were scored in compliance with the prelavent American Academy of Sleep Medicine (AASM) guidelines [1].
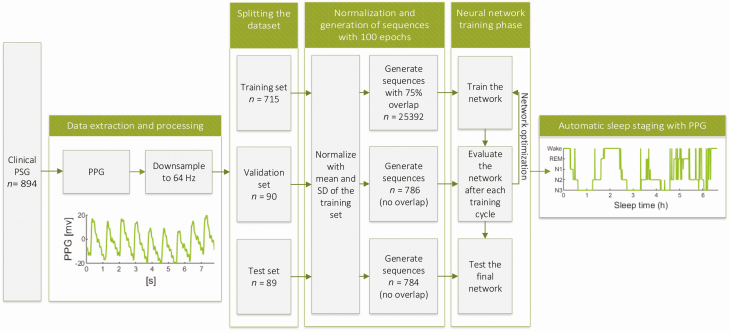
We extracted the transmissive photoplethysmogram (PPG) signals measured with a finger pulse oximeter (Nonin Xpod 3011) from the PSGs with Profusion PSG 4 software (Compumedics, Abbotsford, Australia) and utilized the complete PPG signals without any manual feature selection in the deep learning-based sleep staging. The PPG signals were originally recorded with 256 Hz sampling frequency and were downsampled to 64 Hz in this study to reduce the computational load. No further preprocessing or any artifact removal was implemented. None of the EEG, EOG, or EMG signals were used beyond the initial manual scoring. The complete study workflow is illustrated in Figure 1.
Figure 1.
Illustration of the study workflow. The photoplethysmogram (PPG) signals were extracted from clinical polysomnographies (PSG), downsampled, and split into three independent sets: training, validation, and test set. These sets were normalized with z-score normalization using the mean and SD of the training set. The signals were then used to generate sequences of hundred 30-s PPG epochs and an overlap of 75% was used in the training set. The sequences were then used to train, optimize, and test the developed neural network resulting in an automatic sleep staging approach utilizing only PPG signal.
The complete data set was randomly split into training (715 recordings, 80%), validation (90 recordings, 10%), and test (89 recordings, 10%) sets. Due to the randomization, 85% of the patients in the training set, 78% of the patients in the validation set, and 81% of the patients in the test set had OSA (apnea-hypopnea index ≥ 5). Subsequently, the data sets were normalized using z-score normalization. To minimize bias, all the data sets were normalized using the mean and SD of the training set. Finally, the PPG signals were divided into 30-second epochs corresponding to the timestamps of the manually scored sleep stages.
Neural network architecture
A convolutional neural network (CNN) combined with a recurrent neural network (RNN) was implemented for sleep stage classification. The classification was conducted individually with three different classification systems: (1) wake, NREM sleep, and REM sleep; (2) wake, light sleep (N1+N2), deep sleep (N3), and REM sleep; and (3) wake, N1, N2, N3, and REM sleep. In essence, CNN was utilized to learn the features of each sleep stage while the RNN was utilized to consider the temporal distribution of sleep stages during the night. The combined CNN and RNN network was implemented in Python 3.6 using Keras API 2.24 with TensorFlow 1.13.1 backend. The implementation of the network is presented in Supplementary Material. The network architecture was identical for the three-, four-, and five-stage classification models.
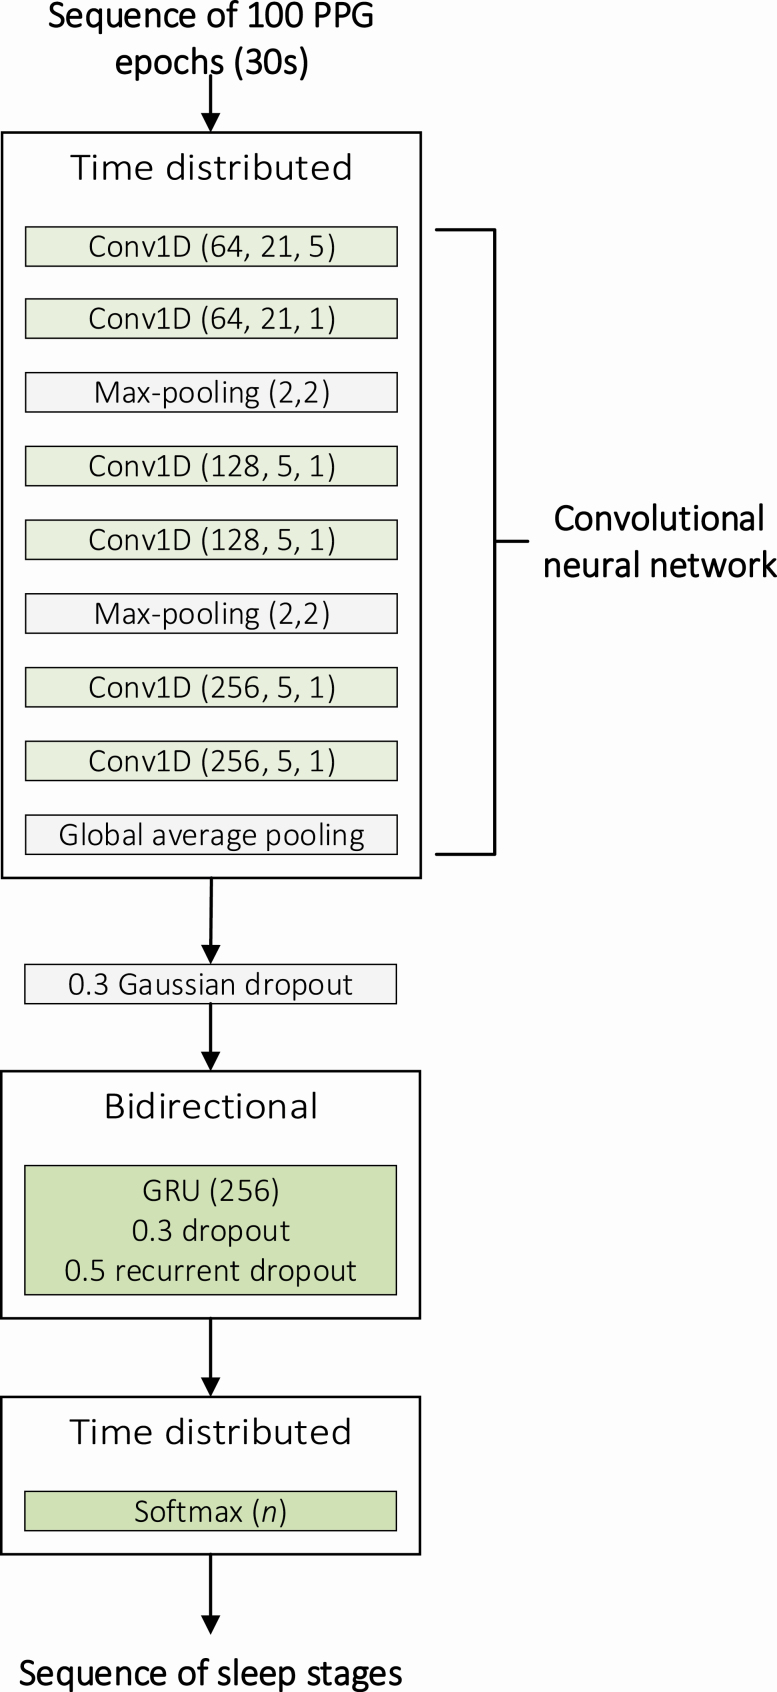
The CNN consisted of six 1D convolutions, two max-pooling layers, and a global average pooling layer (Figure 2). Each 1D convolution was followed by batch normalization and rectified linear unit activation function. The first 1D convolution had a kernel size of 21 with a stride of 5 and the second 1D convolution had a kernel size of 21 with a stride size of 1. The remaining 1D convolutions had a kernel size of 5 and a stride size of 1. The number of convolutional filters was 64 for the first two convolutions, 128 for the third and fourth convolutions, and 256 for fifth and sixth convolutions. The max-pooling layers were included after the first two convolutions and before the last two convolutions and had a pool size of 2 with a stride size of 2. The last two 1D convolutions were followed by a global average pooling layer.
Figure 2.
Illustration of the architecture of the combined convolutional neural network (CNN) and recurrent neural network (RNN). The CNN comprised six 1D convolutions (Conv1D), batch normalizations, and rectified linear unit (ReLU) activation functions. The parameters of the convolutional layers are given as (number of filters, kernel size, stride size) and the parameters of the max-pooling layers are given as (pool size, stride size). The CNN was followed by a Gaussian dropout layer, bidirectional gated recurrent unit (GRU), and a time distributed dense layer with a softmax activation function. The dropout rate is given for the dropouts and the number of units is given for the GRU and the final dense layer. n is the number of sleep stages in the classification system and varied between 3, 4, and 5.
The RNN included a time distributed layer of the complete CNN described above. The time distributed CNN layer was followed by a gaussian dropout layer with a dropout rate of 0.3 and a bidirectional gated recurrent unit (GRU) layer. The GRU layer comprised 256 cells with a dropout rate of 0.3 in the forward step and 0.5 in the recurrent step. A time distributed dense layer with a softmax activation function was included as the final layer of the model to produce the output sequence of sleep stage probabilities (Figure 2).
The model was trained in an end-to-end manner using sequences of hundred 30-second epochs, and the sleep stages were estimated for each epoch in the sequences. The dimension of a single sequence used as an input to the network was (1, 100, 1920, 1) comprising the number of sequences, length of a sequence (100 epochs in a single sequence), number of data points in a single 30-second epoch with a 64 Hz sampling frequency (1920 data points), and the number of channels (1 PPG channel), respectively. Overlap of 75% between consecutive sequences was applied when forming the sequences in the training set, effectively increasing the size of the training data set fourfold. This procedure was not applied to the validation and test sets. The training set comprised 25 392 sequences, while the validation and test sets comprised 786 and 784 sequences, respectively. The network training was performed using categorical cross-entropy loss function and an Adam optimizer with warm restarts [33] and a learning rate range of 0.001–0.00001. The optimal range for the learning rate was estimated using learning rate finder [34]. The model was validated using the validation set after each training cycle, i.e. after the whole training set was used for training the model.
The training was conducted until the validation loss no longer decreased between consecutive training cycles. The model that achieved the lowest validation loss during all the training cycles was considered optimal and was selected for further analysis. The performance of this model was evaluated using the independent test set.
Statistical analysis
The model performance was evaluated by calculating sleep staging accuracies in an epoch-by-epoch manner. Moreover, the inter-rater agreement between the manual PSG-based scoring and automatic PPG-based scoring was assessed using Cohen’s kappa coefficient (κ) [35]. Furthermore, the confusion matrices were formed to illustrate the accuracy of each sleep stage and additionally the precision and recall values were calculated.
To further assess the performance of the model, total sleep time, sleep efficiency, and the percentage of sleep stages were calculated from the PPG-based sleep staging and compared with parameters from the manual PSG-based scorings. Furthermore, to study the clinical viability and diagnostic validity of the PPG-based slep staging, the apnea-hypopnea index (AHI) values derived from the PSGs were compared with those calculated based on the PPG-based sleep staging. When calculating the PPG-AHI, all the respiratory events occurring during epochs scored as wake by the PPG-based sleep staging were discarded and the number of remaining events was divided by the PPG-derived total sleep time. For further comparison, the AHI from polygraphic recordings (PG) was simulated by including all the respiratory events and dividing by the total recording time. The statistical significance of differences was studied using the Wilcoxon signed-rank test in Matlab 2018b (The MathWorks, Natick, MA).
Results
Differentiating between wake, NREM sleep, and REM sleep
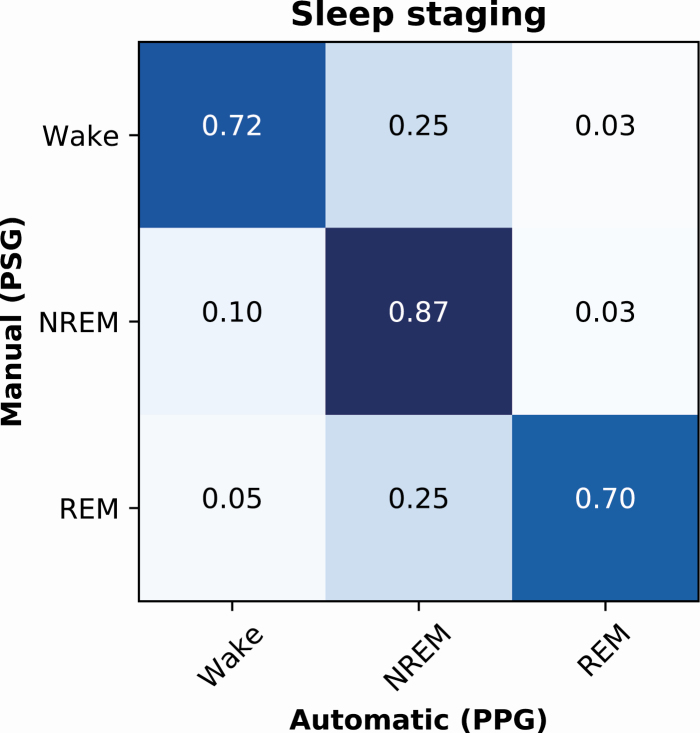
In the three-stage classification of sleep (wake/NREM/REM), the deep learning model trained with PPG signals achieved an epoch-by-epoch accuracy of 89.0% in the training set (n = 715), 79.5% in the validation set (n = 90), and 80.1% in the test set (n = 89). The accuracies corresponded to Cohen’s κ-values of 0.81, 0.63, and 0.65, respectively. For the individual sleep stages in the test set, the precision (recall) was 0.79 (0.72) for wake, 0.81 (0.87) for NREM, and 0.77 (0.70) for REM (Figure 3).
Figure 3.
Normalized confusion matrix of the PPG-based classification accuracies for wake, NREM sleep, and REM sleep in an independent test set of 89 patients with suspected obstructive sleep apnea.
Differentiating between wake, light sleep, deep sleep, and REM sleep
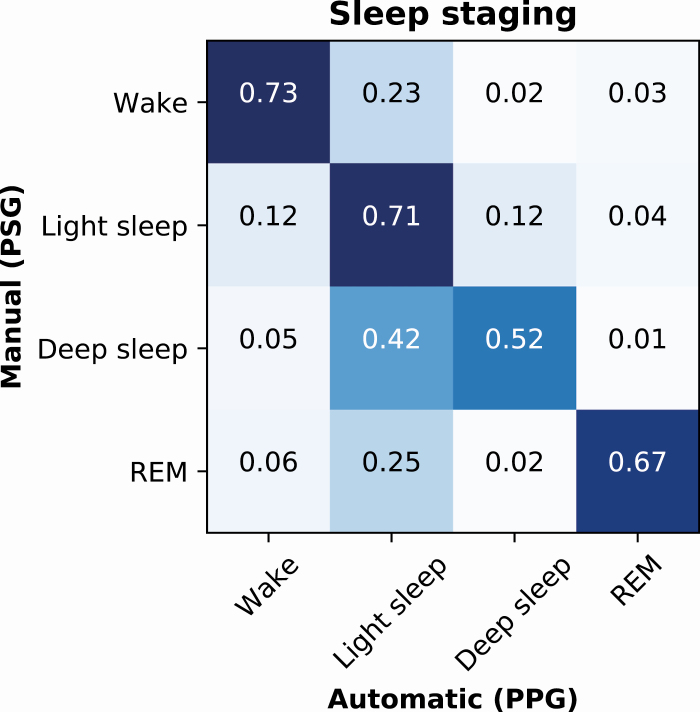
The model developed for the four-stage classification of sleep (wake/N1+N2/N3/REM) achieved an epoch-by-epoch accuracy of 83.1% in the training set, 67.1% in the validation set, and 68.5% in the test set. These corresponded to Cohen’s κ-values of 0.75, 0.51, and 0.54 in the training, validation, and test sets, respectively. In the test set, the precision (recall) was 0.78 (0.73) for wake, 0.64 (0.71) for light sleep, 0.57 (0.52) for deep sleep, and 0.75 (0.67) for REM (Figure 4).
Figure 4.
Normalized confusion matrix of the PPG-based classification accuracies for wake, light sleep (N1+N2), deep sleep (N3), and REM sleep in an independent test set of 89 patients with suspected obstructive sleep apnea.
Differentiating between wake, N1, N2, N3, and REM sleep
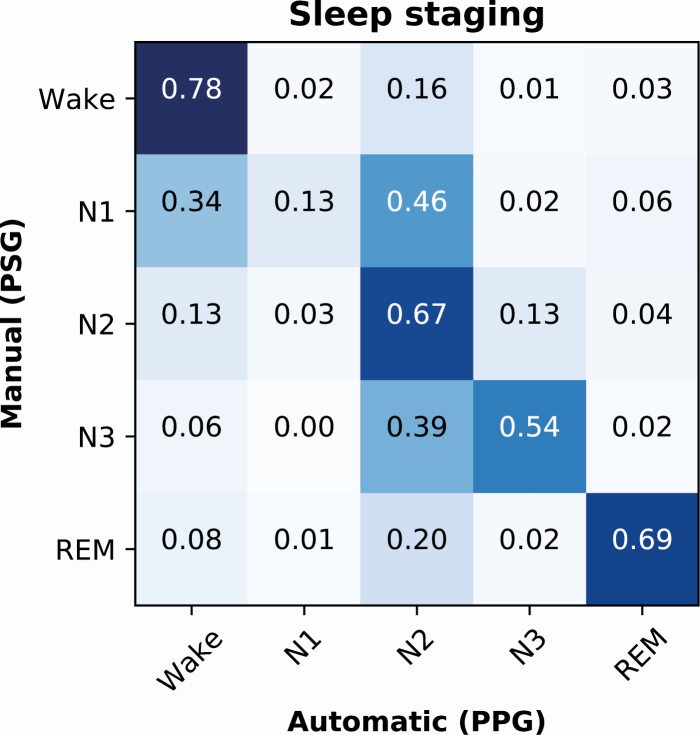
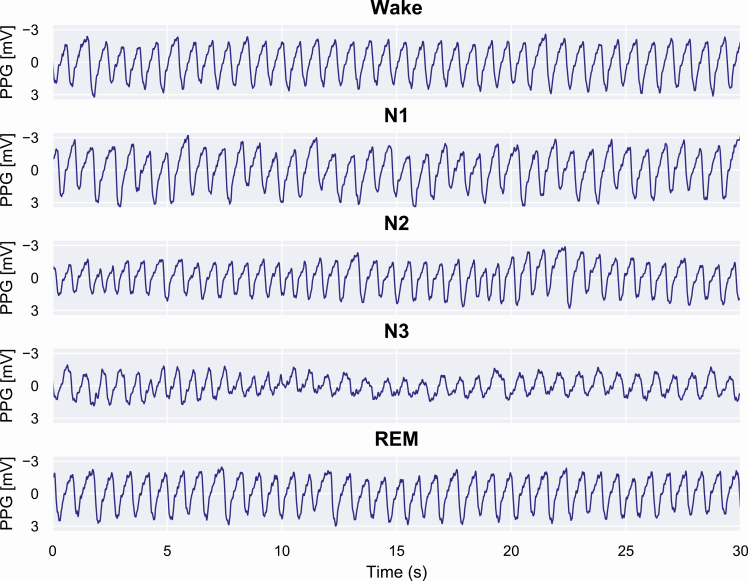
The five-stage (wake/N1/N2/N3/REM) classification model achieved an epoch-by-epoch accuracy of 77.5% in the training set, 62.3% in the validation set, and 64.1% in the test set. The corresponding Cohen’s κ-values were 0.69, 0.48, and 0.51. The precision (recall) was 0.74 (0.78) for wake, 0.34 (0.13) for N1, 0.56 (0.67) for N2, 0.61 (0.54) for N3, and 0.75 (0.69) for REM (Figure 5). Examples of the PPG signals during correctly classified sleep stages are presented in Figure 6.
Figure 5.
Normalized confusion matrix of the PPG-based classification accuracies for wake, N1, N2, N3, and REM sleep in an independent test set of 89 patients with suspected obstructive sleep apnea.
Figure 6.
Examples of PPG signals during correctly identified sleep stages. In these examples, it can be seen that during wake the PPG signal remains stable, and the frequency and amplitude are fairly constant. During N1 sleep, irregular variation in the signal amplitude occurs and the frequency decreases. When progressing to N2 and further to N3 sleep, the amplitude decreases and low-frequency oscillations in the PPG signal begin to occur. In contrast, REM sleep is highly similar to wake but with slightly higher variation in the signal amplitude.
Clinical parameters
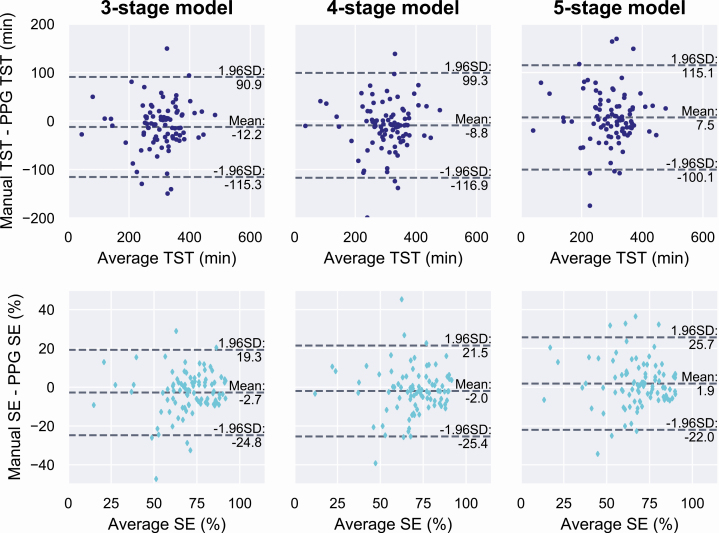
Clinical parameters (total sleep time, sleep efficiency, sleep stage percentages, and AHI) were calculated from the manual PSG-based scorings and from the automatic scorings based only on the PPG signal separately for each classification model. In the independent test set, the mean (SD) total sleep time was 298.4 minutes (79.8 minutes) based on the manual scoring. The mean difference to manual scoring was −12.2 minutes (52.9 minutes) with the three-stage model (p = 0.03), −8.8 minutes (55.5 minutes) with the four-stage model (p = 0.06), and 7.5 minutes (55.2 minutes) with the five-stage model (p = 0.24).
The mean (SD) sleep efficiency based on the manual scoring was 68.4% (16.9%). The mean difference was −2.8% (11.3%) with the three-stage model (p = 0.03), −2.0% (12.0%) with the four-stage model (p = 0.06), and 1.9% (12.2%) with the five-stage model (p = 0.23). Bland–Altman plots for the total sleep time and sleep efficiency are shown in Figure 7.
Figure 7.
Bland–Altman plots for total sleep time (TST, top row) and sleep efficiency (SE, bottom row) from the deep learning models trained to identify three, four, or five sleep stages. Values are calculated as the average and difference between the values obtained from manual PSG-based sleep scoring and from the automatic PPG-based scoring in an independent test set of 89 patients suspected with obstructive sleep apnea.
The mean (SD) percentage of wake in the test set was 31.6% (16.9%) based on the manual scoring. The difference was 2.7% (11.3%) with the three-stage model (p = 0.03), 2.0% (12.0%) with the four-stage model (p = 0.06), and −1.9% (12.2%) with the five-stage model (p = 0.23). Similarly, the percentage of REM was 12.5% (6.5%) with manual scoring and the differences were 1.1% (5.7%) (p = 0.05), 1.3% (5.9%) (p = 0.08), and 1.1% (5.7%) (p = 0.26) with the three-, four-, and five-stage models, respectively. Percentage of NREM sleep was 55.9% (13.8%) with manual scoring, and the difference was −3.8% (11.9%) (p = 0.003) with the three-stage model. Light sleep and deep sleep percentages were 41.2% (13.2%) and 14.7% (11.6%) with manual scoring and the difference was -4.7% (14.1%) (p = 0.005) and 1.4% (11.7%) (p = 0.24) with the four-stage model, respectively. With the manual scoring, percentages of N1, N2, and N3 were 8.6% (6.6%), 32.7% (10.9%), and 14.7% (11.6%), respectively, and the difference was 5.4% (5.7%) for N1 (p < 0.001), −6.3% (12.3%) for N2 (p < 0.001), and 1.7% (11.9%) for N3 (p = 0.08) with the five-stage model.
The mean (SD) diagnostic AHI calculated from the PSG was 24.2 (24.3) events/h in the test set. The simulated polygraphic AHI was 18.8 (17.5) events/h. With the PPG-based sleep staging, the mean AHI was 23.3 (22.5) events/h with the three-stage model, 23.1 (22.1) events/h with the four-stage model, and 22.6 (22.0) events/h with the five-stage model. The mean difference (SD) between the PSG-AHI and polygraphic AHI was -5.3 (12.4) events/h (p < 0.001). The mean difference between the PSG-AHI and PPG-AHI was -0.9 (9.0) events/h with the three-stage model (p = 0.005), -1.1 (8.5) events/h with the four-stage model (p = 0.002), and -1.6 (8.5) events/h with the five-stage model (p < 0.001).
Discussion
In this study, we developed deep learning models for the automated identification of sleep stages from clinical PPG data of suspected OSA patients. The PPG-based sleep staging technique achieved 80.1% epoch-by-epoch accuracy (κ = 0.65) in three-stage classification (wake/NREM/REM), 68.5% (κ=0.54) in four-stage classification (wake/N1+N2/N3/REM), and 64.1% (κ = 0.51) in five-stage classification (wake/N1/N2/N3/REM) of sleep. Based on the guidelines of Landis and Koch [36], the agreement between manual PSG-based scoring and the developed deep learning-based scoring based solely on PPG was substantial in three-stage classification and moderate in four- and five-stage classification. Therefore, utilization of PPG signal together with deep learning methods appears to be a highly promising approach and may enable sufficiently accurate sleep staging for various applications. For example, in OSA diagnostics, the three-stage classification might be sufficient to determine the total sleep time and study the disease characteristics in REM or NREM sleep.
In contrast to earlier studies, the present study utilized only the PPG signal in an end-to-end manner producing an easily applicable method for automatic sleep staging. Previous studies have utilized HRV features estimated from PPG signal for sleep staging [25–28]. However, PPG has also been linked to various characteristics generally perceived from EEG. For example, variations in spectral components of EEG during arousals have also been perceived in PPG [30]. This supports using the full PPG signals for the sleep staging instead of just the estimated HRV content.
Previous studies related to PPG-based sleep staging have relied on a relatively small number of healthy individuals (10–152 participants) [25–28] and have often included actigraphy in addition to PPG [25, 26, 28]. In this study, we utilized recordings of 894 individuals with a high prevalence of OSA (83% of the population). Sleep staging of OSA patients is generally more difficult than in healthy population due to fragmented sleep architecture and an increased amount of N1 sleep and sleep stage transitions [37]. Nevertheless, the performance of our algorithm was at least comparable to previous studies. For example, two-stage sleep-wake classification has been previously conducted with 72.36% [29] and 77% accuracy [28], whereas our model achieved an accuracy of 80.1% in three-stage classification (wake/NREM/REM). Similarly, the Cohen’s κ-value has been between 0.46 and 0.59 for the three-stage classification [25, 27] and between 0.42 and 0.52 for the four-stage classification (wake/light sleep/deep sleep/REM) [25, 26]. In comparison, we achieved κ-values of 0.65 and 0.54 for the three- and four-stage classification, respectively. This illustrates that the PPG-based sleep staging could be used beyond healthy individuals and independently without an actigraphy recording.
Accurate sleep monitoring over multiple consecutive nights has been difficult due to the lack of comfortable, wearable sensors that could be used at home without assistance. Actigraphy has been the preferred method for long-term monitoring but is unable to differentiate between sleep stages and overestimates sleep time whenever the individual is awake and motionless in bed [8, 9]. As the PPG recording is comfortable, low cost, and easy to use, the current results suggest that the PPG-based sleep staging could be a reasonable substitute for actigraphy when the ability to differentiate between sleep stages is required.
Application of PPG-based sleep monitoring could improve the information received from ambulatory PG, not including EEG recording. PPG sensors are already integrated into pulse oximeters in ambulatory PG devices; however, in current clinical practice, sleep parameters are qualitatively estimated based on other measured signals, such as movement and breathing. This is possibly the reason for the significant difference in determined sleep time between PG and PSG [38]. For example, in a large European cohort of OSA patients, the mean total sleep time from PSG was 381.7 min, whereas the estimated sleep time from PG was 428.8 minutes [38]. In the present study, the mean bias error (SD) in the estimated total sleep time based on PPG was only 7.5 (55.2) minutes with the five-stage classification. Even though the SD remains relatively large and some outliers in predictions still remain (Figure 7), the PPG-based staging could provide a way to get a sufficiently accurate estimation of total sleep time for most patients. This is an important result since, e.g., in OSA diagnostics the most commonly used diagnostic parameters depend on the total sleep time. For example, the AHI could be determined with a considerably better correspondence to the PSG; the PPG-based AHI differed with only −0.9 events/h from the standard diagnostic AHI whereas, with the simulated PG-AHI the difference was −5.3 events/h.
Furthermore, application of the PPG-based sleep staging and reliable differentiation between wake, NREM, and REM sleep could assist in detecting REM-related OSA from ambulatory PG. When compared with PSG, ambulatory PGs are considerably cheaper to conduct, have better availability, and are already the preferred diagnostic method in some health care systems [39]. Therefore, the application of the PPG-based sleep staging could significantly enhance the already widely used ambulatory PGs and bring their diagnostic value closer to an in-lab PSG without inducing any additional costs. However, further studies are warranted to assess the performance of the PPG-based sleep staging on ambulatory recordings and investigate the effect of common issues related to ambulatory measurements, such as technical problems in data quality, artifacts, and missing sections of the signal during the night. Furthermore, additional studies are warranted to validate the method across different pulse oximeter types and models.
Besides the potential application of PPG-based sleep staging to PG, the method developed in this study could have applications in various consumer-grade health technology devices. Nowadays, reflective PPG sensors are integrated into various wearable self-tracking devices, such as activity wristbands and smartwatches. Such devices already measure sleep duration and quality, but the algorithms implemented in these devices for sleep staging are not public and their validity has not been thoroughly investigated in a clinical setting [40–43]. In contrast, the PPG-based sleep staging method developed in this study provides highly promising results in a clinical population of patients referred for PSG due to the suspicion of OSA. Thus, it could enable sleep staging beyond the healthy population, enable simple long-term monitoring of sleep quality, and assist in identifying sleep disorders, even with consumer-grade devices. However, the reflective PPG differs from the transmissive measurement giving rise to additional challenges. Therefore, further studies are needed to assess the performance of the developed algorithm in analyzing data from reflective PPG sensors commonly integrated into consumer-grade wearable devices.
The low agreement with manual PSG scoring of N1 is a limitation of the present PPG-based sleep staging. The agreement between manual and PPG-based scoring of the N1 sleep stage was only 13%. The mean percentage of N1 was 8.6% of the recording from the PSG-based scoring while the mean difference was 5.4% with the PPG-based scoring. However, the N1 sleep stage also has a low agreement between manual scorers; the agreement is the lowest of all sleep stages and the κ-value is only between 0.19 and 0.46 [44–46]. This could be the main reason for the low N1 accuracy in the presented PPG-based sleep staging. The N1 sleep stage was mostly misidentified as N2 by the presented PPG-based sleep staging approach. Thus, it is likely that the low N1 agreement is also partially due to relatively small differences in the PPG signals between N1 and N2 sleep stages. This further raises the question of whether differentiating between N1 and N2, the two stages comprising light sleep, is always required for all different applications of sleep staging. Furthermore, the current EEG, EOG, and EMG-based sleep staging suffers from arbitrary rules not fully based on physiological factors. Mainly, the use of 30-second epochs excludes all the information on the sleep microstructure. Therefore, the agreement with PSG-based scoring does not fully capture the feasibility of the PPG sleep staging; rather, future studies are warranted on how the PPG-based sleep staging captures the physiological changes during the night and reflects the outcomes such as perceived sleep quality or daytime vigilance.
In conclusion, as PPG is easy to record, it enables cost-effective and simple sleep monitoring without disrupting natural sleep patterns. Therefore, the PPG-based automatic sleep staging has great potential to supplement the widely used ambulatory PGs, which already include PPG measurement. This could enhance their diagnostic yield by enabling cost-efficient, simple, and reliable long-term monitoring of sleep and by enabling the assessment of otherwise overlooked conditions such as REM-related OSA.
Supplementary Material
Funding
This work was financially supported by the Research Committee of the Kuopio University Hospital Catchment Area for the State Research Funding (projects 5041767, 5041768, 5041770, 5041776, 5041779, 5041780, 5041781, and 5041783), the Academy of Finland (decision numbers 313697 and 323536), the Respiratory Foundation of Kuopio Region, the Research Foundation of the Pulmonary Diseases, Foundation of the Finnish Anti-Tuberculosis Association, the Päivikki and Sakari Sohlberg Foundation, Orion Research Foundation, Instrumentarium Science Foundation, the Finnish Cultural Foundation via the Post Docs in Companies program and via the Central Fund, the Paulo Foundation, the Tampere Tuberculosis Foundation, and Business Finland (decision number 5133/31/2018).
Conflict of interest statement. None declared.
References
- 1. Berry RB, et al. The AASM Manual for the Scoring of Sleep and Associated Events: Rules, Terminology and Technical Specifications. Version 2. Darien, IL: American Academy of Sleep Medicine; 2018. doi: 10.1016/j.carbon.2012.07.027 [DOI] [Google Scholar]
- 2. Bruyneel M, et al. Sleep efficiency during sleep studies: results of a prospective study comparing home-based and in-hospital polysomnography. J Sleep Res. 2011;20(1 Pt 2):201–206. [DOI] [PubMed] [Google Scholar]
- 3. Iber C, et al. Polysomnography performed in the unattended home versus the attended laboratory setting – sleep heart health study methodology. Sleep. 2004;27(3):536–540. doi: 10.1093/sleep/27.3.536 [DOI] [PubMed] [Google Scholar]
- 4. Myllymaa S, et al. Assessment of the suitability of using a forehead EEG electrode set and chin EMG electrodes for sleep staging in polysomnography. J Sleep Res. 2016;25(6):636–645. [DOI] [PubMed] [Google Scholar]
- 5. Miettinen T, et al. Success rate and technical quality of home polysomnography with self-applicable electrode set in subjects with possible sleep bruxism. IEEE J Biomed Health Inform. 2018;22(4):1124–1132. [DOI] [PubMed] [Google Scholar]
- 6. Ancoli-Israel S, et al. The role of actigraphy in the study of sleep and circadian rhythms. Sleep. 2003;26(3):342–392. [DOI] [PubMed] [Google Scholar]
- 7. Morgenthaler T, et al. ; Standards of Practice Committee; American Academy of Sleep Medicine Practice parameters for the use of actigraphy in the assessment of sleep and sleep disorders: an update for 2007. Sleep. 2007;30(4):519–529. [DOI] [PubMed] [Google Scholar]
- 8. Sadeh A. The role and validity of actigraphy in sleep medicine: an update. Sleep Med Rev. 2011;15(4):259–267. doi: 10.1016/j.smrv.2010.10.001 [DOI] [PubMed] [Google Scholar]
- 9. Paquet J, et al. Wake detection capacity of actigraphy during sleep. Sleep. 2007;30(10):1362–1369. [DOI] [PMC free article] [PubMed] [Google Scholar]
- 10. Biswal S, et al. Expert-level sleep scoring with deep neural networks. J Am Med Inform Assoc. 2018;25(12):1643–1650. [DOI] [PMC free article] [PubMed] [Google Scholar]
- 11. Patanaik A, et al. An end-to-end framework for real-time automatic sleep stage classification. Sleep. 2018;41(5):1–11. [DOI] [PMC free article] [PubMed] [Google Scholar]
- 12. Phan H, et al. Seqsleepnet: end-to-end hierarchical recurrent neural network for sequence-to-sequence automatic sleep staging. IEEE Trans Neural Syst Rehabil Eng. 2019;27(3):400–410. [DOI] [PMC free article] [PubMed] [Google Scholar]
- 13. Malafeev A, et al. Automatic human sleep stage scoring using deep neural networks. Front Neurosci. 2018;12:781. [DOI] [PMC free article] [PubMed] [Google Scholar]
- 14. Sun H, et al. Large-Scale automated sleep staging. Sleep. 2017;40(10). doi: 10.1093/sleep/zsx139 [DOI] [PMC free article] [PubMed] [Google Scholar]
- 15. Korkalainen H, et al. Accurate deep learning-based sleep staging in a clinical population with suspected obstructive sleep apnea. IEEE J Biomed Heal Informatics. 2019. doi: 10.1109/JBHI.2019.2951346 [DOI] [PubMed] [Google Scholar]
- 16. Penzel T, et al. Comparison of detrended fluctuation analysis and spectral analysis for heart rate variability in sleep and sleep apnea. IEEE Trans Biomed Eng. 2003;50(10):1143–1151. [DOI] [PubMed] [Google Scholar]
- 17. Elsenbruch S, et al. Heart rate variability during waking and sleep in healthy males and females. Sleep. 1999;22(8):1067–1071. [DOI] [PubMed] [Google Scholar]
- 18. Somers VK, et al. Sympathetic-nerve activity during sleep in normal subjects. N Engl J Med. 1993;328(5):303–307. [DOI] [PubMed] [Google Scholar]
- 19. Berlad I, et al. Power spectrum analysis and heart rate variability in Stage 4 and REM sleep: evidence for state-specific changes in autonomic dominance. J Sleep Res. 1993;2(2):88–90. doi: 10.1111/j.1365-2869.1993.tb00067.x [DOI] [PubMed] [Google Scholar]
- 20. Li Q, et al. Deep learning in the cross-time frequency domain for sleep staging from a single-lead electrocardiogram. Physiol Meas. 2018;39(12):124005. [DOI] [PMC free article] [PubMed] [Google Scholar]
- 21. Fonseca P, et al. Sleep stage classification with ECG and respiratory effort. Physiol Meas. 2015;36(10):2027–2040. [DOI] [PubMed] [Google Scholar]
- 22. Willemen T, et al. An evaluation of cardiorespiratory and movement features with respect to sleep-stage classification. IEEE J Biomed Health Inform. 2014;18(2):661–669. [DOI] [PubMed] [Google Scholar]
- 23. Lu S, et al. Can photoplethysmography variability serve as an alternative approach to obtain heart rate variability information? J Clin Monit Comput. 2008;22(1):23–29. [DOI] [PubMed] [Google Scholar]
- 24. Selvaraj N, et al. Assessment of heart rate variability derived from finger-tip photoplethysmography as compared to electrocardiography. J Med Eng Technol. 2008;32(6):479–484. [DOI] [PubMed] [Google Scholar]
- 25. Fonseca P, Weysen T, Goelema MS, et al. Validation of photoplethysmography-based sleep staging compared with polysomnography in healthy middle-aged adults. Sleep. 2017;40(7). doi: 10.1093/sleep/zsx097 [DOI] [PubMed] [Google Scholar]
- 26. Beattie Z, et al. Estimation of sleep stages in a healthy adult population from optical plethysmography and accelerometer signals. Physiol Meas. 2017;38(11):1968–1979. [DOI] [PubMed] [Google Scholar]
- 27. Uçar MK, et al. Automatic sleep staging in obstructive sleep apnea patients using photoplethysmography, heart rate variability signal and machine learning techniques. Neural Comput Appl. 2018;29(8):1–16. [Google Scholar]
- 28. Dehkordi P, et al. Sleep/wake classification using cardiorespiratory features extracted from photoplethysmogram. Comput Cardiol (2010). 2016;43:1021–1024. [Google Scholar]
- 29. Motin MA, et al. Sleep-wake classification using statistical features extracted from photoplethysmographic signals. Conf Proc IEEE Eng Med Biol Soc. 2019;2019:5564–5567. [DOI] [PubMed] [Google Scholar]
- 30. Delessert A, et al. Pulse wave amplitude drops during sleep are reliable surrogate markers of changes in cortical activity. Sleep. 2010;33(12):1687–1692. [DOI] [PMC free article] [PubMed] [Google Scholar]
- 31. Grote L, et al. Finger plethysmography – a method for monitoring finger blood flow during sleep disordered breathing. Respir Physiol Neurobiol. 2003;136(2–3):141–152. [DOI] [PubMed] [Google Scholar]
- 32. Duce B, et al. The AASM recommended and acceptable EEG montages are comparable for the staging of sleep and scoring of EEG arousals. J Clin Sleep Med. 2014;10(7):803–809. [DOI] [PMC free article] [PubMed] [Google Scholar]
- 33. Loshchilov I, et al. SGDR: stochastic gradient descent with warm restarts. arXiv:1608.03983.
- 34. Smith LN. Cyclical learning rates for training neural networks. In: Proceeding 2017 IEEE Winter Conference on Applications of Computer Vision (WACV); March 24 to 31, 2017; Santa Rosa, USA. New York (NY): IEEE; 2017:464–472. [Google Scholar]
- 35. Cohen J. A coefficient of agreement for nominal scales. Educ Psychol Meas. 1960;20(1):37–46. [Google Scholar]
- 36. Landis JR, et al. The measurement of observer agreement for categorical data. Biometrics. 1977;33(1):159–174. doi: 10.2307/2529310 [DOI] [PubMed] [Google Scholar]
- 37. Norman RG, et al. Interobserver agreement among sleep scorers from different centers in a large dataset. Sleep. 2000;23(7):901–908. [PubMed] [Google Scholar]
- 38. Escourrou P, et al. ; ESADA Study Group The diagnostic method has a strong influence on classification of obstructive sleep apnea. J Sleep Res. 2015;24(6):730–738. [DOI] [PubMed] [Google Scholar]
- 39. Flemons WW, et al. Access to diagnosis and treatment of patients with suspected sleep apnea. Am J Respir Crit Care Med. 2004;169(6):668–672. [DOI] [PubMed] [Google Scholar]
- 40. de Zambotti M, et al. The sleep of the ring: comparison of the ōura sleep tracker against polysomnography. Behav Sleep Med. 2019;17(2):124–136. [DOI] [PMC free article] [PubMed] [Google Scholar]
- 41. Evenson KR, et al. Systematic review of the validity and reliability of consumer-wearable activity trackers. Int J Behav Nutr Phys Act. 2015;12:159. [DOI] [PMC free article] [PubMed] [Google Scholar]
- 42. Gruwez A, et al. The validity of two commercially-available sleep trackers and actigraphy for assessment of sleep parameters in obstructive sleep apnea patients. PLoS One. 2019;14(1):e0210569. [DOI] [PMC free article] [PubMed] [Google Scholar]
- 43. de Zambotti M, et al. Wearable sleep technology in clinical and research settings. Med Sci Sports Exerc. 2019;51(7):1538–1557. [DOI] [PMC free article] [PubMed] [Google Scholar]
- 44. Danker-Hopfe H, et al. Interrater reliability for sleep scoring according to the Rechtschaffen & Kales and the new AASM standard. J Sleep Res. 2009;18(1):74–84. [DOI] [PubMed] [Google Scholar]
- 45. Magalang UJ, et al. ; SAGIC Investigators Agreement in the scoring of respiratory events and sleep among international sleep centers. Sleep. 2013;36(4):591–596. [DOI] [PMC free article] [PubMed] [Google Scholar]
- 46. Zhang X, et al. Process and outcome for international reliability in sleep scoring. Sleep Breath. 2015;19(1):191–195. [DOI] [PubMed] [Google Scholar]
Associated Data
This section collects any data citations, data availability statements, or supplementary materials included in this article.


