Abstract
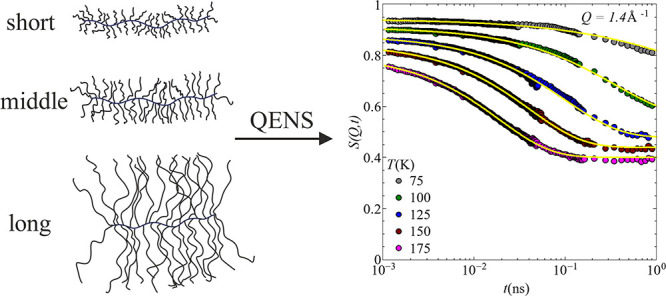
We have studied the short-time dynamical behavior of polydimethylsiloxane (PDMS) bottlebrush polymers, PDMS-g-PDMS. The samples have similar backbone lengths but different side-chain lengths, resulting in a shape transition. Quasi-elastic neutron scattering was used to observe the dynamical changes inherent to these structural changes. The combination of data from three spectrometers enabled to follow the dynamics over broad frequency and temperature ranges, which included segmental relaxations and more localized motions. The latter, identified as the methyl group rotation, is described by a threefold jump model and shows higher activation energies compared to linear PDMS. The segmental relaxation times, τs, decrease with increasing molecular weight of the side chains but increase with momentum transfer, Q, following a power law, which suggests a non-Gaussian behavior for bottlebrush polymers.
Introduction
Bottlebrush polymers, i.e., linear side chains covalently bonded to a linear backbone, have received great interest in recent times. These architectural modifications cause shape changes, such as from spherical into elongated objects, simply by varying the size ratio of backbone to side-chain length.1−7 Inherent with the bottlebrush architecture are extraordinary properties, such as super softness or low viscosity. These properties are desirable in the development of new materials. Novel composites that take advantage of shell-only particles or surface modifications can be envisioned.3,8,9 The resulting macroscopic behavior is governed by microscopic relaxation processes. However, only little is known about the dynamics of bottlebrush polymer melts. For polymers with a linear architecture or very short side chains, the relaxation spectra are dominated by the backbone.10 If side chains exceed a certain length, rheology can detect the emergence of new processes.11 In bottlebrushes, the shape transition from elongated into spherical shapes may change the molecular dynamics of the system. We have investigated the short-time dynamics of polydimethylsiloxane (PDMS)-based bottlebrush polymers, PDMS-g-PDMS, for the first time, by quasi-elastic neutron scattering (QENS). In the current study, three different samples were considered, with similar backbones but different lengths of the side chain. The existence of the shape transition in these samples has been confirmed by small-angle neutron scattering (SANS) experiments.12
Dynamical processes in polymers evolve over several orders of magnitude in time. To cover such a broad time range with QENS, a combination of three different spectrometers was used in this study, covering a time range of t = 1 ps to t = 1 ns. By analyzing the dependence of the incoherent intermediate scattering function, S(Q,t) ≔ Sinc(Q,t), on the time, t, and the momentum transfer, Q, we obtain information about the geometrical confinement of localized motions as well as the relaxation times of the individual processes.
Experimental Section
QENS measures the dynamic structure factor which comprises coherent and incoherent parts resulting from the scattering event such that S(Q,ω) = Scoh(Q,ω) + Sinc(Q,ω). The samples studied here are protonated PDMS-g-PDMS bottlebrush polymers, and as such, because of the large incoherent scattering cross section of hydrogen, σinc = 80.26 × 10⁻²⁴ cm2, the measured dynamical structure factor is dominated by the incoherent part. Therefore, in our case, S(Q,ω) = Sinc(Q,ω).
The measured intensity, Sexp(Q,ω), is a convolution of the pure sample scattering, Sinc(Q,ω), with the instrument-specific resolution, R(Q,ω), i.e., Sexp(Q,ω) = Sinc(Q,ω) ⊗ R(Q,ω). The resolution, which represents the longest timescale that can be probed by the instrument, is a fundamental property of the spectrometer used to measure the signal. As the temperature is changed, it is not uncommon for a signal to shift from the dynamic range of one instrument to another. In reciprocal and energy space, the resolution is convoluted with the sample scattering, while if one performs the time Fourier transformation of the data to get the intermediate scattering function, Sinc(Q,t), the convolution is a simple multiplication.
| 1 |
Doing this implies that it becomes easier to account for the resolution and thus compare the dynamic structure factor across a number of instruments.
| 2 |
In order to cover a broad dynamical range, we have used a combination of three different QENS instruments, the time-of-flight spectrometer Pelican13 at ANSTO, the time-of-flight backscattering instrument IRIS14 at ISIS, and the backscattering instrument EMU15 at ANSTO. Each of them has a different energy transfer and energy resolution, resulting in different time ranges. The technical specifications of the instruments are summarized in Table 1.
Table 1. Specifications of the Different QENS Instruments Used for Our Experiment.
| location | instrument | energy resolution (μeV) | energy range (meV) | Q-range (Å–1) |
|---|---|---|---|---|
| ANSTO | EMU | 1.1 | –0.028 to 0.028 | 0.4–1.8 |
| ISIS | IRIS | 17.5 | –0.55 to 0.57 | 0.6–1.6 |
| ANSTO | Pelican | 65 | –19.99 to 2.59 | 0.2–1.8 |
All measurements were conducted in a temperature range of T = 75 K to T = 300 K, accompanied with a measurement of the instrument resolution at low temperature, specifically at T = 1.5 K on EMU and Pelican and at T < 10 K on IRIS. For the temperature control, a closed-cycle cryostat with a secondary helium circulation loop, controlled by a needle valve (EMU and Pelican), and a closed-cycle refrigerator (IRIS) were used. This allowed a base temperature of T < 10 K.
For the normalization against detector efficiency, standard vanadium calibration data were used for each instrument. The samples were loaded into aluminum cans with aluminum screws provided by ANSTO, and all measurements were carried out with these same cans, to ensure consistency over the three instruments. The sample gap was chosen to be 0.1 mm, which ensures 90% transmission and minimizes multiple scattering. For all experiments, the program MANTID16 was used for data reduction, employing existing routines specific for each of the three spectrometers.
Backscattering Instrument—EMU
EMU is a neutron backscattering instrument located at ANSTO, Sydney, Australia.15 Neutrons with a wavelength of λ = 6.28 Å are selected via a pyrolytic graphite crystal premonochromator via their (002) Bragg reflection. The continuous beam is split by a background chopper into several bunches, i.e., the neutron beam is pulsed to reduce background scattering. The following graphite chopper, that is, a disc chopper with graphite elements located at the periphery, deflects the neutrons, in its closed position, to the Doppler drive. The Doppler drive oscillates with a maximum velocity of vmax = 4.7 m/s and shifts the neutrons in energy, creating an energy distribution of (Ei ± δE)(t). The Doppler-shifted neutrons pass the graphite chopper in the open position and scatter at the sample. A small number of scattered neutrons, fulfilling the Bragg condition, are reflected by the analyzer array crystals, Si(111), and pass the sample a second time. The backscattered neutrons are collected at the detectors. The time dependence of the Doppler drive and therefore of δE(t) is known. This allows to obtain the energy transfer ΔE of the sample.
Time-of-Flight Backscattering Instrument—IRIS
IRIS is an indirect geometry time-of-flight spectrometer located at the pulsed neutron source ISIS, Didcot, United Kingdom.14 The incident neutron beam from the spallation source is wavelength-selected by a chopper, with a frequency of f = 50 Hz, resulting in a bandwidth of neutrons centered at λ = 6.66 Å. These neutrons scatter upon interaction with the sample in all directions and hit an analyzer array of pyrolytic graphite. Similar to EMU, those neutrons, fulfilling the Bragg condition, in this case, the (002) reflection, are reflected back from the analyzers and collected at the detectors. By knowing the total time-of-flight time, t, of the neutrons together with the distances L1, source–sample, and L2, sample–analyzer–detectors, the energy exchange within the sample can be determined.
Time-of-Flight Spectrometer—Pelican
Pelican is a direct time-of-flight geometry cold-neutron spectrometer at ANSTO, Sydney, Australia.13 The incoming neutrons are monochromatized and wavelength-selected by a focusing crystal and pulsed by two Fermi choppers, which are phased in order to remove λ/2 from the neutron beam. These pulsed neutrons of λ = 6 Å scatter at the sample in all directions to be collected at the detectors. The time, t0, needed for elastic scattering without energy transfer can be determined based on the initial energy, Ei, and the pathlength, which the neutrons need to travel until the detector is reached. The energy transfer can be determined by taking the difference in the “real” flight time, ttof, which was needed including energy exchange and the elastic time, t0. This results in the scattering intensity depending on the scattering angle and time. This instrument is able to detect larger energy transfers compared to EMU and IRIS. Thus, the simple approximation for the momentum transfer based on elastic scattering is not valid, and the law of cosines is applied.
Samples
The samples used in this study are bottlebrush polymer melts based on PDMS, i.e., PDMS-g-PDMS bottlebrushes. Details of the synthesis route have been previously described in a related publication.12 These samples have been analyzed prior by dielectric spectroscopy and SANS.12 For completeness, the resulting molecular weights, together with the polydispersity index (PDI) and the grafting density, are summarized in Table 2. A pictorial representation of the resulting shapes of the different bottlebrush polymers is illustrated in Figure 1.
Table 2. Number-Average Molecular Weight, Mn, PDI, and Grafting Density, ρ*, of the Three Bottlebrush Samples and Their Single Component.
| name | single chain Mn (g/mol) (PDI) | bottlebrush Mn (kg/mol) (PDI) [ρ*] |
|---|---|---|
| side chain short | 298 (1.0) | 95 (1.3) [89] |
| side chain middle | 1800 (1.2) | 157 (1.1) [30] |
| side chain long | 11,500 (1.1) | 1106 (1.2) [41] |
| backbone short | 16,500 (1.1) | |
| backbone middle/long | 13,500 (1.2) |
Figure 1.
Simplified illustration of the shape of the PDMS-g-PDMS bottlebrush polymers with (a) Mnside chain = 298 g/mol, (b) Mn = 1800 g/mol, and (c) Mnside chain = 11,500 g/mol.
Results
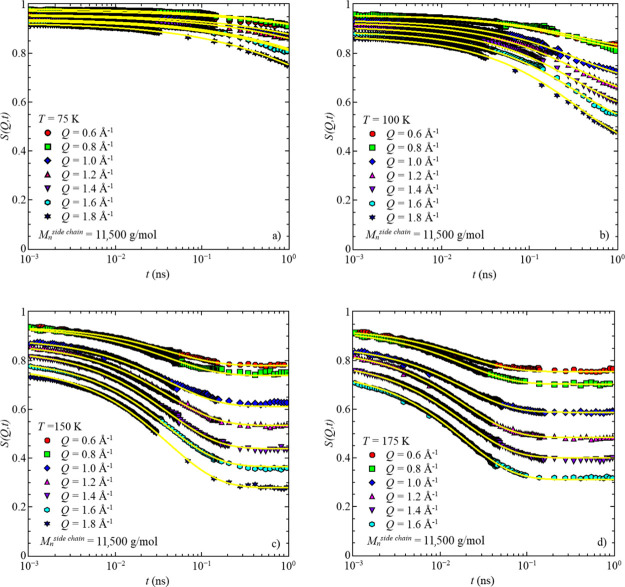
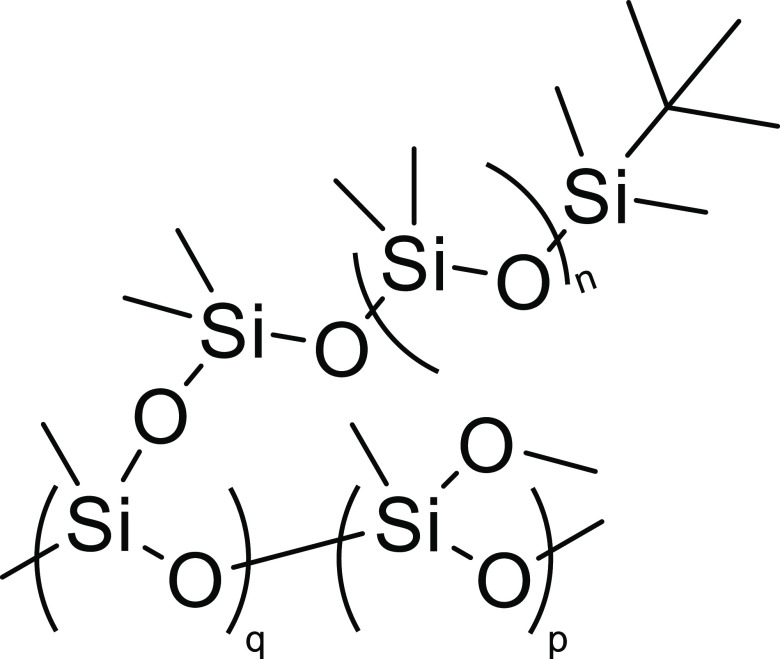
At the lowest temperatures, a weak decay with almost Q-independent relaxation times is observed in the accessible time range, as seen in Figure 3a,b. This indicates a localized motion, which at such temperatures, where the segmental dynamics are assumed to be frozen or too slow, can be attributed to the rotation of the methyl groups because all protons of the bottlebrush polymer are parts of a methyl group (Figure 2).17
Figure 3.
Intermediate scattering function, S(Q,t), vs time, t, for the sample with Mnside chain = 11,500 g/mol for four different temperatures: (a) T = 75 K, (b) T = 100 K, (c) T = 150 K, and (d) T = 175 K. Solid lines represent the data descriptions with the model function for low temperatures, eq 3.
Figure 2.
Chemical structure of the PDMS-g-PDMS bottlebrush polymer with all protons located in the methyl groups.
By comparing the glass-transition temperature, determined by dielectric spectroscopy by Jakobi et al.(12) (Table 3), with the measurement temperature of Figure 3a,b, it reveals that these two temperatures are below Tg, thus the segmental dynamics are frozen.
Table 3. Glass-Transition Temperature, Tg, of the Three Samples, Taken from the Publication of Jakobi et al.(12).
| Mnside chain | Tg (K) |
|---|---|
| 298 | 140.4 ± 0.2 |
| 1800 | 146.2 ± 0.5 |
| 11,500 | 144.6 ± 0.7 |
With increasing temperature, the amplitude decreases slightly and the decay is still almost independent of the momentum transfer, which adds further support for the localized motions. In the long-time region, a plateau, intensifying with increasing temperature, emerges (Figure 3c,d). Similar behavior is seen for all three samples. The data of Figure 3c,d are measured above Tg; however, based on dielectric spectroscopy data,12 in this temperature range, the segmental dynamics are too slow to be in the available time window for QENS.
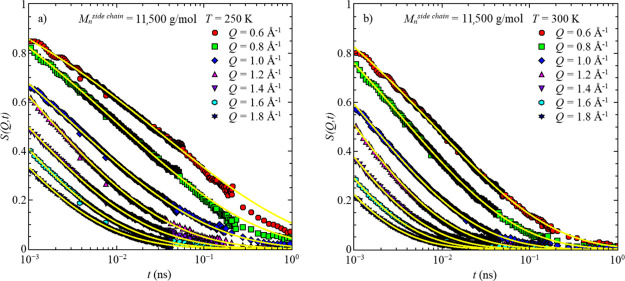
Further increasing the measurement temperature shifts the next slower dynamical process, i.e., segmental relaxation, into the available time window of QENS. Here, the methyl group dynamics are too fast to show any contributions to the intermediate scattering function, Sinc(Q,t). In this temperature region, a full decay to 0 is visible for all Q-values in the accessible time range (Figure 4). Similar behavior is observed in all three samples (Figures S1–S4 in the Supporting Information).
Figure 4.
: Intermediate scattering function, S(Q,t), vs time, t, for the sample with Mnside chain = 11,500 g/mol for two temperatures, (a) T = 250 K and (b) T = 300 K. Solid lines represent the data descriptions with the model function for high temperatures, eq 5.
Data Analysis
The experimental data suggest two different processes in the available time range, separated by temperature. Based on the results, the first process at low temperatures is identified as the methyl group rotation, whereas the second process is dominated by the segmental relaxation.
Methyl group rotations are localized
and confined by their geometry, i.e., by the positions the hydrogen
atoms can occupy. The mathematical framework of the so-called elastic
incoherent structure factor (EISF) is very useful for describing localized
motions (represented as index  ), which
leads to
 |
3 |
with the Debye–Waller factor
and a
prefactor A. Because polymers show a distribution
of different relaxation times, the Kohlrausch–Williams–Watts
(KWW) function,  , is an appropriate way
to describe the
relaxation times of the involved processes.17−20 In this context,
  describes
the relaxation time of the methyl
groups and
  is
the stretching exponent, resembling
the width of the relaxation time distribution.
Typical for the EISF of the methyl group rotation is the so-called threefold jump
| 4 |
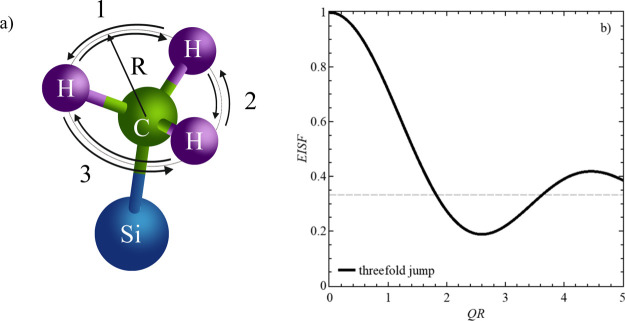
with j0 being the zeroth-order spherical Bessel function and R being the circle radius.20−22 Here, the hydrogen atoms can jump between three equidistant positions on a circle with radius R (Figure 5a). The threefold jump, represented by the EISF, is an oscillation around EISF = 1/3 for large Q-values (Figure 5b). This assumption is also valid for our sample systems, as seen later in the data discussion.
Figure 5.
(a) Three-dimensional illustration of a methyl group, attached to a silicon atom, including the radius, R, of the circle spanned by the position of the hydrogen atoms. (b) EISF, vs QR of the methyl group rotation, that is, the motions of the H atoms, confined to a potential of a threefold jump.
At higher temperatures, the segmental relaxation prevails with some contributions of the Debye–Waller factor. There are no geometrical constraints imposed on the segmental relaxation; therefore, an additional EISF is not needed for the data description, and the model function is reduced to
| 5 |
with τs being the segmental relaxation time and βs being the associated stretching parameter of the KWW function.
Both model functions have a large
number of adjustable parameters.
Therefore, to improve the stability of the fitting function, reasonable
assumptions are needed. For the low-temperature function (eq 3), the atomistic mean-square
displacement u2 as well as the relaxation
time of the localized motion  and the associated stretching parameter
  are
assumed to be independent of Q. In the case of the
Debye–Waller factor, the Q-dependence is already
included as the Q2 factor within the exponential
function, and therefore, u2 only depends
on temperature. The relaxation
time of the localized motion occurs naturally on a well-restricted
geometry, and therefore, no significant Q-dependence
is detectable.22 Furthermore, QENS experiments
on similar sample systems have not shown any substantial dependence
on Q within the experimental error for the stretching
parameter,
  .20,23 The EISF shows an explicit Q-dependence, which
is determined separately.
In the case of the segmental relaxation, described with the model function for high temperatures (eq 5), the relaxation times show a pronounced Q-dependence.17,24,25 Therefore, τs needs to be determined for each Q-value independently. The stretching parameter, βs, verified by single fits, and u2 are treated to be independent of the momentum transfer.
All Q-values of one temperature are fitted with a so-called “Global Fit”. By means of this, all Q-values are simultaneously described with the respective model function, whereby the Q-independent parameters are shared over all Q-values. Shared implies that all values do not depend on Q and should therefore be the same for all momentum transfers.
Discussion
The plateau in the long-time region at the low temperatures raises the question whether the geometrical constraint of the methyl groups causes this effect. Adjusting the intermediate scattering function for the EISF and the Debye–Waller factor according to eq 6
 |
6 |
results in a full decay to 0 for all Q-values, as seen in Figure 6. This supports the assumption that the plateau is caused by the constrained dynamics of the methyl group rotation. Similar results have been reported for poly(vinyl acetate)26 and poly(methyl methacrylate).20
Figure 6.
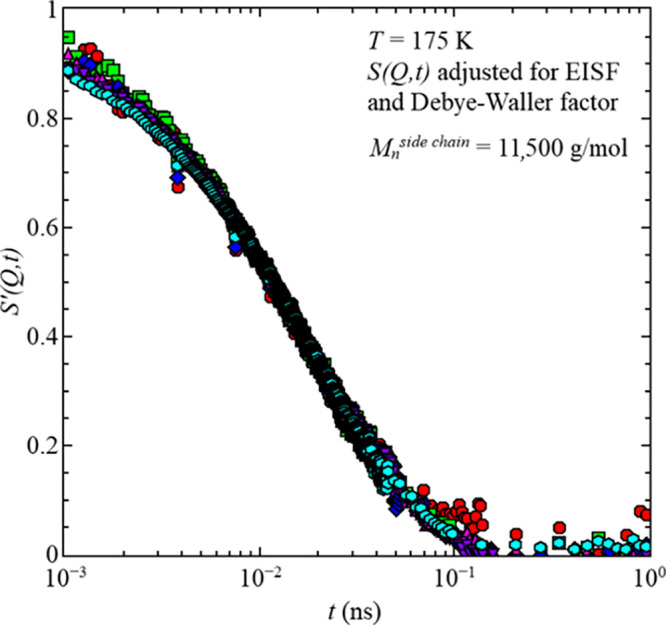
Adjusted intermediate scattering function, S′(Q), vs time, t, for the sample with Mnside chain = 11,500 g/mol for all Q-values at temperature T = 175 K, cf. text.
The resulting EISF values show a particular dependence on the temperature and the momentum transfer (Figure S5). Describing these dependencies with the classical threefold jump (eq 4), known for methyl group rotations, implies a temperature-dependent radius of the methyl group rotation, which increases by ∼28% within ΔT = 100 K and exceeds the maximum radius, that is possible based on the bond length. Therefore, a modified threefold jump model has been used including the fraction, m, of participating protons on the signal in the available time window.20,27,28
| 7 |
Here, a temperature-independent radius, R, of the methyl group rotation has been calculated based on the H–H distance of 1.79 Å,29 resulting in R = 1.033 Å. As seen in the inset of Figure 7, the number of protons contributing to the measurement signal increases with increasing temperature and reaches 100% for the highest temperatures. This approach has previously also been applied to poly(methyl methacrylate) studies.30 Interestingly, a nonsystematic change of the participating fraction depending on the molecular weight of the side chains is visible, especially at low temperatures. This could be due to the differences in the grafting density; however, a more detailed study would be needed to verify this in detail.
Figure 7.
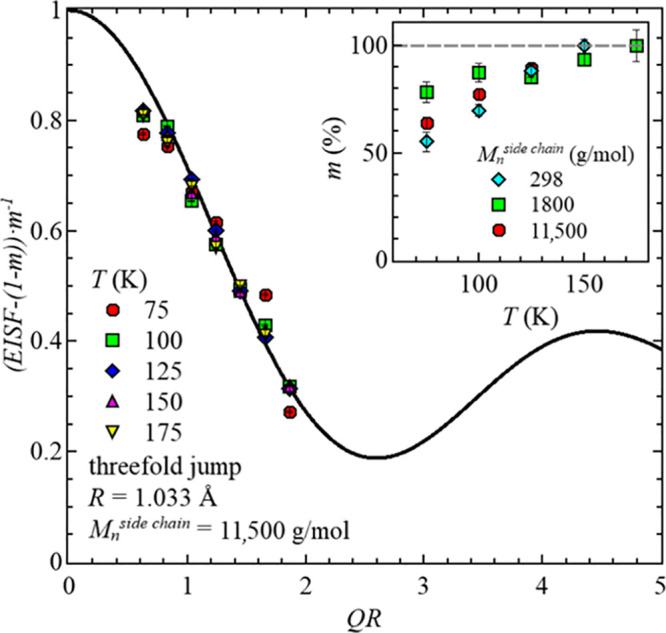
EISF, adjusted for the participation protons vs QR for the sample with Mnside chain = 11,500 g/mol at different temperatures. The solid black line represents the motion of a hydrogen atom, confined to the potential of a threefold jump. Inset: Fraction of participating protons, m, vs temperature, T, for all three samples.
After adjusting the EISF for the temperature dependence of the participating proton fraction, m, all values obtained for the different temperatures superimpose, as seen in Figure 7. Here, the data can be well described with the threefold jump model, which agrees with the results in the literature of methyl group dynamics.21,31
The resulting stretching parameter,  , for
all three samples, which is associated
with the relaxation time distribution, shows a weak temperature dependence,
as illustrated in Figure S6 in the Supporting Information. With increasing temperature,
  increases
and tends to saturate at high
temperatures,20 for the two bottlebrush
polymers having Mnside chain = 1800 g/mol and Mn = 11,500 g/mol. A potential consequence could be narrowing of the
relaxation time distribution as the temperature increases. It could
be connected to the fraction of protons contributing to the signal.
In the case of the Mnside chain = 298 g/mol sample, the
  parameter
peaks and does not show a clear
connection with the fraction of participating protons. At high temperatures,
the motions of almost all protons, which are mainly located in the
methyl groups, are within the available time window. Therefore, the
relaxation times are more uniform and less distributed, resulting
in higher
  values.
Because of the different final
values, which
  of
these two samples approximates, the
grafting density could have some influence on the final distribution
width in the high-temperature region. However, at this point, a more
detailed statement is not possible.
Focusing on the temperature
dependence of the relaxation times
for the localized motions,  , a similar behavior is seen for all three
samples. With increasing temperature, the relaxation time decreases,
i.e., the relaxation speeds up (Figure 8).
Figure 8.
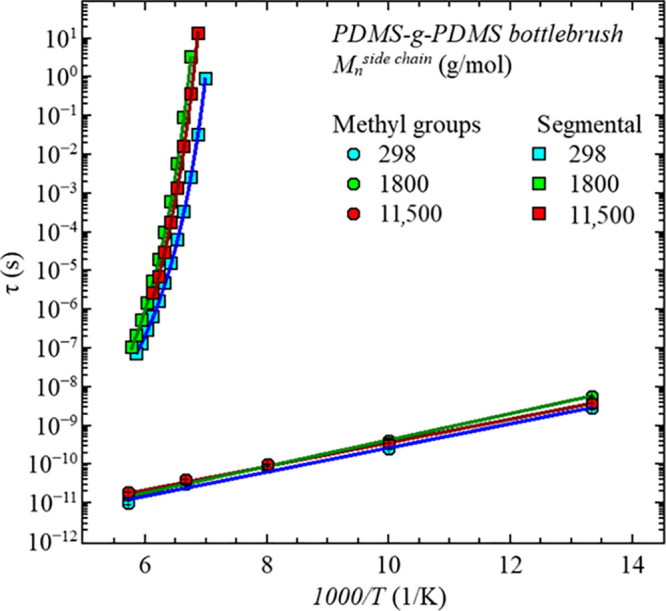
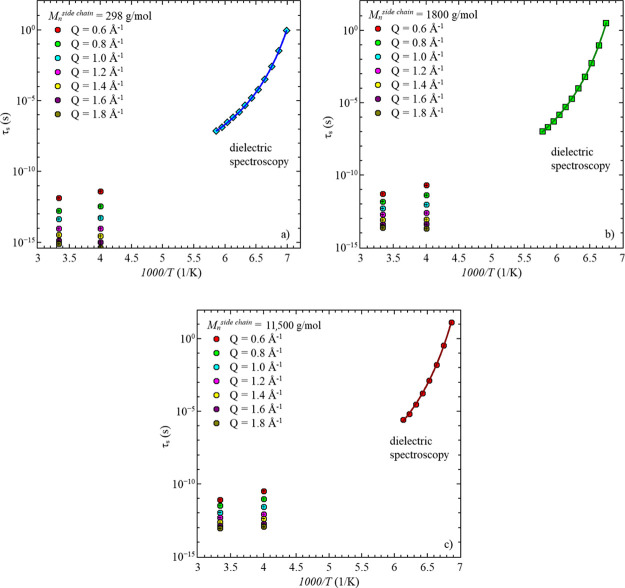
Relaxation times, τ, vs 1000/T of all three samples for the two relaxation processes. Round symbols refer to the methyl group dynamics measured by QENS, described by the Arrhenius law, and squared symbols refer to the segmental dynamics obtained by dielectric spectroscopy and described by the Vogel–Fulcher–Tammann (VFT) law.12
This behavior follows an Arrhenius law, which implies a thermally activated process with a characteristic activation energy, EA, describing the energy barrier the methyl group needs to overcome to perform the threefold jump, that is, a rotation around the Si–C bond to the next possible hydrogen position. The resulting fit parameters of the Arrhenius law are summarized in Table 4. For all three samples, the values are on the same orders of magnitude. Furthermore, literature values of QENS experiments on linear PDMS of EA = (4.5 ± 0.5) kJ/mol18,19 or EA = 5.2 kJ/mol32 imply that the methyl group dynamics only slightly depend on the molecular weight. However, comparing the linear and bottlebrush architectures shows significantly different activation energies, as seen in Table 4. As observed for numerous polymers, CH3 rotations depend on the local environment.20,22,33 According to Jakobi et al.,12 the monomer density is higher closer to the backbone based on the radial monomer density distribution function deducted from the form factor description of the SANS data. Therefore, the environment along the side chains could be assumed to change. This leads to more confined CH3 groups closer to the backbone and CH3 groups more equivalent to linear PDMS at the outer positions of the side chains, resulting in higher activation energies on average.
Table 4. Parameters Obtained from Fitting the Temperature Dependence of the Relaxation Times of the Methyl Groups in Figure 8 by the Arrhenius Law, Including the Molecular Weights of the Side Chains, Mnside chain, the Relaxation Time for Infinitely High Temperatures, τ∞, and the Activation Energy, EA.
| Mnside chain (g/mol) | τ∞ (s) | EA (kJ/mol) |
|---|---|---|
| 298 | (2.04 ± 0.72) × 10–13 | 6.0 ± 0.3 |
| 1800 | (1.67 ± 0.11) × 10–13 | 6.5 ± 0.1 |
| 11,500 | (3.21 ± 0.22) × 10–13 | 5.8 ± 0.1 |
Concentrating on the different side-chain lengths, slight differences occur, which could be attributed to the different grafting densities, influencing the number of different methyl groups.
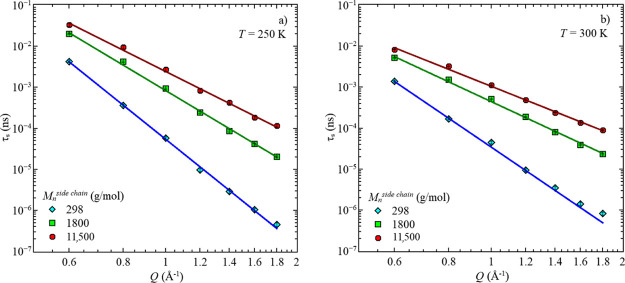
The obtained segmental relaxation times, τs, from the high temperatures, show a particular Q-dependence, which follows a power law, with the slope parameter s, as seen in Figure 9.
| 8 |
Figure 9.
Segmental relaxation time, τs, vs momentum transfer, Q, of all three samples for two temperatures, (a) T = 250 K and (b) T = 300 K. Solid lines are the power law description with eq 8.
While the relaxation becomes faster with increasing momentum transfer, increasing the side-chain length slows down the segmental relaxation times. Also, a temperature effect is visible. Increasing the temperature, by ΔT = 50 K, accelerates the relaxation by around half a decade. This behavior exists for each sample. The resulting power laws associated with each temperature and sample are summarized in Table 5.
Table 5. Parameters Obtained from the Power Law Description of the Segmental Relaxation Times, τs, as a Function of Momentum Transfer, Q, in Figure 9, Including the Number-Average Molecular Weight of the Side Chains, Mnside chain, and the Slope Parameters, s, for the Two Temperatures, T = 250 K and T = 300 K.
| Mnside chain | s (T = 250 K) | s (T = 250 K) |
|---|---|---|
| 298 | (8.52 ± 0.02) | (7.24 ± 0.09) |
| 1800 | (6.35 ± 0.13) | (4.96 ± 0.12) |
| 11,500 | (5.31 ± 0.12) | (4.24 ± 0.10) |
For both temperatures, a pronounced decrease of the slope with increasing side-chain length is observed, as indicated by the s parameter. Here, a stronger dependence is seen for the shortest side chains at both temperatures. With increasing temperatures, s reduces, thus the Q-dependence of the relaxation time on the momentum transfer is reduced.
The stretching parameter, βs, associated with the segmental dynamics increases slightly with temperature and molecular weight of the side chains, as seen in the inset of Figure 10. Here, the highest values are obtained for the bottlebrush polymer with Mnside chain = 11,500 g/mol. For linear polymers, βs = 0.4–0.6 is reported.17,34 Our values are continually below βs = 0.4 for all side-chain lengths, i.e., our relaxation time distribution is broader compared to that of linear polymers. Because with increasing Mn, the values increase, it could be assumed that the low βs values are routed in the bottlebrush architecture and may reach values known for linear polymers with sufficiently long side chains. This is in agreement with recent findings of dielectric spectroscopy.12 Here, a reduction of segmental relaxation times was found, by comparing those from linear side chains to the grafted side chains. The strongest reduction was reported for the shortest side chains and almost identical relaxation times for the longest side-chain length. This could suggest different relaxation times within the side chains of the bottlebrush polymers, i.e., a distribution of relaxation times. Furthermore, it could be interpreted in a way that the inner segments are influenced the most, and with increasing side-chain length, this effect saturates and finally, relaxation times approximate the relaxation times of a linear polymer. Thus, the distribution narrows with increasing side-chain length. This is also reflected in the stretching parameter βs. The longer the side chain length, the larger and more similar the βs values are to those of linear polymers. Therefore, the relaxation times show a narrower distribution for longer side-chain lengths.
Figure 10.
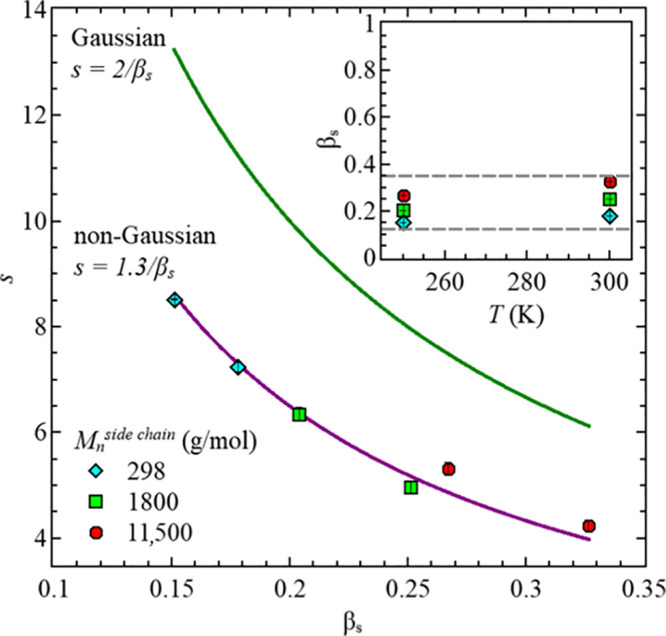
Slope parameter, s, vs stretching parameter, βs, for all three PDMS-g-PDMS bottlebrush polymers. Inset: stretching parameter, βs, vs temperature, T, for all three samples.
In general, the shape parameter, s, can be related to the stretching parameter, βs, which allows to clarify the underlying behavior of the system. For systems showing a Gaussian behavior, this relationship can be described by s = 2/βs.17,35 Using this relationship results in the solid green line in Figure 10. The fit values, βs (filled symbols), for our PDMS-g-PDMS bottlebrush polymers are different, hence not confirming Gaussian behavior. However, the relationship of s and βs can be well described with s = 1.3/βs, as shown with the solid purple line in Figure 10. Based on this, we suggest a non-Gaussian behavior for all our three samples in the available Q-range, which is equivalent to a heterogeneous system. Similar descriptions have been reported for polybutadiene, s = 1.4/βs, and for polyisoprene, s = 1.3/βs.31,36
To verify that the segmental relaxation, obtained by QENS, belongs to the α-relaxation, as determined by dielectric spectroscopy, a comparison of the relaxation times obtained from both techniques is very common.17,37,38 The relaxation times obtained by dielectric spectroscopy together with τs for every Q-value are shown in Figure 11 for all three samples. Here, the same behavior as reported by dielectric spectroscopy is seen in the data obtained by QENS. With increasing temperature, the relaxation times decreases.
Figure 11.
Segmental relaxation times, τs, vs 1000/T of the three samples with different side-chain lengths, obtained by dielectric spectroscopy and QENS. (a) Mnside chain = 298 g/mol, (b) Mn = 1800 g/mol, and (c) Mnside chain = 11,500 g/mol. Solid lines in the low-temperature region are data descriptions of the dielectric spectroscopy data by the VFT equation.
Summary and Conclusions
We have used QENS to follow the short-time dynamics on PDMS-g-PDMS bottlebrush polymers. Three different samples have been used, having different side-chain lengths, while the backbone length is similar. SANS revealed a shape transition from ellipsoidal toward an elongated shape, with decreasing side-chain length.12 In order to cover a broad time range for dynamical studies, a combination of three different neutron spectrometer instruments was used, resulting in a time range from 1 ps to 1 ns. This time window includes two processes: localized motions at low temperatures and segmental dynamics at higher temperatures. The localized motions have been identified as methyl group rotations, which are confined by their geometry and can be described by a threefold jump model considering the participating fraction of the protons in the available time window. While the relaxation time of this dynamical process is independent of the side-chain length and the momentum transfer, the segmental relaxation times show a well-pronounced dependence on both the molecular weight of the side chains and the momentum transfer. Here, the relaxation time decreases with increasing momentum transfer and decreasing side-chain length. The Q-dependence of the segmental relaxation times follows a power law, resulting in the slope parameter s. Based on this parameter, a relationship to the stretching parameter, βs, can be established, suggesting a non-Gaussian behavior for our PDMS-g-PDMS bottlebrush polymers.
Acknowledgments
We acknowledge funding by the U.S. Department of Energy (DoE) under grant DE-SC0019050. We are also grateful for the access to the neutron scattering instruments, provided by ACNS, Sydney, Australia (P7387 and P7389) and the ISIS Neutron and Muon Facility (DOI: 10.5286/ISIS.E.RB1910220).
Supporting Information Available
The Supporting Information is available free of charge at https://pubs.acs.org/doi/10.1021/acs.macromol.0c01846.
Time-dependent intermediate scattering functions for the samples with Mnside chain = 298 g/mol and Mn = 1800 g/mol; Q-dependence of the EISF for the sample with Mnside chain = 11,500 g/mol for selected temperatures; and stretching parameter,
 , as
a function of temperature, T, of the methyl group
dynamics for all three PDMS-g-PDMS bottlebrush samples
(PDF)
The authors declare no competing financial interest.
Supplementary Material
References
- Pesek S. L.; Li X.; Hammouda B.; Hong K.; Verduzco R. Small-Angle Neutron Scattering Analysis of Bottlebrush Polymers Prepared via Grafting-through Polymerization. Macromolecules 2013, 46, 6998–7005. 10.1021/ma401246b. [DOI] [Google Scholar]
- Verduzco R.; Li X.; Pesek S. L.; Stein G. E. Structure, Function, Self-Assembly, and Applications of Bottlebrush Copolymers. Chem. Soc. Rev. 2015, 44, 2405–2420. 10.1039/c4cs00329b. [DOI] [PubMed] [Google Scholar]
- Bichler K. J.; Jakobi B.; Huber S. O.; Gilbert E. P.; Schneider G. J. Structural Analysis of Ultrasoft PDMS-g-PDMS Shell-Only Particles. Macromolecules 2020, 53, 78–89. 10.1021/acs.macromol.9b01598. [DOI] [Google Scholar]
- Rathgeber S.; Pakula T.; Wilk A.; Matyjaszewski K.; Beers K. L. On the Shape of Bottle-Brush Macromolecules: Systematic Variation of Architectural Parameters. J. Chem. Phys. 2005, 122, 124904. 10.1063/1.1860531. [DOI] [PubMed] [Google Scholar]
- Dutta S.; Wade M. A.; Walsh D. J.; Guironnet D.; Rogers S. A.; Sing C. E. Dilute Solution Structure of Bottlebrush Polymers. Soft Matter 2019, 15, 2928–2941. 10.1039/c9sm00033j. [DOI] [PubMed] [Google Scholar]
- Bolisetty S.; Rosenfeldt S.; Rochette C. N.; Harnau L.; Lindner P.; Xu Y.; Müller A. H. E.; Ballauff M. Interaction of Cylindrical Polymer Brushes in Dilute and Semi-Dilute Solution. Colloid Polym. Sci. 2009, 287, 129–138. 10.1007/s00396-008-1962-3. [DOI] [PMC free article] [PubMed] [Google Scholar]
- Levi A. E.; Lequieu J.; Horne J. D.; Bates M. W.; Ren J. M.; Delaney K. T.; Fredrickson G. H.; Bates C. M. Miktoarm Stars via Grafting-through Copolymerization: Self-Assembly and the Star-to-Bottlebrush Transition. Macromolecules 2019, 52, 1794–1802. 10.1021/acs.macromol.8b02321. [DOI] [Google Scholar]
- Daniel W. F. M.; Burdyńska J.; Vatankhah-Varnoosfaderani M.; Matyjaszewski K.; Paturej J.; Rubinstein M.; Dobrynin A. V.; Sheiko S. S. Solvent-Free, Supersoft and Superelastic Bottlebrush Melts and Networks. Nat. Mater. 2016, 15, 183–189. 10.1038/nmat4508. [DOI] [PubMed] [Google Scholar]
- Pesek S. L.; Lin Y.-H.; Mah H. Z.; Kasper W.; Chen B.; Rohde B. J.; Robertson M. L.; Stein G. E.; Verduzco R. Synthesis of Bottlebrush Copolymers Based on Poly(dimethylsiloxane) for Surface Active Additives. Polymer 2016, 98, 495–504. 10.1016/j.polymer.2016.01.057. [DOI] [Google Scholar]
- McLeish T. C. B.; Milner S. T.. Entangled Dynamics and Melt Flow of Branched Polymers. Branched Polymers Ii; Springer, 1999; pp 195–256. [Google Scholar]
- López-Barrón C. R.; Brant P.; Eberle A. P. R.; Crowther D. J. Linear Rheology and Structure of Molecular Bottlebrushes with Short Side Chains. J. Rheol. 2015, 59, 865–883. 10.1122/1.4918977. [DOI] [Google Scholar]
- Jakobi B.; Bichler K. J.; Sokolova A.; Schneider G. J. Dynamics of PDMS-g-PDMS Bottlebrush Polymers by Broadband Dielectric Spectroscopy. Macromolecules 2020, 53 (19), 8450–8458. 10.1021/acs.macromol.0c01277. [DOI] [Google Scholar]
- Yu D.; Mole R.; Noakes T.; Kennedy S.; Robinson R. Pelican — a Time of Flight Cold Neutron Polarization Analysis Spectrometer at OPAL. J. Phys. Soc. Jpn. 2013, 82, SA027. 10.7566/jpsjs.82sa.sa027. [DOI] [Google Scholar]
- Demmel F.; McPhail D.; French C.; Maxwell D.; Harrison S.; Boxall J.; Rhodes N.; Mukhopadhyay S.; Silverwood I.; Sakai V. G.; Fernandez-Alonso F. Tof-Backscattering Spectroscopy at the ISIS Facility: Status and Perspectives. J. Phys.: Conf. Ser. 2018, 1021, 012027. 10.1088/1742-6596/1021/1/012027. [DOI] [Google Scholar]
- de Souza N. R.; Klapproth A.; Iles G. N. EMU: High-Resolution Backscattering Spectrometer at ANSTO. J. Neutron Res. 2016, 27, 20–21. 10.1080/10448632.2016.1163985. [DOI] [Google Scholar]
- Arnold O.; Bilheux J. C.; Borreguero J. M.; Buts A.; Campbell S. I.; Chapon L.; Doucet M.; Draper N.; Ferraz Leal R.; Gigg M. A.; Lynch V. E.; Markvardsen A.; Mikkelson D. J.; Mikkelson R. L.; Miller R.; Palmen K.; Parker P.; Passos G.; Perring T. G.; Peterson P. F.; Ren S.; Reuter M. A.; Savici A. T.; Taylor J. W.; Taylor R. J.; Tolchenov R.; Zhou W.; Zikovsky J. Mantid—Data Analysis and Visualization Package for Neutron Scattering and μ SR Experiments. Nucl. Instrum. Methods Phys. Res., Sect. A 2014, 764, 156–166. 10.1016/j.nima.2014.07.029. [DOI] [Google Scholar]
- Gerstl C.; Schneider G. J.; Fuxman A.; Zamponi M.; Frick B.; Seydel T.; Koza M.; Genix A.-C.; Allgaier J.; Richter D.; Colmenero J.; Arbe A. Quasielastic Neutron Scattering Study on the Dynamics of Poly(alkylene oxide)s. Macromolecules 2012, 45, 4394–4405. 10.1021/ma3003399. [DOI] [Google Scholar]
- Arrighi V.; Ganazzoli F.; Zhang C.; Gagliardi S. New Interpretation of Local Dynamics of Poly (dimethyl siloxane) Observed by Quasielastic Neutron Scattering. Phys. Rev. Lett. 2003, 90, 058301. 10.1103/physrevlett.90.058301. [DOI] [PubMed] [Google Scholar]
- Arrighi V.; Gagliardi S.; Zhang C.; Ganazzoli F.; Higgins J. S.; Ocone R.; Telling M. T. F. A Unified Picture of the Local Dynamics of Poly(dimethylsiloxane) across the Melting Point. Macromolecules 2003, 36, 8738–8748. 10.1021/ma034843x. [DOI] [Google Scholar]
- Arrighi V.; Higgins J. S.; Burgess A. N.; Howells W. S. Rotation of Methyl Side Groups in Polymers: A Fourier Transform Approach to Quasielastic Neutron Scattering. 1. Homopolymers. Macromolecules 1995, 28, 2745–2753. 10.1021/ma00112a021. [DOI] [Google Scholar]
- Zorn R.; Frick B.; Fetters L. J. Quasielastic Neutron Scattering Study of the Methyl Group Dynamics in Polyisoprene. J. Chem. Phys. 2002, 116, 845–853. 10.1063/1.1424319. [DOI] [Google Scholar]
- Arrighi V.; Higgins J. S. Side Group Rotations in Amorphous Polymers. Phys. B 1996, 226, 1–9. 10.1016/0921-4526(96)00240-2. [DOI] [Google Scholar]
- Gerstl C.Kettenkonformation und Dynamik verschiedener Poly(alkylenoxid)e; Westfälische Wilhlems-Universität Münster, 2011. [Google Scholar]
- Colmenero J.; Arbe A. A.; Alegría A.; Ngai K. L. Q-Dependence of the Relaxation Times of the α-Relaxation as Observed by Quasielastic Neutron Scattering. J. Non-Cryst. Solids 1994, 172–174, 229–233. 10.1016/0022-3093(94)90440-5. [DOI] [Google Scholar]
- Colmenero J. Segmental Dynamics in Polymer Melts by Relaxation Techniques and Quasielastic Neutron Scattering. Phys. Scr. 1993, T49A, 227–232. 10.1088/0031-8949/1993/t49a/038. [DOI] [Google Scholar]
- Zhang C.; Arrighi V.; Gagliardi S.; McEwen I. J.; Tanchawanich J.; Telling M. T. F.; Zanotti J.-M. Quasielastic Neutron Scattering Measurements of Fast Process and Methyl Group Dynamics in Glassy Poly(vinyl acetate). Chem. Phys. 2006, 328, 53–63. 10.1016/j.chemphys.2006.06.026. [DOI] [Google Scholar]
- Jalarvo N.; Tyagi M.; Crawford M. K.. Quasielastic Neutron Scattering Study of Poss Ligand Dynamics, EPJ Web of Conferences; EDP Sciences, 2015; p 02007.
- Zorn R.; Arbe A.; Colmenero J.; Frick B.; Richter D.; Buchenau U. Neutron Scattering Study of the Picosecond Dynamics of Polybutadiene and Polyisoprene. Phys. Rev. E: Stat. Phys., Plasmas, Fluids, Relat. Interdiscip. Top. 1995, 52, 781–795. 10.1103/physreve.52.781. [DOI] [PubMed] [Google Scholar]
- Amaral L. Q.; Vinhas L. A.; Herdade S. B.. Neutron Transmission Study of the Rotacional Freedom of Methyl Groups in Polydimethylsiloxane; Brazil, 1973; p 19. [Google Scholar]
- Arrighi V.; Higgins J. S.; Burgess A. N.; Howells W. S. Rotation of Methyl Side Groups in Polymers: A Fourier Transform Approach to Quasielastic Neutron Scattering. 2. Polymer Blends. Macromolecules 1995, 28, 4622–4630. 10.1021/ma00117a037. [DOI] [Google Scholar]
- Zorn R.; Arbe A.; Colmenero J.; Frick B.; Richter D.; Buchenau U. Neutron Scattering Study of the Picosecond Dynamics of Polybutadiene and Polyisoprene. Phys. Rev. E: Stat. Phys., Plasmas, Fluids, Relat. Interdiscip. Top. 1995, 52, 781. 10.1103/physreve.52.781. [DOI] [PubMed] [Google Scholar]
- Grapengeter H.-H.; Alefeld B.; Kosfeld R. An Investigation of Micro-Brownian Motions in Polydimethylsiloxane by Complementary Incoherent-Neutron-Scattering and Nuclear-Magnetic-Resonance Experiments Below Room Temperature. Colloid Polym. Sci. 1987, 265, 226–233. 10.1007/bf01412711. [DOI] [Google Scholar]
- Frick B.; Fetters L. J. Methyl Group Dynamics in Glassy Polyisoprene: A Neutron Backscattering Investigation. Macromolecules 1994, 27, 974–980. 10.1021/ma00082a014. [DOI] [Google Scholar]
- Richter D.; Monkenbusch M.; Arbe A.; Colmenero J.. Neutron Spin Echo in Polymer Systems; Springer-Verlag Berlin Heidelberg: Berlin, Heidelberg, 2005; p IX-246. [Google Scholar]
- Tyagi M.; Alegría A.; Colmenero J. Heterogeneous Dynamics of Poly(vinyl acetate) far above Tg: A Combined Study by Dielectric Spectroscopy and Quasielastic Neutron Scattering. J. Chem. Phys. 2005, 122, 244909. 10.1063/1.1931664. [DOI] [PubMed] [Google Scholar]
- Zorn R. Deviation from Gaussian Behavior in the Self-Correlation Function of the Proton Motion in Polybutadiene. Phys. Rev. B: Condens. Matter Mater. Phys. 1997, 55, 6249. 10.1103/physrevb.55.6249. [DOI] [Google Scholar]
- Schönhals A.; Kremer F. Amorphous Polymers. Polym. Sci.: Compr. Ref. 2012, 1, 201–226. 10.1016/b978-0-444-53349-4.00010-8. [DOI] [Google Scholar]
- Gambino T.; Alegría A.; Arbe A.; Colmenero J.; Malicki N.; Dronet S.; Schnell B.; Lohstroh W.; Nemkovski K. Applying Polymer Blend Dynamics Concepts to a Simplified Industrial System. A Combined Effort by Dielectric Spectroscopy and Neutron Scattering. Macromolecules 2018, 51, 6692–6706. 10.1021/acs.macromol.8b00881. [DOI] [Google Scholar]
Associated Data
This section collects any data citations, data availability statements, or supplementary materials included in this article.


