

Abstract
Females and males carry nearly identical genomes, which can constrain the evolution of sexual dimorphism and generate conditions that are favourable for maintaining sexually antagonistic (SA) polymorphisms, in which alleles beneficial for one sex are deleterious for the other. An influential theoretical prediction, by Rice (Rice 1984 Evolution 38, 735–742), is that the X chromosome should be a ‘hot spot’ (i.e. enriched) for SA polymorphisms. While important caveats to Rice's theoretical prediction have since been highlighted (e.g. by Fry (2010) Evolution 64, 1510–1516), several empirical studies appear to support it. Here, we show that current tests of Rice's theory—most of which are based on quantitative genetic measures of fitness (co)variance—are frequently biased towards detecting X-linked effects. We show that X-linked genes tend to contribute disproportionately to quantitative genetic patterns of SA fitness variation whether or not the X is enriched for SA polymorphisms. Population genomic approaches for detecting SA loci, including genome-wide association study of fitness and analyses of intersexual FST, are similarly biased towards detecting X-linked effects. In the light of our models, we critically re-evaluate empirical evidence for Rice's theory and discuss prospects for empirically testing it.
Keywords: sex chromosomes, sexual antagonism, theoretical models, intersexual Fst, fitness covariance, sex-specific selection
1. Introduction
Females and males often experience divergent selection on traits they both express, with ‘sexually antagonistic’ (SA) selection favouring the evolution of sexual dimorphism [1]. However, the sexes are also part of the same population, they inherit nearly identical genomes and genetic variation similarly affects trait expression variation within each sex, resulting in strong genetic constraints to the evolution of sexual dimorphism [2–5]. At the population genetic level, SA selection on traits with strong cross-sex genetic correlations can give rise to balancing selection that maintains SA genetic polymorphisms, wherein the alleles that increase the relative fitness of one sex reduce the relative fitness of the other [6]. Such polymorphisms may contribute disproportionately to standing genetic variation for fitness and account for the surprisingly high levels of genetic variation observed in many life-history traits that are correlated with fitness [7–9].
Evidence for SA genetic variation for fitness and fitness components has been documented in a range of animal and plant species [10], including studies reporting SA directions of selection on quantitative traits with positive cross-sex genetic correlations [11,12], sex-limited experimental evolution studies in which fitness gains to the selected sex are offset by fitness declines within the non-selected sex [13,14], and studies reporting a negative intersexual genetic correlation for fitness, which is an unambiguous signal of SA variation [15–18]. Despite this evidence, little is known about the population genetic basis of SA fitness variation (reviewed in: [19–21]; but see [22]). For example, it remains unclear how many genes are polymorphic for SA alleles, how such genes are distributed within and among chromosomes, and how processes of selection, recurrent mutation, and genetic drift affect the maintenance of SA variation [19,23–30].
Given the logistical difficulty of directly characterizing the fitness effects of most genetic variants (e.g. [31]), efforts to test hypotheses about the population genetic basis of fitness variation (including SA variation) rely upon close engagement between quantitative genetic data—on which most evidence for fitness variation is based—and population genetic models of fitness variation. Such models show that conditions for maintaining SA alleles via balancing selection can differ markedly between the X chromosome and autosomes ([27,28,30,32]; figure 1a). Rice [27] emphasized that conditions for balanced SA polymorphisms are broader on the X relative to autosomes when the dominance relations between SA alleles at a locus are identical between the sexes (i.e. there is ‘parallel dominance’ between sexes), and male-beneficial alleles are partially or completely recessive to female-beneficial alleles [28,32,33]. Several other studies have identified conditions where SA polymorphisms are easier to maintain on autosomes, including when (i) SA alleles have additive fitness effects [30], (ii) male-beneficial alleles are partially dominant to female-beneficial alleles [28], and (iii) SA alleles exhibit ‘beneficial reversals of dominance’ with male-beneficial alleles (partially) dominant in males and female-beneficial alleles dominant in females [32]. The dominance properties of SA alleles are largely unknown [33,34], precluding firm theoretical predictions about the permissibility of balanced SA polymorphism on the X relative to autosomes. Consequently, a wide range of empirical work has sought to test for the enrichment of SA polymorphism on the X chromosome and thereby obtain insights into the fitness effects of SA alleles and the evolutionary mechanisms by which they are maintained.
Figure 1.

Conditions for maintaining a balanced SA polymorphism on the X chromosome and autosomes. (a) Parameter combinations of sex-specific selection and dominance leading to balancing selection at X-linked and autosomal SA loci. Each locus has two alleles: a female-beneficial allele (A1) and a male-beneficial allele (A2), with sf and sm representing female and male selection coefficients, and hf and hm represent the sex-specific dominance coefficients of SA alleles (table 1). The region between each matching pair of curves defines combinations of sf and sm that generate balancing selection of SA polymorphisms. Conditions for balanced SA polymorphisms are broader on the X compared with the autosomes when SA alleles exhibit ‘parallel dominance’ with male-beneficial alleles partially recessive in females (e.g. hf = 1 – hm = 0.2). Otherwise, conditions for maintaining SA polymorphism are typically broader on autosomes. (b and c) Parameter conditions for balancing selection of SA alleles, and their equilibrium frequencies, for cases where balancing selection is equally permissive on the X and autosomes (i.e. equation (2.3) is true). Theoretical curves are based on equations (2.1) and (2.2). (Online version in colour.)
Four general approaches have been used to test whether the X chromosome harbours proportionally more SA polymorphisms than autosomes (electronic supplementary material, table S1). First, Gibson et al. [35] used a set of chromosome extraction lines (‘hemi-clone’ lines; see [22,36]) to estimate the cross-sex additive genetic covariance for fitness in a laboratory-adapted Drosophila melanogaster population and partitioned the total fitness covariance into X-linked and autosomal components. They reported a negative cross-sex genetic covariance for fitness—indicating an abundance of SA fitness variation [18]—and estimated that the X accounted for nearly all of the negative fitness covariance between the sexes [35]. Second, Ruzicka et al. [22] carried out a genome-wide association study (GWAS) of sex-specific fitness in the same population and estimated that the X accounted for 39% of the genome-wide, SNP-based estimate of SA fitness variation (i.e. approximately double the proportion of the D. melanogaster genome that is X-linked). Third, several studies have estimated the heritability of fitness between fathers and offspring of each sex [16,37–43]; among studies reporting a negative covariance between the fitness (or fitness components) of fathers and their daughters, some report no significant heritability of fitness between fathers and sons [37–40,43], which is consistent with X-linked inheritance of SA polymorphisms (i.e. because the X is transmitted from fathers to daughters but not from fathers to sons). Finally, Lucotte et al. [44] showed that estimates of allele frequency differences between adult human females and males (i.e. ‘intersexual FST’ estimates) are elevated on the X compared with autosomes, which may imply an enrichment of SA polymorphisms on the human X due to sex differences in viability selection [45,46].
All four empirical approaches appear to provide at least some support for the prediction that X chromosomes are enriched for SA polymorphisms (see electronic supplementary material, table S1). However, an important, yet tacit, assumption of each approach is that empirical signals of SA polymorphism are equally detectable on sex chromosomes and autosomes. We critically examine this assumption and find that it does not hold. By modelling the relative contributions of autosomal and X-linked polymorphisms to patterns of sex-specific fitness (co)variance and genomic patterns of intersexual FST, we show that empirical proxies of SA fitness variation are consistently biased towards detecting X-linked effects. Indeed, each empirical approach outlined above is expected to detect disproportionately large X-linked effects even when SA polymorphisms are equally abundant on the X and autosomes. In the light of these results, we revisit previous empirical tests of Rice's theory and find that most studies are consistent with scenarios in which the X chromosome is not a hot spot for SA polymorphisms.
2. Models and results
We begin by briefly reviewing conditions of sex-specific selection and dominance that can maintain SA polymorphisms on the X and the autosomes. From this theory, we identify a critical state of dominance that equalizes opportunities for balanced SA polymorphism on each chromosome and delineates conditions for the enrichment of SA polymorphism on the X versus conditions for enrichment on autosomes. We then use this dominance state to develop explicit theoretical predictions for the relative contributions of X-linked and autosomal genes to empirical signals of SA variation in the idealized case where the X and autosomes are equally permissive genomic locations for maintaining polymorphic SA alleles. By clarifying empirical signals of SA polymorphism for cases where the X is not enriched (i.e. where there is no difference between X and autosomes in the proportion of loci that are polymorphic for SA alleles), our models provide theoretical benchmarks for evaluating whether SA genetic variation is non-randomly distributed across the genome.
(a). Conditions for maintaining sexually antagonistic polymorphism at X-linked and autosomal genes
We first consider the evolution of bi-allelic loci with SA fitness effects. Let A1 represent the female-beneficial allele and A2 represent the male-beneficial allele at an SA locus (table 1). Following previous theory [26–28,30,32], the parameter criteria for maintaining SA polymorphism at X-linked and autosomal loci, respectively, are:
| 2.1 |
and
| 2.2 |
where sf, sm, hf, and hm are the selection and dominance coefficients for the SA locus (table 1; electronic supplementary material, appendix A). We note that inbreeding, population structure, and overlapping generations can somewhat modify these criteria for balancing selection, though we do not consider such effects here (see [47–49]).
Table 1.
Sex-specific fitness for each genotype at the ith autosomal or X-linked locusa,b.
| genotype |
|||
|---|---|---|---|
| A1,i A1,i, A1,i | A1,i A2,i | A2,i A2,i, A2,i | |
| female fitness (X or autosome) | W11,i | W12,i | W22,i |
| male fitness (autosome) | V11,i | V12,i | V22,i |
| male fitness (X) | V1,i | — | V2,i |
aSA selection: W11,i = 1, W12,i = 1 – sf,ihf,i, W22,i = 1 – sf,i, V1,i = V11,i = 1 – sm,i, V12,i = 1 – sm,i hm,i, V2,i = V22,i = 1 – sm,i, where 0 < sf,i, sm,i, hf,i, hm,i < 1.
bSC selection: W11,i = V11,i = V1,i = 1, W12,i = 1 – tf,i hd,i, V12,i = 1 – tm,i hd,i, W22,i = 1 – tf,i, and V22,i = V2,i = 1 – tm,i, where 0 < tf,i, tm,i, hd,i < 1.
Criteria for maintaining SA polymorphisms are identical for X-linked and autosomal loci (i.e. condition (2) simplifies to (1)) under the following state of male dominance:
| 2.3 |
which, to our knowledge, has not previously been reported in the theoretical literature. Parameter criteria for balanced SA polymorphism are broader on the X than autosomes when hm > 1/(2 – sm) and are otherwise broader on autosomes. Equation (2.3) implies that opportunities for balanced SA polymorphism will be approximately equal between the X and autosomes when SA alleles have small and nearly additive fitness effects in males (sm ≪ 1 so that (2 – sm)−1 ≈ 1/2), consistent with the common argument that small-effect mutations should tend towards additivity in their fitness effects (see [50,51]).
Following Patten and Haig [28], the equilibrium frequency of a female-beneficial allele at a polymorphic X-linked SA locus is:
| 2.4a |
in eggs or ovules contributing to each generation, and
| 2.4b |
in sperm or pollen, with an overall allele frequency of (assuming an equal sex ratio at birth). Numerical evaluation of exact recursion equations for autosomal loci shows that autosomal and X-linked equilibrium frequencies for SA alleles are approximately the same when criteria for balanced polymorphism are equal between chromosomes (see equation (2.3); figure 1). These theoretical predictions are robust to effects of genetic drift as long as balancing selection is strong relative to genetic drift (see electronic supplementary material, appendix B).
(b). Contributions of single X-linked and autosomal genes to cross-sex fitness covariances
Some of the most compelling empirical examples of SA genetic variation are derived from quantitative genetic estimates of the cross-sex additive genetic covariance for fitness based on either hemi-clone experiments (i.e. sex-specific fitness estimates of randomly sampled haploid genotypes tested in outbred individuals [15,22,35,36]) or breeding experiments that estimate the fitness covariance between fathers and their daughters [16,37–43]. For both experimental designs (see electronic supplementary material, appendices C and D), the contribution of an arbitrary ith autosomal locus to the cross-sex genetic covariance for fitness is:
| 2.5 |
where pi and qi refer to A1,i and A2,i allele frequencies of the locus and fitness parameters as defined in table 1. The contribution of the ith X-linked locus to the cross-sex covariance is:
| 2.6 |
with the ratio of equation (2.6) to equation (2.5) quantifying the relative contributions of an X-linked versus an autosomal locus to the cross-sex genetic covariance for fitness (see electronic supplementary material, appendix E and F for covariance expressions that are functions of selection and dominance coefficients).
Given equivalent allele frequencies and sex-specific fitness parameters between the autosomes and X, the relative contributions of an X-linked versus an autosomal locus to the fitness covariance are given by:
| 2.7 |
where pi is the frequency of the female-beneficial allele, and sf,i, sm,i, hf,i, and hm,i are the selection and dominance parameters (table 1; electronic supplementary material, appendix E). Equation (2.7) implies that polymorphic X-linked SA loci contribute disproportionately to the cross-sex fitness covariance, which is a consequence of the elevated contributions of hemizygous (haploid) loci relative diploid loci to variation in fitness. The magnitude of the difference between X-linked and autosomal loci is a function of the frequencies and dominance coefficients of SA alleles (figure 2a). For loci segregating for intermediate-frequency SA alleles (pi = 0.5), X-linked loci contribute twice as much as autosomal loci to fitness covariances, with greater discrepancies between chromosomes arising when the female-beneficial allele is rare and recessive in males (pi, hm,i < 0.5), or common and dominant in males (pi, hm,i > 0.5). When conditions for balanced SA polymorphism are equally permissive on the X and autosomes (i.e. equation (2.3) is true), then cov(wf,i, wm,i|X)/cov(wf,i, wm,i|A) = 2 + O(sm,i) at polymorphic equilibrium, and an X-linked SA locus will contribute roughly twofold more than an equivalent autosomal SA locus to the cross-sex covariance.
Figure 2.

The relative contributions of an X-linked locus versus an equivalent autosomal locus to the cross-sex genetic covariance for fitness. Curves in (a) are based on equation (2.7), with p representing the frequency of the female-beneficial allele (A1) and hm representing the degree of dominance of the female-beneficial allele in males (0 < hm < 0.5 corresponds to partial recessivity of A1 in males; 0.5 < hm < 1 corresponds to partial dominance of A1). Curves in (b) are based on equation (2.8), with tf and tm representing female and male selection coefficients for the deleterious allele at each locus, and um and uf representing the male and female mutation rates. (Online version in colour.)
Sexually concordant (SC) loci are subject to directional selection and evolve to mutation-selection balance. Assuming deleterious alleles are not completely recessive, then the relative contribution of an X-linked SC locus to the cross-sex fitness covariance is given by:
| 2.8 |
(electronic supplementary material, appendix F), where um,i and uf,i are the male and female mutation rates, hd,i is the dominance coefficient, and tm,i and tf,i are the male and female selection coefficients for the ith locus (table 1). With additive effects of deleterious alleles and no sex-bias in the mutation rate (hd,i = ½, um,i = uf,i), an X-linked locus at mutation-selection balance has a 1.5-fold greater contribution to the cross-sex genetic covariance than an equivalent autosomal locus (figure 2b). Stronger purifying selection and/or higher mutation rates in males (um,i > uf,i and/or tm,i > tf,i, which may both be common in animals: [52–55]; but see [56]) decrease the relative contribution of X-linked SC loci to the cross-sex covariance. Partial recessivity of deleterious alleles (hd,i < ½), female-biased purifying selection (tm,i < tf,i), and female-biased mutation rates (um,i < uf,i) increase the contribution of X-linked SC loci to the cross-sex covariance.
(c). Multilocus cross-sex genetic covariances under the hemi-clone design
We are now in a position to consider the X chromosome's contribution to the multilocus cross-sex genetic covariance for fitness, as obtained in hemi-clone experiments [35] and given SA and SC polymorphism. For simplicity, we will consider the idealized case where neither X nor autosomes are enriched for SA alleles (i.e. equation (2.3) applies) and assume that selection coefficients are small (0 < sf,i, sm,i, tf,i, tm,i ≪ 1), SA and SC loci segregate independently at equilibrium, and there is no epistasis between loci. Let IX and IA represent the set of polymorphic SA loci on the X and autosomes, respectively, and LX and LA represent the set of SC loci at mutation-selection balance on the X and autosomes. The total contribution of the X chromosome and the autosomes (respectively) to the cross-sex fitness covariance will be:
| 2.9 |
and
| 2.10 |
where βi = tm,i/tf,i and αi = um,i/uf,i (electronic supplementary material, appendix G). Provided cov(wf, wm|A) and cov(wf, wm|X) have the same sign, then the contribution of the X chromosome to the cross-sex genetic covariance for fitness will be:
| 2.11 |
Assuming that SA variation is sufficiently common for the cross-sex genetic covariance to be negative (i.e. cov(wf, wm|A), cov(wf, wm|X) < 0) and there are no systematic differences between the X and autosomes in the fitness effect distributions of SA and SC alleles, equation (2.11) simplifies substantially. For example, when fitness variation is overwhelmingly SA, the contribution of the X to a negative cross-sex fitness covariance is:
| 2.12 |
where PX is the proportion of the genome that is X-linked (electronic supplementary material, appendix G). Equation (2.12) shows that the X will contribute disproportionately to the cross-sex genetic covariance for fitness (fX > PX; figure 3b) even though it is not enriched for SA polymorphism. When a small proportion of the genome is X-linked, the contribution of the X to the cross-sex fitness covariance is approximately twofold greater than its relative size (fX ∼ 2PX when PX ≪ 1).
Figure 3.

Contribution of the X chromosome to a negative multilocus cross-sex genetic covariance for fitness, given varying amounts of SC and SA genetic variation. Results assume that, at equilibrium, polymorphic SA loci are uniformly distributed across the X and autosomes (i.e. equation (2.3) is true). (a) How sex-biased mutation (α = um/uf), sex-biased purifying selection (β = tm/tf), and dominance of deleterious mutations (hd) affect the contributions of the X and autosomes to the cross-sex fitness covariance. At the dominance state (see equation (2.13)), the contribution of the X chromosome to a negative cross-sex covariance is fX = 2PX/(1 + PX), where PX is the proportion of the genome that is X-linked. When , the contribution of the X is further inflated (fX > 2PX/(1 + PX) above the black lines); when , the contribution of the X is reduced (fX < 2PX/(1 + PX) below the black lines). The red data point shows point estimates of β and hd (with 95% confidence intervals) from a mutation-accumulation experiment in the Drosophila melanogaster Ives population [53]. (b) How SC fitness variation (VSC) can inflate fX. Examples are shown for the case where the X and autosomes contribute to an overall negative cross-sex genetic covariance for fitness, which occurs when fSA/(1 − fSA)E[cov(wf,i, wm,i|SA, A)]/E[tm,iuf,i] > max{hd(1 + α)/(1 + β), hd(2 + α)/(2hd + β)} (see electronic supplementary material, appendix G). The solid black curve shows the case where all fitness variation is SA: fX = 2PX/(1 + PX). The dashed curves show the effects of SA and SC variation on fX, with orange and red curves using the point estimates, and the grey curve using the lower 95% CI intervals, for hd and β from [53]. Other parameters include: α = 1; fSA/(1 − fSA)E[cov(wf,i, wm,i|SA, A)]/E[tm,iuf,i] = 1.025hd(1 + α)/(1 + β) for the orange curve; and fSA/(1 − fSA)E[cov(wf,i, wm,i|SA, A)]/E[tm,iuf,i] = 1.00125max{hd(1 + α)/(1 + β), hd(2 + α)/(2hd + β)} for the red and grey curves. Empirical point estimates of fX from the LHM population are shown as a square (Gibson et al. [35]) and a triangle (Ruzicka et al. [22]).
SC variation can either dampen the negative cross-sex genetic covariance for fitness or cause it to become positive, with the effects of SC variation on the relative contribution of the X to the cross-sex covariance depending on hd,i, αi, and βi. Letting hd,i, αi, and βi remain constant across SC loci, the conditions leading to a negative cross-sex genetic covariance for fitness will be more permissive for the X chromosome than the autosomes when dominance coefficients of deleterious mutations (hd) exceed the threshold:
| 2.13 |
(electronic supplementary material, appendix G), whereas the condition for a negative fitness covariance is more permissive for autosomes when (electronic supplementary material, appendix G).
Given a mixture of SA and SC genetic variation, and assuming that both chromosome types contribute to a negative cross-sex fitness covariance (i.e. cov(wf, wm|A), cov(wf, wm|X) < 0), SC variation will further inflate the X-linked contribution to the cross-sex fitness covariance when (i.e. fX > 2PX/(1 + PX), as in the yellow-shaded region in figure 3a and red and orange curves in figure 3b). SC variation dampens the relative contribution of the X to the cross-sex covariance when (i.e. fX < 2PX/(1 + PX), as in the grey-shaded region and the grey curve in figure 3a,b). Parametrization of our model with empirical point estimates of hd and β from D. melanogaster mutation-accumulation data suggests that SC genetic variation will inflate the contribution of the X to a negative cross-sex genetic covariance for fitness (figure 3).
(d). Multilocus fitness covariances between fathers and offspring
Experiments estimating genetic covariances for fitness between fathers and their same- and opposite-sex offspring can potentially provide information about the genomic locations of SA polymorphisms [16,37–43]. To develop baseline predictions for such experiments, we assume that the X and autosomes are equally permissive for maintaining SA polymorphism (i.e. equation (2.3) applies), with further assumptions about SA and SC loci as outlined previously (see ‘Multilocus cross-sex genetic covariances under the hemi-clone design’). Under these assumptions, the overall genetic covariance for fitness between fathers and their daughters is , where X-linked and autosomal covariances are given in equations (2.9) and (2.10). The total covariance between fathers and sons will be:
| 2.14 |
where for SA loci (electronic supplementary material, appendices E and G).
When fitness variation is predominantly SA, the ratio of the magnitudes of father-to-son versus father-to-daughter fitness covariances will be:
| 2.15 |
(see electronic supplementary material, appendix G). Equation (2.15) illustrates that two factors reduce the magnitude of fitness covariance between fathers and sons relative to the covariance between fathers and daughters (figure 4; solid black curve). First, X-linked inheritance decreases the number of genes that fathers transmit to their sons relative to their daughters. Ignoring Y-linked genes, the number of paternally inherited genes in sons is reduced by a factor of 1 – PX compared with daughters, as captured by the first term of the final expression for equation (2.15) (i.e. the dotted black line in figure 4). Second, polymorphic X-linked genes contribute disproportionately to the fitness covariance to daughters compared with autosomal genes (figure 2a), which further reduces the relative magnitude of covariance between fathers and sons (see the second term of the final expression for equation (2.15)). Overall, the positive covariance between fathers and sons can be substantially lower than the negative covariance between fathers and daughters, even when SA polymorphism is not enriched on the X or autosomes.
Figure 4.
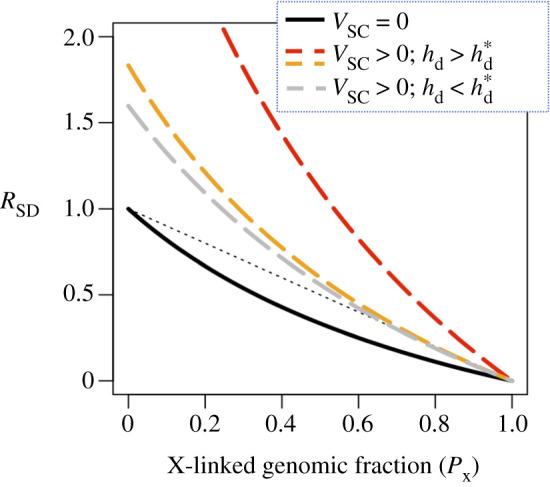
Effects of X-linked inheritance of SA genetic polymorphism on the ratio of the magnitudes of the multilocus fitness covariances between fathers and sons versus fathers and daughters (RSD). Examples are shown for the case where the X and autosomes contribute to an overall negative cross-sex genetic covariance for fitness, which occurs when fSA/(1 − fSA)E[cov(wf,i, wm,i|SA, A)]/E[tm,iuf,i] > max{hd(1 + α)/(1 + β), hd(2 + α)/(2hd + β)} (see electronic supplementary material, appendix G). The solid black curve applies under the idealized case where SA polymorphism is equally abundant on the X and autosomes (i.e. equation (2.3)), and all fitness variation is SA (see equation (2.15)). The dashed curves show RSD in the presence of SC fitness variance (VSC > 0) maintained at mutation-selection balance, with orange and red curves using the point estimates, and the grey curve using the lower 95% CI intervals, for hd and β from [53]. Other parameters include α = 1; fSA/(1 − fSA)E[cov(wf,i, wm,i|SA, A)]/E[tm,iuf,i] = 2hd(1 + α)/(1 + β) for the orange curve; and fSA/(1 − fSA)E[cov(wf,i, wm,i|SA, A)]/E[tm,iuf,i] = 4max{hd (1 + α)/(1 + β), hd(2 + α)/(2hd + β)} for the red and grey curves. The broken black line shows the proportion of the genome that is autosomal (i.e. 1 – PX), which sons inherit from their fathers.
These predictions are strongly affected by SC fitness variation, which increases the covariance between fathers and sons, and dampens (or overturns) the negative covariance between fathers and daughters (figure 4; electronic supplementary material, appendix G). This effect of SC variation can be dramatic, particularly when SC fitness variance is high and fitness effects of deleterious alleles are male-biased (figure 4).
(e). Allele frequency differences between sexes (FST)
Sex differences in selection generate allele frequency differences between the female and male gametes that give rise to offspring of the next generation, with fertilized eggs or ovules enriched for female-beneficial alleles, and fertilizing sperm or pollen enriched for male-beneficial alleles [57]. Allele frequencies are often estimated from samples of the adults of a population, and estimates of between-sex FST may indirectly reflect sex differences in viability selection (reviewed in [45,46]).
In line with several recent population genomics studies [44,58–61], we quantify allele frequency differences between adults of each sex using Wright's FST statistic. For the ith bi-allelic locus with focal allele frequency of pf,i and pm,i in adult females and males of the population (respectively), between-sex FST is:
| 2.16 |
where . In practice, FST,i is calculated using allele frequency estimates from samples of adults, in which case, estimated allele frequency differences between sexes reflect actual allele frequency differences in the population as well as statistical noise associated with allele frequency estimation (see [46]). Accounting for both effects, the expected FST,i estimates for an autosomal and X-linked locus (respectively) are:
| 2.17 |
and
| 2.18 |
where nf and nm are the sample sizes of females and males that are sequenced for each locus, and refers to the estimate of FST,i (for full distributions, see electronic supplementary material, appendix H).
Each of the two terms within equations (2.17) and (2.18) is likely to be inflated for X-linked relative to autosomal loci, regardless of whether or not the X is enriched for SA polymorphism. The first term of each, which captures the average effect of sampling noise on the FST,i estimate, is smaller for autosomal loci as a result of male X-linked hemizygosity (i.e. the sample size of gene sequences is nA = 2nf + 2nm for autosomal loci and nX = 2nf + nm for X-linked loci). With similar sample sizes of females and males, sampling noise is roughly 50% higher on the X, though this effect can be controlled through subsampling of the data to equalize the numbers of female- and male-derived sequences on each chromosome [44].
The second terms of equations (2.17) and (2.18), which reflect genuine allele frequency differences between sexes, are also typically greater for X-linked compared with autosomal loci, even in cases where SA polymorphisms are equally abundant on each chromosome. Because autosomes are bi-parentally inherited, allele frequency differences between reproductively successful females and males from the previous generation are eliminated at fertilization; the initial equality of autosomal allele frequencies between sexes at the start of each generation should persist in adults of the population unless the locus differentially affects the viability of each sex. By contrast, X-linked allele frequency differences between reproductively successful females and males from the previous generation—due to recent admixture, meiotic drive, sex-biased migration, and most forms of selection [62–65]—carry over to the next generation, thereby inflating X-linked FST estimates at birth and potentially throughout the life cycle. With respect to polymorphic SA loci, those affecting viability leave similar empirical signals at X-linked and autosomal loci, while those affecting adult fitness components (e.g. mating success and fecundity) exhibit stronger X-linked than autosomal allele frequency differentiation between sexes (see electronic supplementary material, appendix H), even when SA polymorphisms are uniformly distributed across the X and autosomes.
3. Discussion
Rice's hypothesis that the X chromosome is enriched for SA polymorphism (i.e. that a higher proportion of X-linked compared with autosomal loci will be polymorphic for SA alleles [27,28,32,35]) is attractive, in part, because of its broader evolutionary implications. Such an enrichment hints at answers to long-standing questions in our field, such as balancing selection's role in maintaining genetic variation [31], the causes of genetic dominance [32,66,67], the potential for indirect genetic benefits of mate choice (i.e. ‘good genes’ [68]), and the evolutionary dynamics of sex chromosomes and sex determination systems [69–71]. Whether the X or autosomes are, in fact, enriched for SA polymorphisms requires an empirical resolution, as either possibility is theoretically plausible (figure 1; [32]). Yet testing this hypothesis is challenging due to the mismatch between theoretical predictions about SA polymorphisms, which are based on population genetic models that focus on parameter conditions for balancing selection (i.e. the ‘parameter space’ of sf, sm, hf, and hm that maintains polymorphism), and common empirical metrics of SA variation, which instead focus on quantitative genetic measures of sex-specific fitness (co)variance or indirect genomic proxies for SA polymorphism.
To bridge the gap between theoretical predictions and empirical metrics of SA variation, we have merged and extended three independent strands of prior theory: (i) population genetic models of SA polymorphism [27,28,30,32], (ii) quantitative genetic models of sex-specific fitness (co)variance [72–74], and (iii) models of between-sex FST estimates [46]. To set clear empirical benchmarks for testing Rice's hypothesis, we have derived predictions for what empiricists might expect to observe in cases where the X and autosomes are equally permissive locations for SA polymorphism. These benchmarks overturn the common assumption that signals of SA polymorphism should be equally detectable at individual X-linked and autosomal loci, and suggest that strong empirical signals of SA fitness variation on the X chromosome are compatible with population genetic scenarios in which SA polymorphisms are not enriched on the X chromosome. Our results, therefore, highlight an important difference in perspective between population genetic predictions about polymorphism—the primary focus of theoretical studies of SA variation on sex chromosomes and autosomes—and measures of phenotypic and allele frequency differences among individuals of a population (e.g. variances of quantitative traits, including fitness, and FST-based metrics), which predominate in empirical studies of SA variation and are disproportionately affected by X-linked polymorphism. In the light of our models, we revisit current evidence for Rice's hypothesis and highlight opportunities for future tests of it.
(a). Re-evaluating the evidence for Rice's hypothesis
The most direct approach for testing Rice's prediction is to partition the cross-sex genetic covariance for SA fitness variation into X-linked and autosomal components (e.g. using D. melanogaster hemi-clones: [22,35]). In D. melanogaster, the X chromosome comprises roughly 20% of the genome (PX = 0.2). Our models predict that the fractional contribution of the X to the cross-sex genetic covariance for fitness should be fX = 1/3 when most of the genetic variation for fitness is SA and SA polymorphisms are equally abundant on the X and autosomes (equation (2.12)). From a sample of 20 hemi-clones from the laboratory-adapted LHM population, Gibson et al. [35] reported an estimate of fX = 0.97 for the net cross-sex genetic covariance for fitness, which was not statistically different from 1/3 and, therefore, consistent with the hypothesis of no X-linked enrichment of SA polymorphisms. To the extent that SC genetic variation also contributed to the cross-sex fitness covariance among hemi-clone lines, and given fitness parameter estimates of deleterious mutations from the same species (figure 3; [53]), our models predict yet further inflation of the X-linked contribution to the negative cross-sex fitness covariance.
A GWAS of sex-specific fitness variation, based on a sample of 202 hemi-clone lines from the LHM population [22], estimated that the X accounted for 39% of the cross-sex covariance due to SA SNPs (fX = 0.39, which did not significantly differ from PX = 0.2). Importantly, the GWAS approach permits SNPs to be partitioned by their estimated fitness effects, resulting in a GWAS estimate of fX that is minimally affected by SC variation. This may explain why the GWAS point estimate of fX is close to the idealized theoretical prediction for SA polymorphisms uniformly distributed across the genome (fX = 1/3 ≈ 0.33), though there is substantial imprecision in the estimate (as already noted).
The most experimentally feasible approach for testing Rice's hypothesis is to compare covariances for fitness (or fitness components) between fathers and sons (who do not inherit their father's X) with covariances between fathers and daughters (who do). As noted by Fry [32], studies of this type return mixed results (electronic supplementary material, table S1). In the side-blotched lizard Uta stansburiana, the ground cricket Allonemobius socius, and the fruit fly Drosophila serrata, father–daughter covariances are negative and father–son covariances are positive [16,41,42]. Elsewhere, studies on D. melanogaster and red deer (Cervus elaphus) populations have reported significantly negative father–daughter covariances and father–son covariances that are not significantly different from zero [37–40,43]; such studies are consistent with the enrichment of SA polymorphisms on the X, though it should be noted that none of them formally tested whether the magnitude of the negative covariance between father and daughter fitness was significantly greater than the magnitude of the covariance between fathers to sons. Nevertheless, the consistency of point estimates of father–daughter versus father–son fitness covariances in D. melanogaster studies offers the most compelling evidence to date for the enrichment of SA polymorphisms on the X.
Finally, two studies have used genome-wide patterns of transcription or population genetic diversity to indirectly infer the chromosomal locations of SA loci. First, Innocenti & Morrow [75] used LHM hemi-clones in D. melanogaster to test for associations between gene expression and fitness, and reported an excess (greater than 20%) of X-linked genes with putative SA effects of transcript abundance. However, it is not possible to infer the locations of SA polymorphic variation with these data unless one can assume that transcriptional variation is caused by gene-specific cis-regulatory polymorphisms, which appears unlikely given the predominance of trans-acting variation within Drosophila populations [76]. Second, Lucotte et al. [44] showed that the human X chromosome is enriched for outliers of FST estimated between adult females and males [44]. We have shown that X-autosome contrasts of between-sex FST estimated from a random sample of adults can provide an unbiased, albeit indirect, test of Rice's hypothesis when they are applied to SA loci affecting viability (electronic supplementary material, appendix H). By contrast, recent admixture, sex-biased migration and sex-specific selection affecting adult fitness components (e.g. mating success and fecundity) generate sex differences in the allele frequencies of X-linked but not autosomal loci (i.e. because sex-specific allele frequencies are equalized at conception on autosomes but not the X), creating a bias towards X-linked FST outliers. Sampling error and mis-mapping of Y-linked reads to the X or autosomes can also artificially inflate between-sex FST estimates [45,46,77,78], and these technical issues may further exacerbate X-linked versus autosomal differences. Taken together, these genomics studies do not provide conclusive evidence regarding the chromosomal locations of SA polymorphisms.
(b). Conclusions and further considerations
Our models provide empirical predictions for an idealized case in which SA polymorphisms are uniformly distributed across the genome. Current data on SA genetic variation for fitness are largely compatible with this idealized model, though we acknowledge the logistical difficulties of empirically testing for chromosomal disparities in SA polymorphism. Precise estimates of fitness (co)variance are difficult to obtain, and comparisons between fitness variances and/or covariances often suffer from low statistical power [18,79]. Our hope is that our predictions provide better guidelines for future tests of Rice's hypothesis, including GWAS analyses of SA variation and estimates of cross-sex fitness covariances from a broader array of populations and species.
While our models establish baseline expectations against which data can be compared, it is important to keep in mind that our theoretical predictions apply to scenarios in which SA polymorphisms are maintained at equilibrium under balancing selection and the distributions of SA and SC fitness effects are equal between the X and autosomes, though both assumptions may be violated in real populations. First, SA alleles, including those under balancing selection, may be strongly susceptible to genetic drift, leading to substantial deviations from deterministic equilibrium, particularly on the X, which has a lower effective population size than autosomes [23,25,80]. We have shown that genetic drift will not fundamentally change our predictions regarding SA polymorphisms under strong balancing selection (electronic supplementary material, appendix B). Yet, for SA loci subject to directional selection or weak balancing selection, recurrent mutation will be important in maintaining polymorphism and will tend to elevate SA polymorphism on autosomes relative to the X. Second, it remains unclear whether or not the distribution of phenotypic (including fitness) effects of mutations is equivalent between the X and autosomes. Such assumptions are central to many theoretical predictions for sex chromosome evolution, and while there is some qualitative indirect support for them [12,81–84], further attention to the issue would greatly improve our ability to predict the potential contributions of X-linked and autosomal genes to population genetic diversity and species divergence.
Supplementary Material
Acknowledgements
We thank three anonymous reviewers for comments that substantially improved the paper.
Data accessibility
All supporting data are available in the Supplementary Materials.
Authors' contributions
F.R. and T.C. contributed to the conception and development of the project. T.C. developed the models. F.R. compiled data from previous empirical studies. F.R. and T.C. wrote and edited the manuscript.
Competing interests
We declare we have no competing interests.
Funding
This study was funded by the Australian Research Council.
References
- 1.Arnqvist G, Rowe L. 2005. Sexual conflict. Princeton, NJ: Princeton University Press. [Google Scholar]
- 2.Poissant J, Wilson AJ, Coltman DW. 2010. Sex-specific genetic variance and the evolution of sexual dimorphism: a systematic review of cross-sex genetic correlations. Evolution 64, 97–107. ( 10.1111/j.1558-5646.2009.00793.x) [DOI] [PubMed] [Google Scholar]
- 3.Griffin RM, Dean R, Grace JL, Rydén P, Friberg U. 2013. The shared genome is a pervasive constraint on the evolution of sex-biased gene expression. Mol. Biol. Evol. 30, 2168–2176. ( 10.1093/molbev/mst121) [DOI] [PubMed] [Google Scholar]
- 4.Lande R. 1980. Sexual dimorphism, sexual selection, and adaptation in polygenic characters. Evolution 34, 292–305. ( 10.2307/2407393) [DOI] [PubMed] [Google Scholar]
- 5.Connallon T, Hall MD. 2018. Genetic constraints on adaptation: a theoretical primer for the genomics era. Ann. NY Acad. Sci. 1422, 65–87. ( 10.1111/nyas.13536) [DOI] [PubMed] [Google Scholar]
- 6.Connallon T, Clark AG. 2014. Evolutionary inevitability of sexual antagonism. Proc. R. Soc. B Biol. Sci. 281, 2013–2123. ( 10.1098/rspb.2013.2123) [DOI] [PMC free article] [PubMed] [Google Scholar]
- 7.Charlesworth B, Hughes K. 2000. The maintenance of genetic variation in life history traits. In Evolutionary genetics: from molecules to morphology, Vol. 1, pp. 369–391. Cambridge, UK: Cambridge University Press. [Google Scholar]
- 8.Charlesworth B. 2015. Causes of natural variation in fitness: evidence from studies of Drosophila populations. Proc. Natl. Acad. Sci. USA 112, 1662–1669. ( 10.1073/pnas.1423275112) [DOI] [PMC free article] [PubMed] [Google Scholar]
- 9.Sharp NP, Agrawal AF. 2018. An experimental test of the mutation-selection balance model for the maintenance of genetic variance in fitness components. Proc. R. Soc. B Biol. Sci. 285, 20181864 ( 10.1098/rspb.2018.1864) [DOI] [PMC free article] [PubMed] [Google Scholar]
- 10.Bonduriansky R, Chenoweth SF. 2009. Intralocus sexual conflict. Trends Ecol. Evol. 24, 280–288. ( 10.1016/j.tree.2008.12.005) [DOI] [PubMed] [Google Scholar]
- 11.Price DK, Burley NT. 1993. Constraints on the evolution of attractive traits: genetic (co)variance of zebra finch bill colour. Heredity 71, 405–412. ( 10.1038/hdy.1993.155) [DOI] [PubMed] [Google Scholar]
- 12.Long TAF, Rice WR. 2007. Adult locomotory activity mediates intralocus sexual conflict in a laboratory-adapted population of Drosophila melanogaster. Proc. R. Soc. B Biol. Sci. 274, 3105–3112. ( 10.1098/rspb.2007.1140) [DOI] [PMC free article] [PubMed] [Google Scholar]
- 13.Rice WR. 1992. Sexually antagonistic genes: experimental evidence. Science 256, 1436–1439. ( 10.1126/science.1604317) [DOI] [PubMed] [Google Scholar]
- 14.Prasad NG, Bedhomme S, Day T, Chippindale AK. 2007. An evolutionary cost of separate genders revealed by male-limited evolution. Am. Nat. 169, 29–37. ( 10.1086/509941) [DOI] [PubMed] [Google Scholar]
- 15.Chippindale AK, Gibson JR, Rice WR. 2001. Negative genetic correlation for adult fitness between sexes reveals ontogenetic conflict in Drosophila. Proc. Natl. Acad. Sci. USA 98, 1671–1675. ( 10.1073/pnas.98.4.1671) [DOI] [PMC free article] [PubMed] [Google Scholar]
- 16.Delcourt M, Blows MW, Rundle HD. 2009. Sexually antagonistic genetic variance for fitness in an ancestral and a novel environment. Proc. R. Soc. B Biol. Sci. 276, 2009–2014. ( 10.1098/rspb.2008.1459) [DOI] [PMC free article] [PubMed] [Google Scholar]
- 17.Berger D, Grieshop K, Lind MI, Goenaga J, Maklakov AA, Arnqvist G. 2014. Intralocus sexual conflict and environmental stress. Evolution 68, 2184–2196. ( 10.1111/evo.12439) [DOI] [PubMed] [Google Scholar]
- 18.Connallon T, Matthews G. 2019. Cross-sex genetic correlations for fitness and fitness components: connecting theoretical predictions to empirical patterns. Evol. Lett. 3, 254–262. ( 10.1002/evl3.116) [DOI] [PMC free article] [PubMed] [Google Scholar]
- 19.Mank JE. 2017. Population genetics of sexual conflict in the genomic era. Nat. Rev. Genet. 18, 721–730. ( 10.1038/nrg.2017.83) [DOI] [PubMed] [Google Scholar]
- 20.Rowe L, Chenoweth SF, Agrawal AF. 2018. The genomics of sexual conflict. Am. Nat. 192, 274–286. ( 10.1086/698198) [DOI] [PubMed] [Google Scholar]
- 21.Kasimatis KR, Nelson TC, Phillips PC. 2017. Genomic signatures of sexual conflict. J. Hered. 108, 780–790. ( 10.1093/jhered/esx080) [DOI] [PMC free article] [PubMed] [Google Scholar]
- 22.Ruzicka F, Hill MS, Pennell TM, Flis I, Ingleby FC, Mott R, Fowler K, Morrow EH, Reuter M. 2019. Genome-wide sexually antagonistic variants reveal long-standing constraints on sexual dimorphism in fruit flies. PLoS Biol. 17, e3000244 ( 10.1371/journal.pbio.3000244) [DOI] [PMC free article] [PubMed] [Google Scholar]
- 23.Connallon T, Clark AG. 2012. A general population genetic framework for antagonistic selection that accounts for demography and recurrent mutation. Genetics 190, 1477–1489. ( 10.1534/genetics.111.137117) [DOI] [PMC free article] [PubMed] [Google Scholar]
- 24.Hill MS, Reuter M, Stewart AJ. 2019. Sexual antagonism drives the displacement of polymorphism across gene regulatory cascades. Proc. R. Soc. B Biol. Sci. 286, 20190660 ( 10.1098/rspb.2019.0660) [DOI] [PMC free article] [PubMed] [Google Scholar]
- 25.Mullon C, Pomiankowski A, Reuter M. 2012. The effects of selection and genetic drift on the genomic distribution of sexually antagonistic alleles. Evolution 66, 3743–3753. ( 10.1111/j.1558-5646.2012.01728.x) [DOI] [PubMed] [Google Scholar]
- 26.Kidwell JF, Clegg MT, Stewart FM, Prout T. 1977. Regions of stable equilibria for models of differential selection in the two sexes under random mating. Genetics 85, 171–183. [DOI] [PMC free article] [PubMed] [Google Scholar]
- 27.Rice WR. 1984. Sex chromosomes and the evolution of sexual dimorphism. Evolution 38, 735–742. ( 10.2307/2408385) [DOI] [PubMed] [Google Scholar]
- 28.Patten MM, Haig D. 2009. Maintenance or loss of genetic variation under sexual and parental antagonism at a sex-linked locus. Evolution 63, 2888–2895. ( 10.1111/j.1558-5646.2009.00764.x) [DOI] [PubMed] [Google Scholar]
- 29.Jordan CY, Charlesworth D. 2012. The potential for sexually antagonistic polymorphism in different genome regions. Evolution 66, 505–516. ( 10.1111/j.1558-5646.2011.01448.x) [DOI] [PubMed] [Google Scholar]
- 30.Pamilo P. 1979. Genic variation at sex-linked loci: quantification of regular selection models. Hereditas 91, 129–133. ( 10.1111/j.1601-5223.1979.tb01652.x) [DOI] [PubMed] [Google Scholar]
- 31.Lewontin RC. 1974. The genetic basis of evolutionary change. New York, NY: Columbia University Press. [Google Scholar]
- 32.Fry JD. 2010. The genomic location of sexually antagonistic variation: some cautionary comments. Evolution 64, 1510–1516. ( 10.1111/j.1558-5646.2009.00898.x) [DOI] [PMC free article] [PubMed] [Google Scholar]
- 33.Connallon T, Chenoweth SF. 2019. Dominance reversals and the maintenance of genetic variation for fitness. PLoS Biol. 29, e3000118 ( 10.1371/journal.pbio.3000118) [DOI] [PMC free article] [PubMed] [Google Scholar]
- 34.Orr HA. 2010. The population genetics of beneficial mutations. Philos. Trans. R. Soc. B Biol. Sci. 365, 1195–1201. ( 10.1098/rstb.2009.0282) [DOI] [PMC free article] [PubMed] [Google Scholar]
- 35.Gibson JR, Chippindale AK, Rice WR. 2002. The X chromosome is a hot spot for sexually antagonistic fitness variation. Proc. R. Soc. B Biol. Sci. 269, 499–505. ( 10.1098/rspb.2001.1863) [DOI] [PMC free article] [PubMed] [Google Scholar]
- 36.Abbott JK, Morrow EH. 2011. Obtaining snapshots of genetic variation using hemiclonal analysis. Trends Ecol. Evol. 26, 359–368. ( 10.1016/j.tree.2011.03.011) [DOI] [PubMed] [Google Scholar]
- 37.Pischedda A, Chippindale AK. 2006. Intralocus sexual conflict diminishes the benefits of sexual selection. PLoS Biol. 4, e356 ( 10.1371/journal.pbio.0040356) [DOI] [PMC free article] [PubMed] [Google Scholar]
- 38.Connallon T, Jakubowski E. 2009. Association between sex ratio distortion and sexually antagonistic fitness consequences of female choice. Evolution 63, 2179–2183. ( 10.1111/j.1558-5646.2009.00692.x) [DOI] [PMC free article] [PubMed] [Google Scholar]
- 39.Long TAF, Agrawal AF, Rowe L. 2012. The effect of sexual selection on offspring fitness depends on the nature of genetic variation. Curr. Biol. 22, 204–208. ( 10.1016/j.cub.2011.12.020) [DOI] [PubMed] [Google Scholar]
- 40.Oneal E, Connallon T, Knowles LL. 2007. Conflict between direct and indirect benefits of female choice in desert Drosophila. Biol. Lett. 3, 29–32. ( 10.1098/rsbl.2006.0565) [DOI] [PMC free article] [PubMed] [Google Scholar]
- 41.Fedorka KM, Mousseau TA. 2004. Female mating bias results in conflicting sex-specific offspring fitness. Nature 429, 65–67. ( 10.1038/nature02492) [DOI] [PubMed] [Google Scholar]
- 42.Calsbeek R, Sinervo B. 2004. Within-clutch variation in offspring sex determined by differences in sire body size: cryptic mate choice in the wild. J. Evol. Biol. 17, 464–470. ( 10.1046/j.1420-9101.2003.00665.x) [DOI] [PubMed] [Google Scholar]
- 43.Foerster K, Coulson T, Sheldon BC, Pemberton JM, Clutton-Brock TH, Kruuk LE. 2007. Sexually antagonistic genetic variation for fitness in red deer. Nature 447, 1107–1110. ( 10.1038/nature05912) [DOI] [PubMed] [Google Scholar]
- 44.Lucotte EA, Laurent R, Heyer E, Ségurel L, Toupance B. 2016. Detection of allelic frequency differences between the sexes in humans: a signature of sexually antagonistic selection. Genome Biol. Evol. 8, 1489–1500. ( 10.1093/gbe/evw090) [DOI] [PMC free article] [PubMed] [Google Scholar]
- 45.Kasimatis KR, Ralph PL, Phillips PC. 2019. Limits to genomic divergence under sexually antagonistic selection. G3 9, 3813–3824. ( 10.1534/g3.119.400711) [DOI] [PMC free article] [PubMed] [Google Scholar]
- 46.Ruzicka F, et al. 2020 The search for sexually antagonistic genes: practical insights from studies of local adaptation and statistical genomics. Evol. Lett. 4, 398–415. ( 10.1002/evl3.192) [DOI] [PMC free article] [PubMed] [Google Scholar]
- 47.Flintham EO, Savolainen V, Mullon C.2020. Dispersal alters the nature and scope of sexually antagonistic variation. bioRxiv (doi:10.1101/2020.05.05.080010)
- 48.Connallon T, Sharma S, Olito C. 2019. Evolutionary consequences of sex-specific selection in variable environments: four simple models reveal diverse evolutionary outcomes. Am. Nat. 193, 93–105. ( 10.1086/700720) [DOI] [PubMed] [Google Scholar]
- 49.Hitchcock TJ, Gardner A. 2020. A gene's-eye view of sexual antagonism. Proc. R. Soc. B Biol. Sci. 287, 20201633 ( 10.1098/rspb.2020.1633) [DOI] [PMC free article] [PubMed] [Google Scholar]
- 50.Charlesworth B. 1979. Evidence against Fisher's theory of dominance. Nature 278, 848–849. ( 10.1038/278848a0) [DOI] [Google Scholar]
- 51.Sella G, Barton NH. 2019. Thinking about the evolution of complex traits in the era of genome-wide association studies. Annu. Rev. Genomics Hum. Genet. 20, 461–493. ( 10.1146/annurev-genom-083115-022316) [DOI] [PubMed] [Google Scholar]
- 52.Kirkpatrick M, Hall DW. 2004. Male-biased mutation, sex linkage, and the rate of adaptive evolution. Evolution 58, 437–440. ( 10.1111/j.0014-3820.2004.tb01659.x) [DOI] [PubMed] [Google Scholar]
- 53.Mallet MA, Bouchard JM, Kimber CM, Chippindale AK. 2011. Experimental mutation-accumulation on the X chromosome of Drosophila melanogaster reveals stronger selection on males than females. BMC Evol. Biol. 11, 156 ( 10.1186/1471-2148-11-156) [DOI] [PMC free article] [PubMed] [Google Scholar]
- 54.Sharp NP, Agrawal AF. 2013. Male-biased fitness effects of spontaneous mutations in Drosophila melanogaster. Evolution 67, 1189–1195. ( 10.1111/j.1558-5646.2012.01834.x) [DOI] [PubMed] [Google Scholar]
- 55.Grieshop K, Stångberg J, Martinossi-Allibert I, Arnqvist G, Berger D. 2016. Strong sexual selection in males against a mutation load that reduces offspring production in seed beetles. J. Evol. Biol. 29, 1201–1210. ( 10.1111/jeb.12862) [DOI] [PubMed] [Google Scholar]
- 56.Prokop ZM, Prus MA, Gaczorek TS, Sychta K, Palka JK, Plesnar-Bielak A, Skarboń M. 2017. Do males pay for sex? Sex-specific selection coefficients suggest not. Evolution 71, 650–661. ( 10.1111/evo.13151) [DOI] [PubMed] [Google Scholar]
- 57.Úbeda F, Haig D, Patten MM. 2011. Stable linkage disequilibrium owing to sexual antagonism. Proc. R. Soc. B Biol. Sci. 278, 855–862. ( 10.1098/rspb.2010.1201) [DOI] [PMC free article] [PubMed] [Google Scholar]
- 58.Cheng C, Kirkpatrick M. 2016. Sex-specific selection and sex-biased gene expression in humans and flies. PLoS Genet. 12, e1006170 ( 10.1371/journal.pgen.1006170) [DOI] [PMC free article] [PubMed] [Google Scholar]
- 59.Dutoit L, Mugal CF, Bolívar P, Wang M, Nadachowska-Brzyska K, Smeds L, Yazdi HP, Gustafsson L, Ellegren H. 2018. Sex-biased gene expression, sexual antagonism and levels of genetic diversity in the collared flycatcher (Ficedula albicollis) genome. Mol. Ecol. 27, 3572–3581. ( 10.1111/mec.14789) [DOI] [PubMed] [Google Scholar]
- 60.Wright AE, Fumagalli M, Cooney CR, Bloch NI, Vieira FG, Buechel SD, Kolm N, Mank JE. 2018. Sex-biased gene expression resolves sexual conflict through the evolution of sex-specific genetic architecture. Evol. Lett. 2, 52–61. ( 10.1101/176990) [DOI] [PMC free article] [PubMed] [Google Scholar]
- 61.Flanagan SP, Jones AG. 2017. Genome-wide selection components analysis in a fish with male pregnancy. Evolution 71, 1096–1105. ( 10.1111/evo.13173) [DOI] [PubMed] [Google Scholar]
- 62.Crow JF, Kimura M. 1970. An introduction to population genetics theory. New York, NY: Harper and Row.
- 63.Thomson GJ, Feldman MW. 1975. Population genetics of modifiers of meiotic drive: IV. On the evolution of sex-ratio distortion. Theor. Popul. Biol. 8, 202–211. ( 10.1016/0040-5809(75)90032-5) [DOI] [PubMed] [Google Scholar]
- 64.Nagylaki T. 1979. Selection in dioecious populations. Ann. Hum. Genet. 43, 143–150. ( 10.1111/j.1469-1809.1979.tb02007.x) [DOI] [PubMed] [Google Scholar]
- 65.Prout T. 1981. A note on the island model with sex dependent migration. Theor. Appl. Genet. 59, 327–332. ( 10.1007/BF00264987) [DOI] [PubMed] [Google Scholar]
- 66.Orr HA. 1991. A test of Fisher's theory of dominance. Proc. Natl. Acad. Sci. USA 88, 11 413–11 415. ( 10.1073/pnas.88.24.11413) [DOI] [PMC free article] [PubMed] [Google Scholar]
- 67.Manna F, Martin G, Lenormand T. 2011. Fitness landscapes: an alternative theory for the dominance of mutation. Genetics 189, 923–937. ( 10.1534/genetics.111.132944) [DOI] [PMC free article] [PubMed] [Google Scholar]
- 68.Albert AYK, Otto SP. 2005. Sexual selection can resolve sex-linked sexual antagonism. Science 310, 119–121. ( 10.1126/science.1115328) [DOI] [PubMed] [Google Scholar]
- 69.Vicoso B, Charlesworth B. 2006. Evolution on the X chromosome: unusual patterns and processes. Nat. Rev. Genet. 7, 645–653. ( 10.1038/nrg1914) [DOI] [PubMed] [Google Scholar]
- 70.Van Doorn GS, Kirkpatrick M. 2007. Turnover of sex chromosomes induced by sexual conflict. Nature 449, 909–912. ( 10.1038/nature06178) [DOI] [PubMed] [Google Scholar]
- 71.Abbott JK, Nordén AK, Hansson B. 2017. Sex chromosome evolution: historical insights and future perspectives. Proc. R. Soc. B Biol. Sci. 284, 20162806 ( 10.1098/rspb.2016.2806) [DOI] [PMC free article] [PubMed] [Google Scholar]
- 72.Bohidar NR. 1964. Derivation and estimation of variance and covariance components associated with covariance between relatives under sex-linked transmission. Biometrics 20, 505–521. ( 10.2307/2528492) [DOI] [Google Scholar]
- 73.James JW. 1973. Covariances between relatives due to sex-linked genes. Biometrics 29, 584–588. ( 10.2307/2529178) [DOI] [PubMed] [Google Scholar]
- 74.Connallon T. 2010. Genic capture, sex linkage, and the heritability of fitness. Am. Nat. 175, 564–576. ( 10.1086/651590) [DOI] [PubMed] [Google Scholar]
- 75.Innocenti P, Morrow EH. 2010. The sexually antagonistic genes of Drosophila melanogaster. PLoS Biol. 8, e1000335 ( 10.1371/journal.pbio.1000335) [DOI] [PMC free article] [PubMed] [Google Scholar]
- 76.Wittkopp PJ, Haerum BK, Clark AG. 2008. Regulatory changes underlying expression differences within and between Drosophila species. Nat. Genet. 40, 346–350. ( 10.1038/ng.77) [DOI] [PubMed] [Google Scholar]
- 77.Bissegger M, Laurentino TG, Roesti M, Berner D. 2019. Widespread intersex differentiation across the stickleback genome – the signature of sexually antagonistic selection? Mol. Ecol. 29, 262–271. ( 10.1111/mec.15255) [DOI] [PubMed] [Google Scholar]
- 78.Kasimatis KR, Abraham A, Ralph PL, Kern AD, Capra JA, Phillips PC.2020. Sexually antagonistic selection on genetic variation is rare in humans. bioRxiv , 1–23. ( ) [DOI] [PMC free article] [PubMed]
- 79.Punzalan D, Delcourt M, Rundle HD. 2014. Comparing the intersex genetic correlation for fitness across novel environments in the fruit fly, Drosophila serrata . Heredity 112, 143–148. ( 10.1038/hdy.2013.85) [DOI] [PMC free article] [PubMed] [Google Scholar]
- 80.Charlesworth B. 2009. Fundamental concepts in genetics: effective population size and patterns of molecular evolution and variation. Nat. Rev. Genet. 10, 195–205. ( 10.1038/nrg2526) [DOI] [PubMed] [Google Scholar]
- 81.Houle D, Fierst J. 2013. Properties of spontaneous mutational variance and covariance for wing size and shape in Drosophila melanogaster. Evolution 67, 1116–1130. ( 10.1111/j.1558-5646.2012.01838.x) [DOI] [PubMed] [Google Scholar]
- 82.Reinhold K, Engqvist L. 2013. The variability is in the sex chromosomes. Evolution 67, 3662–3668. ( 10.1111/evo.12224) [DOI] [PubMed] [Google Scholar]
- 83.Nakagawa S, Poulin R, Mengersen K, Reinhold K, Engqvist L, Lagisz M, Senior AM. 2015. Meta-analysis of variation: ecological and evolutionary applications and beyond. Methods Ecol. Evol. 6, 143–152. ( 10.1111/2041-210X.12309) [DOI] [Google Scholar]
- 84.Griffin RM, Schielzeth H, Friberg U. 2016. Autosomal and X-linked additive genetic variation for lifespan and aging: comparisons within and between the sexes in Drosophila melanogaster. G3 6, 3903–3911. ( 10.1534/g3.116.028308) [DOI] [PMC free article] [PubMed] [Google Scholar]
Associated Data
This section collects any data citations, data availability statements, or supplementary materials included in this article.
Supplementary Materials
Data Availability Statement
All supporting data are available in the Supplementary Materials.