Abstract
The currents of α7 nicotinic acetylcholine receptors activated by acetylcholine (ACh) are brief. The channel has high permeability to calcium relative to monovalent cations and shows inward rectification. It has been previously noted that in the presence of positive allosteric modulators (PAMs), currents through the channels of α7 receptors differ from normal α7 currents both in sensitivity to specific channel blockers and their current-voltage (I-V) relationships, no longer showing inward rectification. Linear I-V functions are often associated with channels lacking calcium permeability, so we measured the I-V functions of α7 receptors activated by ACh when PAMs were bound to the allosteric binding site in the transmembrane domain. Currents were recorded in chloride-free Ringer’s solution with low or high concentrations of extracellular calcium to determine the magnitude of the reversal potential shift in the two conditions as well as the I-V relationships. ACh-evoked currents potentiated by the allosteric agonist–PAMs (ago-PAMs) (3aR,4S,9bS)-4-(4-bromophenyl)-3a,4,5,9b-tetrahydro-3H-cyclopenta[c]quinoline-8-sulfonamide (GAT107) and 3-(3,4-difluorophenyl)-N-(1-(6-(4-(pyridin-2-yl)piperazin-1-yl)pyrazin-2-yl)ethyl)propenamide (B-973B) showed reduced inward rectification and calcium-dependent reversal potential shifts decreased by 80%, and 50%, respectively, compared with currents activated by ACh alone, indicative of reduced calcium permeability. Currents potentiated by 3a,4,5,9b-tetrahydro-4-(1-naphthalenyl)-3H-cyclopentan[c]quinoline-8-sulfonamide were also linear and showed no calcium-dependent reversal potential shifts. The ago-PAMs GAT-107 and B-973B stimulated increases in intracellular calcium in stably transfected HEK293 cells. However, these calcium signals were delayed relative to channel activation produced by these agents and were insensitive to the channel blocker mecamylamine. Our results indicate that, although allosterically activated α7 nicotinic ACh receptor may affect intracellular calcium levels, such effects are not likely due to large channel-dependent calcium influx.
SIGNIFICANCE STATEMENT
Positive allosteric modulators (PAMs) of α7 nicotinic acetylcholine receptor can increase channel activation by two or more orders of magnitude, raising the concern that, due to the relatively high calcium permeability of α7 receptors activated by acetylcholine alone, such efficacious PAMs may have cytotoxic side effects. We show that PAMs alter the ion conduction pathway and, in general, reduce the calcium permeability of the channels. This supports the hypothesis that α7 effects on intracellular calcium may be independent of channel-mediated calcium influx.
Introduction
There are two principle types of neuronal nicotinic acetylcholine receptors (nAChRs), heteromeric receptors that are pentameric assemblies of α and β subunits, and homomeric receptors, typified by receptors containing five α7 subunits (Papke, 2014). These two classes of receptors differ in their patterns of expression and are associated with different therapeutic indications. Drugs targeting α7 have been shown to have positive cognitive effects (Wallace et al., 2011; Timmermann et al., 2012), and more recently, due to the expression of α7 in nonneuronal cells, α7 drugs have been shown to modulate inflammation and reduce neuropathic pain (Bagdas et al., 2018). Basic models for nAChR pharmacology and function were derived from early studies of the neuromuscular nAChR (Papke, 2014), but α7 receptors have been shown to fit these models poorly or not at all. Activation of α7 receptors by acetylcholine (ACh) and other typical agonists, such as nicotine, is very inefficient since these receptors exhibit a unique form of rapid desensitization (Williams et al., 2012). However, α7 nAChRs activated by ACh have a calcium permeability greater than that of other nAChRs (Séguéla et al., 1993; Castro and Albuquerque, 1995; Fucile et al., 2003), a feature that has been proposed to lead to cytoprotection under some conditions and potentially toxicity under other conditions (Li et al., 1999; Guerra-Álvarez et al., 2015).
The intrinsically low channel activity of α7 was long thought to be a limiting factor for therapeutically targeting α7 with traditional agonists. However, this perspective has been modified in part because of evidence that α7 may be capable of metabotropic as well as ionotropic signaling and because some of the most effective modulators of inflammation are α7 agonists with low efficacy for ion channel activation (Horenstein and Papke, 2017; Bagdas et al., 2018). The potential limitations associated with low channel activity for therapeutics have also been mitigated by the discovery of very efficacious positive allosteric modulators (PAMs) (Williams et al., 2011b). PAMs like 1-(5-chloro-2,4-dimethoxy-phenyl)-3-(5-methyl-isoxazol-3-yl)-urea (PNU-120596) and 3a,4,5,9b-tetrahydro-4-(1-naphthalenyl)-3H-cyclopentan[c]quinoline-8-sulfonamide (TQS) can increase α7 channel activity by two or more orders of magnitude. Whereas PAMs like PNU-120596 and TQS require ACh, choline, or an exogenous agonist such as nicotine to produce channel activation, other compounds, for example, (3aR,4S,9bS)-4-(4-bromophenyl)-3a,4,5,9b-tetrahydro-3H-cyclopenta[c]quinoline-8-sulfonamide (GAT107) and 3-(3,4-difluorophenyl)-N-(1-(6-(4-(pyridin-2-yl)piperazin-1-yl)pyrazin-2-yl)ethyl)propenamide (B-973B), have been identified as allosteric agonist–positive allosteric modulators (ago-PAMs) and are capable of producing high levels of allosteric activation without additional orthosteric agonists (Horenstein et al., 2016; Garai et al., 2018). It has been a concern, however, that such strong enhancement in the activity of a receptor with high calcium permeability may actually present a risk for the therapeutic development of PAMs and ago-PAMs due to calcium overload (Williams et al., 2011b).
It has previously been suggested that the pores formed in PAM-potentiated α7 nAChR are biophysically different than the normal ACh-activated channels (Peng et al., 2013; Quadri et al., 2019). On the single-channel level, the bursting behavior promoted by these compounds is quite impressive. Whereas ACh-activated receptor channels show only rare, isolated openings that are <100 microseconds, PAM-potentiated currents take the form of protracted bursts, sometimes lasting several seconds, with multiple conductance levels (Williams et al., 2011a). Additionally, there are differences that depend on the actual PAM used (Andersen et al., 2016). Also, PAM-potentiated currents do not show the inward rectification typical of α7 channels activated by ACh alone (Sitzia et al., 2011), and they have different sensitivity to channel blockers (Peng et al., 2013; Quadri et al., 2019). For example, the activation of α7 by the ago-PAM GAT107 is sensitive to mecamylamine, but currents evoked by the alternative ago-PAM B-973B are not (Quadri et al., 2019).
It has been previously reported that the properties of current rectification and calcium permeability are correlated in both glutamate receptors and nAChRs (Francis and Papke, 1996; Haghighi and Cooper, 2000). Therefore, we investigated whether the reduced inward rectification of PAM-potentiated α7 responses would also correlate to reduced calcium permeability.
In light of the evidence that the α7 channel activated by PAMs and ago-PAMs is qualitatively different from the channel formed when the receptor is activated by ACh alone, we measured shifts in current reversal potential (Vrev) produced when receptor responses were recorded in different calcium concentrations in chloride-free solutions. This classic approach for measuring channel permeability relies on the effect of increasing the concentration of a permeant ion to increase the driving force for a specific ion, and therefore shifting the voltage at which the flux of that ion is in balance with other permeant ions.
Materials and Methods
Reagents.
Acetylcholine chloride, atropine, and other chemicals were purchased from Sigma-Aldrich Chemical Company (St. Louis, MO). GAT107 (Kulkarni and Thakur, 2013; Thakur et al., 2013), TQS (Stokes et al., 2019), B-973B (Garai et al., 2018), and PNU-120596 (Williams et al., 2011a) were synthesized as described previously. All compounds were confirmed by NMR to have a purity ≥95%. Fresh ACh stock solutions were made in Ringer’s solution each day of experimentation. Stock solutions of the PAMs were made in DMSO and kept at −20°C and diluted in Ringer’s solution each day.
Heterologous Expression of nAChRs in Xenopus laevis Oocytes.
The human α7 nAChR clone was obtained from Dr. J. Lindstrom (University of Pennsylvania, Philadelphia, PA). The human resistance-to-cholinesterase 3 (RIC-3) clone, obtained from Dr. M. Treinin (Hebrew University, Jerusalem, Israel), was coinjected with α7 to improve the level and speed of α7 receptor expression without affecting the pharmacological properties of the receptors (Halevi et al., 2003). Subsequent to linearization and purification of the plasmid cDNAs, cRNAs were prepared using the mMessage mMachine in vitro RNA transfection kit (Ambion, Austin, TX).
Oocytes were surgically removed from mature X. laevis frogs (Nasco, Ft. Atkinson, WI) and injected with appropriate nAChR subunit cRNAs as described previously (Papke and Stokes, 2010). Frogs were maintained in the Animal Care Service facility of the University of Florida, and all procedures were approved by the University of Florida Institutional Animal Care and Use Committee. In brief, the frog was first anesthetized for 15–20 minutes in 1.5 l frog tank water containing 1 g of 3-aminobenzoate methanesulfonate buffered with sodium bicarbonate. The harvested oocytes were treated with 1.25 mg/ml collagenase (Worthington Biochemicals, Freehold, NJ) for 2 hours at room temperature in calcium-free Barth’s solution (88 mM NaCl, 1 mM KCl, 2.38 mM NaHCO3, 0.82 mM MgSO4, 15 mM HEPES, and 12 mg/l tetracycline, pH 7.6) to remove the follicular layers. Stage V oocytes were subsequently isolated, each injected with 50 nl containing 4 ng α7 nAChR subunit cRNA and 2 ng RIC-3 cRNA, then maintained in Barth’s solution with 0.32 mM Ca(NO3)2 and 0.41 mM CaCl2. Recordings were carried out 1–7 days after injection.
Two-Electrode Voltage Clamp Electrophysiology.
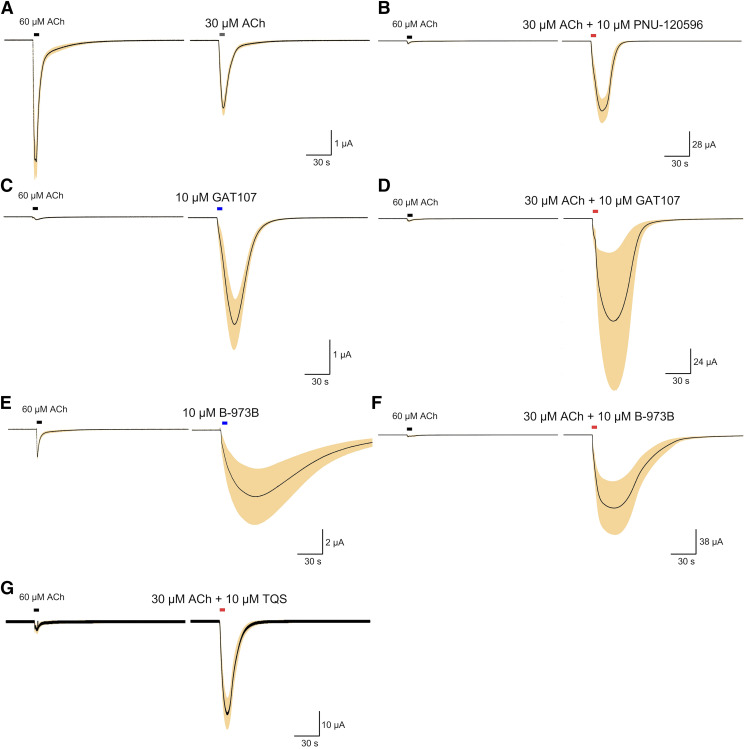
Experiments were conducted at room temperature (24°C) using OpusXpress 6000A (Molecular Devices, Union City, CA) (Papke and Stokes, 2010). Both the voltage and current electrodes were filled with 3 M KCl. Oocytes were voltage-clamped at −60 mV. The oocytes were bath-perfused with Ringer’s solution (115 mM NaCl, 2.5 mM KCl, 1.8 mM CaCl2, 10 mM HEPES, and 1 μM atropine, pH 7.2) at 2 ml/min. Drug applications were 12 seconds in duration followed by a 181-second washout period. Solution exchange typically occurs with a time constant of about 5 seconds, although washout may be uneven around the entire surface of the oocyte (Papke and Thinschmidt, 1998; Papke and Porter Papke, 2002). For standard experiments, recordings for each oocyte constituted two initial control applications of ACh and then an experimental compound applied alone or coapplied with ACh. Every experiment began with eight cells (the capacity of the recording system); however, due to the nature of the experiments, not all cells remained viable through entire experiments, and some cells had large responses that could not be adequately voltage clamped. Therefore, n varied from 4 to 8. Figure 1 shows the second precontrol and test responses for α7 experiments. The control ACh concentration was 60 µM. The responses were calculated as both peak current amplitudes and net charge, as previously described (Papke and Porter Papke, 2002). The average responses of the two initial ACh controls from each cell were used for normalization. Statistical analyses were conducted based on ANOVA of the data from multiple replicates.
Fig. 1.
Control and potentiated responses of α7 receptors expressed in Xenopus oocytes. (A) Averaged responses to the application of 30 µM ACh normalized and compared with control 60 µM ACh responses from the same cells (n = 8). (B) Averaged responses to the application of 30 µM ACh coapplied with 10 µM PNU-120596, normalized, and compared with control 60 µM ACh responses from the same cells (n = 4). (C) Averaged responses to the application of 10 µM GAT107 applied alone, normalized, and compared with control 60 µM ACh responses from the same cells (n = 5). (D) Averaged responses to the application of 30 µM ACh coapplied with 10 µM GAT107, normalized and compared with control 60 µM ACh responses from the same cells (n = 4). (E) Averaged responses to the application of 10 µM B-973B applied alone, normalized, and compared with control 60 µM ACh responses from the same cells (n = 6). (F) Averaged responses to the application of 30 µM ACh coapplied with 10 µM B-973B, normalized and compared with control 60 µM ACh responses from the same cells (n = 6). (G) Averaged responses of α7-expressing cells to the application of 30 µM ACh coapplied with 10 µM TQS, normalized and compared with control 60 µM ACh responses from the same cells (n = 5).
Data for standard experiments at the fixed holding potential of −60 mV were filtered at 20 Hz, sampled at 50 Hz, and analyzed by Clampfit 10.3 (Molecular Devices) and Excel (Microsoft, Redmond, WA). Data were expressed as means ± S.D. from at least four oocytes for each experiment and plotted by Kaleidagraph 4.5.2 (Synergy Software, Reading, PA). Type II PAMs produce extremely large increases (>100,000-fold) in the single-channel currents of a small fraction of the receptors (≤1%), so they are intrinsically variable in amplitude and duration (Williams et al., 2011a), making it difficult to identify truly “representative” responses. Therefore, we display multicell averages for comparisons of these complex responses. The averages of normalized data were calculated using an Excel (Microsoft) template for each of the 10,500 points in each of the 210-second traces (acquired at 50 Hz). After subtraction of the basal holding current, data from each cell, including the ACh controls, were normalized by dividing each point by the peak of the ACh control from the same cell. The normalized data were then averaged and S.E.M. for the multicell averages calculated on a point-by-point basis. The dark lines represent the average normalized currents and the shaded areas the range (±) of the S.E.M. of the averaged raw data at each of the point in the trace. Scale bars in Fig. 1 of averaged traces reflect the scaling factor relative to the average peak current amplitude of the ACh controls used for the normalization procedures. These plots (Stokes et al., 2019) illustrate the differences in peak currents, net charge, the kinetics of the responses, and the variability throughout the entire time course of the responses.
Calcium Permeability Determinations.
Experiments to measure Vrev shifts as a function of extracellular calcium concentration were conducted in chloride-free methanesulfonate Ringer’s solution (Séguéla et al., 1993). Prior to the experiments, oocytes were soaked for 24 hours in the methanesulfonate Ringer’s solution without atropine and with 2 mM Ca2+ methanesulfonate and 24 mM sucrose.
Experimental Calcium Solutions.
Buffer A consisted of 90 mM Na+ methanesulfonate, 2.5 mM K+ methanesulfonate, 1 mM Ca2+ methanesulfonate, 10 mM HEPES, and 1 µM atropine, pH 7.2, and was adjusted for osmolarity with 27 mM sucrose.
Buffer B consisted of 90 mM Na+ methanesulfonate, 2.5 mM K+ methanesulfonate, 10 mM Ca2+ methanesulfonate, 10 mM HEPES, and 1 µM atropine, pH 7.2.
The Experimental Protocol.
Data acquisition episodes were 47 seconds, beginning 25 seconds before (t = −25) a solution application (t = 0).
At t = 10.5 seconds, a 1-second voltage ramp from −60 to +60 mV was delivered. These times were empirically determined from standard experiments to be during the response.
Episode 1: Buffer A was applied alone during the ramp.
Episode 2: Drugs were applied in Buffer A, and the voltage ramp was generated during the response.
After Episode 2 the perfusate was switched to Buffer B with the alternative calcium concentration.
Cells were washed for 5 minutes.
Episode 3: Buffer B was applied alone during the ramp.
Episode 4: Drugs were applied in Buffer B, and the voltage ramp was generated during the response.
Postacquisition Analysis.
Data were opened in Clampfit, and cursors were aligned according to the command voltage signal to extract the 5000 points from each episode during the voltage ramps. These data were transferred to Excel, where ramp data from Episode 1 were subtracted from the Episode 2 data for each cell to obtain just the receptor-mediated currents in Buffer A. Likewise, ramp data from Episode 3 were subtracted from the Episode 4 data for each cell to obtain just the receptor-mediated currents in Buffer B.
For statistical analysis, reversal potential shifts were measured for each cell under each experiment condition. Data for the two calcium conditions were plotted in Kaleidagraph on a reduced scale that allowed for focus on the zero current crossings. The plots, saved as jpg files, were opened in Canvas Draw (Version 4.01). Lines were superimposed over the current traces (see Supplemental Data) to visualize the midpoint of the fluctuations (i.e., noise) and identify single points where the graphically averaged currents crossed the x-axis (i.e., the reversal potentials). The distance of the zero current points to the y-axis were measured in the graphics program and reversal potentials calculated based on the scale of the x-axis and adjusted for any offset of the y-axis from zero (see Supplemental Data). Reversal potential shifts were then calculated by simple subtraction of the reversal potentials under the two calcium conditions for each cell.
Another Excel template was generated to calculate the average currents (±S.E.M.) from the replicates for presentation of the currents through the entire voltage ramps.
Rectification Measurements.
The current-voltage data for all the replicates were replotted over two different voltage ranges, −50 to −40 and 0 to +10 mV. Lines were overlaid on the current traces obtained in either 1 mM calcium or 10 mM calcium, and the slopes of those lines were used as measurement of conductance in the two voltage ranges. Linear current voltage relations would be expected to show a conductance ratio of 1, and ratios less that 1 would indicate inward rectification.
Calcium Imaging of HEK A7R3HC10 Cells Expressing α7 and RIC-3.
We have previously characterized HEK A7R3HC10 cells that were stably transfected with human α7 and RIC-3 (Williams et al., 2011a, 2012; Quadri et al., 2019). HEK A7R3HC10 cells were loaded with 5 µM Oregon Green BAPTA-1 AM (excitation/emission at 494/523 nm; Invitrogen, Carlsbad, CA) for 1 hour in the dark at room temperature. Cells were washed in external bath solution containing 165 mM NaCl, 5 mM KCl, 2 mM CaCl2, 10 mM glucose, 5 mM HEPES, and 1 μM atropine (pH 7.3) for at least 15 minutes prior to experiments. Coverslips were loaded into a low-profile imaging chamber (Warner Instruments, Hamden, CT) under gravity perfusion (2 ml/min) of external solution. Note that in the calcium imaging experiments drug applications were made with the same onset kinetics as in the oocyte experiments (same flow rate and bath volume), but the drugs were perfused continuously once applied.
A Spectra X equipped with seven excitation lines was used for excitation (λex = 470 nm) through a quad-pass filter (Chroma Technologies, Brattleboro, VT), Nikon CFI Apochromat NIR 40× W objective (numerical aperture = 0.8) and detected with an Andor Zyla 4.2 sCMOS 12-bit camera at one frame per second. Videos were acquired with a 1-minute baseline for normalization. As previously published (Goodwin et al., 2009; Miller et al., 2019), calcium signals were normalized to median fluorescence prior to drug administration using the function F(t) = ΔF/F0, where F0 is the median fluorescence prior to drug administration.
Statistics.
ANOVA were performed MATLAB 2019b (Mathworks, Natick, MA) via one-way ANOVA with Tukey’s honestly significant difference (HSD) correction for multiple comparisons. Effects were considered significant at the α ≤ 0.05 level. Effect sizes were measured using Cohen’s d. Effect size interpretations were guided by Sawilowsky (2009).
Analyses for the effects of calcium on single-cell reversal potentials under different conditions were conducted with paired (two-tail) t tests using an Excel template. A Bonferroni correction for multiple comparisons (Aickin and Gensler, 1996) was applied to correct for possible false positives.
Image Processing.
Videos were imported into ImageJ2 via the Bio-Formats Importer plugin. Regions of interest for cell bodies were segmented manually, and signals were exported into CSV files. Only nonoverlapping, distinguishable somas were segmented. Dividing cells were excluded from analysis.
Signal Processing and Analysis.
CSV files were imported into MATLAB (Mathworks), processed, analyzed, and visualized using custom code (available upon request). As noted above, calcium signals were normalized and expressed as F(t) = ΔF/F0, where F0 is defined as the baseline condition. Signals are displayed utilizing the mean value ± 95% confidence interval. Statistical analyses were performed with cells being technical replicates and coverslips as biologic replicates (i.e., independent replicates).
Results
The effects of PAMs on the 30 µM ACh-evoked responses of α7 are illustrated in Fig. 1, along with data showing the direct allosteric activation produced by GAT107 and B-973B when applied without ACh. See Table 1 for normalized peak current and net charge values. Since all of the PAMs illustrated are classified as type II (Grønlien et al., 2007) and destabilize the rapidly induced α7 desensitized states, the potentiated responses are increased in amplitude and even more so in duration, as reflected in the larger increases in net charge compared with peak current.
TABLE 1.
Responses from Fig. 1, measured as peak current and net charge (Papke and Porter Papke, 2002) relative to the average of two initial ACh control responses (Materials and Methods)
| Drugs applied | n | Peak current | Net charge |
|---|---|---|---|
| A. 30 µM ACh | 8 | 0.43 ± 0.03 | 0.69 ± 0.03 |
| B. 30 µM ACh + 10 µM PNU-120596 | 4 | 14.8 ± 9.9 | 32.3 ± 5.8 |
| C. 10 µM GAT107 | 5 | 31.7 ± 7.8 | 63.3 ± 14.1 |
| D. 30 µM ACh + 10 µM GAT107 | 4 | 33.6 ± 24.4 | 96.22 ± 27.7 |
| E. 10 µM B-973B | 6 | 2.24 ± 0.92 | 29.0 ± 6.4 |
| F. 30 µM ACh + 10 µM B-973B | 6 | 19.5 ± 7.5 | 257 ± 131 |
| G. 30 µM ACh + 10 µM TQS | 5 | 6.6 ± 1.0 | 27.1 ± 6.3 |
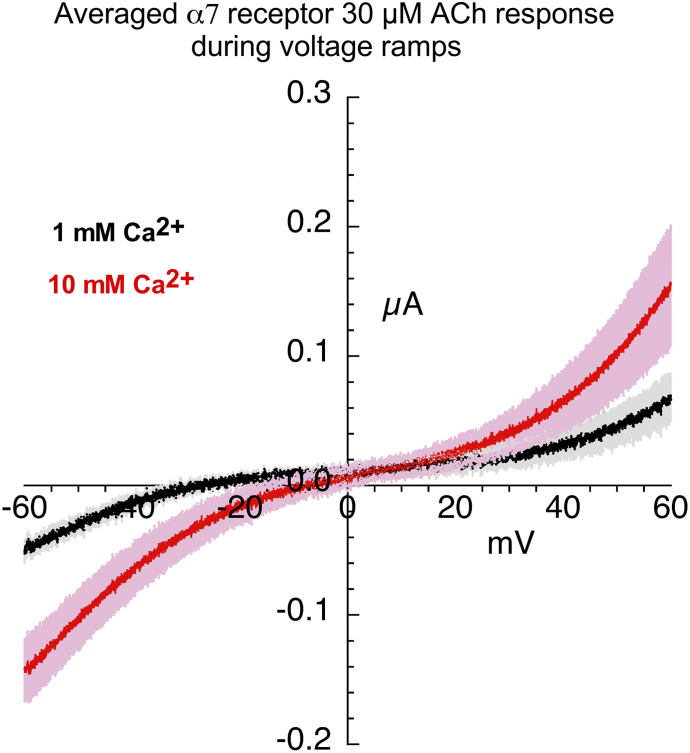
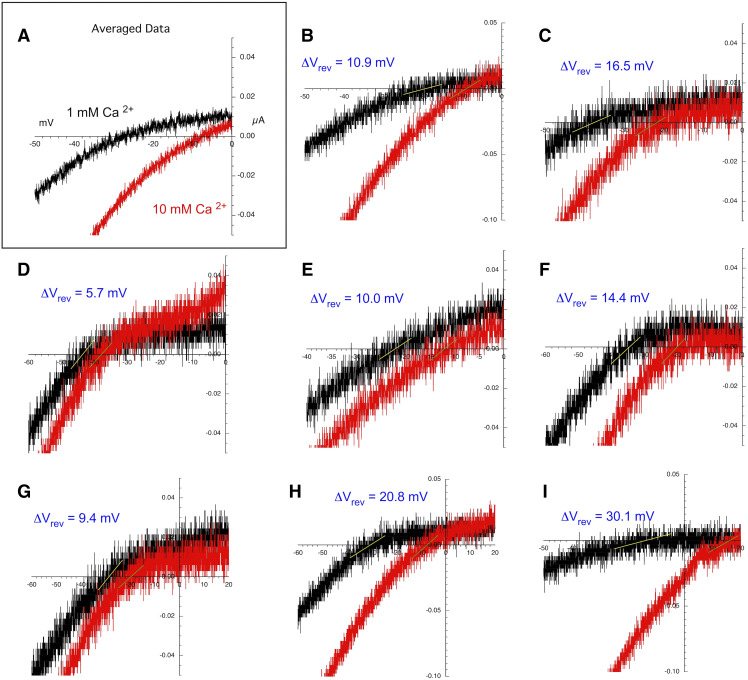
Although the responses to 30 µM ACh alone are smaller than the 60 µM ACh controls, the responses are also somewhat slower, making it more practical to time a voltage ramp during the evoked responses. Shown in Fig. 2 are the averaged responses to 30 µM ACh during voltage ramps in chloride-free Ringer’s solution with 1 or 10 mM calcium. The Vrev shift is clear when the averaged responses are plotted over a limited range (Fig. 3A). To obtain the average Vrev shift for the eight cells used in this experiment, the ramp data from each cell at the two conditions were plotted separately (Fig. 3, B–I; see Materials and Methods). The average Vrev shift (±S.D.) for the single cells (n = 8) in the experiment was 14.7 ± 7.7 mV (Table 2).
Fig. 2.
Current-voltage curves for 30 µM ACh-evoked responses of α7 nAChR. Averaged responses obtained during 1-second voltage ramps applied during applications of 30 µM ACh in the presence of chloride-free Ringer’s solution with either 1 (black line) or 10 mM calcium (red line). The gray and pink bands represent ± S.E.M. of the averaged data calculated at each point for the 1 and 10 mM experiments, respectively. The receptor-mediated responses were calculated by subtracting the currents produced by ramps delivered during the application of control chloride-free Ringer’s solution (either 1 or 10 mM calcium) from the responses during the voltage ramps while ACh was applied (see Materials and Methods).
Fig. 3.
Expanded scale of current-voltage curves for 30 µM ACh-evoked responses close to the reversal potentials. (A) Expanded scale of the averaged data from Fig. 2. (B–I) Current-voltage curves on expanded scales for each of the eight replicates that were used to calculate the average shown in (A). Calculated reversal potential shifts for each replicate are shown in each panel. This same procedure was applied to all the PAM-potentiated currents to generate the single cell reversal potential shifts that were used to calculate the average values in Table 2.
TABLE 2.
Reversal potential shifts in chloride-free Ringer’s solution
The replicate data to determine these values are shown in Fig. 3 for ACh and in the Supplemental Data for the PAM-potentiated currents. For ANOVA see Table 3.
| n | Mean | S.D. | |
|---|---|---|---|
| mV | |||
| ACh | 8 | 14.7 | 7.8 |
| PNU-120596 | 7 | 12.3 | 12.5 |
| GAT107 alone | 8 | 12.1 | 10.1 |
| GAT107 + ACh | 8 | −1.7 | 4.1 |
| B-973B alone | 5 | 8.3 | 8.3 |
| B-973B + ACh | 8 | 6.99 | 4.85 |
| TQS + ACh | 7 | 4.0 | 7.4 |
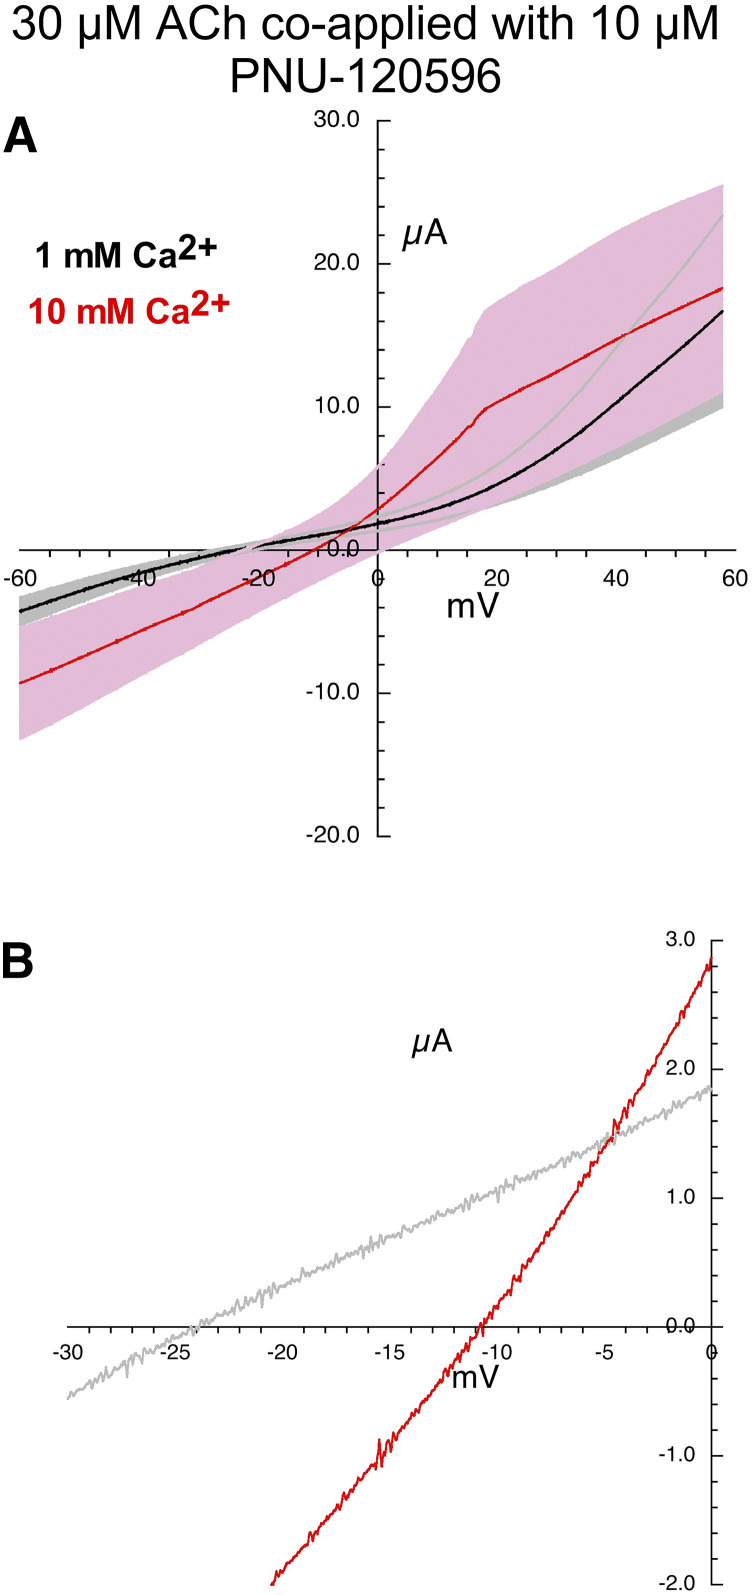
The averaged response during the voltage ramps when 30 µM ACh was coapplied with 10 µM PNU-120596 in the two different calcium solutions are shown in Fig. 4. Consistent with the large overlap of the S.E.M. in the averaged responses, the analysis of current-voltage (I-V) curves of the single cells (following the procedure illustrated in Fig. 3) gave an average shift (±S.D.) that was positive but showed a large variance (12.3 ± 12.5 mV), Tables 2 and 3.
Fig. 4.
Current-voltage curves for α7 nAChR responses evoked by the coapplication of 30 µM ACh and 10 µM PNU-120596. (A) Averaged responses obtained during 1-second voltage ramps applied during the coapplications in the presence of chloride-free Ringer’s solution with either 1 (black line) or 10 mM calcium (red line). The gray and pink bands represent ± S.E.M. of the averaged data calculated at each point for the 1 and 10 mM experiments, respectively. The receptor-mediated responses were calculated by subtracting the currents produced by ramps delivered during the application of control chloride-free Ringer’s solution (either 1 or 10 mM calcium) from the responses during the voltage ramps while drugs were applied. (B) Expanded scale of average current-voltage curves for 30 µM ACh and 10 µM PNU-120596–evoked responses close to the reversal potentials. Data for the individual replicates are provided in Supplemental Fig. 1.
TABLE 3.
ANOVA of reversal potential shift data
Tukey’s HSD for multiple comparisons. Analysis of variance indicates a significant effect due to condition, P = 0.0078. Group comparisons that were found to be significantly different were 30 µM ACh vs. 30 µM ACh + 10 µM GAT107, 10 µM GAT107 vs. 30 µM ACh + 10 µM GAT107, and 30 µM ACh + 10 µM PNU-120596.
| Group 1 | Group 2 | CI, lower | Difference between groups | CI, upper | Adjusted P value |
|---|---|---|---|---|---|
| ACh alone | B-973B + ACh | −4.911 | 7.746 | 20.404 | 0.497 |
| ACh alone | GAT alone | −10.048 | 2.610 | 15.267 | 0.995 |
| ACh alone | GAT + ACh | 3.794 | 16.452aa | 29.109 | 0.004 |
| ACh alone | PNU | −10.694 | 2.408 | 15.510 | 0.997 |
| ACh alone | TQS | −2.366 | 10.736 | 23.838 | 0.173 |
| ACh alone | B-973B alone | −8.042 | 6.390 | 20.822 | 0.816 |
| B-973B + ACh | GAT alone | −17.794 | −5.136 | 7.521 | 0.869 |
| B-973B + ACh | GAT + ACh | −3.952 | 8.706 | 21.363 | 0.357 |
| B-973B + ACh | PNU | −18.440 | −5.338 | 7.764 | 0.867 |
| B-973B + ACh | TQS | −10.112 | 2.990 | 16.092 | 0.992 |
| B-973B + ACh | B-973B alone | −15.788 | −1.356 | 13.076 | 1.000 |
| GAT alone | GAT + ACh | 1.184 | 13.842aa | 26.499 | 0.024 |
| GAT alone | PNU | −13.304 | −0.202 | 12.900 | 1.000 |
| GAT alone | TQS | −4.975 | 8.126 | 21.228 | 0.481 |
| GAT alone | B-973B alone | −10.652 | 3.780 | 18.212 | 0.983 |
CI, confidence interval
Significantly different.
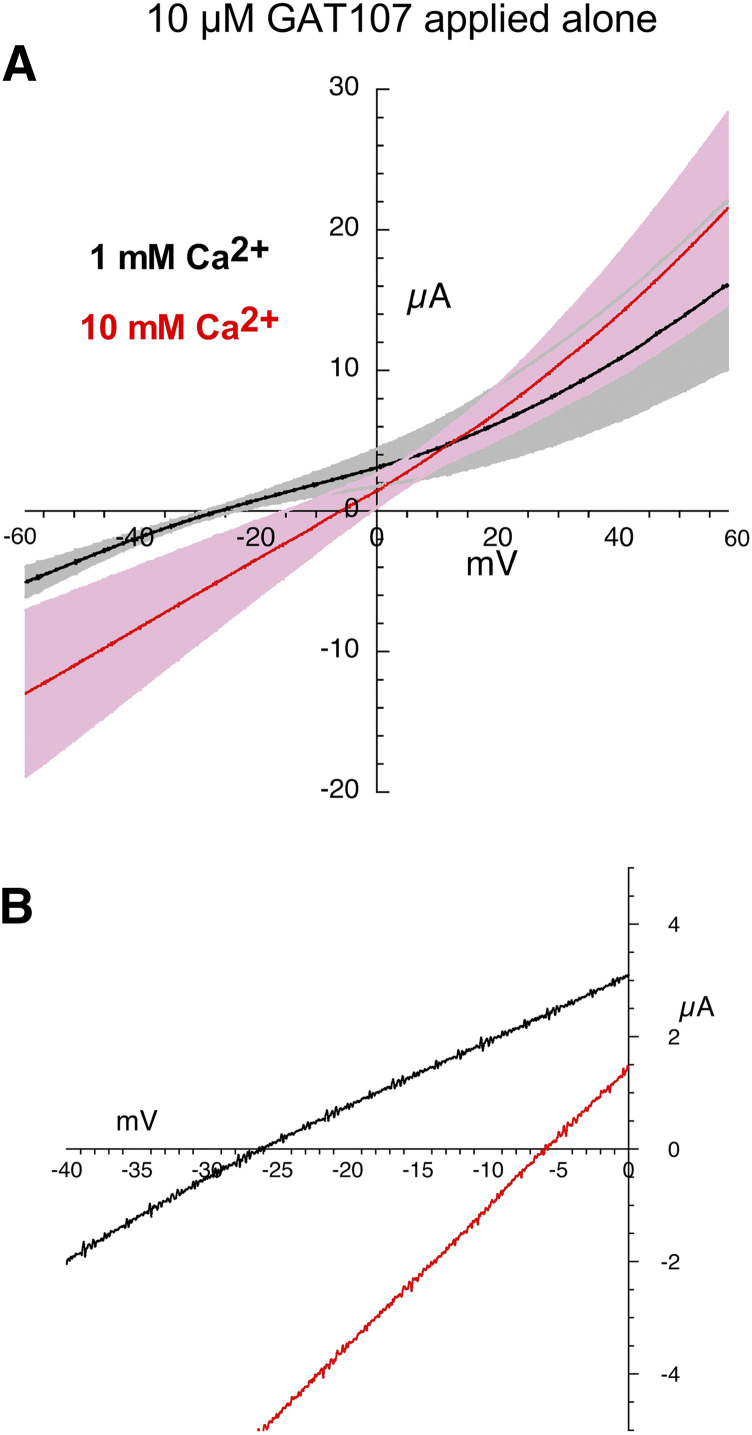
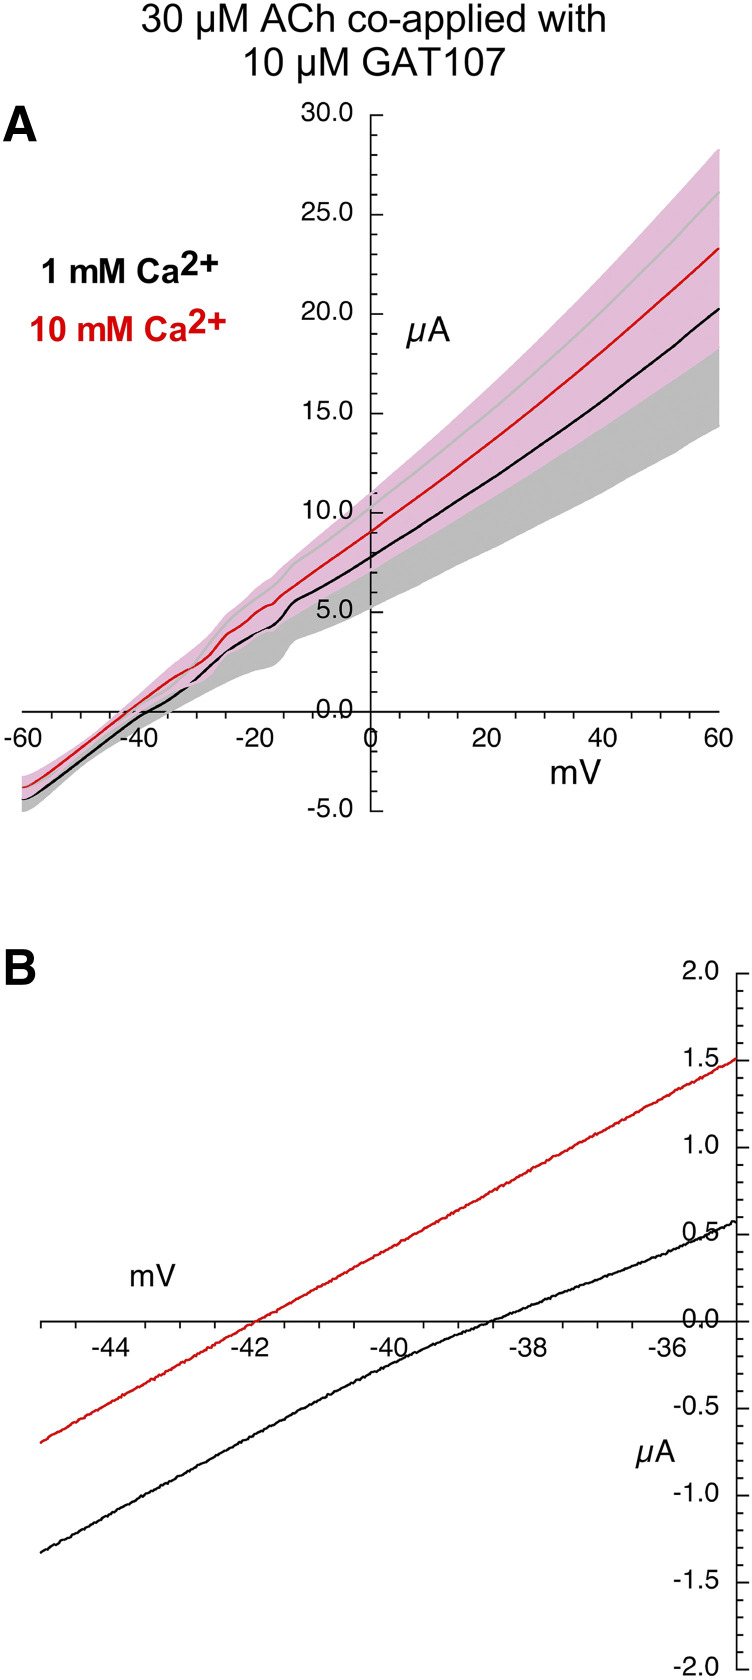
Likewise, the Vrev shift in the currents generated by the application of GAT107 alone (Fig. 5; Table 2) was accompanied by a large variance and produced a similar Vrev shift compared with ACh alone (one-way ANOVA, Tukey’s HSD adjusted P value = 0.9951, Table 3). In contrast, we observed essentially no shift in the Vrev values for the highly linear I-V curves for the current activated by coapplication of ACh and GAT107 compared with ACh or GAT107 alone (one-way ANOVA, Tukey’s HSD adjusted P value = 0.0040 ACh alone vs. ACh + GAT107, Tukey’s HSD adjusted P value = 0.0239 GAT107 alone vs. ACh + GAT107, Fig. 6; Tables 2 and 3).
Fig. 5.
Current-voltage curves for α7 nAChR responses evoked by the application of 10 µM GAT107. (A) Averaged responses obtained during 1-second voltage ramps applied during the coapplications in the presence of chloride-free Ringer’s solution with either 1 (black line) or 10 mM calcium (red line). The gray and pink bands represent ± S.E.M. of the averaged data calculated at each point for the 1 and 10 mM experiments, respectively. The receptor-mediated responses were calculated by subtracting the currents produced by ramps delivered during the application of control chloride-free Ringer’s solution (either 1 or 10 mM calcium) from the responses during the voltage ramps while drugs were applied. (B) Expanded scale of average current-voltage curves for 10 µM GAT107-evoked responses close to the reversal potentials. Data for the individual replicates are provided in Supplemental Fig. 2.
Fig. 6.
Current-voltage curves for α7 nAChR responses evoked by the coapplication of 30 µM ACh and 10 µM GAT107. (A) Averaged responses obtained during 1-second voltage ramps applied during the coapplications in the presence of chloride-free Ringer’s solution with either 1 (black line) or 10 mM calcium (red line). The gray and pink bands represent ± S.E.M. of the averaged data calculated at each point for the 1 and 10 mM experiments, respectively. The receptor-mediated responses were calculated by subtracting the currents produced by ramps delivered during the application of control chloride-free Ringer’s solution (either 1 or 10 mM calcium) from the responses during the voltage ramps while drugs were applied. (B) Expanded scale of average current-voltage curves for responses by coapplication of 30 µM ACh and 10 µM GAT107 close to the reversal potentials. Data for the individual replicates are provided in Supplemental Fig. 3.
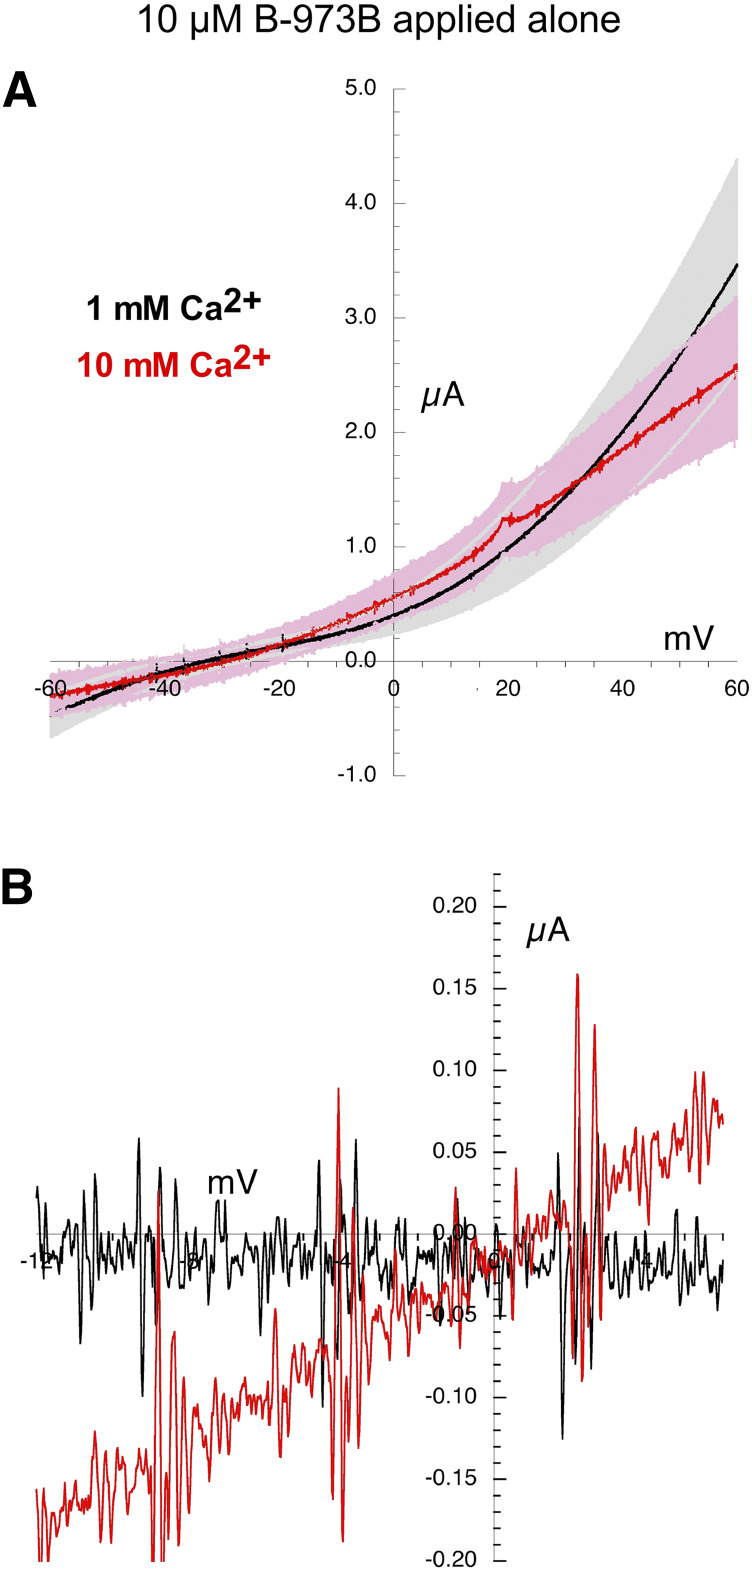
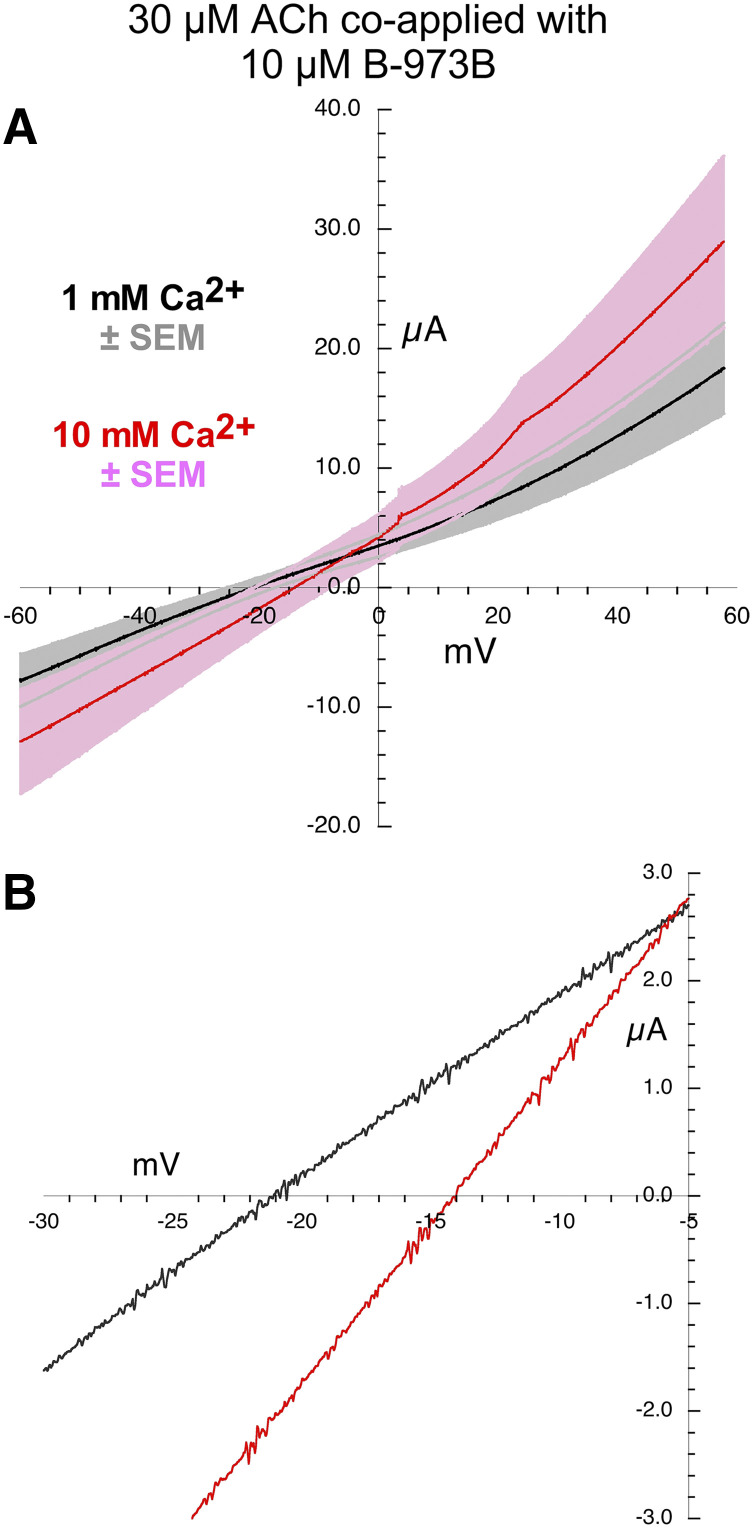
There was a relatively small Vrev shift in the currents generated by the application of the alternative ago-PAM B-973B when applied alone(Fig. 7). However, the currents were outward rectifying, and the shift measured in the replicates were variable (Table 2), so not statistically different from the ACh controls (Table 3). The I-V curves were more linear when B-973B was coapplied with 30 µM ACh (Fig. 8), and the Vrev shift was significantly less than seen with the ACh controls (P < 0.05, Tables 2 and 3).
Fig. 7.
Current-voltage curves for α7 nAChR responses evoked by the application of 10 µM of the ago-PAM B-973B. (A) Averaged responses obtained during 1-second voltage ramps applied during the coapplications in the presence of chloride-free Ringer’s solution with either 1 (black line) or 10 mM calcium (red line). The gray and pink bands represent ± S.E.M. of the averaged data calculated at each point for the 1 and 10 mM experiments, respectively. The receptor-mediated responses were calculated by subtracting the currents produced by ramps delivered during the application of control chloride-free Ringer’s solution (either 1 or 10 mM calcium) from the responses during the voltage ramps while drugs were applied. (B) Expanded scale of average current-voltage curves for 10 µM B-973B–evoked responses close to the reversal potentials. Data for the individual replicates are provided in Supplemental Fig. 4.
Fig. 8.
Current-voltage curves for α7 nAChR responses evoked by the coapplication of 30 µM ACh and 10 µM B-973B. (A) Averaged responses obtained during 1-second voltage ramps applied during the coapplications in the presence of chloride-free Ringer’s solution with either 1 (black line) or 10 mM calcium (red line). The gray and pink bands represent ± S.E.M. of the averaged data calculated at each point for the 1 and 10 mM experiments, respectively. The receptor-mediated responses were calculated by subtracting the currents produced by ramps delivered during the application of control chloride-free Ringer’s solution (either 1 or 10 mM calcium) from the responses during the voltage ramps while drugs were applied. (B) Expanded scale of average current-voltage curves for responses by coapplication of 30 µM ACh and 10 µM B-973B close to the reversal potentials. Data for the individual replicates are provided in Supplemental Fig. 5.
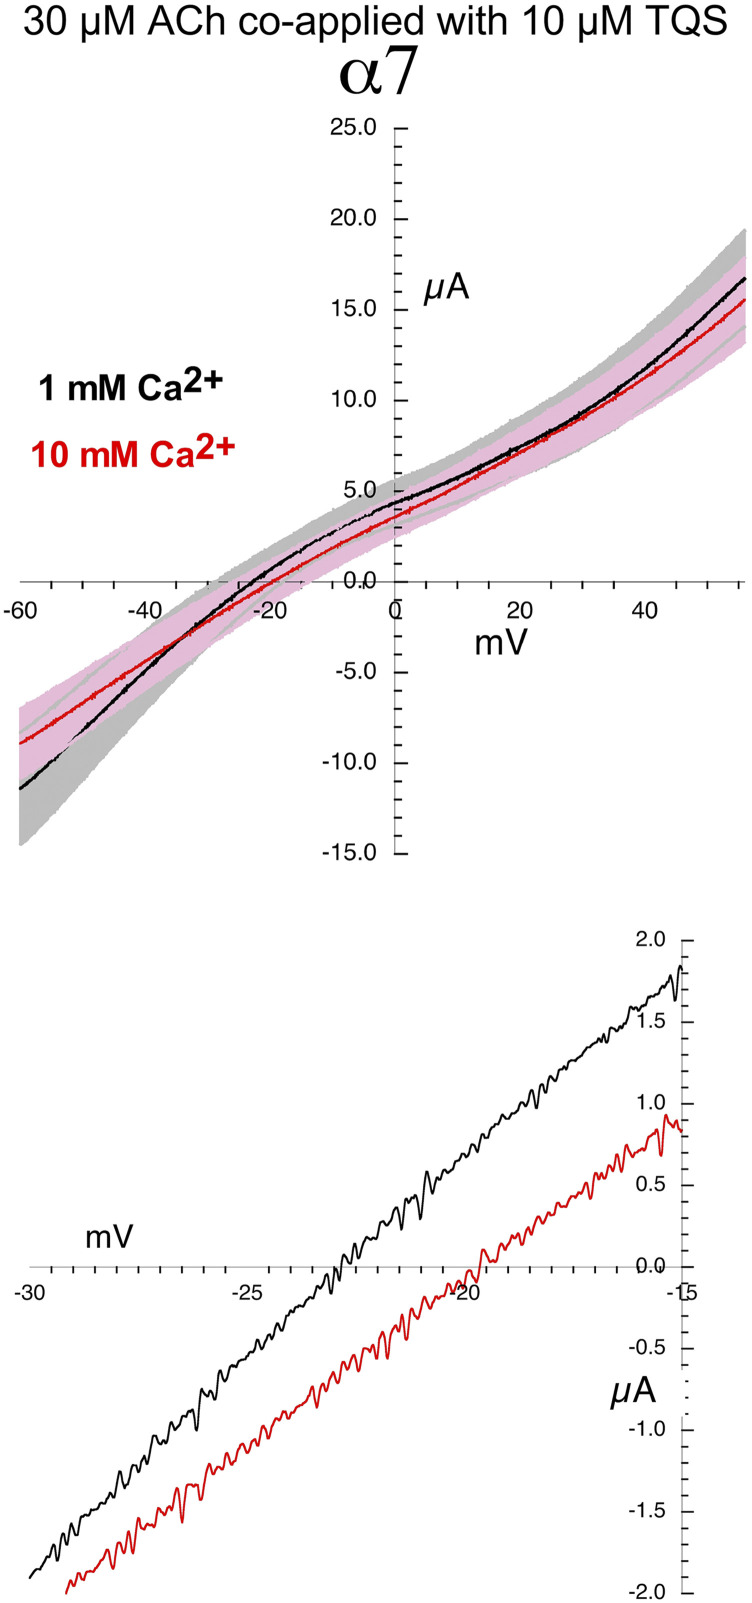
The averaged Vrev shift for currents stimulated by 30 µM ACh coapplied with 10 µM TQS to cells expressing α7 were also smaller than for currents evoked by ACh alone (Fig. 9), and the analysis of I-V curves of the single cells, following the procedure illustrated in Fig. 3, gave an average shift of only 4.0 ± 2.81 mV (Table 2), trending smaller, but not significantly (one-way ANOVA, Tukey’s HSD adjusted P value = 0.1733, Table 3), than the currents evoked by ACh alone.
Fig. 9.
Current-voltage curves for α7 nAChR responses evoked by the coapplication of 30 µM ACh and 10 µM TQS. (A)Averaged responses obtained during 1-second voltage ramps applied during the coapplications in the presence of chloride-free Ringer’s solution with either 1 (black line) or 10 mM calcium (red line). The gray and pink bands represent ± S.E.M. of the averag ed data calculated at each point for the 1 and 10 mM experiments, respectively. The receptor-mediated responses were calculated by subtracting the currents produced by ramps delivered during the application of control chloride-free Ringer’s solution (either 1 or 10 mM calcium) from the responses during the voltage ramps while drugs were applied. (B) Expanded scale of average current-voltage curves for responses by coapplication of 30 µM ACh and 10 µM TQS close to the reversal potentials. Data for the individual replicates are provided in Supplemental Fig. 6.
Alternative Analysis of Calcium Concentration Effects on Reversal Potentials.
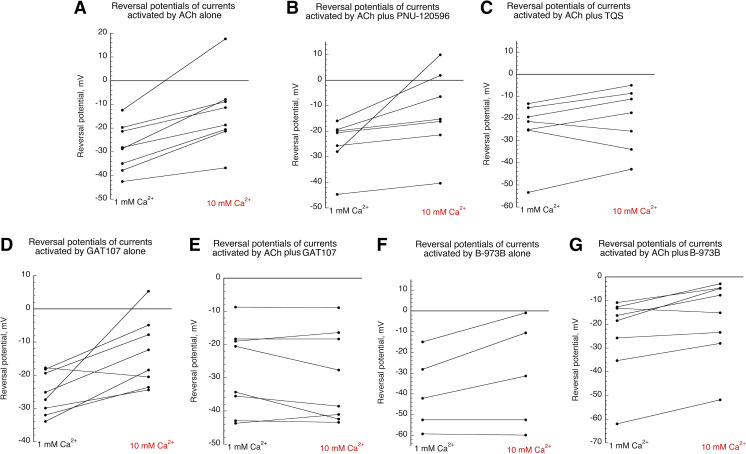
Although the ANOVA described above examines reversal potential shifts among all the different conditions, it is also an important question to ask whether there is an effect of calcium on Vrev under any one given condition. Figure 10 shows the interpolated reversal potentials for every cell under the various conditions (see also Fig. 3 and Supplemental Data). In each case, the way to ask this would be with paired t tests, and for ACh alone the P value for that test is 0.00104 (Table 4), indicating a significant effect of calcium. However, we are testing multiple conditions, so we applied a Bonferroni correction for multiple comparisons (Aickin and Gensler, 1996), multiplying the P value by the number of comparisons, in this case 7. That correction, applied in the attached table suggests a significant effect of calcium on reversal potentials only for ACh alone and ACh + B-973B.
Fig. 10.
Reversal potentials of single cell currents (taken from Fig. 3 and Supplemental Data) plotted for the different conditions. (A) Reversal potentials of currents activated by 30 µM ACh alone in 1 or 10 mM Ca2+ chloride-free Ringer’s solution. (B) Reversal potentials of currents activated by 30 µM ACh coapplied with 10 µM PNU-120596 in 1 or 10 mM Ca2+ chloride-free Ringer’s solution. (C) Reversal potentials of currents activated by 30 µM ACh coapplied with 10 µM TQS in 1 or 10 mM Ca2+ chloride-free Ringer’s solution. (D) Reversal potentials of currents activated by 10 GAT107 applied alone in 1 or 10 mM Ca2+ chloride-free Ringer’s solution. (E) Reversal potentials of currents activated by 30 µM ACh coapplied with 10 µM GAT107 in 1 or 10 mM Ca2+ chloride-free Ringer’s solution. (F) Reversal potentials of currents activated by 10 B-973B applied alone in 1 or 10 mM Ca2+ chloride-free Ringer’s solution. (G) Reversal potentials of currents activated by 30 µM ACh coapplied with 10 µM B-973B in 1 or 10 mM Ca2+ chloride-free Ringer’s solution.
TABLE 4.
Calcium dependence of reversal potentials determined by paired t tests (two tailed) and corrected for multiple comparisons
| Condition | Vrev in 1 mM Ca2+ | Vrev in 10 mM Ca2+ | P (uncorrected) | P (corrected) |
|---|---|---|---|---|
| ACh alone | −28.2 | −13.47 | 0.00104 | 0.00728* |
| B-973B + ACh | −24.3 | −17.3 | 0.0047 | 0.0329* |
| GAT107 alone | −25.5 | −13.3 | 0.012 | 0.084 |
| GAT107 + ACh | −27.9 | −29.6 | 0.27 | 1.89 |
| TQS + ACh | −24.7 | −20.7 | 0.20 | 1.4 |
| PNU120596 + ACh | −24.8 | −12.5 | 0.040 | 0.28 |
| B-973B alone | −39.4 | −31.1 | 0.087 | 0.609 |
*significantly different
Predicted Current Flux for PAM-Potentiated Single-Channel Currents.
We have recently reported single-channel burst properties for the two ago-PAMs used in these studies, GAT107 and B973-B (Quadri et al., 2019). In the case of GAT107, bursts averaged 1.6 seconds in duration, 10 pA in amplitude, and had an intraburst Popen of 0.9. That calculates as 14 pC of charge per burst. The estimate of Fucile et al. (2003) is that 11% of the α7 current stimulated by ACh in cells transfected (without exogenous RIC-3) is calcium, whereas Uteshev (2010) estimated that calcium is 8.3% of the ACh-evoked α7 current in neurons. We calculated what the impact of a single burst of GAT107-potentiated activation would be on intracellular calcium if the PAM-potentiated currents had calcium permeability similar to ACh-evoked currents.
If we take 10% as a ballpark number, then there would be 1.4 × 10⁻⁹ coulombs of calcium-associated charge and, assuming two charges per calcium ion, 0.7 × 10⁻⁹ coulomb of calcium. With 6.2 × 10¹⁸ charges in a coulomb, that would be 3.4 × 10⁹ calcium ions per burst or 5.6 × 10⁻¹⁵ mol. If the volume of 10 µm cell = 5.236 × 10⁻¹³ l, then the hypothetical maximum calcium increase from a single burst of channel openings would be 10 mM. Of course, this would be an impossible increase for a real cell. First of all, just 1.4 pC of charge would produce a 70 mV depolarization of a 25 µm diameter cell, so that only a fraction of charge in a GAT107-activated burst would fully depolarize a cell that was not voltage-clamped. The result would be that the cell’s membrane potential would reach the channel’s reversal potential, thus reducing the driving force for further calcium flow. However, the current associated with such a burst might easily equilibrate intracellular and extracellular calcium for a small cell. Although we have no way to tell if there were immediate effects on a cells’ health in the patch-clamp experiments, there were no overt indications of cytotoxicity in the cellular calcium experiments, consistent with a large reduction in calcium permeability.
Analysis of Current Inward Rectification.
Differences in rectification between ACh-evoked and PAM-potentiated currents are suggested by visual inspection of the data (Compare Fig. 2 with Figs. 4–9). A loss of inward rectification has previously been reported for PNU-120596–potentiated currents (Sitzia et al., 2011; Peng et al., 2013) but not for the other PAMs used in these studies. Additionally, it should be noted that we are using different ionic conditions than those used in previous studies. The inward rectification of nAChR has previously been associated with intracellular polyamines (Haghighi and Cooper, 1998, 2000), and it is possible that the ionic activity of these intracellular organic cations might be different when methanesulfonate is the counter ion rather than chloride. Therefore, we quantified the rectification under our various experimental conditions. Specifically, we measured the conductance values in two different ranges, −50 to −40 and 0 to +10 mV. Conduction within this range is of most physiologic relevance since, as noted above, once the driving force has been depleted there would be no further receptor-mediated depolarization and any further current would in any case be hyperpolarizing.
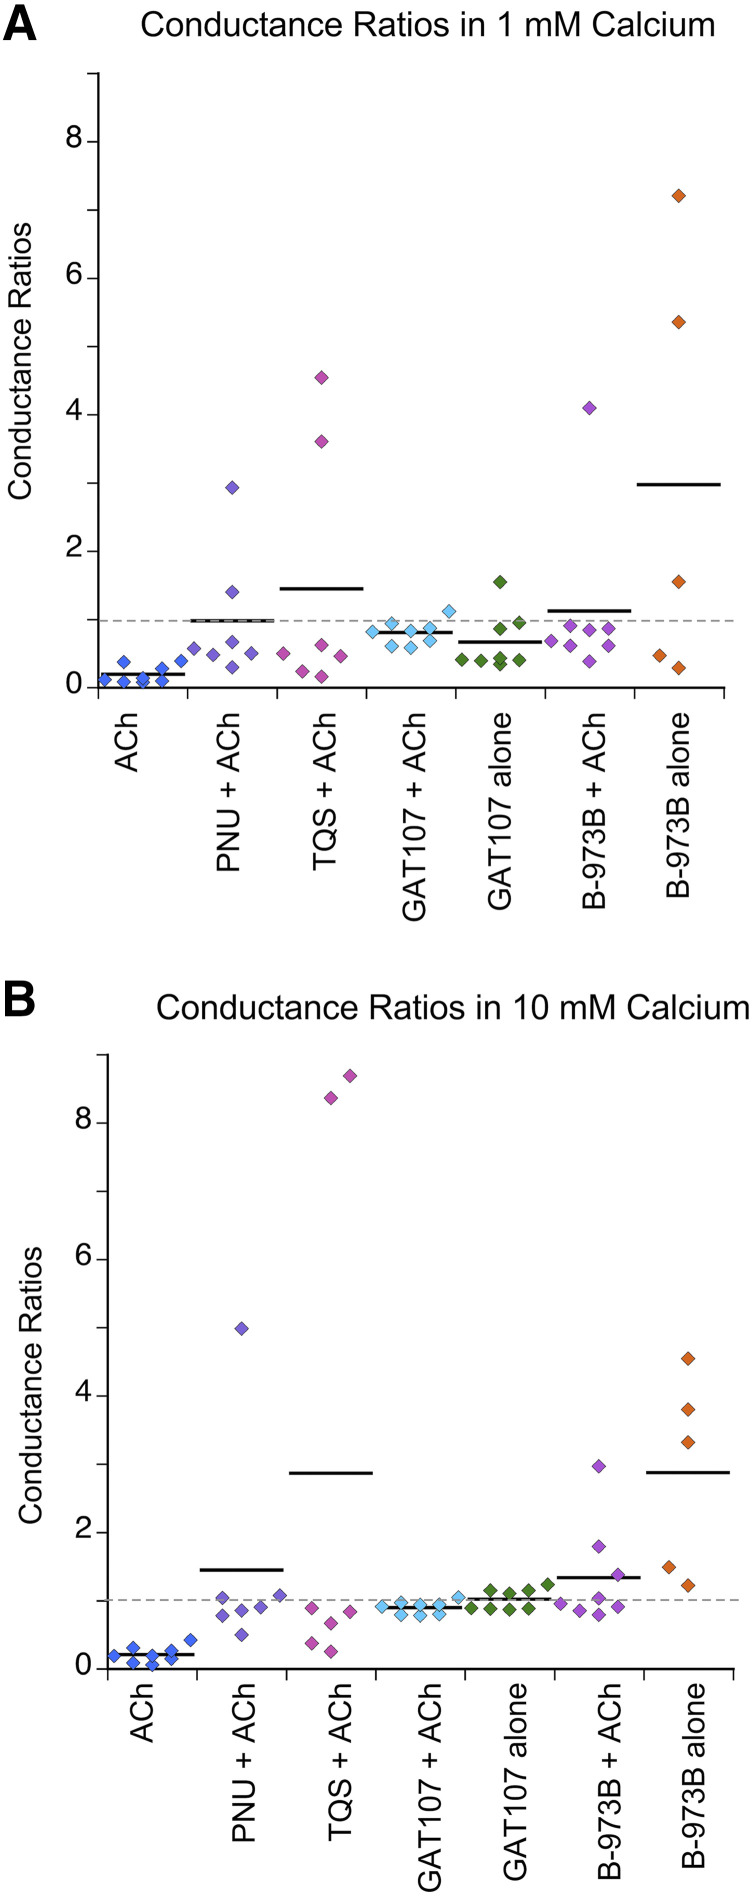
Conductance ratios of less than 1 were expected for current showing inward rectification. The average conductance ratios for all of the PAM-potentiated currents were more than twice that for the currents activated by ACh alone (Fig. 11; Table 5). The most direct test for differences in conductance values in the two voltage ranges was with paired (two-tailed) t tests for the replicates under each condition. The P values were adjusted for multiple comparisons by applying a Bonferroni correction factor (Aickin and Gensler, 1996) and are provided in Table 5. Consistent with the visual inspection of the data, significant effects of voltage on conductance was indicated only for the currents stimulated by ACh alone (P < 0.0001 in both calcium concentrations).
Fig. 11.
Conductance ratios. (A) Ratios of the conductances measured in the range of 0 to +10 mV relative to conductance measured for −50 to −40 mV in 1 mM calcium chloride-free Ringer’s solution. Plotted are the values from the individual replicates with the bars representing the averages under each condition. See Table 5 for the S.D.s. (B) Ratios of the conductances measured in the range of 0 to +10 mV relative to conductance measured for −50 to −40 mV in 10 mM calcium chloride-free Ringer’s solution. Plotted are the values from the individual replicates with the bars representing the averages under each condition. See Table 5 for the S.D.s.
TABLE 5.
Rectification
Comparisons of conductances at −50 to −40 and 0–10 mV. Voltage dependence of conductance determined by paired t tests (two tailed) and corrected for multiple comparisons.
| Conductance ratioa | P value uncorrected | P value corrected | |
|---|---|---|---|
| 1 mM calcium | |||
| ACh | 0.197 ± 0.132a | 0.000088 | 0.0006** |
| PNU-120596 + ACh | 0.981 ± 0.929 | 0.9 | 6.31 |
| TQS + ACh | 1.454 ± 1.82 | 0.442 | 3.09 |
| GAT107 + ACh | 0.808 ± 0.178 | 0.061 | 0.429 |
| GAT107 alone | 0.670 ± 0.425 | 0.326 | 2.28 |
| B-973B + ACh | 1.13 ± 1.21 | 0.561 | 3.93 |
| B-973B alone | 2.98 ± 3.13 | 0.554 | 3.88 |
| 10 mM calcium | |||
| ACh | 0.211 ± 0.120 | 0.000006 | 0.000046** |
| PNU-120596 + ACh | 1.45 ± 1.57 | 0.408 | 2.86 |
| TQS + ACh | 2.87 ± 3.87 | 0.816 | 5.72 |
| GAT107 + ACh | 0.901 ± 0.097 | 0.028 | 0.193 |
| GAT107 alone | 1.02 ± 0.153 | 0.307 | 2.15 |
| B-973B + ACh | 1.34 ± 0.738 | 0.272 | 1.9 |
| B-973B alone | 2.88 ± 1.46 | 0.045 | 0.314 |
Averages ± S.D.
P < 0.001.
Calcium Signals in HEK 293 Cells Expressing α7.
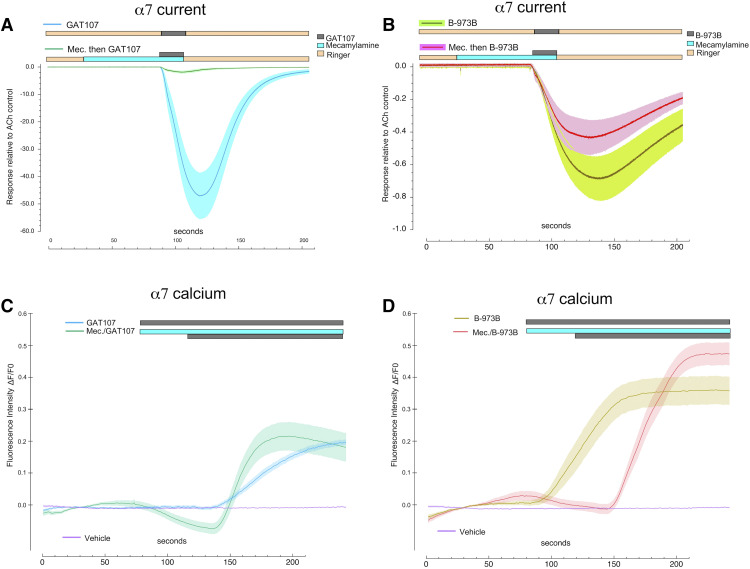
We have previously used α7-expressing HEK A7R3HC10 cells to study PAM-potentiated current responses, which were large and occurred immediately upon drug application (Williams et al., 2011a). We used ago-PAMs and A7R3HC10 cells to study the relationship between receptor activation and intracellular calcium levels. Working as allosteric activators, these agents would be free of the complex interactions between ACh and PAM concentrations (Williams et al., 2011a), and the burst characteristics of these ago-PAMs have been characterized in these cells (Quadri et al., 2019). Moreover, the use of these two specific agents with their known differences in sensitivity to the channel blocker mecamylamine provided a method for testing the direct role of channel activation in the calcium signals. Allosteric activation of α7 receptors in oocytes by 10 µM GAT107 was very effectively blocked by pre- and coapplication of 10 µM mecamylamine (Fig. 12A); peak currents were reduced 95% and net charge by 97%. In contrast, mecamylamine had a much smaller effect on the currents that were allosterically activated by 10 µM B-973B, reducing peak currents and net charge by only 22% and 14%, respectively (Fig. 12B). It may also be noted that at this concentration, the allosteric activation by B-973B was much lower than that produced by GAT107. Normalized to ACh controls, B-973B peak currents were 1.3%, and net charge responses were 3.2% those of the GAT107 responses. It has been previously shown (Quadri et al., 2019) that in the absence of mecamylamine, B-973B–evoked currents showed several open states of differing single-channel conductance. In the presence of mecamylamine, only a single open state was observed, and the increased frequency of openings to the mecamylamine-resistant open state compensated for the absence of opening to the other states, so the net charge of the single-channel bursts was relatively unaffected.
Fig. 12.
Activation of α7 and increases in intracellular calcium by ago-PAMs. (A) The α7-mediated current response in oocytes expressing α7 and RIC-3 (n = 7) to 10 µM GAT107, and the effects of 10 µM mecamylamine preapplied and then coapplied with the pulse of GAT107. (B) The α7-mediated current response in oocytes expressing α7 and RIC-3 (n = 7) to 10 µM B-973B, and the effects of 10 µM mecamylamine preapplied and then coapplied with the pulse of B-973B. (C) Calcium measurements in HEK A7R3HC10 cells that were stably transfected with α7 and RIC-3 and loaded with 5 µM Oregon Green BAPTA-1 AM (Williams et al., 2011a, 2012; Quadri et al., 2019) in response to bath application of 10 µM GAT107 alone or with 10 µM mecamylamine preapplied and coapplied with GAT107. (D) Calcium measurements in HEK A7R3HC10 cells that were stably transfected with α7 and RIC-3 (Williams et al., 2011a, 2012; Quadri et al., 2019) loaded with 5 µM Oregon Green BAPTA-1 AM, in response to bath application of 10 µM B-973B alone or with 10 µM mecamylamine preapplied and coapplied with 10 µM B-973B.
To evaluate the effects of α7 ago-PAMs on intracellular calcium, coverslips with A7R3HC10 cells were placed in a perfusion chamber of the same volume as our oocyte chamber (350 µl) and perfused with ago-PAM solutions at the same rate as used in the oocyte experiments (2 ml/min). Although we cannot make direct comparisons, it is interesting to note that the application of 10 µM GAT107 produced large increases in intracellular calcium, but only after a delay (Fig. 12C), in contrast to the rapid current response in oocytes perfused in a similar manner (Fig. 12A). Whereas the α7 currents evoked by GAT107 were largely blocked by a pre- and coapplication of 10 µM mecamylamine (Fig. 12A), the calcium increases were, if anything, accelerated by the preapplication of the channel blocker mecamylamine (one-way ANOVA for rise time, Tukey’s HSD adjusted P value = 0.0282 GAT107 vs. GAT107 + mecamylamine, Fig. 12C).
We conducted similar experiments with the alternative ago-PAM B-973B, which is largely insensitive to block by mecamylamine (Quadri et al., 2019) (Fig. 12B). Increases in calcium were larger (one-way ANOVA for peak amplitude, Tukey’s HSD adjusted P value = 0.00003 for GAT107 + mecamylamine vs. B-973B, 0.003 for GAT107 vs. B973B + mecamylamine, and 0.0000005 for GAT107 + mecamylamine vs. B-973B + mecamylamine) and earlier (one-way ANOVA for peak time, Tukey’s HSD adjusted P value = 0.000000004 for GAT107 vs. B973B) with this mecamylamine-resistant ago-PAM (Fig. 12D) than with GAT107, but still with a delay of about 30 seconds after the application of the ago-PAM, and with no significant effect of mecamylamine preapplication on rise time (one-way ANOVA for rise time, Tukey’s HSD adjusted P value = 0.84869 for B-973B vs. B-973B + mecamylamine). See Supplemental Information for ANOVA.
Discussion
There are two primary forms of ion-mediated signaling accomplished by ligand-gated channels. Positive and negative monovalent ions primarily regulate membrane potential and subsequently control the activity of voltage-gated ion channels, neuronal excitability, and short-term synaptic function. Divalent ions, in contrast, and calcium, in particular, catalyze intracellular processes that can result in long-term changes in cell function or survival. This dichotomy of ionic signaling is best exemplified by differences in functional roles of NMDA-sensitive and -insensitive glutamate receptors (Traynelis et al., 2010). Whereas the NMDA-insensitive AMPA and kainate-type glutamate receptors are the primary mediators of basic excitatory transmission, NMDA-type receptors, which are highly permeable to calcium and only conduct current under depolarizing conditions, work as coincidence detectors and are essential for neuroplastic phenomena such as long-term potentiation. This dichotomy in glutamate receptor signaling was of such importance to the evolution of vertebrate brain function that a special mechanism of RNA editing is required to limit the calcium permeability of the most common AMPA-type glutamate receptors, which are composed of GluA1 and GluA2 subunits. GluA1 can form homomeric receptors but normally coassembles with GluA2 subunits. The homomeric GluA1 receptors, like most heteromeric nAChRs, have inward rectifying I-V relationships and significant calcium permeability, whereas naturally occurring GluA1-GluA2 receptors are calcium impermeant with linear I-V curves (Hollmann et al., 1991). This suggests that the GluA2 subunit evolved specifically to limit the calcium permeability of AMPA-type glutamate receptors.
As noted earlier, the properties of current rectification and calcium permeability are correlated in both glutamate receptors and nAChRs (Francis and Papke, 1996; Haghighi and Cooper, 2000). Our data confirm that a reduced inward rectification of PAM-potentiated α7 responses may also correlate to reduced calcium permeability.
It may be noted that the first report of α7’s high calcium permeability (Séguéla et al., 1993) reported a Vrev shift of 29 ± 3 mV, claiming a PCa2+:PNa+ of approximately 20, and a later study (Tapia et al., 2007) reported a shift or 28.6 ± 2.4, but curiously found a similar value for α4(3)β2(2) receptors, unusually high for any heteromeric nAChR. Although it is something of a challenge to clearly identify reversal potentials when the currents are so strongly rectifying, the reason for the differences from the earlier reports and the present study are unclear. One factor regarding the α7 data, however, is that in the earlier studies the α7 receptors were not coexpressed with RIC-3, a natural chaperone protein of neuron receptors (Alexander et al., 2010), and the calcium permeability of α7 nAChR in neurons, which have RIC-3 and/or the alternative chaperone NACHO (Matta et al., 2017), has been found to be lower than what was reported in the early oocyte studies cited above (Castro and Albuquerque, 1995; Fayuk and Yakel, 2005; Uteshev, 2010). In fact, Castro et al. reported that the Vrev shift from 1 to 10 mM calcium was only 5.6 ± 0.4 for α-bungarotoxin–sensitive currents in hippocampal neurons, which are believed to be mediated by α7 nAChR (Castro and Albuquerque, 1995).
Numerous structural features of nAChR have been identified that can regulate calcium permeability, most notably subunit composition, as in muscle-type receptors (Francis and Papke, 1996) or α4β2-containing neuronal receptors (Gerzanich et al., 1998; Tapia et al., 2007). Site-directed mutagenesis studies have identified single residues in the α7 extracellular (Colón-Sáez and Yakel, 2014) and transmembrane (Bertrand et al., 1993; Fucile et al., 2000) domains that can change calcium permeability. The pathologic condition known as autosomal dominant nocturnal frontal lobe epilepsy has also been associated with naturally occurring mutations in α4β2-containing nAChR that can change calcium permeability (Kuryatov et al., 1997). All of these features would presumably be able to directly affect the ion channel or the vestibular sites that control permeation.
Although ligand-dependent differences in channel conductance are well documented for glutamate receptors (Traynelis et al., 2010), prior to the recent studies of α7 PAMs, they have been less commonly reported for nAChR. Curare and tubocurarine have been reported to induce subconductances (Trautmann, 1983; Strecker and Jackson, 1989), and occasional subconductance states have been observed with muscle receptors (Hamill and Sakmann, 1981; Auerbach and Sachs, 1984). For α7 receptor currents activated by the ago-PAMs used (Quadri et al., 2019), the two different agents each induced unique fingerprints of full and subconductance states. The dominant feature for both ago-PAMs, though, was the sporadic occurrence of long-duration bursts. The impact a single such burst would have on the calcium concentration of a small (25 µm) cell, if the receptor had significant calcium permeability, would be enormous. The fact that PAMs and ago-PAMs have been successfully used for in vivo preclinical studies without overt cytotoxic effects (Munro et al., 2012; Freitas et al., 2013; Bagdas et al., 2016; Donvito et al., 2017) is consistent with our data that indicate PAM-potentiated α7 currents have reduced calcium permeability and therefore are not likely to produce excitotoxicity related to channel-mediated calcium influx. Another important factor that may limit any potential excitotoxic effects of α7 PAMs is that, at least in the case of PNU-120596, they have a high temperature sensitivity and are relatively ineffective at increasing α7 currents at 37°C (Sitzia et al., 2011; Williams et al., 2012).
It is notable that for most of the PAM-potentiated currents there was large variance among the data from individual cells, an observation we have previously reported (Williams et al., 2011a; Horenstein et al., 2016; Quadri et al., 2019). The reason for this is not entirely clear but may relate to the nature of the PAM activity on the level of single-channel currents (Williams et al., 2012; Peng et al., 2013; Andersen et al., 2016; Quadri et al., 2019) that relies on extremely large increases in the single-channel open probability of a relatively low number of channels. The concept of Popen can refer to the chance that a channel will open at all (Population Popen), or the percent of the time a channel is open once it has transitioned from the closed state to the bursting state (Burst Popen). PAM-potentiated α7 receptors have, in fact, a very low Population Popen, but once they have entered the bursting state, they remain in that bursting state for a relatively long period of time (seconds), exhibiting a high Burst Popen. Responses are therefore associated with a small and fluctuating number of channels in high Popen bursts. Although this might, at least in part, account for the consistently observed variability in magnitude of PAM-potentiated α7 currents (Table 1), it is unlikely to relate to variability in calcium-dependent reversal potential shifts (Table 2) or conductance ratios observed (Fig. 11; Table 5). Another special feature of PAM-potentiated single-channel currents is that they vary in the frequency of full and subconductance states, and these states might also vary in their calcium conductances or rectification, and so differences in the character of the bursts could then influence these factors.
Our experiments suggest dissociation between the kinetics for α7 activation and subsequent increases in intracellular calcium. Studies of α7 receptor function in nerve cells and for in vivo cognitive effects (Briggs et al., 2009) typically rely on the assumption that the only important conformational state is that in which the ion channel is activated and mediating depolarization and potentially calcium influx. However, in both neuron-like (King et al., 2018) and nonneuronal cells, consistent with our results, there is good evidence that the calcium signals associated with α7 receptor activation are not directly associated with current through the receptor itself but through intracellular calcium release mechanisms commonly associated with G-protein pathways and the release of calcium from intracellular stores (Dajas-Bailador et al., 2002; Feuerbach et al., 2005; Ween et al., 2010). It is interesting to note that gene expression might also be affected by nicotinic receptor activation independent of ion conductance (Dunckley and Lukas, 2006; Hosur et al., 2009). The present results confirm and extend the previous studies suggesting a dissociation between α7 receptor channel activation and intracellular signal transduction processes that may be associated with increases in intracellular calcium. This could be particularly relevant to the cholinergic anti-inflammatory pathway, which relies on α7 receptors in immune cells that are incapable of channel activation (Bagdas et al., 2018).
Many different α7 PAMs have been identified (Williams et al., 2011b; Gill et al., 2012; Newcombe et al., 2018), and in the present study we looked at just a few. However, our data suggest that the currents produced in the presence of specific PAMs will vary in the degree to which they will affect the two forms of ion-mediated signaling, and this is a feature that should be considered for the therapeutic development of specific agents.
Abbreviations
- ACh
acetylcholine
- ago-PAM
allosteric agonist–positive allosteric modulator
- B-973B
3-(3,4-difluorophenyl)-N-(1-(6-(4-(pyridin-2-yl)piperazin-1-yl)pyrazin-2-yl)ethyl)propenamide
- GAT107
(3aR,4S,9bS)-4-(4-bromophenyl)-3a,4,5,9b-tetrahydro-3H-cyclopenta[c]quinoline-8-sulfonamide
- HSD
honestly significant difference
- I-V
current-voltage
- nAChR
nicotinic acetylcholine receptor
- PAM
positive allosteric modulator
- PNU-120596
1-(5-chloro-2,4-dimethoxy-phenyl)-3-(5-methyl-isoxazol-3-yl)-urea
- RIC-3
resistance-to-cholinesterase 3
- TQS
3a,4,5,9b-tetrahydro-4-(1-naphthalenyl)-3H-cyclopentan[c]quinoline-8-sulfonamide
- Vrev
reversal potential
Authorship Contributions
Participated in research design: Miller, Khoshbouei, Stokes, Papke.
Conducted experiments: Miller, Stokes.
Contributed new reagents or analytic tools: Garai, Cantwell, Thakur.
Performed data analysis: Miller, Khoshbouei, Stokes, Papke.
Wrote or contributed to the writing of the manuscript: Miller, Khoshbouei, Stokes, Papke.
Footnotes
This research was supported by National Institutes of Health Institute of General Medical Sciences [Grant GM57481] (to C.S. and R.L.P.), National Institute on Drug abuse [Grant DA026947] (to H.K. and D.R.M.), National Institute of Neurologic Disorders and Stroke [Grant NS071122] (to D.R.M.), and National Eye Institute [Grant EY024717] (to S.G., L.N.C., and G.T.).
 This article has supplemental material available at molpharm.aspetjournals.org.
References
- Aickin M, Gensler H. (1996) Adjusting for multiple testing when reporting research results: the Bonferroni vs Holm methods. Am J Public Health 86:726–728. [DOI] [PMC free article] [PubMed] [Google Scholar]
- Alexander JK, Sagher D, Krivoshein AV, Criado M, Jefford G, Green WN. (2010) Ric-3 promotes alpha7 nicotinic receptor assembly and trafficking through the ER subcompartment of dendrites. J Neurosci 30:10112–10126. [DOI] [PMC free article] [PubMed] [Google Scholar]
- Andersen ND, Nielsen BE, Corradi J, Tolosa MF, Feuerbach D, Arias HR, Bouzat C. (2016) Exploring the positive allosteric modulation of human α7 nicotinic receptors from a single-channel perspective. Neuropharmacology 107:189–200. [DOI] [PubMed] [Google Scholar]
- Auerbach A, Sachs F. (1984) Single-channel currents from acetylcholine receptors in embryonic chick muscle. Kinetic and conductance properties of gaps within bursts. Biophys J 45:187–198. [DOI] [PMC free article] [PubMed] [Google Scholar]
- Bagdas D, Gurun MS, Flood P, Papke RL, Damaj MI. (2018) New insights on neuronal nicotinic acetylcholine receptors as targets for pain and inflammation: a focus on α7 nAChRs. Curr Neuropharmacol 16:415–425. [DOI] [PMC free article] [PubMed] [Google Scholar]
- Bagdas D, Wilkerson JL, Kulkarni A, Toma W, AlSharari S, Gul Z, Lichtman AH, Papke RL, Thakur GA, Damaj MI. (2016) The α7 nicotinic receptor dual allosteric agonist and positive allosteric modulator GAT107 reverses nociception in mouse models of inflammatory and neuropathic pain. Br J Pharmacol 173:2506–2520. [DOI] [PMC free article] [PubMed] [Google Scholar]
- Bertrand D, Galzi JL, Devillers-Thiéry A, Bertrand S, Changeux JP. (1993) Mutations at two distinct sites within the channel domain M2 alter calcium permeability of neuronal alpha 7 nicotinic receptor. Proc Natl Acad Sci U S A 90:6971–6975. [DOI] [PMC free article] [PubMed] [Google Scholar]
- Briggs CA, Grønlien JH, Curzon P, Timmermann DB, Ween H, Thorin-Hagene K, Kerr P, Anderson DJ, Malysz J, Dyhring T, et al. (2009) Role of channel activation in cognitive enhancement mediated by alpha7 nicotinic acetylcholine receptors. Br J Pharmacol 158:1486–1494. [DOI] [PMC free article] [PubMed] [Google Scholar]
- Castro NG, Albuquerque EX. (1995) alpha-Bungarotoxin-sensitive hippocampal nicotinic receptor channel has a high calcium permeability. Biophys J 68:516–524. [DOI] [PMC free article] [PubMed] [Google Scholar]
- Colón-Sáez JO, Yakel JL. (2014) A mutation in the extracellular domain of the α7 nAChR reduces calcium permeability. Pflugers Arch 466:1571–1579. [DOI] [PMC free article] [PubMed] [Google Scholar]
- Dajas-Bailador FA, Mogg AJ, Wonnacott S. (2002) Intracellular Ca2+ signals evoked by stimulation of nicotinic acetylcholine receptors in SH-SY5Y cells: contribution of voltage-operated Ca2+ channels and Ca2+ stores. J Neurochem 81:606–614. [DOI] [PubMed] [Google Scholar]
- Donvito G, Bagdas D, Toma W, Rahimpour E, Jackson A, Meade JA, AlSharari S, Kulkarni AR, Ivy Carroll F, Lichtman AH, et al. (2017) The interaction between alpha 7 nicotinic acetylcholine receptor and nuclear peroxisome proliferator-activated receptor-α represents a new antinociceptive signaling pathway in mice. Exp Neurol 295:194–201. [DOI] [PMC free article] [PubMed] [Google Scholar]
- Dunckley T, Lukas RJ. (2006) Nicotinic modulation of gene expression in SH-SY5Y neuroblastoma cells. Brain Res 1116:39–49. [DOI] [PubMed] [Google Scholar]
- Fayuk D, Yakel JL. (2005) Ca2+ permeability of nicotinic acetylcholine receptors in rat hippocampal CA1 interneurones [published correction appears in J Physiol (2005) 568:1067]. J Physiol 566:759–768. [DOI] [PMC free article] [PubMed] [Google Scholar]
- Feuerbach D, Lingenhöhl K, Dobbins P, Mosbacher J, Corbett N, Nozulak J, Hoyer D. (2005) Coupling of human nicotinic acetylcholine receptors alpha 7 to calcium channels in GH3 cells. Neuropharmacology 48:215–227. [DOI] [PubMed] [Google Scholar]
- Francis MM, Papke RL. (1996) Muscle-type nicotinic acetylcholine receptor delta subunit determines sensitivity to noncompetitive inhibitors, while gamma subunit regulates divalent permeability. Neuropharmacology 35:1547–1556. [DOI] [PubMed] [Google Scholar]
- Freitas K, Ghosh S, Ivy Carroll F, Lichtman AH, Imad Damaj M. (2013) Effects of α7 positive allosteric modulators in murine inflammatory and chronic neuropathic pain models. Neuropharmacology 65:156–164. [DOI] [PMC free article] [PubMed] [Google Scholar]
- Fucile S, Palma E, Mileo AM, Miledi R, Eusebi F. (2000) Human neuronal threonine-for-leucine-248 alpha 7 mutant nicotinic acetylcholine receptors are highly Ca2+ permeable. Proc Natl Acad Sci USA 97:3643–3648. [DOI] [PMC free article] [PubMed] [Google Scholar]
- Fucile S, Renzi M, Lax P, Eusebi F. (2003) Fractional Ca(2+) current through human neuronal alpha7 nicotinic acetylcholine receptors. Cell Calcium 34:205–209. [DOI] [PubMed] [Google Scholar]
- Garai S, Raja KS, Papke RL, Deschamps JR, Damaj MI, Thakur GA. (2018) B-973, a novel α7 nAChR ago-PAM: racemic and asymmetric synthesis, electrophysiological studies, and in vivo evaluation. ACS Med Chem Lett 9:1144–1148. [DOI] [PMC free article] [PubMed] [Google Scholar]
- Gerzanich V, Wang F, Kuryatov A, Lindstrom J. (1998) Alpha 5 Subunit alters desensitization, pharmacology, Ca++ permeability and Ca++ modulation of human neuronal alpha 3 nicotinic receptors. J Pharmacol Exp Ther 286:311–320. [PubMed] [Google Scholar]
- Gill JK, Dhankher P, Sheppard TD, Sher E, Millar NS. (2012) A series of α7 nicotinic acetylcholine receptor allosteric modulators with close chemical similarity but diverse pharmacological properties. Mol Pharmacol 81:710–718. [DOI] [PMC free article] [PubMed] [Google Scholar]
- Goodwin JS, Larson GA, Swant J, Sen N, Javitch JA, Zahniser NR, De Felice LJ, Khoshbouei H. (2009) Amphetamine and methamphetamine differentially affect dopamine transporters in vitro and in vivo. J Biol Chem 284:2978–2989. [DOI] [PMC free article] [PubMed] [Google Scholar]
- Grønlien JH, Håkerud M, Ween H, Thorin-Hagene K, Briggs CA, Gopalakrishnan M, Malysz J. (2007) Distinct profiles of alpha7 nAChR positive allosteric modulation revealed by structurally diverse chemotypes. Mol Pharmacol 72:715–724. [DOI] [PubMed] [Google Scholar]
- Guerra-Álvarez M, Moreno-Ortega AJ, Navarro E, Fernández-Morales JC, Egea J, López MG, Cano-Abad MF. (2015) Positive allosteric modulation of alpha-7 nicotinic receptors promotes cell death by inducing Ca(2+) release from the endoplasmic reticulum. J Neurochem 133:309–319. [DOI] [PubMed] [Google Scholar]
- Haghighi AP, Cooper E. (1998) Neuronal nicotinic acetylcholine receptors are blocked by intracellular spermine in a voltage-dependent manner. J Neurosci 18:4050–4062. [DOI] [PMC free article] [PubMed] [Google Scholar]
- Haghighi AP, Cooper E. (2000) A molecular link between inward rectification and calcium permeability of neuronal nicotinic acetylcholine alpha3beta4 and alpha4beta2 receptors. J Neurosci 20:529–541. [DOI] [PMC free article] [PubMed] [Google Scholar]
- Halevi S, Yassin L, Eshel M, Sala F, Sala S, Criado M, Treinin M. (2003) Conservation within the RIC-3 gene family. Effectors of mammalian nicotinic acetylcholine receptor expression. J Biol Chem 278:34411–34417. [DOI] [PubMed] [Google Scholar]
- Hamill OP, Sakmann B. (1981) Multiple conductance states of single acetylcholine receptor channels in embryonic muscle cells. Nature 294:462–464. [DOI] [PubMed] [Google Scholar]
- Hollmann M, Hartley M, Heinemann S. (1991) Ca2+ permeability of KA-AMPA--gated glutamate receptor channels depends on subunit composition. Science 252:851–853. [DOI] [PubMed] [Google Scholar]
- Horenstein NA, Papke RL. (2017) Anti-inflammatory silent agonists. ACS Med Chem Lett 8:989–991. [DOI] [PMC free article] [PubMed] [Google Scholar]
- Horenstein NA, Papke RL, Kulkarni AR, Chaturbhuj GU, Stokes C, Manther K, Thakur GA. (2016) Critical molecular determinants of α7 nicotinic acetylcholine receptor allosteric activation: separation of direct allosteric activation and positive allosteric modulation. J Biol Chem 291:5049–5067. [DOI] [PMC free article] [PubMed] [Google Scholar]
- Hosur V, Leppanen S, Abutaha A, Loring RH. (2009) Gene regulation of alpha4beta2 nicotinic receptors: microarray analysis of nicotine-induced receptor up-regulation and anti-inflammatory effects. J Neurochem 111:848–858. [DOI] [PubMed] [Google Scholar]
- King JR, Ullah A, Bak E, Jafri MS, Kabbani N. (2018) Ionotropic and metabotropic mechanisms of allosteric modulation of α7 nicotinic receptor intracellular calcium. Mol Pharmacol 93:601–611. [DOI] [PMC free article] [PubMed] [Google Scholar]
- Kulkarni AR, Thakur GA. (2013) Microwave-assisted expeditious and efficient synthesis of cyclopentene ring-fused tetrahydroquinoline derivatives using three-component povarov reaction. Tetrahedron Lett 54:6592–6595. [DOI] [PMC free article] [PubMed] [Google Scholar]
- Kuryatov A, Gerzanich V, Nelson M, Olale F, Lindstrom J. (1997) Mutation causing autosomal dominant nocturnal frontal lobe epilepsy alters Ca2+ permeability, conductance, and gating of human alpha4beta2 nicotinic acetylcholine receptors. J Neurosci 17:9035–9047. [DOI] [PMC free article] [PubMed] [Google Scholar]
- Li Y, Papke RL, He Y-J, Millard WJ, Meyer EM. (1999) Characterization of the neuroprotective and toxic effects of alpha7 nicotinic receptor activation in PC12 cells. Brain Res 830:218–225. [DOI] [PubMed] [Google Scholar]
- Matta JA, Gu S, Davini WB, Lord B, Siuda ER, Harrington AW, Bredt DS. (2017) NACHO mediates nicotinic acetylcholine receptor function throughout the brain. Cell Rep 19:688–696. [DOI] [PubMed] [Google Scholar]
- Miller DR, Lebowitz JJ, Guenther DT, Refowich AJ, Hansen C, Maurer AP, Khoshbouei H. (2019) Methamphetamine regulation of activity and topology of ventral midbrain networks. PLoS One 14:e0222957. [DOI] [PMC free article] [PubMed] [Google Scholar]
- Munro G, Hansen R, Erichsen H, Timmermann D, Christensen J, Hansen H. (2012) The α7 nicotinic ACh receptor agonist compound B and positive allosteric modulator PNU-120596 both alleviate inflammatory hyperalgesia and cytokine release in the rat. Br J Pharmacol 167:421–435. [DOI] [PMC free article] [PubMed] [Google Scholar]
- Newcombe J, Chatzidaki A, Sheppard TD, Topf M, Millar NS. (2018) Diversity of nicotinic acetylcholine receptor positive allosteric modulators revealed by mutagenesis and a revised structural model. Mol Pharmacol 93:128–140. [DOI] [PMC free article] [PubMed] [Google Scholar]
- Papke RL. (2014) Merging old and new perspectives on nicotinic acetylcholine receptors. Biochem Pharmacol 89:1–11. [DOI] [PMC free article] [PubMed] [Google Scholar]
- Papke RL, Porter Papke JK. (2002) Comparative pharmacology of rat and human alpha7 nAChR conducted with net charge analysis. Br J Pharmacol 137:49–61. [DOI] [PMC free article] [PubMed] [Google Scholar]
- Papke RL, Stokes C. (2010) Working with OpusXpress: methods for high volume oocyte experiments. Methods 51:121–133. [DOI] [PMC free article] [PubMed] [Google Scholar]
- Papke RL, Thinschmidt JS. (1998) The correction of alpha7 nicotinic acetylcholine receptor concentration-response relationships in Xenopus oocytes. Neurosci Lett 256:163–166. [DOI] [PubMed] [Google Scholar]
- Peng C, Kimbrell MR, Tian C, Pack TF, Crooks PA, Fifer EK, Papke RL. (2013) Multiple modes of α7 nAChR noncompetitive antagonism of control agonist-evoked and allosterically enhanced currents. Mol Pharmacol 84:459–475. [DOI] [PMC free article] [PubMed] [Google Scholar]
- Quadri M, Garai S, Thakur GA, Stokes C, Gulsevin A, Horenstein NA, Papke RL. (2019) Macroscopic and microscopic activation of α7 nicotinic acetylcholine receptors by the structurally unrelated allosteric agonist-positive allosteric modulators (ago-PAMs) B-973B and GAT107. Mol Pharmacol 95:43–61. [DOI] [PMC free article] [PubMed] [Google Scholar]
- Sawilowsky SS. (2009) New effect size rules of thumb. J Mod Appl Stat Methods 8:597–599. [Google Scholar]
- Séguéla P, Wadiche J, Dineley-Miller K, Dani JA, Patrick JW. (1993) Molecular cloning, functional properties, and distribution of rat brain alpha 7: a nicotinic cation channel highly permeable to calcium. J Neurosci 13:596–604. [DOI] [PMC free article] [PubMed] [Google Scholar]
- Sitzia F, Brown JT, Randall AD, Dunlop J. (2011) Voltage- and temperature-dependent allosteric modulation of α7 nicotinic receptors by PNU120596. Front Pharmacol 2:81. [DOI] [PMC free article] [PubMed] [Google Scholar]
- Stokes C, Garai S, Kulkarni AR, Cantwell LN, Noviello CM, Hibbs RE, Horenstein NA, Abboud KA, Thakur GA, Papke RL. (2019) Heteromeric neuronal nicotinic acetylcholine receptors with mutant β subunits acquire sensitivity to α7-selective positive allosteric modulators. J Pharmacol Exp Ther 370:252–268. [DOI] [PMC free article] [PubMed] [Google Scholar]
- Strecker GJ, Jackson MB. (1989) Curare binding and the curare-induced subconductance state of the acetylcholine receptor channel. Biophys J 56:795–806. [DOI] [PMC free article] [PubMed] [Google Scholar]
- Tapia L, Kuryatov A, Lindstrom J. (2007) Ca2+ permeability of the (alpha4)3(beta2)2 stoichiometry greatly exceeds that of (alpha4)2(beta2)3 human acetylcholine receptors. Mol Pharmacol 71:769–776. [DOI] [PubMed] [Google Scholar]
- Thakur GA, Kulkarni AR, Deschamps JR, Papke RL. (2013) Expeditious synthesis, enantiomeric resolution and enantiomer functional characterization of (4-(4-bromophenyl)-3a, 4, 5, 9b-tetrahydro-3H-cyclopenta[c]quinoline-8-sulfonamide (4BP-TQS): an allosteric agonist-positive allosteric modulator of α7 nicotinic acetylcholine receptors. J Med Chem 56:8943–8947. [DOI] [PMC free article] [PubMed] [Google Scholar]
- Timmermann DB, Sandager-Nielsen K, Dyhring T, Smith M, Jacobsen AM, Nielsen EØ, Grunnet M, Christensen JK, Peters D, Kohlhaas K, et al. (2012) Augmentation of cognitive function by NS9283, a stoichiometry-dependent positive allosteric modulator of α2- and α4-containing nicotinic acetylcholine receptors. Br J Pharmacol 167:164–182. [DOI] [PMC free article] [PubMed] [Google Scholar]
- Trautmann A. (1983) Tubocurarine, a partial agonist for cholinergic receptors. J Neural Transm Suppl 18:353–361. [PubMed] [Google Scholar]
- Traynelis SF, Wollmuth LP, McBain CJ, Menniti FS, Vance KM, Ogden KK, Hansen KB, Yuan H, Myers SJ, Dingledine R. (2010) Glutamate receptor ion channels: structure, regulation, and function. Pharmacol Rev 62:405–496. [DOI] [PMC free article] [PubMed] [Google Scholar]
- Uteshev VV. (2010) Evaluation of Ca2+ permeability of nicotinic acetylcholine receptors in hypothalamic histaminergic neurons. Acta Biochim Biophys Sin (Shanghai) 42:8–20. [DOI] [PMC free article] [PubMed] [Google Scholar]
- Wallace TL, Ballard TM, Pouzet B, Riedel WJ, Wettstein JG. (2011) Drug targets for cognitive enhancement in neuropsychiatric disorders. Pharmacol Biochem Behav 99:130–145. [DOI] [PubMed] [Google Scholar]
- Ween H, Thorin-Hagene K, Andersen E, Grønlien JH, Lee CH, Gopalakrishnan M, Malysz J. (2010) Alpha3* and alpha 7 nAChR-mediated Ca2+ transient generation in IMR-32 neuroblastoma cells. Neurochem Int 57:269–277. [DOI] [PubMed] [Google Scholar]
- Williams DK, Peng C, Kimbrell MR, Papke RL. (2012) Intrinsically low open probability of α7 nicotinic acetylcholine receptors can be overcome by positive allosteric modulation and serum factors leading to the generation of excitotoxic currents at physiological temperatures. Mol Pharmacol 82:746–759. [DOI] [PMC free article] [PubMed] [Google Scholar]
- Williams DK, Wang J, Papke RL. (2011a) Investigation of the molecular mechanism of the α7 nicotinic acetylcholine receptor positive allosteric modulator PNU-120596 provides evidence for two distinct desensitized states. Mol Pharmacol 80:1013–1032. [DOI] [PMC free article] [PubMed] [Google Scholar]
- Williams DK, Wang J, Papke RL. (2011b) Positive allosteric modulators as an approach to nicotinic acetylcholine receptor-targeted therapeutics: advantages and limitations. Biochem Pharmacol 82:915–930. [DOI] [PMC free article] [PubMed] [Google Scholar]


