

Abstract
Machine learning models for medical image analysis often suffer from poor performance on important subsets of a population that are not identified during training or testing. For example, overall performance of a cancer detection model may be high, but the model may still consistently miss a rare but aggressive cancer subtype. We refer to this problem as hidden stratification, and observe that it results from incompletely describing the meaningful variation in a dataset. While hidden stratification can substantially reduce the clinical efficacy of machine learning models, its effects remain difficult to measure. In this work, we assess the utility of several possible techniques for measuring hidden stratification effects, and characterize these effects both via synthetic experiments on the CIFAR-100 benchmark dataset and on multiple real-world medical imaging datasets. Using these measurement techniques, we find evidence that hidden stratification can occur in unidentified imaging subsets with low prevalence, low label quality, subtle distinguishing features, or spurious correlates, and that it can result in relative performance differences of over 20% on clinically important subsets. Finally, we discuss the clinical implications of our findings, and suggest that evaluation of hidden stratification should be a critical component of any machine learning deployment in medical imaging.
Keywords: hidden stratification, machine learning, convolutional neural networks
CCS CONCEPTS: Computing methodologies → Machine learning
1. INTRODUCTION
Deep learning systems have shown remarkable promise in medical image analysis, often claiming performance rivaling that of human experts [13]. However, performance results reported in the literature may overstate the clinical utility and safety of these models. Specifically, it is well known that machine learning models often make mistakes that humans never would, despite having aggregate error rates comparable to or better than those of human experts. An example of this “inhuman” lack of common sense might include a high performance system that calls any canine in the snow a wolf, and one on grass a dog, regardless of appearance [31]. This property of machine learning models is likely to be of critical importance in medical practice, where specific types of errors can have serious clinical impacts.
Of particular concern is the fact that most medical machine learning models are built and tested using an incomplete set of possible labels—or schema—and that the training labels therefore only coarsely describe the meaningful variation within the population. Medical images contain dense visual information, and imaging diagnoses are usually identified by recognizing the combination of several different visual features or patterns. This means that any given pathology or variant defined as a “class” for machine learning purposes is often comprised of several visually and clinically distinct subsets; a “lung cancer” label, for example, would contain both solid and subsolid tumors, as well as central and peripheral neoplasms. We call this phenomenon hidden stratification, meaning that the data contains unrecognized subsets of cases which may affect model training, measured model performance, and most importantly the clinical outcomes related to the use of a medical image analysis system.
Worryingly, when these subsets are not labelled, even performance measurements on a held-out test set may be falsely reassuring. This is because the aggregate performance measures such as sensitivity (i.e. recall) or ROC-AUC can be dominated by larger subsets, obscuring the fact that there may be an unidentified subset of cases within which performance is poor. Given the rough medical truism that serious diseases are less common than mild diseases, it is even likely that underperformance in minority subsets could lead to disproportionate harm to patients.
In this article, we demonstrate that hidden stratification is a fundamental technical problem that has important implications for medical imaging analysis on multiple real-world datasets, and explore several possible techniques for measuring its effects. We first define three distinct approaches to measuring hidden stratification effects—schema completion, error auditing, and algorithmic measurement—and detail their relative strengths and weaknesses. We next apply schema completion to illustrate that hidden stratification is present in standard computer vision models trained on the CIFAR-100 benchmark dataset, and leverage this well-characterized dataset to empirically explore several possible causes of hidden stratification. We extend our analysis to medical imaging datasets by using a combination of schema completion, error auditing, and algorithmic measurement to show not only that hidden stratification can result in performance differences of up to 20% on clinically important subsets, but also that simple unsupervised learning approaches can help to identify these effects. Using these measurement techniques, we find evidence across multiple datasets that hidden stratification occurs on subsets characterized by a combination of low prevalence, poor label quality, subtle discriminative features, and spurious correlates.
Our results also suggest that more research is necessary on methods for mitigating hidden stratification. Though we show that approaches that require manual application of human expertise—such as schema completion and error auditing—have potential in practice, widespread use of such techniques is likely to be limited by cost. Algorithmic measurement approaches, on the other hand, require more limited human intervention, but are of variable performance and cannot yet guarantee the detection of important subsets. We examine the clinical implications of these findings, and argue that despite the associated challenges, measurement and reporting of hidden stratification effects should become a critical component of machine learning deployments in medicine.
Our paper is organized as follows: Section 2 contextualizes the hidden stratification problem with respect to related work, Section 3 defines three possible methods by which hidden stratification can be measured, Section 4 presents the results of experiments that apply these measurement techniques to multiple relevant datasets, and Section 5 discusses both the clinical implications of our findings and the limitations of our study.
2. RELATED WORK
Problems similar to hidden stratification have been observed or postulated in many domains, including traditional computer vision [30], fine-grained image recognition [39], genomics [7], and epidemiology (often termed “spectrum effects”) [23]. The difficulty of the hidden stratification problem fundamentally relates to the challenge of obtaining labelled training data. Were fine-grained labels available for every important variant that could be distinguished via a given data modality, discriminative model performance on important subsets could be improved by training and evaluating models using this information. Thus, typical approaches to observed stratification and dataset imbalance in medical machine learning often center on gathering more data on underperforming subsets, either via additional labelling, selective data augmentation, or oversampling [22]. However, the cost of manual labelling is often prohibitive, appropriate augmentation transforms can be difficult to define, and oversampling an underperforming subset can cause degradation on others [4, 14, 29, 41]. As a result, medical imagery analysts have commonly begun either to use semi-automated labelling techniques [10, 14, 18, 35] or to apply human expertise to produce a narrow or incomplete set of visual labels [26] rather than exhaustively labelling all possible findings and variations. Both of these approaches can yield reduced accuracy on important subsets [24]. Techniques that reliably increase performance on critical imaging subsets without degrading performance on others have yet to be demonstrated.
Methods that directly address hidden stratification, where the subclasses are obscure, have not been commonly explored in medical imaging analysis. However, it is clear from the recent literature that this issue has been widely (but not universally) recognized. The most common approach for measuring hidden stratification is by evaluating model performance on specific subsets. Gulshan et al. [16], for instance, present variations in retinopathy detection performance on subsets with images obtained in different locations, with differing levels of disease severity, and with different degrees of pupil dilation. In several cases, their models perform differently on these subsets in a manner that could be clinically impactful. Chilamkurthy et al. [9] present a subset analysis for different diagnostic categories of intracranial hemorrhage (e.g. subdural vs. subarachnoid) when designing a deep learning model for abnormality detection on head CT, but do not analyze differences in performance related to bleed size, location, or the acuity of the bleed. Their work does, however, evaluate the performance of models on cases with multiple findings, and observe substantial variation in model performance within different strata; for instance, subarachnoid bleed detection performance appears to degrade substantially in the presence of an epidural hemorrhage. Wang et al. [34] perform an excellent subset analysis of a colonoscopy polyp detector, with comparative performance analysis presented by polyp size, location, shape, and underlying pathology (e.g. adenoma versus hyperplastic). Similarly, Dunnmon et al. [11] report the performance of their chest radiograph triage system by pathology subtype, finding that models trained on binary triage labels achieved substantially lower performance on fracture than on other diseases. Non-causal confounding features such as healthcare process quantities can also contribute substantially to high model performance on data subsets heavily associated with these confounding variables [1, 2, 36, 41].
Instead of analyzing subsets defined a priori, Mahajan et al. [21] describe algorithmic audits, where detailed examinations of model errors can lead to model improvements. Several recent studies perform error audits, where specific failure modes such as small volume cancers, disease mimics, and treatment-related features are observed [6, 34]; such analyses may be helpful in identifying error modes via human review, but do not characterize the full space of subset performance [33]. There has been particular interest in formalizing algorithmic audit methods recently [25], although these initiatives have yet to be tailored to the medical setting.
Of course, there also exist multiple studies that do not directly address the effects of hidden stratification [3, 17]. Esteva et al. [12] is particularly notable, as this dataset is labelled for more than 2,000 diagnostic subclasses but the results presented only consider “top-level” diagnostic categories. Analysis of these effects would improve the community’s ability to assess the real-world clinical utility of these models.
3. METHODS FOR MEASURING HIDDEN STRATIFICATION
We explicitly define and evaluate three possible approaches to measure the clinical risk of hidden stratification: (1) exhaustive prospective human labeling of the data, called schema completion, (2) retrospective human analysis of model predictions, called error auditing, and (3) automated algorithmic measurement methods to detect hidden strata. Each of these methods is applied to the test dataset, allowing for analysis and reporting (e.g., for regulatory processes) of subclass (i.e. subset) performance.
Schema Completion:
In schema completion, the schema author prospectively prescribes a more complete set of subclasses that need to be labeled, and provides these labels on test data. Schema completion has many advantages, such as the ability to prospectively arrive at consensus on subclass definitions (e.g. a professional body could produce standards describing reporting expectations) to both enable accurate reporting and guide model development. However, schema completion is fundamentally limited by the understanding of the schema author; if important subclasses are omitted, schema completion does not protect against important clinical failures. Further, it can be time consuming (or practically impossible!) to exhaustively label all possible subclasses, which in a clinical setting might include subsets of varying diagnostic, demographic, clinical, and descriptive characteristics. Finally, a variety of factors including the visual artifacts of new treatments and previously unseen pathologies can render existing schema obsolete at any time.
Error Auditing:
In error auditing, the auditor examines model outputs for unexpected regularities, for example a difference in the distribution of a recognizable subclass in the correct and incorrect model prediction groups. Advantages of error auditing include that it is not limited by predefined expectations of schema authors, and that the space of subclasses considered is informed by model function. Rather than having to enumerate every possible subset, only subsets observed to be concerning are measured. While more labor-efficient than schema completion, error auditing is critically dependent on the ability of the auditor to visually recognize differences in the distribution of model outputs. It is therefore more likely that the non-exhaustive nature of audit could limit certainty that all important strata were analyzed. Of particular concern is the ability of error auditing to identify low-prevalence, high discordance subsets that may rarely occur but are clinically salient.
Algorithmic Measurement:
In algorithmic measurement approaches, the algorithm developer designs a method to search for subclasses automatically. In most cases, such algorithms will be unsupervised methods such as clustering. If any identified group (e.g. a cluster) underperforms compared to the overall superclass, then this may indicate the presence of a clinically relevant subclass. Clearly, the use of algorithmic approaches still requires human review in a manner that is similar to error auditing, but is less dependent on the specific human auditor to initially identify the stratification. While algorithmic approaches to measurement can reduce burden on human analysts and take advantage of learned encodings to identify subsets, their efficacy is limited by the separability of important subsets in the feature space analyzed.
4. EXPERIMENTS
In our experiments, we empirically measure the effect of hidden stratification using each of these approaches, and evaluate the characteristics of subsets on which these effects are important. Drawing from the existing machine learning literature, we hypothesize that there are several subset characteristics that contribute to degraded model performance in medical imaging applications: (1) low subset prevalence, (2) reduced label accuracy within the subset, (3) subtle discriminative features, and (4) spurious correlations [33]. These factors can be understood quite simply: if the subset has few examples or the training signal is noisy, then the expected performance will be reduced. Similarly, if one subset is characterized by features that are harder to learn, usual training procedures result in models that perform well on the “easy” subset. Finally, if one subset contains a feature that is correlated with the true label, but not causal, models often perform poorly on the subset without the spurious correlate.
To demonstrate the technical concept of hidden stratification in a well-characterized setting, we first use schema completion to demonstrate substantial hidden stratification effects in the CIFAR-100 benchmark dataset, and confirm that low subset prevalence and reduced subset label accuracy can reduce model performance on subsets of interest. We then use this same schema completion technique to evaluate clinically important hidden stratification effects in radiograph datasets describing hip fracture (which contains subsets with low prevalence and subtle discriminative features) and musculoskeletal extremity abnormalities (which contains subsets with poor label quality and subtle discriminative features). Each of these datasets has been annotated a priori with labels for important subclasses, and is thus amenable to schema completion. We then demonstrate how error auditing can be used to identify hidden stratification in a large public chest radiograph dataset that contains a spurious correlate. Finally, we show that a simple unsupervised clustering algorithm can provide value by separating the well-performing and poorly-performing subsets identified by our previous analysis.
Code describing these experiments is available at www.github.com/HazyResearch/hidden-stratification-mi.
4.1. Schema Completion
We first use schema completion to measure the effects of hidden stratification on CIFAR-100 [19], Adelaide Hip Fracture [15], and MURA [26] datasets. When feasible, even partial schema completion can be useful for assessing hidden stratification.
CIFAR-100:
The benchmark CIFAR-100 dataset from computer vision represents an excellent testbed on which to demonstrate the effect of hidden stratification in a well-characterized environment [19]. The CIFAR-100 dataset consists of 60,000 images binned into 20 “superclasses,” which each contain five distinct “subclasses.” Each subclass is represented in the dataset with equal frequency. We hypothesize that by training models only on superclass labels, and assessing superclass performance within each subclass, we will commonly observe subclasses on which performance is substantially inferior to that of the overall superclass. We further expect that subclass performance will degrade if that subclass is subsampled or if noise is added to superclass labels for that subclass, simulating stratification with low subclass prevalence or reduced label accuracy. For the purposes of this experiment, we assume that the CIFAR-100 subclasses represent a reasonable attempt at schema completion, and measure superclass accuracy within each subclass.
Figure 1(a) presents the performance of a ResNeXt-29, 8x64d Convolutional Neural Network (CNN) trained on the 20 CIFAR-100 superclasses using the training schedule reported in [37] and the implementation provided by [38]. In each superclass, the five constituent subclasses exhibit substantial performance variation, and the worst-performing subclass can underperform the aggregate superclass by over 30 accuracy points. This same phenomenon in medical imaging would lead to massively different outcomes for different subsets of the population, be these demographically or pathologically determined. To confirm that these large differences in subclass performance do not result from random variation within each superclass, we randomly permute the subclass labels within each superclass and evaluate our model on these random subclasses. If random variation was the cause of the stratification observed in Fig. 1(a), we would expect the inter-subclass performance variance to remain unchanged in this experiment. Instead, we find that inter-subclass performance variance is reduced by an average of 66% across all superclasses when the subclasses are randomly rather than semantically assigned, indicating that the performance stratification observed in Fig. 1(a) cannot be attributed to random variation.
Figure 1:
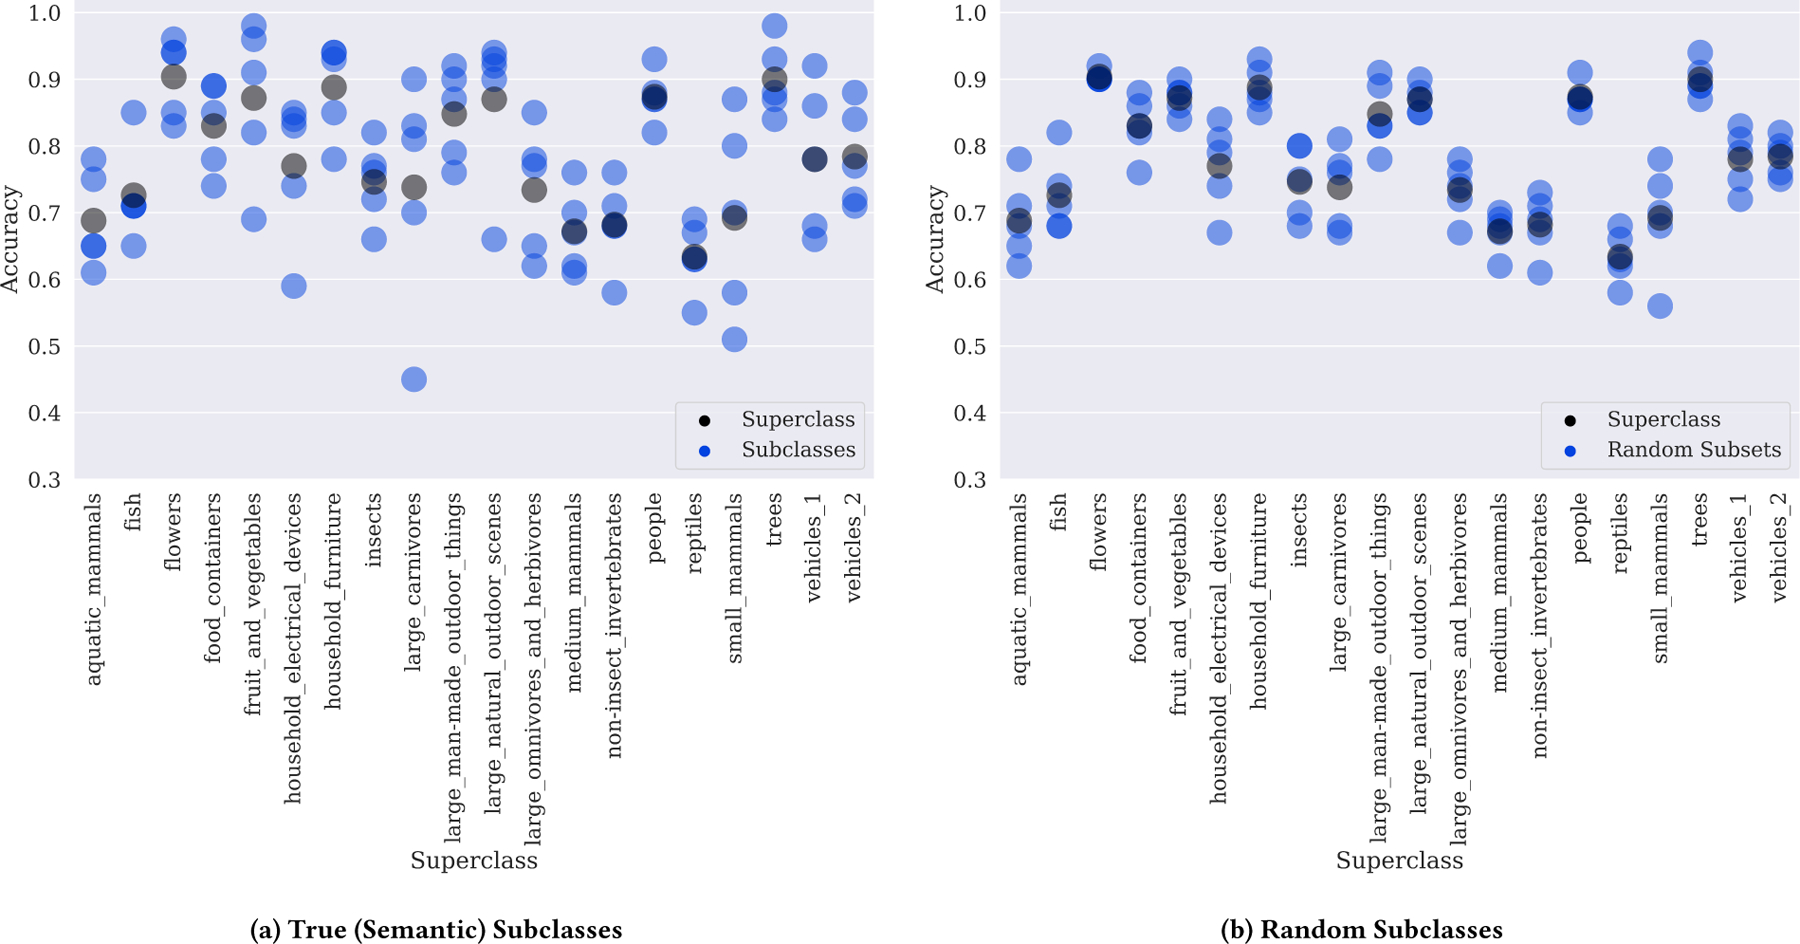
Performance of a ResNeXt-29, 8x64d on CIFAR-100 superclasses by (a) true (semantic) CIFAR-100 subclass and (b) random CIFAR-100 subclasses. Random subclasses were assigned by randomly permuting the subclass label assignments within each superclass. Most superclasses contain true subclasses where performance is far lower than that on the aggregate superclass. Intra-subclass performance variance on random subclasses is on average 66% lower than on the true (semantic) subclasses, indicating that the stratification observed in practice is substantially higher than would be expected from randomness alone.
Table 1 (middle) shows classification results on randomly selected subclasses (“dolphin” and “mountain”) when 75% of the examples in a subclass are dropped from the training set, simulating a subclass with reduced prevalence. While the overall marine mammals superclass performance drops by only 4 accuracy points when the dolphin subclass is subsampled, performance on the dolphin subclass drops by 14 points from 0.78 to 0.64. Similar trends are observed for the mountain subclass, where overall superclass performance drops by 5 accuracy points when the mountain subclass is subsampled, but performance on the mountain subclass itself drops by 19 points. Clearly, unmeasured subclass underrepresentation can lead to substantially worse performance on that subclass, even when superclass performance is only modestly affected.
Table 1:
Accuracy of a ResNeXt-29, 8x64d trained using the full CIFAR-100 dataset (“Baseline”) and two synthetic experiments with altered datasets. (“Subsample”) drops 75% of the dolphin and mountain subclasses from the training dataset, and (“Random Noise”) assigns 25% of examples from these subclasses a random superclass label. Results reported are on superclass labels for the validation set. Numbers in parentheses are reductions in performance with respect to the baseline model for each experimental condition.
| Subclass | Baseline Superclass | Baseline Subclass | Subsample Superclass | Subsample Subclass | Random Noise Superclass | Random Noise Subclass |
|---|---|---|---|---|---|---|
| Dolphin | 0.69 | 0.78 | 0.65 (−4) | 0.64 (−14) | 0.67 (−2) | 0.73 (−5) |
| Mountain | 0.87 | 0.90 | 0.82 (−5) | 0.71 (−19) | 0.82 (−5) | 0.73 (−17) |
We show a similar trend in Table 1 (right) when random noise is added to the labels of a given subclass by replacing the 25% of the true superclass labels with a random incorrect label, simulating a subclass with reduced label accuracy. Performance on both dolphin and mountain subclasses drops substantially when label accuracy decreases; while overall superclass performance in each case drops by less than 5 points, subclass performance decreases by up to 17 points. Such stratification of label quality by pathology is highly likely to occur in medical datasets, where certain pathologies are easier to identify than others.
Adelaide Hip Fracture
Schema completion also shows hidden stratification on a large, high quality pelvic x-ray dataset from the Royal Adelaide Hospital [15]. A DenseNet model previously trained on this dataset to identify hip fractures achieved extremely high performance (AUC = 0.994) [15]. We hypothesize that reduced subclass performance will occur even in models with high overall superclass performance, particularly in subclasses characterized by subtle visual features or low subclass prevalence. The distribution of the location and description subclasses is shown in Table 2, with subclass labels produced by a board-certified radiologist (LOR). We indeed find that sensitivity on both subtle fractures and low-prevalence cervical fractures is significantly lower (p<0.01) than that on the overall task. ROC curves for each of these subclasses and the overall superclass shown in Fig. 2(a) demonstrate that these differences in sensitivity would be expected across a variety of potential operating points. These results support the hypothesis that both subtle discriminative features and low prevalence can contribute to clinically relevant stratification.
Table 2:
Superclass and subclass performance for hip fracture detection from frontal pelvic x-rays. Bolded subclasses show significantly worse performance (p<0.01) than that on the overall task.
| Subclass | Prevalence (Count) | Sensitivity |
|---|---|---|
| Overall | 1.00 (643) | 0.981 |
| Subcapital | 0.26 (169) | 0.987 |
| Cervical | 0.13 (81) | 0.911 |
| Pertrochanteric | 0.50 (319) | 0.997 |
| Subtrochanteric | 0.05 (29) | 0.957 |
| Subtle | 0.06 (38) | 0.900 |
| Mildly Displaced | 0.29 (185) | 0.983 |
| Moderately Displaced | 0.30 (192) | 1.000 |
| Severely Displaced | 0.36 (228) | 0.996 |
| Comminuted | 0.26 (169) | 1.000 |
Figure 2:
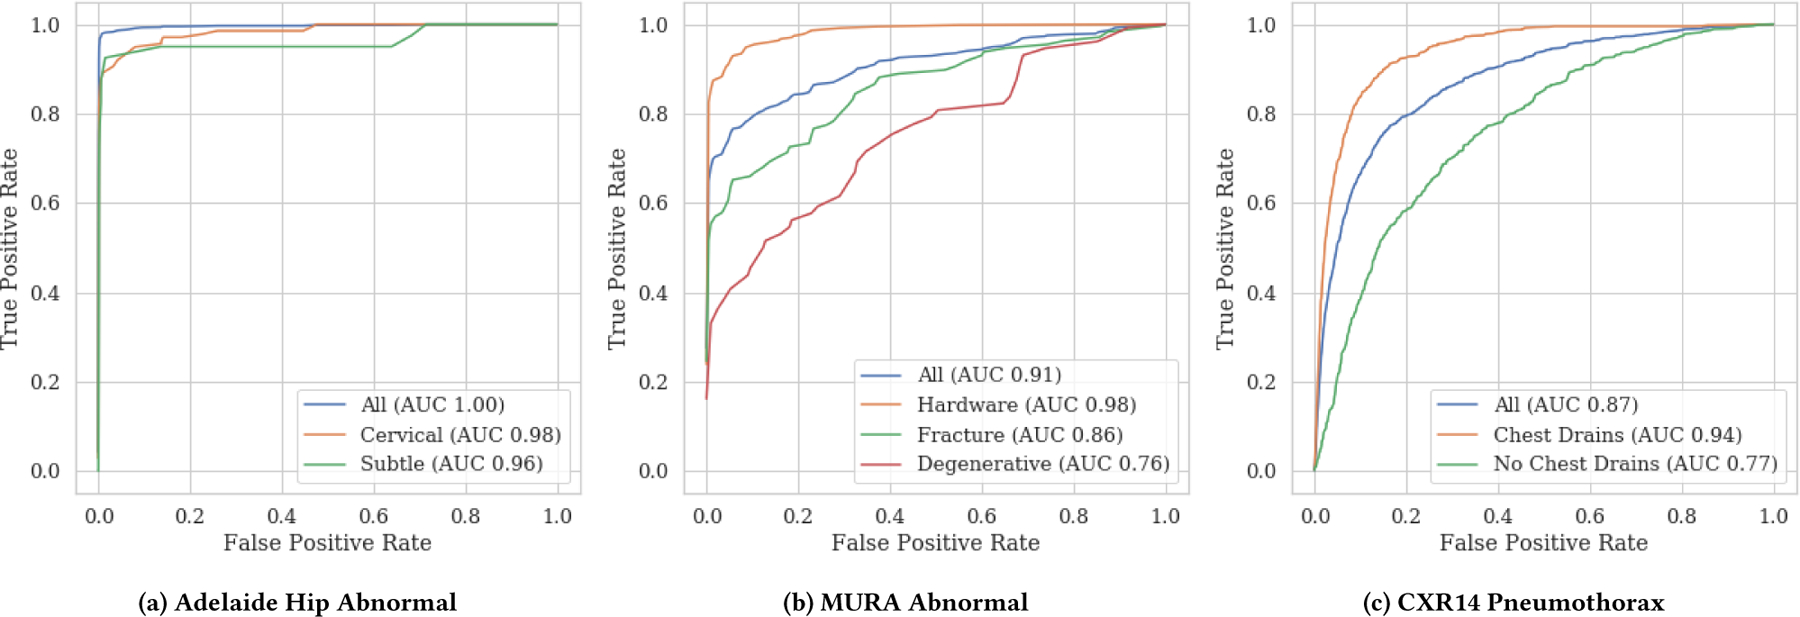
ROC curves for subclasses of the (a) abnormal Adelaide Hip Fracture superclass (b) abnormal MURA superclass and (c) pneumothorax CXR14 superclass. All subclass AUCs are significantly different than the overall task (DeLong p<0.05) for MURA and CXR14. For hip fracture, the AUCs themselves are not statistically different via a two-sided test (DeLong p>0.05), but the sensitivities are statistically different (p<0.01) at the relevant operating point [15]—see Table 2 for details. For MURA, sensitivities at 0.50 specificity are 0.93 (All), 1.00 (Hardware), 0.89 (Fracture), 0.80 (Degenerative). For CXR14, sensitivities at 0.50 specificity are 0.94 (All), 0.99 (Drain), and 0.85 (No Drain). For hip fracture, sensitivities at 0.50 specificity are 1.00 (All), 1.00 (Cervical), and 0.95 (Subtle)
MURA:
We next use schema completion to demonstrate the effect of hidden stratification on the MURA musculoskeletal x-ray dataset developed by Rajpurkar et al. [26], which provides labels for a single class, identifying cases that are “normal” and “abnormal.” These labels were produced by radiologists in the course of their normal work, and include visually distinct abnormalities such as fractures, implanted metal, bone tumors, and degenerative joint disease. These binary labels have been previously investigated and relabelled with subclass identifiers by a board certified radiologist [24], showing substantial differences in both the prevalence and sensitivity of the labels within each subclass (see Table 3). While this schema remains incomplete, even partial schema completion demonstrates substantial hidden stratification in this dataset.
Table 3:
MURA “abnormal” label prevalence and sensitivity for the subclasses of “fracture,” “metalwork,” and “degenerative joint disease (DJD).” The degenerative joint disease subclass labels have the highest prevalence but the lowest sensitivity with respect to review by a board-certified radiologist.
| Subclass | Subclass Prevalence | Superclass Label Sensitivity |
|---|---|---|
| Fracture | 0.30 | 0.92 |
| Metalwork | 0.11 | 0.85 |
| DJD | 0.43 | 0.60 |
We hypothesize that the low label quality and subtle image features that characterize the degenerative joint disease subclass will result in reduced performance, and that the visually obvious metalwork subclass will have high performance (despite low prevalence). We train a DenseNet-169 on the normal/abnormal labels, with 13,942 cases used for training and 714 cases held-out for testing [26]. In Fig. 2(b), we present ROC curves and AUC values for each subclass and in aggregate. We observe that AUC for the easy-to-detect hardware subclass (0.98) is higher than aggregate AUC (0.91), despite the low subclass prevalence. As expected, we also find degraded AUC for degenerative disease (0.76), which has low-sensitivity superclass labels and subtle visual features (Table 3).
4.2. Error Auditing
We next use error auditing to show that the clinical utility of a common model for classifying the CXR-14 dataset is substantially reduced by existing hidden stratification effects in the pneumothorax class that result from the presence of a spurious correlate.
CXR-14:
The CXR-14 dataset is a large-scale dataset for pathology detection in chest radiographs [35]. This dataset was released in 2017 and updated later the same year, containing 112,120 frontal chest films from 30,805 unique patients. Each image was labeled for one of 14 different thoracic pathologies. In our analysis, we leverage a pretrained DenseNet-121 model provided by Zech [40] which reproduces the procedure and results of Rajpurkar et al. [27] on this dataset.
During error auditing, where examples of false positive and false negative predictions from the pretrained model were visually reviewed by a board certified radiologist [24], it was observed that pneumothorax cases without chest drains were highly prevalent (i.e., enriched) in the false negative class. A chest drain is a noncausal image feature in the setting of pneumothorax, as this device is the common form of treatment for the condition. As such, not only does this reflect a spurious correlate, but the correlation is in fact highly clinically relevant; untreated pneumothoraces are life-threatening while treated pneumothoraces are benign. To explore this audit-detected stratification, pneumothorax subclass labels for “chest drain” and “no chest drain” were provided by a board-certified radiologist (LOR) for each element of the test set. Due to higher prevalence of scans with chest drains in the dataset, clear discriminative features of a chest drain, and high label quality for the scans with chest drains, we hypothesize that a model trained on the CXR-14 dataset will attain higher performance on the pneumothorax subclass with chest drains than that without chest drains.
We present ROC curves for each pneumothorax subclass in Fig. 2(c). While overall pneumothorax ROC-AUC closely matches that reported in Rajpurkar et al. [28] at 0.87, pneumothorax ROC-AUC was 0.94 on the subclass with chest drains, but only 0.77 on the subclass without chest drains. We find that 80% of pneumothoraces in the test set contained a chest drain, and that positive predictive value on this subset was 30% higher (0.90) than on those with no chest drain (0.60). These results suggest that clearly identifiable spurious correlates can also cause clinically important hidden stratification.
4.3. Algorithmic Approaches: Unsupervised Clustering
While schema completion and error auditing have allowed us to identify hidden stratification problems in multiple medical machine learning datasets, each requires substantial effort from clinicians. Further, in auditing there is no guarantee that an auditor will recognize underlying patterns in the model error profile. In this context, unsupervised learning techniques can be valuable tools in automatically identifying hidden stratification. We show that even simple k-means clustering can detect several of the hidden subsets identified above via time-consuming human review or annotation.
For each superclass, we apply k-means clustering to the presoftmax feature vector of all test set examples within that superclass using k ∈ {2, 3, 4, 5}. For each value of k, we select the two clusters with greater than 100 constituent points that have the largest difference in error rates (to select a “high error cluster” and “low error cluster” for each k). Finally, we return the pair of high and low error clusters that have the largest Euclidean distance between their centroids. Ideally, examining these high and low error clusters would help human analysts identify salient stratifications in the data. Note that our clustering hyperparameters were coarsely tuned, and could likely be improved in practice.
To demonstrate the potential utility of this approach, we apply it to several datasets analyzed above, and report results in Table 4. We find that while this simple k-means clustering approach does not always yield meaningful separation (e.g. on MURA), it does produce clusters with a high proportion of drains on CXR-14 and a high proportion of various high-error classes (bear, forest, lamp) on CIFAR-100. In practice, such an approach could be used both to assist human auditors in identifying salient stratifications in the data and to confirm that schema completion has been successful.
Table 4:
Subclass prevalence in high and low error clusters on CIFAR, MURA, and CXR14.
| Dataset-Superclass (Subclass) | Difference in Subclass Prevalence (High Error Cluster, Low Error Cluster) | Overall Subclass Prevalence |
|---|---|---|
| CXR14-Pneumothorax (Drains) | 0.68 (0.17, 0.84) | 0.80 |
| CIFAR-Carnivores (Bears) | 0.30 (0.36, 0.06) | 0.20 |
| CIFAR-Outdoor (Forest) | 0.28 (0.36, 0.08) | 0.20 |
| CIFAR-Household (Lamp) | 0.16 (0.28, 0.12) | 0.20 |
| MURA-Abnormal (Hardware) | 0.03 (0.29, 0.26) | 0.11 |
| MURA-Abnormal (Degenerative) | 0.04 (0.12, 0.08) | 0.43 |
5. DISCUSSION
We find that hidden stratification can lead to markedly different superclass and subclass performance when labels for the subclasses have different levels of accuracy, when the subclasses are imbalanced, when discriminative visual features are subtle, or when spurious correlates such as chest drains are present. We observe these trends on both a controlled CIFAR-100 environment and multiple clinical datasets.
The clinical implications of hidden stratification will vary by task. Our MURA results, for instance, are unlikely to be clinically relevant, because degenerative disease is rarely a significant or unexpected finding, nor are rapid complications likely. We hypothesize that labels derived from clinical practice are likely to demonstrate this phenomenon; that irrelevant or unimportant findings are often elided by radiologists, leading to reduced label quality for less significant findings.
The findings in the CXR14 task are far more concerning. The majority of x-rays in the pneumothorax class contain chest drains, the presence of which is a healthcare process variable that is not causally linked to pneumothorax diagnosis. Importantly, the presence of a chest drain means these pneumothorax cases are already treated and are therefore at almost no risk of pneumothorax-related harm. In this experiment, we see that the performance in the clinically important subclass of cases without chest drains is far worse than the primary task results would suggest. We could easily imagine a situation where a model is justified for clinical use or regulatory approval with the results from the primary task alone, as the images used for testing simply reflect the clinical set of patients with pneumothoraces.
While this example is quite extreme, this does correspond with the medical truism that serious disease is typically less common than non-serious disease. These results suggest that image analysis systems that appear to perform well on a given task may fail to identify the most clinically important cases. This behavior is particularly concerning when comparing these systems to human experts, who focus a great deal of effort on specifically learning to identify rare, dangerous, and subtle disease variants.
The performance of medical image analysis systems is unlikely to be fully explained by the prevalence and accuracy of the labels, or even the dataset size. In the MURA experiment (see Figure 2), the detection of metalwork is vastly more accurate than the detection of fractures or degenerative change, despite this subclass being both smaller and less accurately labelled than fractures. We hypothesize that the nature of the visual features is important as well; metalwork is highly visible and discrete, as metal is significantly more dense (with higher pixel values) than any other material on x-ray. While our understanding of what types of visual features are more learnable than others is limited, it is not unreasonable to assume that detecting metal in an x-ray is far easier for a deep learning model than identifying a subtle fracture (and particularly on down-sampled images). Similarly, chest drains are highly recognizable in pneumothorax imaging, and small untreated pneumothoraces are subtle enough to be commonly missed by radiologists. It is possible that this effect exaggerates the discrepancy in performance on the pneumothorax detection task, beyond the effect of subclass imbalance alone. Finally, it is worth noting that there will likely be stratifications within a dataset that are not distinguishable by imaging, meaning that the testing for hidden stratification is likely a necessary, but not sufficient condition for models that perform in a clinically optimal manner.
We show that a simple unsupervised approach to identify unrecognized subclasses often produces clusters containing different proportions of cases from the hidden subclasses our analysis had previously identified. While these results support other findings that demonstrate the utility of hidden-state clustering in model development [20], the relatively simple technique presented here should be considered only a first attempt at unsupervised identification of hidden stratification [5, 32]. Indeed, it remains to be seen if these automatically produced clusters can be useful in practice, either for finding clinically important subclasses or for use in retraining image analysis models for improved subclass performance, particularly given the failure of this method in the detection of clinically relevant subclasses in the MURA task. More advanced semi-supervised methods such as those of [8] may ultimately be required to tackle this problem, or it may be the case that both unsupervised and semi-supervised approaches are unable to contribute substantially, leaving us reliant on time-consuming methodical human review. Importantly, our experiments are limited in that they do not explore the full range of medical image analysis tasks, so the results will have variable applicability to any given scenario. The findings presented here are intended specifically to highlight the largely underappreciated problem of hidden stratification in clinical imaging datasets, and to suggest that awareness of hidden stratification is important and should be considered (even if to be dismissed) when planning, building, evaluating, and regulating clinical image analysis systems.
6. CONCLUSION
Hidden stratification in medical image datasets appears to be a significant and underappreciated problem. Not only can the unrecognized presence of hidden subclasses lead to impaired subclass performance, but this may even result in unexpected negative clinical outcomes in situations where image analysis models silently fail to identify serious but rare, noisy, or visually subtle subclasses. Acknowledging the presence of visual variation within class labels is likely to be important when building and evaluating the next generation of medical image analysis systems. Indeed, our results suggest that models should not be certified for deployment by regulators unless careful testing for hidden stratification has been performed. While this will require substantial effort from the community, bodies such as professional organizations, academic institutions, and national standards boards can help ensure that we can leverage the enormous potential of machine learning in medical imaging without causing patients harm as a result of hidden stratification effects in our models.
ACKNOWLEDGMENTS
We gratefully acknowledge the support of DARPA under Nos. FA86501827865 (SDH) and FA86501827882 (ASED); NIH under No. U54EB020405 (Mobilize), NSF under Nos. CCF1763315 (Beyond Sparsity), CCF1563078 (Volume to Velocity), and 1937301 (RTML); ONR under No. N000141712266 (Unifying Weak Supervision); the Moore Foundation, NXP, Xilinx, LETI-CEA, Intel, IBM, Microsoft, NEC, Toshiba, TSMC, ARM, Hitachi, BASF, Accenture, Ericsson, Qualcomm, Analog Devices, the Okawa Foundation, American Family Insurance, Google Cloud, Swiss Re, the HAI-AWS Cloud Credits for Research program, the Intelligence Community Post-doctoral Fellowship, and members of the Stanford DAWN project: Teradata, Facebook, Google, Ant Financial, NEC, VMWare, and Infosys. The U.S. Government is authorized to reproduce and distribute reprints for Governmental purposes notwithstanding any copyright notation thereon. Any opinions, findings, and conclusions or recommendations expressed in this material are those of the authors and do not necessarily reflect the views, policies, or endorsements, either expressed or implied, of DARPA, NIH, ONR, or the U.S. Government.
Contributor Information
Luke Oakden-Rayner, Australian Institute for Machine Learning, University of Adelaide, Adelaide, Australia.
Jared Dunnmon, Department of Computer Science, Stanford University, Stanford, California, USA.
Gustavo Carneiro, Australian Institute for Machine Learning, University of Adelaide, Adelaide, Australia.
Christopher Ré, Department of Computer Science, Stanford University, Stanford, California, USA.
REFERENCES
- [1].Agniel Denis, Kohane Isaac S, and Weber Griffin M. 2018 Biases in electronic health record data due to processes within the healthcare system: retrospective observational study. BMJ 361 (April 2018), k1479. [DOI] [PMC free article] [PubMed] [Google Scholar]
- [2].Badgeley Marcus A, Zech John R, Oakden-Rayner Luke, Glicksberg Benjamin S, Liu Manway, Gale William, McConnell Michael V, Percha Bethany, Snyder Thomas M, and Dudley Joel T. 2019 Deep learning predicts hip fracture using confounding patient and healthcare variables. NPJ Digit Med 2 (April 2019), 31. [DOI] [PMC free article] [PubMed] [Google Scholar]
- [3].Bien Nicholas, Rajpurkar Pranav, Robyn L Ball Jeremy Irvin, Park Allison, Jones Erik, Bereket Michael, Patel Bhavik N, Yeom Kristen W, Shpanskaya Katie, Halabi Safwan, Zucker Evan, Fanton Gary, Amanatullah Derek F, Beaulieu Christopher F, Riley Geoffrey M, Stewart Russell J, Blankenberg Francis G, Larson David B, Jones Ricky H, Langlotz Curtis P, Ng Andrew Y, and Lungren Matthew P. 2018 Deep-learning-assisted diagnosis for knee magnetic resonance imaging: Development and retrospective validation of MRNet. PLoS Med 15, 11 (November 2018), e1002699. [DOI] [PMC free article] [PubMed] [Google Scholar]
- [4].Buda Mateusz, Maki Atsuto, and Mazurowski Maciej A. 2018 A systematic study of the class imbalance problem in convolutional neural networks. Neural Netw 106 (October 2018), 249–259. [DOI] [PubMed] [Google Scholar]
- [5].Caliński Tadeusz and Jerzy Harabasz. 1974 A dendrite method for cluster analysis. Communications in Statistics-Theory and Methods 3, 1 (1974), 1–27. [Google Scholar]
- [6].Campanella Gabriele, Hanna Matthew G, Geneslaw Luke, Miraflor Allen, Krauss Silva Vitor Werneck, Busam Klaus J, Brogi Edi, Reuter Victor E, Klimstra David S, and Fuchs Thomas J. 2019 Clinical-grade computational pathology using weakly supervised deep learning on whole slide images. Nature Medicine 25, 8 (2019), 1301–1309. [DOI] [PMC free article] [PubMed] [Google Scholar]
- [7].Cardon Lon R and Palmer Lyle J. 2003 Population stratification and spurious allelic association. Lancet 361, 9357 (2003), 598–604. [DOI] [PubMed] [Google Scholar]
- [8].Chen Vincent, Wu Sen, Ratner Alexander J, Weng Jen, and Ré Christopher. 2019 Slice-based learning: A programming model for residual learning in critical data slices. In Advances in Neural Information Processing Systems 9392–9402. [PMC free article] [PubMed]
- [9].Chilamkurthy Sasank, Ghosh Rohit, Tanamala Swetha, Biviji Mustafa, Norbert G Campeau Vasantha Kumar Venugopal, Mahajan Vidur, Rao Pooja, and Warier Prashant. 2018 Deep learning algorithms for detection of critical findings in head CT scans: a retrospective study. Lancet 392, 10162 (December 2018), 2388–2396. [DOI] [PubMed] [Google Scholar]
- [10].Dunnmon Jared, Ratner Alexander, Khandwala Nishith, Saab Khaled, Markert Matthew, Sagreiya Hersh, Goldman Roger, Christopher Lee-Messer Matthew Lungren, Rubin Daniel, and Christopher Ré. 2019 Cross-Modal Data Programming Enables Rapid Medical Machine Learning. arXiv preprint arXiv: 1903.11101 (March 2019). [DOI] [PMC free article] [PubMed]
- [11].Dunnmon Jared A, Yi Darvin, Langlotz Curtis P, Ré Christopher, Rubin Daniel L, and Lungren Matthew P. 2019 Assessment of Convolutional Neural Networks for Automated Classification of Chest Radiographs. Radiology 290, 2 (February 2019), 537–544. [DOI] [PMC free article] [PubMed] [Google Scholar]
- [12].Esteva Andre, Kuprel Brett, Roberto A Novoa Justin Ko, Swetter Susan M, Blau Helen M, and Thrun Sebastian. 2017 Dermatologist-level classification of skin cancer with deep neural networks. Nature 542, 7639 (February 2017), 115–118. [DOI] [PMC free article] [PubMed] [Google Scholar]
- [13].Esteva Andre, Robicquet Alexandre, Ramsundar Bharath, Kuleshov Volodymyr, DePristo Mark, Chou Katherine, Cui Claire, Corrado Greg, Thrun Sebastian, and Dean Jeff. 2019 A guide to deep learning in healthcare. Nature Medicine 25, 1 (2019), 24. [DOI] [PubMed] [Google Scholar]
- [14].Fries Jason A, Varma Paroma, Chen Vincent S, Xiao Ke, Tejeda Heliodoro, Saha Priyanka, Dunnmon Jared, Chubb Henry, Maskatia Shiraz, Fiterau Madalina, Delp Scott, Ashley Euan, Ré Christopher, and Priest James R. 2019 Weakly supervised classification of aortic valve malformations using unlabeled cardiac MRI sequences. Nat. Commun 10, 1 (July 2019), 3111. [DOI] [PMC free article] [PubMed] [Google Scholar]
- [15].Gale William, Oakden-Rayner Luke, Carneiro Gustavo, Bradley Andrew P, and Palmer Lyle J. 2017 Detecting hip fractures with radiologist-level performance using deep neural networks. arXiv preprint arXiv:1711.06504 (2017).
- [16].Gulshan Varun, Peng Lily, Coram Marc, Stumpe Martin C, Wu Derek, Narayanaswamy Arunachalam, Venugopalan Subhashini, Widner Kasumi, Madams Tom, Cuadros Jorge, Kim Ramasamy, Raman Rajiv, Nelson Philip C, Mega Jessica L, and Webster Dale R. 2016 Development and Validation of a Deep Learning Algorithm for Detection of Diabetic Retinopathy in Retinal Fundus Photographs. JAMA 316, 22 (December 2016), 2402–2410. [DOI] [PubMed] [Google Scholar]
- [17].Haenssle Holger A, Fink Christine, Schneiderbauer R, Toberer Ferdinand, Buhl Timo, Blum A, Kalloo A, Ben Hadj Hassen A, Thomas L, Enk A, and Others 2018 Man against machine: diagnostic performance of a deep learning convolutional neural network for dermoscopic melanoma recognition in comparison to 58 dermatologists. Ann. Oncol 29, 8 (2018), 1836–1842. [DOI] [PubMed] [Google Scholar]
- [18].Irvin Jeremy, Rajpurkar Pranav, Ko Michael, Yu Yifan, Ciurea-Ilcus Silviana, Chute Chris, Marklund Henrik, Haghgoo Behzad, Ball Robyn, Shpanskaya Katie, and Others. 2019 Chexpert: A large chest radiograph dataset with uncertainty labels and expert comparison. arXiv preprint arXiv:1901.07031 (2019).
- [19].Krizhevsky Alex, Nair Vinod, and Hinton Geoffrey. 2009 Cifar-10 and cifar-100 datasets URl: https://www.cs.toronto.edu/kriz/cifar.html 6 (2009). [Google Scholar]
- [20].Liu Jiamin, Yao Jianhua, Bagheri Mohammadhadi, Sandfort Veit, and Summers Ronald M. 2019 A Semi-Supervised CNN Learning Method with Pseudo-class Labels for Atherosclerotic Vascular Calcification Detection. 2019 IEEE 16th International Symposium on Biomedical Imaging (ISBI 2019) (2019). [Google Scholar]
- [21].Mahajan Vidur, Venugopal Vasanthakumar, Gaur Saumya, Gupta Salil, Murugavel Murali, and Mahajan Harsh. 2019 The Algorithmic Audit: Working with Vendors to Validate Radiology-AI Algorithms - How We Do It. viXra (July 2019). [DOI] [PubMed]
- [22].Mazurowski Maciej A, Habas Piotr A, Zurada Jacek M, Lo Joseph Y, Baker Jay A, and Tourassi Georgia D. 2008 Training neural network classifiers for medical decision making: the effects of imbalanced datasets on classification performance. Neural Netw 21, 2–3 (March 2008), 427–436. [DOI] [PMC free article] [PubMed] [Google Scholar]
- [23].Mulherin Stephanie A and Miller William C. 2002 Spectrum bias or spectrum effect? Subgroup variation in diagnostic test evaluation. Annals of Internal Medicine 137, 7 (2002), 598–602. [DOI] [PubMed] [Google Scholar]
- [24].Oakden-Rayner Luke. 2020 Exploring Large-scale Public Medical Image Datasets. Academic Radiology 27, 1 (2020), 106–112. [DOI] [PubMed] [Google Scholar]
- [25].Raji Inioluwa Deborah, Smart Andrew, White Rebecca N, Mitchell Margaret, Gebru Timnit, Hutchinson Ben, Smith-Loud Jamila, Theron Daniel, and Barnes Parker. 2020 Closing the AI Accountability Gap: Defining an End-to-End Framework for Internal Algorithmic Auditing. arXiv preprint arXiv:2001.00973 (2020).
- [26].Rajpurkar Pranav, Irvin Jeremy, Bagul Aarti, Ding Daisy, Duan Tony, Mehta Hershel, Yang Brandon, Zhu Kaylie, Laird Dillon, Ball Robyn L, et al. 2017 Mura: Large dataset for abnormality detection in musculoskeletal radiographs. arXiv preprint arXiv:1712.06957 (2017).
- [27].Rajpurkar Pranav, Irvin Jeremy, Ball Robyn L, Zhu Kaylie, Yang Brandon, Mehta Hershel, Duan Tony, Ding Daisy, Bagul Aarti, Langlotz Curtis P, Patel Bhavik N, Yeom Kristen W, Shpanskaya Katie, Blankenberg Francis G, Seekins Jayne, Amrhein Timothy J, Mong David A, Halabi Safwan S, Zucker Evan J, Ng Andrew Y, and Lungren Matthew P. 2018 Deep learning for chest radiograph diagnosis: A retrospective comparison of the CheXNeXt algorithm to practicing radiologists. PLoS Med 15, 11 (November 2018), e1002686. [DOI] [PMC free article] [PubMed] [Google Scholar]
- [28].Rajpurkar Pranav, Irvin Jeremy, Zhu Kaylie, Yang Brandon, Mehta Hershel, Duan Tony, Ding Daisy, Bagul Aarti, Langlotz Curtis, Shpanskaya Katie, Lungren Matthew, and Ng Andrew. 2017 CheXNet: Radiologist-level pneumonia detection on chest x-rays with deep learning. arXiv preprint arXiv:1711.05225 (2017).
- [29].Ratner Alexander J, Ehrenberg Henry, Hussain Zeshan, Dunnmon Jared, and Ré Christopher. 2017. Learning to Compose Domain-Specific Transformations for Data Augmentation In Advances in Neural Information Processing Systems 30, Guyon I, Luxburg UV, Bengio S, Wallach H, Fergus R, Vishwanathan S, and Garnett R(Eds.). Curran Associates, Inc., 3236–3246. [PMC free article] [PubMed] [Google Scholar]
- [30].Recht Benjamin, Roelofs Rebecca, Schmidt Ludwig, and Shankar Vaishaal. 2018 Do CIFAR-10 classifiers generalize to CIFAR-10? arXiv preprint arXiv:1806.00451 (2018).
- [31].Ribeiro Marco Tulio, Singh Sameer, and Guestrin Carlos. 2016. Why should i trust you?: Explaining the predictions of any classifier. In Proceedings of the 22nd ACM SIGKDD International Conference on Knowledge Discovery and Data Mining ACM, 1135–1144. [Google Scholar]
- [32].Rousseeuw Peter J. 1987 Silhouettes: a graphical aid to the interpretation and validation of cluster analysis. J. Comput. Appl. Math 20 (1987), 53–65. [Google Scholar]
- [33].Selbst Andrew D. 2017 Disparate impact in big data policing. Ga. L. Rev 52 (2017), 109. [Google Scholar]
- [34].Wang Pu, Berzin Tyler M, Glissen Brown Jeremy Romek, Bharadwaj Shishira, Becq Aymeric, Xiao Xun, Liu Peixi, Li Liangping, Song Yan, Zhang Di, Li Yi, Xu Guangre, Tu Mengtian, and Liu Xiaogang. 2019 Real-time automatic detection system increases colonoscopic polyp and adenoma detection rates: a prospective randomised controlled study. Gut (February 2019). [DOI] [PMC free article] [PubMed]
- [35].Wang Xiaosong, Peng Yifan, Lu Le, Lu Zhiyong, Bagheri Mohammadhadi, and Summers Ronald M. 2017 Chestx-ray8: Hospital-scale chest x-ray database and benchmarks on weakly-supervised classification and localization of common thorax diseases. In IEEE Conference on CVPR, Computer Vision and Pattern Recognition (2017). 3462–3471. [Google Scholar]
- [36].Winkler Julia K, Fink Christine, Toberer Ferdinand, Enk Alexander, Deinlein Teresa, Hofmann-Wellenhof Rainer, Thomas Luc, Lallas Aimilios, Blum Andreas, Stolz Wilhelm, and Haenssle Holger A. 2019 Association Between Surgical Skin Markings in Dermoscopic Images and Diagnostic Performance of a Deep Learning Convolutional Neural Network for Melanoma Recognition. JAMA Dermatology (2019). [DOI] [PMC free article] [PubMed]
- [37].Xie Saining, Girshick Ross, Piotr Dollár Zhuowen Tu, and He Kaiming. 2016 Aggregated Residual Transformations for Deep Neural Networks. arXiv preprint arXiv:1611.05431 (November 2016).
- [38].Yang Wei. 2019. pytorch-classification https://github.com/bearpaw/pytorch-classification
- [39].Yao Bangpeng, Khosla Aditya, and Fei-Fei Li. 2011. Combining randomization and discrimination for fine-grained image categorization In CVPR 2011. IEEE, 1577–1584. [Google Scholar]
- [40].Zech John. 2019. reproduce-chexnet https://github.com/jrzech/reproducechexnet
- [41].Zech John R, Badgeley Marcus A, Liu Manway, Costa Anthony B, Titano Joseph J, and Oermann Eric K. 2018 Confounding variables can degrade generalization performance of radiological deep learning models. arXiv preprint arXiv:1807.00431 (July 2018).