Abstract
Complex gene regulation in eukaryotes requires the effective separation of nuclear transcription and RNA processing from cytosolic translation1. This separation is achieved by the nuclear envelope, which controls the exchange of macromolecules through nuclear pores2. During mitosis, however, animal and plant cells disassemble the nuclear envelope, allowing cytoplasmic and nuclear components to intermix3. When the nuclear envelope is reformed, cytoplasmic components are removed from the nucleus by receptor-mediated transport through nuclear pores2. However, these pores have a size limit of 39 nm4–7, raising the question of how larger cytoplasmic components are cleared from the nucleus. Here, we show that large cytoplasmic components are displaced prior to nuclear envelope assembly by movement of chromosomes to a dense cluster. This clustering occurs when chromosomes approach the poles of anaphase spindles and is mediated by a microtubule-independent mechanism that involves the surfactant-like protein Ki-67. Ki-67 forms repulsive molecular brushes during the early stages of mitosis8, but during mitotic exit the brushes collapse and Ki-67 promotes chromosome clustering. We show that exclusion of mature ribosomes from the nucleus after mitosis depends on Ki-67-regulated chromosome clustering. Thus, our study reveals that chromosome mechanics help to reestablish the compartmentalization of eukaryotic cells after open mitosis.
To investigate how large cytoplasmic components are excluded from the nucleus after mitosis, we used Genetically Encoded Multimeric nanoparticles (GEMs) of 41 nm diameter9. We stably expressed the GEM subunit encapsulin-EGFP in HeLa cells together with a chromatin reference marker, histone 2B fused to mCherry (H2B-mCherry) and observed high concentrations of GEMs in the cytoplasm but not in the nucleus of interphase cells (Fig. 1a). GEMs did not impair cell viability, proliferation, or mitosis (Extended Data Fig. 1a–c) and are thus suitable to study nucleo-cytoplasmic partitioning during mitosis in live cells.
Figure 1. Cytoplasmic macromolecules are displaced from the nucleus prior to the assembly of a transport-competent nuclear envelope.
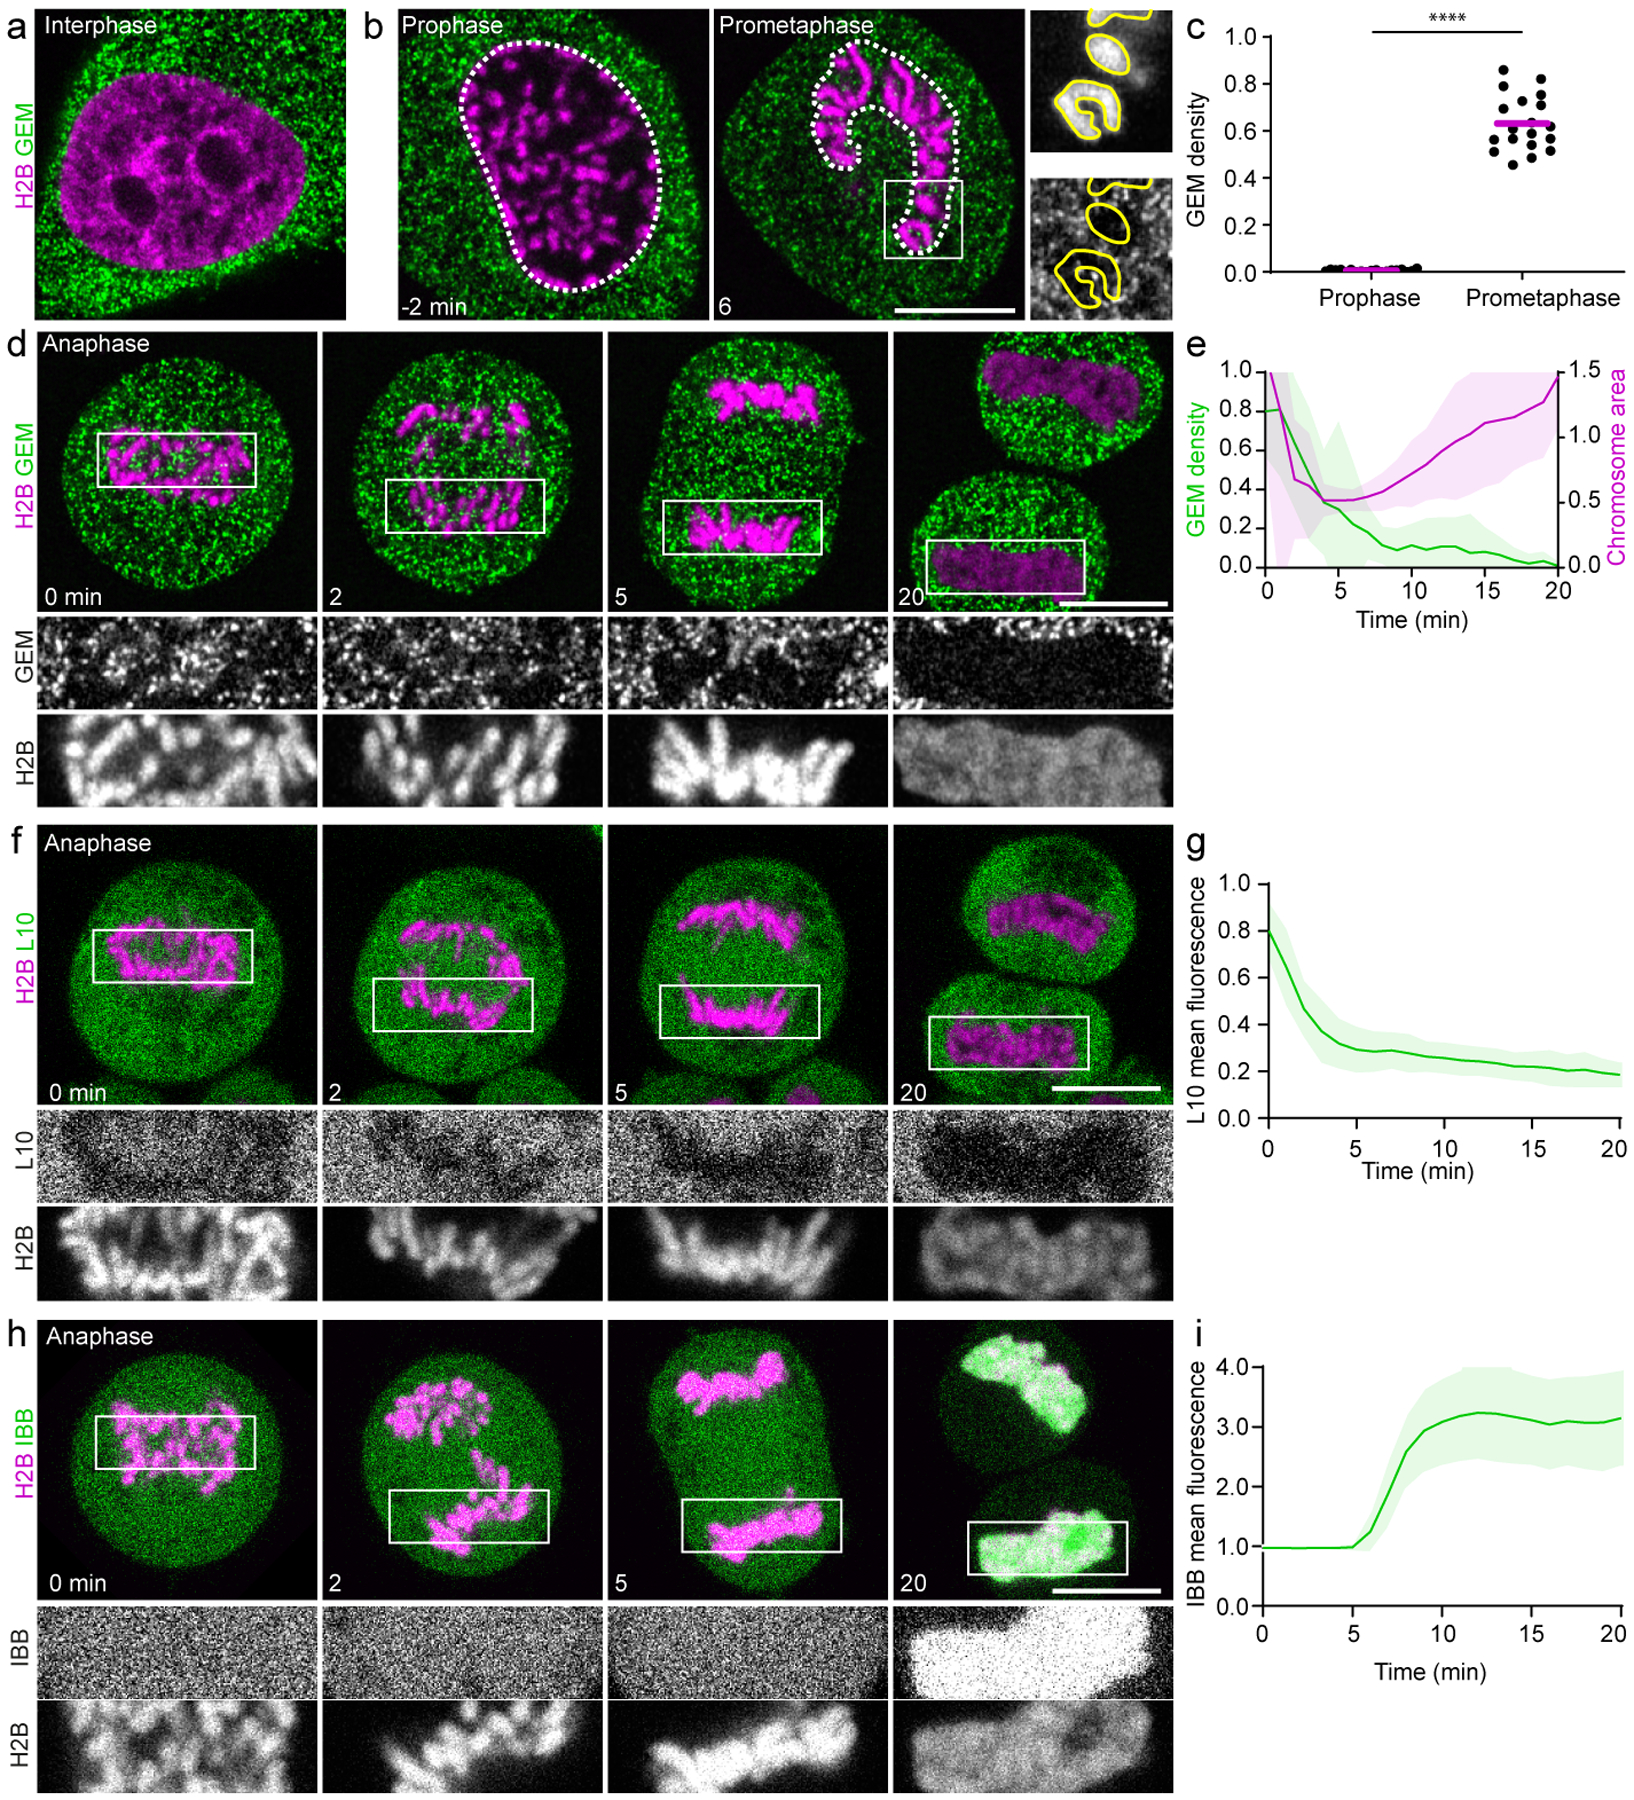
a, b, Live HeLa cell expressing GEMs and H2B-mCherry in interphase (a) and time-lapse of early mitosis (b). White dashed lines represent chromosomal regions quantified in (c), yellow lines outline individual chromosomes. c, GEM density (particles/area) in chromosomal regions as in (b) 2 min before (prophase) and 6 min after (prometaphase) nuclear envelope breakdown, relative to surrounding cytoplasmic areas. Bars indicate mean. Significance tested by two-sided ratio paired t-test (****P = 3.6 × 10⁻²³). n = 19 cells. d, HeLa cell expressing GEMs and H2B-mCherry progressing through anaphase. e, Quantification of chromosomal area and GEM density within this area relative to surrounding cytoplasm in anaphase cells as in (d). n = 22 cells. f, HeLa cell expressing the mature ribosome marker L10-EGFP and H2B-mCherry progressing through anaphase. g, Quantification of L10-EGFP mean fluorescence within the chromosomal region normalized to surrounding cytoplasm, in anaphase cells as in (f). n = 30 cells. h, HeLa cell expressing the nuclear import substrate IBB-EGFP and H2B-mCherry progressing through anaphase. i, Quantification of IBB-EGFP mean fluorescence in the chromosomal region, normalized to pre-anaphase as in (h). n = 12 cells. 0 min refers to anaphase onset in (d-i), time lapse = 1min. Lines and shaded areas represent mean ± SD. Scale bars, 10 μm; single Z-slices shown.
Cytoplasm is excluded during nuclear assembly
To determine the localization of GEMs during nuclear breakdown and reassembly, we imaged cells progressing through mitosis. GEMs remained excluded from the nucleus during late prophase, but rapidly mixed with chromosomes after nuclear envelope breakdown (Fig. 1b, c). During anaphase, GEMs initially localized abundantly between chromosomes but were then progressively excluded as each set of sister chromatids segregated towards the spindle poles (Fig. 1d, e, Supplementary Video 1). Thus, GEMs and chromosomes mix during early mitosis but demix during mitotic exit.
To examine how large endogenous cytoplasmic components are excluded from the reassembling nucleus, we visualized mature ribosomes in live HeLa cells by EGFP-tagged ribosomal protein L1010, which was efficiently incorporated into mature ribosomes and did not perturb cell proliferation or mitosis (Extended Data Fig. 1a–e). L10-EGFP localized abundantly between neighboring chromosomes during early anaphase but was then excluded from the future nuclear space during late anaphase with kinetics similar to GEMs (Fig. 1f, g, Supplementary Video 2). Thus, most mature ribosomes are excluded from chromosome regions shortly after anaphase onset.
To investigate how the exclusion of GEMs and mature ribosomes from anaphase chromosomes relates to the timing of nuclear envelope assembly, we determined when during mitotic exit transport through nuclear pores is initiated. Live-cell imaging of a nuclear import substrate, the importin beta-binding (IBB) domain of importin alpha11 fused to EGFP, revealed its accumulation in chromosome regions ~6 min after anaphase onset (Fig. 1h, i), whereas exclusion of L10-GFP was already almost complete 5 min after anaphase onset. Thus, GEMs and mature ribosomes are excluded from the reassembling nucleus prior to the formation of a transport-competent nuclear envelope.
The timing of L10-GFP exclusion from the reassembling nucleus prior to the onset of transport through nuclear pores suggested that this exclusion should be independent of Exportin-1, the transport receptor mediating export of pre-ribosomal subunits during biogenesis12. Consistent with this hypothesis, we found that the exclusion of L10-GFP was unaffected by Leptomycin B treatment (Extended Data Fig. 2a, b), an inhibitor of Exportin-113 (Extended Data Fig. 2c, d). Thus, exclusion of ribosomes and other large cytoplasmic particles during nuclear assembly appears to be independent of nuclear pore-mediated transport.
Chromosomes cluster during mitotic exit
The displacement of GEMs and mature ribosomes coincided with the movement of chromosomes to a dense cluster (Fig. 1d–g, Supplementary Videos 1, 2). We therefore hypothesized that nucleo-cytoplasmic compartmentalization might be controlled by the arrangement of chromosomes. Anaphase chromosomes are moved into proximity by spindle-mediated poleward pulling, but the very dense appearance of late anaphase chromosome clusters suggested that additional spindle-independent mechanisms might be involved. To probe for spindle-independent mechanisms of chromosome clustering, we established an assay for nuclear assembly in the absence of a spindle. We incubated mitotic cells in nocodazole to depolymerize microtubules and then acutely inhibited the mitotic kinase Cdk1 using flavopiridol to promote mitotic exit in the absence of a spindle14 (Extended Data Fig. 3a–d). Imaging IBB-EGFP showed accumulation in chromosome regions ~8 min after flavopiridol addition (Extended Data Fig. 3e, f), indicating that cells assemble a sealed and transport-competent nuclear envelope during mitotic exit in the absence of a spindle.
We next studied chromosome arrangements during spindle-less mitotic exit. Chromosomes were initially scattered in the cytoplasm but after induction of mitotic exit by flavopiridol they formed a single cluster (Fig. 2a). During clustering, the overall area of the chromosome ensemble and the area between neighboring chromosomes decreased, reaching a minimum at ~8 min, just before the onset of IBB-EGFP import (Extended Data Fig. 3e, f). An alternative procedure to induce mitotic exit using spindle assembly checkpoint inactivation also caused chromosome clustering in spindle-less cells (Extended Data Fig. 3g–i). Thus, chromosomes cluster by a microtubule-independent mechanism before nucleo-cytoplasmic compartmentalization is established by the nuclear envelope.
Figure 2. Displacement of cytoplasm by spindle-independent chromosome clustering.
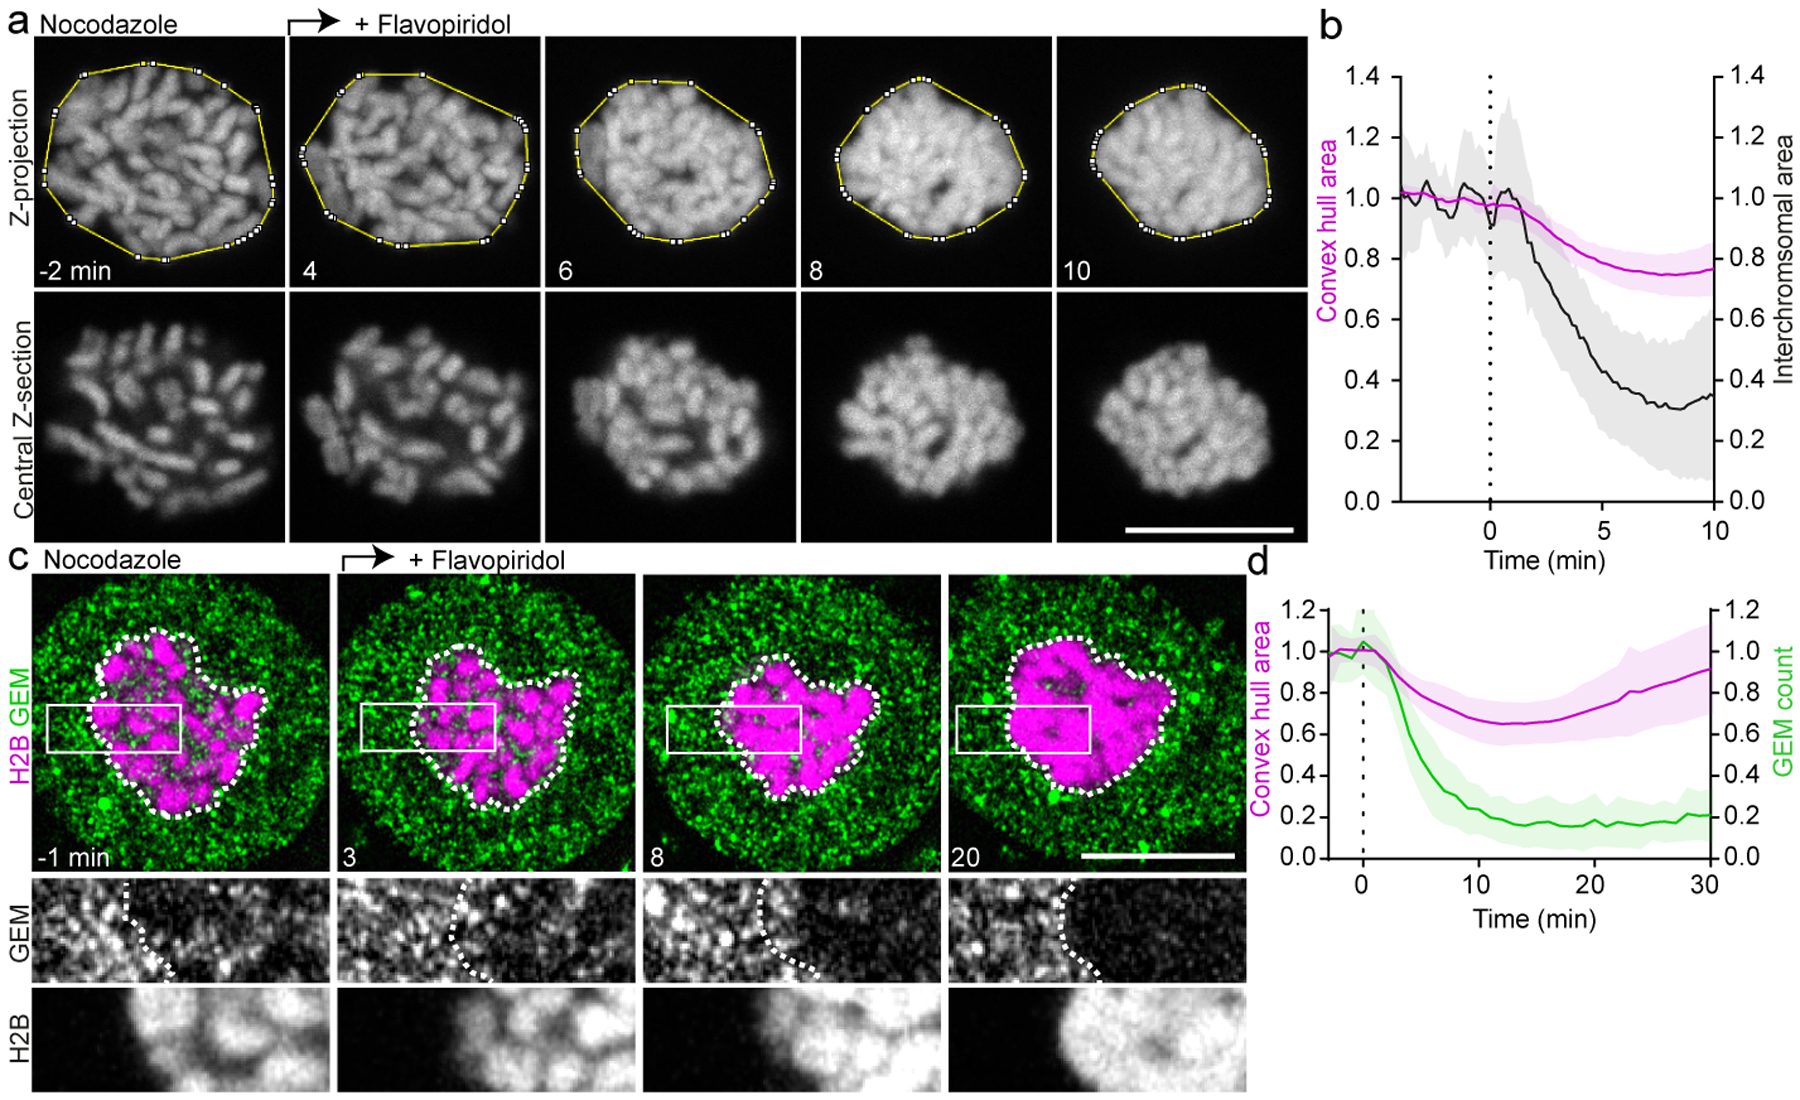
a, Chromosome organization during spindle-less mitotic exit. 3D-video of HeLa cell expressing H2B-mCherry imaged in the presence of nocodazole; flavopiridol was added (t = 0 min) to induce mitotic exit. Yellow line indicates convex hull around chromosomes. b, Quantification of convex hull area of 16 cells as in (a), and inter-chromosomal area. c, HeLa cell expressing GEMs and H2B-mCherry, during spindle-less mitotic exit as in (a). Dashed lines indicate chromosomal area; single Z-slices shown. d, GEM particle count within chromosomal area as in (c), normalized to pre-flavopiridol time points (green). Chromosome convex hull area, normalized to pre-flavopiridol time points (magenta). n = 35 cells. Lines and shaded areas represent mean ± SD, dashed vertical lines indicate flavopiridol addition. Scale bars, 10 μm.
To explore the relationship between chromosome clustering and cytoplasmic exclusion, we imaged GEMs during spindle-less mitotic exit. We found that GEMs were progressively excluded while chromosomes formed a cluster (Fig. 2c, d), prior to the onset of IBB-EGFP import (Extended Data Fig. 3e, f). Thus, the spindle is not required for chromosome clustering or nuclear exclusion of GEMs.
Chromosome clustering might be caused by increased attraction between neighboring chromosomes or by forces generated by the surrounding cytoskeleton or membranes. Depolymerization of F-actin had no detectable effect on chromosome clustering and nuclear membranes contacted chromosomes only after they had clustered almost to completion (Extended Data Fig. 4a–d). Hence, chromosome clustering does not depend on actin filaments or spatial confinement by nuclear envelope membranes. To test if clustering results from adhesion between neighboring chromosomes, we tracked the mobility of individual chromosomes by stably expressing the kinetochore protein CENP-A fused to EGFP and imaged mitotic cells in the presence of nocodazole. Tracking of CENP-A spots showed that chromosomes initially moved extensively relative to each other but after the induction of mitotic exit by flavopiridol the clustered chromosomes were almost entirely immobilized (Extended Data Fig. 4e–h, Supplementary Video 3). This restricted chromosome motility is consistent with a model of increased adhesion between chromosomes mediating clustering.
To test whether chromosomes also cluster in the presence of a spindle, we synchronized cells to metaphase by the proteasome inhibitor MG132 and subsequently added flavopiridol to induce mitotic exit. Prior to flavopiridol addition, many chromosome arms extended from the metaphase plate, but shortly after adding flavopiridol, they formed a single compact cluster (Extended Data Fig. 5a, b). Clustered chromosomes remained aligned in the metaphase plate even when the spindle was subsequently disassembled by addition of nocodazole, in contrast to chromosomes of metaphase cells that were not pre-treated with flavopiridol (Extended Data Fig. 5c, d). Thus, chromosomes become adhesive during mitotic exit, resulting in the formation of a dense cluster.
Ki-67 regulates chromosome clustering
One candidate to regulate chromosome clustering is the protein barrier-to-autointegration factor (BAF), since it mechanically stabilizes anaphase chromosomes by cross-bridging DNA of anaphase chromosome ensembles15. However, BAF depletion by RNA interference had no detectable effect on chromosome clustering and GEM exclusion, and EGFP-tagged BAF accumulated on chromosomes after chromosome clustering was complete (Extended Data Fig. 6a–f). Chromosome clustering must therefore be regulated by factors other than BAF.
During prometaphase, chromosomes are kept apart by a repulsive surface formed by the protein Ki-678, which might be removed or inactivated during mitotic exit. To test whether chromosome clustering is due to Ki-67 dissociation from chromosomes, we imaged endogenously tagged EGFP-Ki-67. Ki-67 remained bound to chromosomes during clustering, both in spindle-less mitotic exit and regular anaphase (Extended Data Fig. 6g–j). Thus, chromosome clustering is not caused by Ki-67 dissociation.
During prometaphase, Ki-67 forms molecular brushes at the surface of mitotic chromosomes, with the C-terminus bound to the chromosome surface and the N-terminus extended into the cytoplasm8. This type of molecular brush structure is characteristic of surface active agents (surfactants) that disperse particles in solution by steric repulsion16. To test if Ki-67 is inactivated during mitotic exit by reorganization of its brush-like molecular arrangement, we determined the relative positions of Ki-67’s N- and C-termini, tagged with mCherry and EGFP, respectively8 (Fig. 3a–d). In prometaphase, Ki-67’s N-terminus localized 66 ± 27 nm towards the cytoplasm relative to its C-terminus, whereas after inducing chromosome clustering by flavopiridol, the distance between the two fluorophores decreased to 32 ± 32 nm; a construct with inverted fluorophore positions yielded consistent results (Fig. 3c, d). Thus, the extended molecular brushes formed by Ki-67 during early mitosis collapse when chromosomes cluster during mitotic exit.
Figure 3. Ki-67 regulates chromosome clustering.
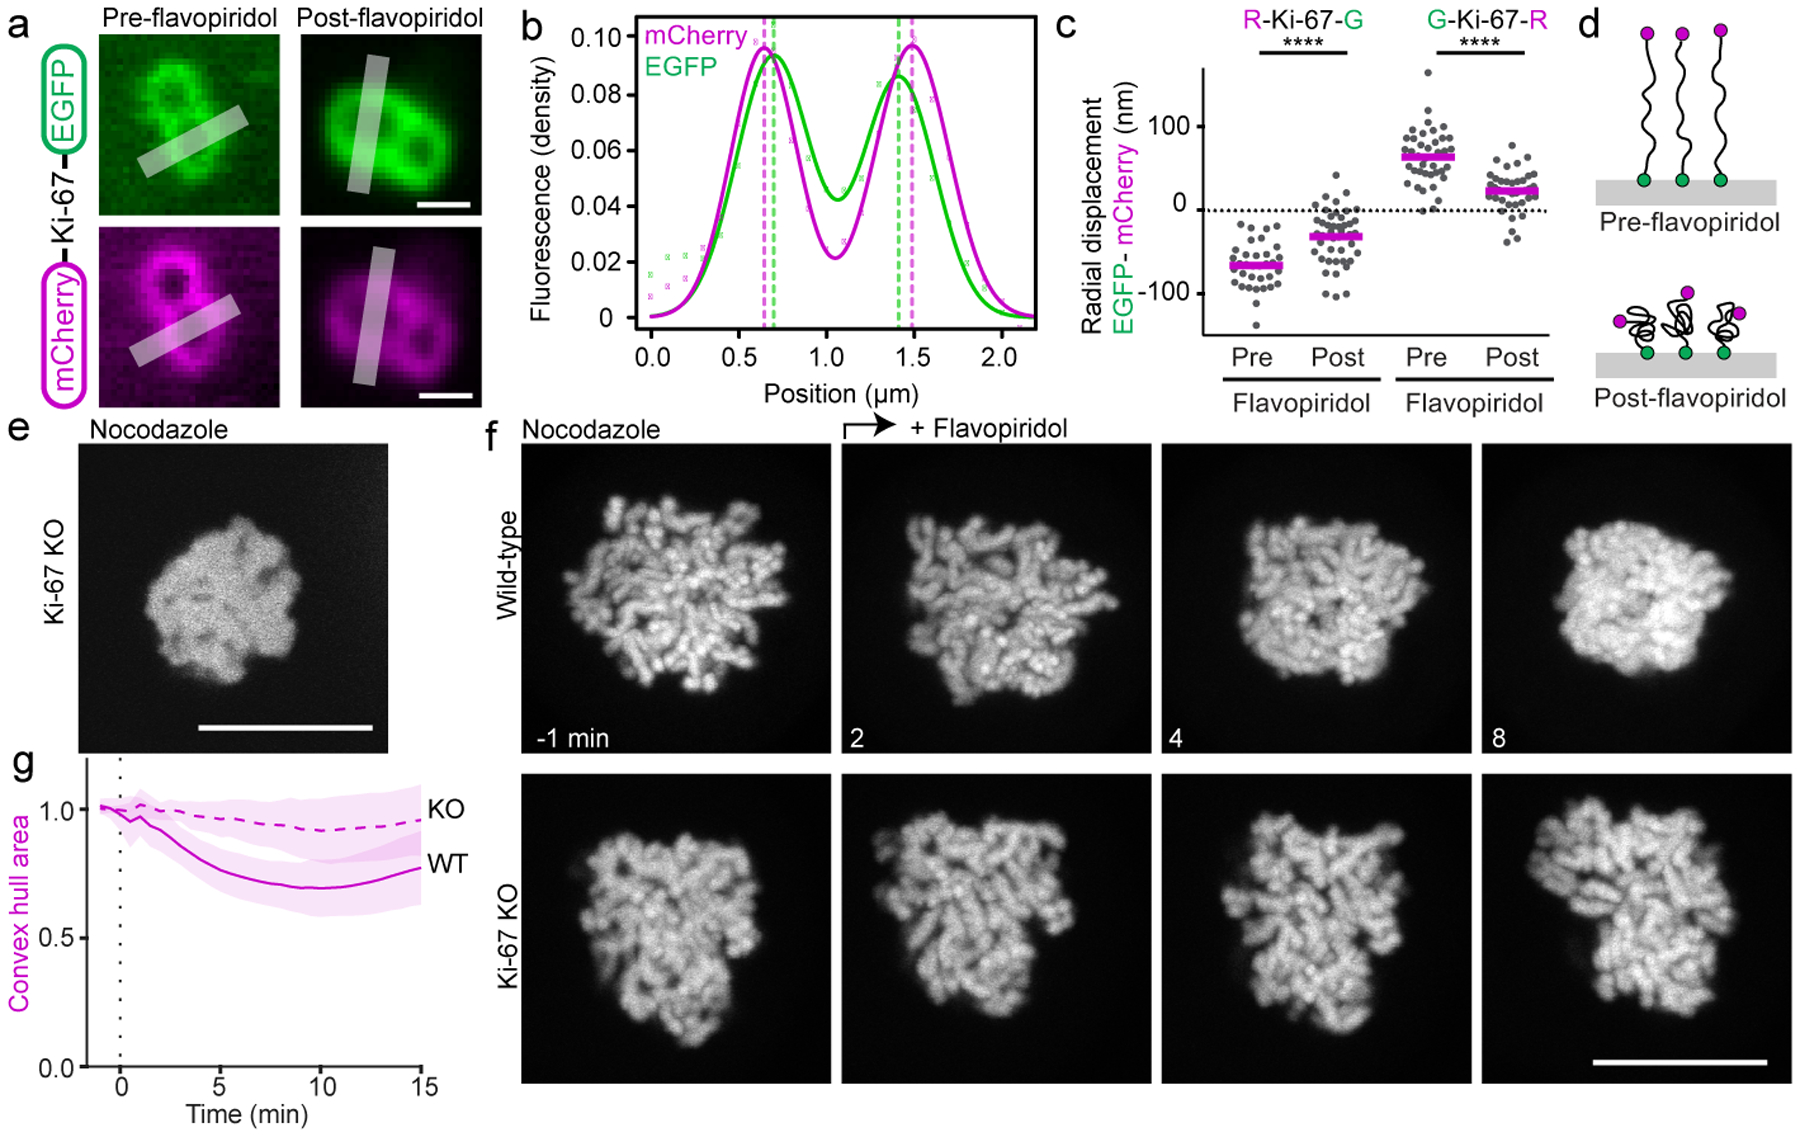
a-d, Molecular organization of Ki-67 on the surface of mitotic chromosomes before and after flavopiridol addition. a, Ki-67 was tagged on the N-terminus by mCherry, on the C-terminus by EGFP and expressed in HeLa cells. Sister chromatid pairs oriented perpendicular to the imaging plane were imaged in live mitotic cells, lines indicate measurement regions for (b). b, Relative positions of mCherry and EGFP along an axis perpendicular to the chromosome surface. Fluorescence densities (dots) were measured along line profiles as in (a) and a sum of two Gaussian functions (lines) was separately fitted to the EGFP and mCherry channels, respectively, to determine peak positions (dashed lines). c, The radial displacement of EGFP relative to mCherry peaks was determined based on line profile measurements as in (a, b) for mCherry-Ki-67-EGFP (R-Ki-67-G: n = 34 chromosomes pre-flavopiridol, n = 46 chromosomes post-flavopiridol) and a construct where the fluorophores were linked in reverse order, EGFP-Ki-67-mCherry (G-Ki-67-R: n = 40 chromosomes pre-flavopiridol, n = 39 chromosomes post-flavopiridol). Bars represent mean, significance was tested by a two-tailed unpaired t-test (****P = 2.1 ×10⁻⁸, ****P = 2.3 × 10⁻⁶). d, Model of Ki-67 organization on chromosome surfaces during early mitosis and during mitotic exit. e, Ki-67 KO cell expressing low levels of H2B-mNeonGreen. Representative example of 14 cells. f, Spindle-less mitotic exit in wild-type cells and in Ki-67 knockout (KO) cells overexpressing H2B-mNeonGreen to high levels to suppress the Ki-67 knockout individualization failure phenotype. Live cells were imaged in the presence of nocodazole; flavopiridol was added (t = 0 min) to induce mitotic exit. Z-projection. g, Normalized chromosome convex hull area quantification of 24 wild-type and 22 Ki-67 KO cells as in (f). Lines and shaded areas represent mean ± SD. Scale bars 1 μm (a), all others 10 μm.
The collapse of Ki-67 molecular brushes suggests an inactivation of surfactant function, which might be sufficient to promote chromosome clustering. However, we also considered the possibility that Ki-67 actively contributes to chromosome clustering. To investigate this idea, we aimed to compare chromosome adhesion in wildtype cells and Ki-67 knockout cells. As Ki-67-knockout cells do not individualize chromosomes during early mitosis8 (Fig. 3e), it is impossible to analyze their chromosome clustering during mitotic exit. Therefore, to evaluate the role of Ki-67 in clustering, we established conditions in which prometaphase chromosomes can form separate bodies in the absence of Ki-67. We previously showed that high-level overexpression of core histones restores chromosome separation in prometaphase cells that lack Ki-67, possibly through the addition of positive electrical charge8. Therefore, we imaged Ki-67 knockout cells8 that overexpress H2B-mNeonGreen to sufficiently high levels for chromosome separation to occur. Upon mitotic exit, these cells completely failed to cluster chromosomes. In contrast, wild-type cells overexpressing similarly high levels of H2B-mNeonGreen still clustered chromosomes efficiently during mitotic exit (Fig. 3f, g), indicating that overexpression of H2B is not sufficient to prevent clustering. In addition, expression of transgenic EGFP-Ki-67 restored chromosome clustering in Ki-67 knockout cells overexpressing high levels of histones (Extended Data Fig. 7a–c). Thus, Ki-67 appears to promote chromosome clustering during mitotic exit, in contrast to its chromosome-repelling activity in prometaphase cells.
As H2B overexpression to high levels might have unknown side-effects on chromosome organization, we established an alternative method to individualize chromosomes in Ki-67 knockout cells. Hypothesizing that electrical charge might be relevant8, we tested the effect of global chromosome hyperacetylation resulting from the inhibition of histone deacetylases by trichostatin A17 and indeed observed individualized chromosomes in Ki-67 knockout cells (Extended Data Fig. 7d–f). Flavopiridol induced chromosome clustering in trichostatin A-treated wildtype cells, but not in Ki-67 knockout cells. Furthermore, expression of transgenic EGFP-Ki-67 restored chromosome clustering in Ki-67 knockout cells (Extended Data Fig. 7f, g). These observations corroborate that Ki-67 actively contributes to chromosome clustering during mitotic exit.
Ki-67 might promote chromosome clustering by recruiting protein phosphatase 1 (PP1) during anaphase18. However, mutating the Ki-67 RVSF motif, required for PP1 binding18, to RASA did not prevent chromosome clustering during mitotic exit (Extended Data Fig. 8a–d). Furthermore, Ki-67-RASA protein tagged by red and green fluorophores on either terminus, respectively, formed intact molecular brushes in prometaphase cells that collapsed during mitotic exit (Extended Data Fig. 8e). Moreover, Ki-67 knockout cells efficiently dephosphorylated serine 10 on histone 3 during mitotic exit (Extended Data Fig. 8f, g) and decondensed chromosomes at normal rates (Extended Data Fig. 10d). Thus, Ki-67 promotes chromosome clustering through intrinsic properties rather than through recruitment of PP1.
Our model predicts that increasing surface adhesion should be sufficient to induce chromosome clustering. To test this hypothesis, we engineered a system to acutely increase adhesion between chromosomes. We therefore co-expressed H2B-fused to either FRB or FKBP domains, respectively, such that contacts between these chromosome-bound proteins can be chemically stabilized by the addition of rapamycin19. The expression of H2B-FRB and H2B-FKBP had no detectable effect on chromosome organization in prometaphase, but addition of rapamycin caused clustering within few minutes (Extended Data Fig. 9a–c, Supplementary Video 4). Control cells expressing only H2B-FKBP did not change chromosome organization upon addition of rapamycin (Extended Data Fig. 9b, c, Supplementary Video 4), validating specificity of the phenotype. Thus, increasing chromosome adhesion is sufficient to induce chromosome clustering, even in the absence of any other mitotic-exit-specific activities.
Chromosome clustering removes cytoplasm
Clustering-deficient Ki-67 knockout cells that overexpress high levels of histones enable to investigate how chromosome clustering contributes to nucleo-cytoplasmic segregation. To first verify that chromosome clustering-deficient cells assemble a transport-competent nuclear envelope, we imaged the import substrate IBB-EGFP. We found that IBB-EGFP was efficiently imported following induction of mitotic exit with only a very slight delay compared to clustering-competent control cells (Extended Data Fig. 10a, b, compare Extended Data Fig. 3e, f). Hence, chromosome clustering is not required for nucleo-cytoplasmic targeting via nuclear-pore-mediated transport.
To determine whether chromosome clustering is required for the exclusion of large cytoplasmic components during nuclear assembly, we first imaged GEMs. GEMs were not excluded from inter-chromosomal regions during mitotic exit in clustering-deficient Ki-67 knockout cells, in contrast to control cells overexpressing H2B-mCherry to similar levels (Fig. 4a–c, Extended Data Fig. 10c, d, Supplementary Video 5). Thus, suppression of chromosome clustering leads to contamination of the nucleus with large cytoplasmic components.
Figure 4. Ki-67-regulated chromosome clustering removes cytoplasm from the reassembling nucleus.
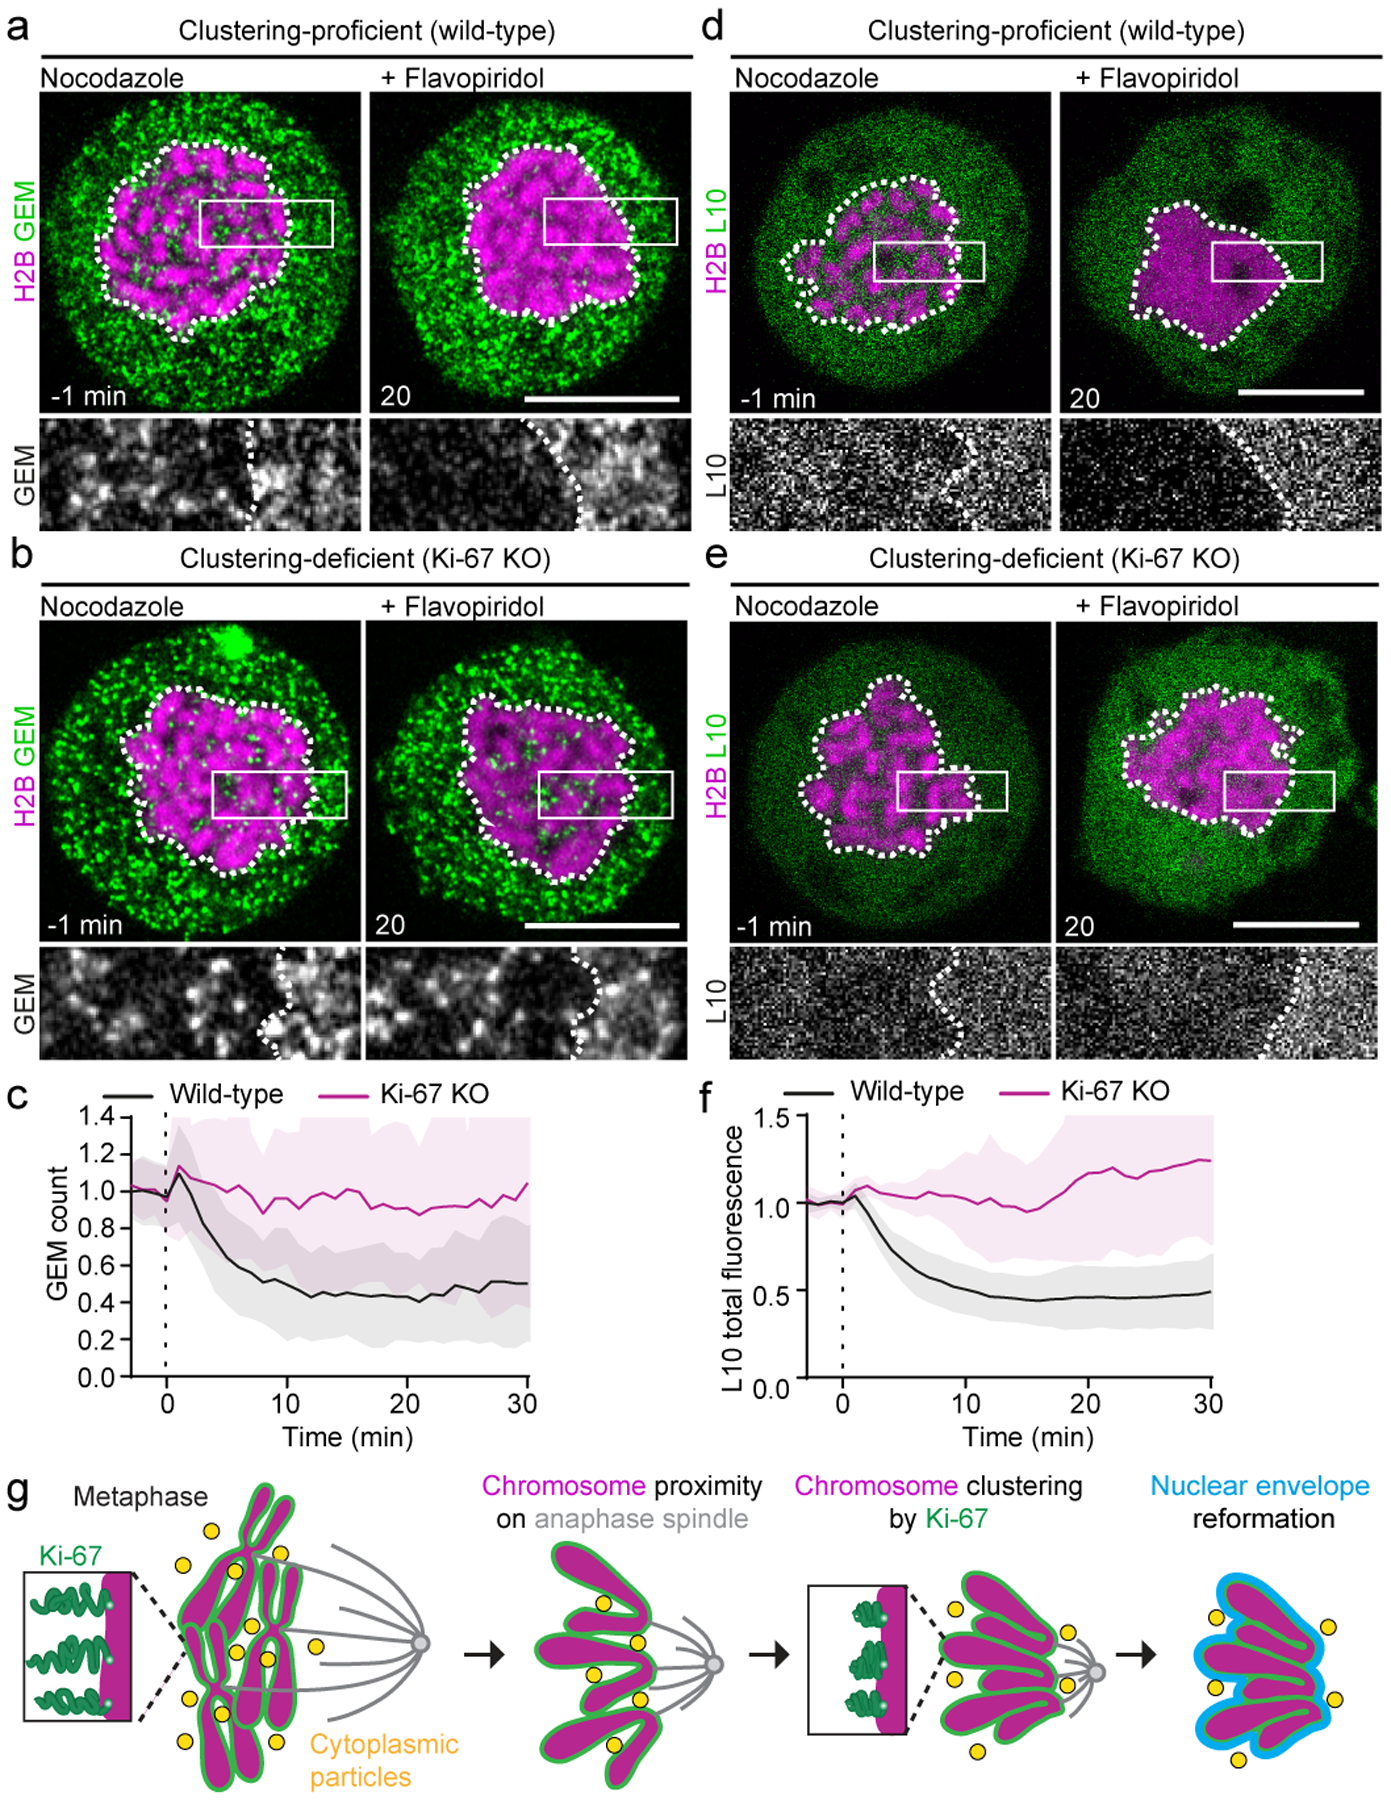
a, b, Time-lapse microscopy of spindle-less mitotic exit in clustering-proficient wild-type HeLa cell (a) and clustering-deficient Ki-67 KO HeLa cell (b). Cells stably expressed GEMs and transiently expressed H2B-mCherry; images show time point 1 min before and 20 min after flavopiridol-induced mitotic exit in presence of nocodazole. c, Quantification of GEM localization in 46 clustering-proficient wild-type and 29 clustering-deficient Ki-67 KO cells as in (a, b). Particle numbers were quantified in chromosomal area as in Fig. 2c, d and normalized to average of particle number pre flavopiridol. t = 0 min refers to addition of flavopiridol. Analyzed cells expressed H2B-mCherry at similar levels in both genetic backgrounds (Extended Data Fig. 10c). d, e, Time-lapse microscopy of clustering-proficient wild-type cells (d) and clustering-deficient Ki-67 KO cells (e) stably expressing ribosomal protein L10-EGFP and transiently expressing H2B-mCherry, before and after mitotic exit ind-ction in presence of nocodazole. f, Quantification of L10-EGFP total fluorescence within chromosomal area for conditions shown in (d, e). t = 0 min refers to flavopiridol addition, data normalized to average values of pre-flavopiridol addition. Analyzed cells expressed H2B-mCherry at similar levels in both conditions (Extended Data Fig. 10g). n = 23 cells (wild-type), n = 8 cells (Ki-67 KO). Individual Ki-67 KO curves shown in Supplementary Figure 2. g, Model of nuclear assembly during mitotic exit. Lines and shaded areas represent mean ± SD, dashed vertical lines indicate flavopiridol addition. Single Z-slices shown; scale bars, 10 μm.
Analysis of L10-EGFP localization during mitotic exit in clustering-deficient cells revealed that ribosomes display similar behavior. Clustering-proficient wild-type cells overexpressing H2B-mCherry efficiently excluded L10-EGFP from chromosome clusters during mitotic exit (Fig. 4d–f), even when Exportin-1 was inhibited by Leptomycin B (Extended Data Fig. 10e, f). In contrast, L10-EGFP was not excluded from the reassembling nucleus in clustering-deficient Ki-67 knockout cells (Fig. 4e, f; Extended Data Fig. 10g, h). Hence, chromosome clustering is required for the exclusion of mature ribosomes from the nucleus.
Conclusions
Our study reveals that chromosome interactions during mitotic exit contribute to nucleo-cytoplasmic compartmentalization in vertebrate cells. Our data support a model where chromosomes are first moved into proximity by the anaphase spindle and then tightly clustered by Ki-67-regulated surface adhesion, such that bulk cytoplasm is displaced before the nuclear envelope seals the nuclear compartment (Fig. 4g). Chromosome clustering prevents contamination of the nucleus with soluble particles that are too large for export through nuclear pores, thus enabling efficient separation of cytoplasmic and nuclear processes.
Our findings raise interesting questions about how large components that need to be re-targeted to the nucleus after mitosis avoid exclusion. Nuclear inclusion might be achieved by tight association with chromosomes. Indeed, many nucleolar proteins and pre-ribosomal RNAs remain associated with chromosomes throughout mitosis20 in a dense peripheral layer that occupies almost half of the chromosome volume21. Nucleo-cytoplasmic compartmentalization might therefore involve an interplay between retention of chromosome-associated factors and exclusion of bulk cytoplasm.
Methods
Cell lines and cell culture
All cell lines used in this study have been regularly verified negative for mycoplasm contamination. Their sources and authentication is summarized in Supplementary table 1. All HeLa cell lines were derived from a HeLa “Kyoto” cell line previously described in22. Cells were cultured in Dulbecco’s modified medium (DMEM; Sigma, D5648) containing 10% (v/v) fetal bovine serum (FBS; Gibco, 10270), 1% (v/v) penicillin-streptomycin (Sigma Aldrich), 1% (v/v) GlutaMAX (Gibco; 35050038) and respective selection antibiotics: blasticidin (6 μg ml−1, Thermo Fisher), puromycin (0.5 μg ml−1, Calbiochem), hygromycin B (0.3 mg ml−1, Roche) and G418 (1 mg ml−1, Invitrogen). Chromatin visualization was achieved through stable (Fig. 1, Fig. 2, Extended Data Fig. 2, Extended Data Fig. 3, Extended Data Fig. 4, Extended Data Fig. 5, Extended Data Fig. 6a–f, Extended Data Fig. 7a, b) or transient (Fig. 3e–g, Fig. 4, Extended Data Fig. 10) expression of histone H2B labeled with mCherry, mRFP or mNeonGreen or alternatively by labelling with 100 nM SiR-Hoechst23 (Extended Data Fig. 6g–j, Extended Data Fig. 7f, g, Extended Data Fig. 8c, d) or with Hoechst 33342 (1 μg ml−1, Invitrogen) (Extended Data Fig. 8f– g). All cytoplasmic markers were visualized through stable expression of EGFP-fused constructs, except for NES-GFP (Extended Data Fig. 2c, d), which was transiently transfected into cells. Live cell imaging was performed in DMEM containing 10% (v/v) fetal bovine serum, 1% (v/v) penicillin-streptomycin, 1% (v/v) GlutaMAX (Gibco, 35050038) but omitting riboflavin and phenol red to reduce autofluorescence22. Cells were grown in either plastic bottom 96-well plates (μ Clear; Greiner Bio-One), on LabTek chambered coverglass (Thermo Scientific) or in 8-well glass bottom μ-slides (Ibidi).
Generation of stable cell lines
For generation of cell lines stably expressing fluorescently labeled marker proteins, we used random plasmid integration (transfection conditions see below) or a lentiviral vector system pseudotyped with murine ecotropic envelope that is rodent-restricted (RIEP receptor system). Construction of RIEP receptor parental cell lines and subsequent generation of stable cell lines expressing fluorescently marker proteins was performed as described in15. Genome editing was performed using CRISPR/Cas9 nickase strategy. Single guide RNAs (sgRNAs) were cloned into pSPCas9n(BB)-2A-GFP (pX461, Zhang lab24). For mutation of the PP1 binding motif RVSF to RASA in Ki-67 a repair template with 750 bp homology flanks on each site was designed (see scheme Extended Data Fig. 8a). The repair template carried an additional silent mutation at the PAM site of one of the 2 sgRNAs and was clone in plasmid pCR2.1 (Life Technologies). The plasmid mix of guide RNA plasmids and the repair template was transfected into HeLa cells using X-tremeGENE 9 DNA transfection reagent (Roche). 2 days after transfection cells were sorted for the presence of Cas9 (GFP positive) and another 6 days later for the absence of Cas9 (GFP negative) using Fluorescence-activated cell sorting (FACS) into 96 well plates. Genotyping was performed as in15.
Plasmid and siRNA transfections
For both transient and stable expression of fluorescently labeled markers, the genes were cloned into IRES vectors with respective antibiotics that allow the protein of interest and the resistance gene to be expressed from the same transcript (see Supplementary table 2). For transient expression, plasmids were transfected using X-tremeGENE 9 DNA transfection reagent (Roche) following manufacturer’s instructions or PEI transfection reagent (1mg ml−1 stock, Polysciences, 4 μg of transfection reagent per 1 μg of plasmid) with 48 h incubation prior to imaging. DNA amounts were optimized for each assay and varied between 0.25 μg and 2 μg per 3 μl transfection reagent and 100 μl Opti-MEM. For stable expression plasmids were transfected using PEI transfection, and incubated for 48 h before antibiotic selection.
siRNAs were delivered with Lipofectamine RNAiMax (Invitrogen) according to the manufacturer’s instructions. BAF was targeted using 18 nM s16808 (AGAUUGCUAUUGUCGUACUtt, Thermo Fisher Silencer Select) and analyzed after 72 h, XWNeg9 (UACGACCGGUCUAUCGUAGtt, Thermo Fisher Silencer Select, custom) was used as non-targeting siRNA control. Mad2 was targeted by 10 nM siRNA with the target sequence AAGAGTCGGGACCACAGTTTA (custom siRNA, Qiagen) for 28 h.
Inhibitors and stains
To arrest cells in prometaphase, cells were incubated for 2 – 4 h in 200 ng ml−1 nocodazole (Sigma). Acute spindle depolymerization was induced with 3 μg ml−1 nocodazole. To arrest cells in metaphase, cells were incubated for 30 min in 10 μM MG132 (Sigma Aldrich). Mitotic exit was induced by addition of flavopiridol (Tocris Bioscience) to a final concentration of 20 μM or reversine (Sigma Aldrich) to a final concentration of 1 μM. Exportin-1/CRM1 was inhibited by 2 h incubation in leptomycin B (Sigma Aldrich), final concentration 1 μg ml−1. Actin was depolymerized by 2 h incubation in 1 μM latrunculin B (Sigma Aldrich). For viability measurements TO-PRO-3 Iodide (Molecular Probes) was used at a final concentration of 1 μM. Rapamycin (Calbiochem 5S3210) was used at a final concentration of 500 nM. Trichostatin A (Sigma T8552) was added 2 h before imaging at a final concentration of 0.5 μM.
Western blotting
Ribosome samples were separated on NuPage 4–12% gradient Bis-Tris gels (Invitrogen), and transferred to a nitrocellulose membrane (Bio-Rad) by wet blotting. Fluorescently labeled RPL10 was probed by monoclonal mouse anti-RPL10 antibody (Thermo Fisher, MA526901, 1:2000). H2B were probed by polyclonal anti-H2B antibody (Abcam, ab1790). Horse radish peroxidase anti-mouse or anti-rabbit secondary antibodies (Bio-Rad, 1:5000) were visualized using ECL Plus Western Blotting Substrate (Thermo Scientific) on a Bio-Rad ChemiDoc Imager. BAF-depleted samples were immunoblotted as previously described15.
Ribosome fractionation
50 million cells stably expressing EGFP-tagged ribosomal protein L10 were lysed for 5 min on ice (lysis buffer: 15 mM HEPES, 6 mM MgCl2, 300 mM NaCl, 0.5% NP40 with one tablet of mini cOmplete protease inhibitor (Roche) and 40 U μl−1 RNAseOUT (Thermo Fisher)). 200 μl of the lysate was separated on 10–50% sucrose gradient via ultracentrifugation at 35.000 g for 2.5 h at 4°C (SW 40 Ti rotor) and then fractionated into 40 fractions using customized fraction collector. Ribosome fractions were precipitated using 100% (w/v) trichloroacetic acid at 4°C over night. The precipitate was washed twice in cold acetone and dissolved in 2x SDS loading buffer. Fractions specifically corresponding to peaks of absorbance were blotted (as indicated with dashed lines in Extended Data Fig. 1d).
Live cell microscopy
Cell proliferation, mitotic duration, and apoptotic index was scored in images recorded with an ImageXpressMicro XL screening microscope (Molecular Devices) using a × 10 0.5 NA S Fluor dry objective (Nikon), operated by in-house developed Metamorph macros. Time-lapse imaging was performed on customized confocal Zeiss LSM780 microscope, using × 40 or × 63, 1.4 NA, Oil DIC Plan- Apochromat objective (Zeiss), operated by ZEN 2011 software. Time-lapse videos with GEM particle counts (Fig. 1a–e, Fig. 2c, d, Fig. 4a–c, and Extended Data Fig. 6a–c, Supplementary Video 1, 5) were in addition recorded on Airyscan confocal Zeiss LSM880 microscope, using × 63, 1.4 NA, Oil DIC Plan-Apochromat objective (Zeiss) combined with the Airyscan detector, operated by ZEN 2011. Data sets from both microscopes were combined in Fig. 2d, Fig. 4c and Extended Data Fig. 6b–c. For all microscopes, an incubator chamber (European Molecular Biology Laboratory (EMBL), Heidelberg, Germany) provided humidified atmosphere and constant 37°C temperature with 5% CO2.
Immunofluorescence
Dephosphorylation kinetics in Extended Data Fig. 3a–d were quantified by imaging live single cell unperturbed and spindle-less mitosis, and retrieving positions after fixation and staining. Dephosphorylation kinetics in Extended Data Fig. 8f–g were quantified by imaging fields of cells fixed after indicated time relative to flavopiridol addition. To enrich for prometaphase arrested cells 2 h nocodazole incubation was performed in flasks and subsequently mitotic cells were collected by shake off and re-seeded into imaging dishes in nocodazole. To reduce variability caused by background noise, cells from both genetic backgrounds were mixed and seeded together. Wild-type cells were distinguished from Ki-67 KO by EGFP-labeled membrane myristylation-palmytoilation marker (> 97% of cells expressed the marker in WT cell population). Acetylated H3 levels in Extended Data Fig. 7d, e were quantified from cells fixed after 2 h of nocodazole or nocodazole/TSA incubation in imaging dishes.
In all immunofluorescence experiments cells were fixed with 4% formaldehyde (Thermo Fisher) in PTEM buffer (50 mM PIPES (Sigma) pH 6.8, 10 mM EGTA (Sigma Aldrich), 1 mM MgCl2, 0.2% Triton X-100 (Sigma Aldrich)) for 5 min. Fixation reaction was quenched with 10 mM TRIS in PBS, washed again with PBS and blocked in 2% BSA (Sigma Aldrich) in PBS for 1 h. H3-pS10 was probed using monoclonal mouse antibody (Millipore, 05–806, 1:5000) and visualized by using goat anti-mouse Alexa Fluor 488 secondary antibody (Molecular Probes, A11001, 1:1000) (Extended Data Fig. 3a–d) or by using goat anti-mouse Alexa Fluor 568 secondary antibody (Molecular Probes, A11004. 1:1000) (Extended Data Fig. 8f, g). Acetylated H3 was probed using rabbit polyclonal antibody (Millipore, 06–599, 1:200) and visualized using goat anti- rabbit Alexa Fluor 594 secondary antibody (Molecular Probes, A-11037, 1:500) (Extended Data Fig. 7d, e).
Image analysis
Cell viability, proliferation, mitotic duration
To quantify cell viability, the number of live cells (negative for TO-PRO-3 Iodide) was manually counted. Cell proliferation was measured as fold-change in the number of live cells within 24 h. Mitotic duration was determined based on manual identification of chromatin morphologies specific from prophase to anaphase onset during the course of a video.
Chromosome area measurements by active contours
In Fig. 1d, e the chromosome area was measured in a central z-section (9 z-sections recorded with 1 μm spacing, section selected based on visual inspection). The chromatin channel was denoised using Gaussian blur filter (σ = 2) and thresholded using ImageJ’s Huang method25. Next, the ensemble chromatin mass was converted to a ROI by using Fiji’s “Analyze Particles” function. Subsequently, an ellipse was fitted to each ROI using ImageJ’s build in “Fit Ellipse” function and enlarged by 2 μm. The ellipses surrounding chromatin masses were then used as seeding points for applying ImageJ’s “Level sets” plugin using active contours method. Acquired ROIs were then additionally shrunk by 0.8 μm using ImageJ’s “Enlarge” function. At anaphase onset, one of the two ensembles of chromosomes was randomly selected for measurements. All datapoints were normalized to the average area of all values before anaphase onset.
Quantifications of cytoplasmic probes
In Fig. 1b, c regions of interest were drawn manually around the nucleus (− 2 min before nuclear envelope breakdown (NEBD) = prophase) and the entire set of chromosomes (6 min after NEBD = prometaphase) in manually determined central z-sections (5 z-sections recorded with 1.5 μm spacing). The number of GEM particles within ROIs was determined using ImageJ’s “Find Maxima” function. GEM density (number of particles/area) within the ROI was normalized to GEM density within an arbitrary cytoplasmic region.
In Fig. 1d, e chromosomal ROIs were determined by active contour area measurements (see above). For normalization, cytoplasmic ROIs were generated by subtracting the chromosomal ROI from a 3 μm enlarged chromosomal ROI (using ImageJ’s function “Enlarge”) yielding a rim ROI around the chromosome ensemble. The number of GEM particles was measured as described above.
In Fig. 1f–i and Extended Data Fig. 2a–d the central z-section was determined using a custom Image J script that tracks 3D segmented chromatin mass for each time point and extracts the slice with the largest chromatin area in xy. Chromosomal ROIs were determined by active contour area measurements (see above) and IBB/L10/NES mean fluorescence was measured within these ROIs. Background signal in a circular ROI outside the cell was subtracted and values were normalized to mean fluorescence in cytoplasmic regions measured in a rim ROI around the chromosome ensemble (Fig. 1f, g and Extended Data Fig. 2 a, b; see above) or to pre-anaphase frames (Fig. 1h, i and Extended Data Fig. 2c, d).
In Fig. 2, Fig. 4, Extended Data Fig. 6a–c, Extended Data Fig. 10a–b the central z slice was determined using a custom Image J script described above (9 z-sections recorded with 1.5 μm spacing). Chromosomal ROIs were determined by active contour area measurements (see above), except that instead of an ellipse, a circle was fitted to the thresholded chromatin, using ImageJ’s “Fit Circle” function. Total background fluorescence subtracted was determined as a product of mean fluorescence outside of the cell and the active contour area within the cell. Measured fluorescence intensities/particle counts were normalized to the average fluorescence intensity/particle counts before flavopiridol addition.
At anaphase onset, one of the two chromosome ensembles was randomly selected for quantification. When using “Level sets” or “Find maxima” Fiji’s functions parameters were adjusted by visual determination in one cell and applied to all cells within the experiment. Normalizations were calculated using Microsoft Excel, graphs were generated in Graph Pad Prism.
Chromosome convex hull area measurements
Chromosome area was segmented in maximum intensity z-projections of H2B-mCherry or SiR-Hoechst images (5–9 z-sections with 0.5–1.5 μm spacing), except in Extended Data Fig. 5 where the segmentation was obtained in single central z-slice determined using custom image J script described above. If significant bleaching was observed, a bleach correction by frame-wise exponential fitting using the Image J plugin “Bleach correction” (K. Miura, http://fiji.sc/Bleach_Correction) was performed prior to segmentation. The (bleach corrected) maximum intensity projection was denoised using Gaussian blur filter (σ = 2), subsequently thresholded using ImageJ’s default automated method (a variation of the IsoData algorithm) or Otsu threshold and converted to a binary image. To calculate the area occupied by chromosomes a convex hull algorithm (Convex hull plus plugin for Fiji, G. Landini, 2004, http://www.mecourse.com/landinig/software/software.html)) was applied to the resulting binary image. All datapoints were normalized to the average chromosome convex hull area before flavopiridol addition for each cell.
Interchromosomal space analysis
The interchromosomal space analysis was performed on a single z-section. The z-section with the highest H2B fluorescence corresponded to the center section and was automatically extracted by a custom Image J script. Subsequently, chromosomes were segmented and convex hull analysis performed as described above. Next, the area of the segmented chromosomes was calculated using Fiji’s build in “Analyze Particles” function. All areas of segmented chromosomes per time point were summed up using a custom R script and substracted from the convex hull (see above) area to yield the interchromosomal space. All datapoints were normalized to the average interchromosomal space of all values before flavopiridol addition for each cell using R.
Histone fluorescence intensity measurements
Histone fluorescence was quantified 3 min prior to flavopiridol addition. For this, the convex hull area around chromosomes was determined in average intensity projections of H2B-mCherry images (9 z-sections with 1.5 μm spacing) as described above. The resulting ROI was applied to the average projection image of H2B-mCherry and total fluorescence intensity was measured within this ROI. Measurements from all experimental conditions were normalized to the mean of all cell measurements in wild-type background using Microsoft Excel.
H3-pS10 and acetyl-H3 fluorescence intensity measurements
Mean fluorescence intensity of H3-pS10 was measured within a mask obtained by thresholding the chromatin channel using ImageJ’s Huang method25. Background signal was subtracted by measuring a circular ROI outside of cell. Acetyl-H3 mean fluorescence intensity was measured in maximum projections using a primary segmentation mask in the chromatin channel defined by local adaptive threshold using CellCognition Explorer26. The primary mask was dilated by 5 pixels and used for intensity measurement in the acetylated-H3 (Alexa Fluor 594) channel.
Quantification of Lap2β and BAF in a rim around the ensemble of chromosomes
Quantification of Lap2β was performed in Fiji on a single central z-section that was manually chosen for each cell (6 z-sections with 2 μm spacing recorded). First, to segment the ensemble of chromosomes a Gaussian blur filter (σ = 2) was applied to the H2B-mRFP fluorescence, the image was thresholded using ImageJ’s default method (a variation of the IsoData algorithm) or Otsu threshold, converted to a binary image and the “Fill Holes” operation performed. If significant bleaching was observed, a bleach correction by frame-wise exponential fitting using the Image J plugin “Bleach correction” (K. Miura, http://fiji.sc/Bleach_Correction) was performed. Next, the ensemble chromatin mass was converted to a ROI by using Fiji’s “Analyze Particles” functions. To generate a ROI that constitutes a rim around the ensemble chromatin mass, a 10 px shrunk ROI was substracted from a 10 px enlarged ROI (1 pixel = 83 nm). The resulting rim ROI was transferred to the EGFP channel and the Lap2β-GFP signal inside this ROI was measured. For measuring EGFP-BAF enrichment, the ROI around the ensemble chromatin mass was generated as above except with 15 px shrunk and 5 px enlarged ROIs. Background signal was substracted by measuring a rectangle ROI outside the cell. Using R, the signals were normalized to the mean value measured before flavopiridol addition for each cell.
Quantification of Ki-67 levels on chromosomes
Quantification of EGFP-Ki-67 fluorescence in flavopiridol-induced mitotic exit (Extended Data Fig. 6i, j) was performed in Fiji on a maximum projection of 6 slices with 1.5 μm spacing. Chromosome convex hull area was obtained as described above, added to the ROI manager and the ROI was transferred to the GFP signal to measure EGFP-Ki-67 inside the convex hull. Using R, the signals were normalized to the mean value measured before flavopiridol addition for each cell.
For quantification of Ki-67 during metaphase-to-anaphase transition (Extended Data Fig. 6g–h), cells expressing EGFP-Ki-67 were automatically imaged and subsequently analysed using CellCognition Explorer26 as follows. A supervised machine learning program was used to systematically search low resolution images online for metaphase cells, return the position to an Autofocuscreen macro (Autofocuscreen, http://www.ellenberg.embl.de/index.php/software) provided by the Ellenberg lab (EMBL, Heidelberg, Germany) and trigger the acquisition of a high-resolution time lapse recording with 1 min timelapse and 5 Z slices (2 μm spacing). For the intensity measurements in the maximum projection of the EGFP channel, a primary segmentation mask in the chromatin channel was defined by applying a local adaptive threshold using CellCognition Explorer. This primary mask was dilated by 6 pixels and used for intensity measurements in the EGFP channel. For tracking the chromosome ensembles over time, a nearest neighbour tracking approach that recognized also split and merge events of cell trajectories was used. Trajectories that did not contain a split event or contained a split event caused by segmentation errors or linking errors caused by the tracking algorithm were excluded from the analysis. Using R, the signals were normalized to the mean value measured before anaphase onset for each cell.
Kinetochore tracking
Three-dimensional confocal time-lapse images with 9 z-sections with a spacing of 500 nm were recorded every 10 s and Fiji (ImageJ 1.47m) was used for the following bleaching and movement corrections. After a maximum intensity projection of all z-sections, a bleach correction by exponential fitting using the ‘Bleach Correction’ plugin (K. Miura, http://fiji.sc/Bleach_Correction) was performed. Kinetochore videos were registered using ‘StackReg’ Fiji plugin27 to correct for translation and rotation of the entire set of chromosomes (rigid body transformation). Kinetochore spot detection and tracking was performed using Imaris software (Bitplane) with the following parameters: Brownian motion, maximal distance 0.8 μm, maximal gap size 2, track length > 5 frames. Data from Imaris was imported into Matlab using a custom Matlab script. Tracks were split into tracks before flavopiridol (−240 – 0 s) and after flavopiridol (400 – 640 s). MSD analyses and computation of diffusion coefficient were performed using of MSDANALYZER script28 with ‘centroid drift correction’ which derives the drift by computing the center of mass of all particles at each time point. The MSD was calculated separately for the tracks before and after flavopiridol addition for each individual kinetochore trajectory at any given delay. Subsequently the weighted average over all MSD curves from one cell was computed. The diffusion coefficient (D) was estimated from the weighted mean MSD curve by fitting a linear function using the first quarter of the curve and calculating D from the following equation: MSD = 2dDt with d = dimensionality and t = time.
Measuring Ki-67’s molecular extension perpendicular to the chromosome surface in taxol and after flavopiridol induced mitotic exit
We treated live cells expressing mCherry-Ki-67-EGFP with the microtubule-stabilizing drug taxol to keep chromosomes apart after induction mitotic exit, thereby facilitating analysis of Ki-67 conformation at individual chromosome surfaces. To measure average distances between N- and C-terminal labels with different fluorescence spectra, we fitted Gaussian functions to line profiles. We previously demonstrated that we can measure the distance between two 500 nm TetraSpeck fluorescent beads (Invitrogen, T14792) with an accuracy of 2.9 ± 2.2 nm8 since the translational shift between color channels can be largely corrected by separately measuring peak-to-peak distances between two beads in the x/y plane.
To measure the average distance between Ki-67’s N- and C-termini, taxol-arrested cells expressing mCherry-Ki-67-EGFP or EGFP-Ki-67-mCherry with or without the RASA mutation were recorded (x63 objective, 100 nm pixel size and linescan mode) before and 3 – 10 minutes after flavopiridol addition. Only chromosomes that had their arms oriented perpendicular to the imaging plane were analyzed. From those chromosomes, we measured line profiles of the red and green channel that sectioned a single sister chromatid. After background subtraction and normalization to total fluorescence intensity, we fitted the sum of two Gaussian functions and measured the distance between the Gaussian center positions separately for green and red fluorescence channels using R. The derived distance represents the sum of both chromatic shifts perpendicular to the chromosome surface, and the molecular extension of Ki-67 along this axis can thus be derived by dividing this value by two. Imaging Ki-67 constructs with inverted positions for mCherry and EGFP yielded the expected inverted peak-to-peak distance, thus validating that the detected shift between fluorophore positions cannot be attributed to chromatic aberrations of the imaging system.
Airyscan Data processing
Raw images recorded using Airyscan detector were processed using ZEN 2011 software.
Statistical analyses
Data were tested for normality and equal variances with Shapiro-Wilk or D Agostino & Pearson and Levene’s tests (α = 0.05), respectively. The appropriate statistical test was chosen as follows: Unpaired normal distributed data were tested with a two-tailed t-test (in case of similar variances) or with a two-tailed t-test with Welch’s correction (in case of different variances). Unpaired not normal distributed data were tested with two-tailed Mann-Whitney test (in case of similar variances) or with a two-tailed Kolmogorov-Smirnov test (in case of different variances). Paired normal distributed data were tested with two-tailed t-test and paired not normal distributed data were tested with a Wilcoxon matched-pairs signed rank test. All tests were performed with Prism7, except Levene’s test was performed in R.
Sample numbers
Fig. 1b, c: Representative example and quantification of 19 cells. Fig 1d, e: Representative example and quantification of 22 cells. Fig. 1f, g: Representative example and quantification of 30 cells. Fig. 1h, i: Representative example and quantification of 12 cells. Fig. 2a, b: Representative example and quantification of 16 cells. Fig. 2c, d: Representative example and quantification of 35 cells. Fig. 3 a–c: Chromosome numbers: R-Ki-67-G Pre Flavo (n = 34), R-Ki-67-G Post Flavo (n = 46), G-Ki-67-R Pre Flavo (n = 40), G-Ki-67-R Post Flavo (n = 39). Fig. 3f, g: Cell numbers: wild-type (n = 24), Ki-67 KO (n = 22). Fig. 4a–c and Extended Data Fig. 10c, d: Cell numbers: wild-type (n = 46) and Ki-67 KO (n = 29). Fig. 4d–f and Extended Data Fig. 10e–h: Cell numbers: wild-type (n = 23), Leptomycin B treated (n = 22) and Ki-67 KO (n = 8). Extended Data Fig. 1a–c: Cell viability: wild-type (n = 754 cells), GEMs (n = 930 cells), L10-EGFP (n = 603 cells); Cell proliferation: wild-type (n = 2001 cells), GEMs (n = 2283 cells), L10-EGFP (n = 2178 cells); Mitotic duration (n = 320 cells per cell line). Extended Data Fig. 2a, b: Representative example and quantification of 16 cells. Extended Data Fig. 2c, d: Cell numbers: wild-type (n = 18), Leptomycin B treated (n = 15). Extended Data Fig. 3a–d: Representative examples and quantification: metaphase (n = 9 cells), 3–6 min after anaphase onset (n = 14 cells), more than 8 min after anaphase onset (n = 8 cells), prometaphase (n = 11 cells), 10 min after flavopiridol addition (n = 12 cells), 20 min after flavopiridol addition (n = 13 cells). Extended Data Fig. 3e, f: Representative example and quantification of 20 cells. Extended Data Fig. 3g, h: Representative example and quantification of 11 cells. Extended Data Fig. 3i: Representative example of 14 cells. Extended Data Fig. 4a, b: Cell number wild-type (n = 13), Latrunculin B treated (n = 22) cells. Extended Data Fig. 4c, d: Representative example and quantification of 21 cells. Extended Data Fig. 4e-h: Representative example and quantification of 13 cells. Extended Data Fig. 5a, b: Representative examples and quantification. Cell number: DMSO control: n = 24 cells, flavopiridol treated: n = 25 cells. Extended Data Fig. 5c, d: Representative examples and quantification. Sample number: nocodazole treated: n = 27 cells, nocodazole and flavopiridol treated: n = 23 cells. Extended data Fig. 6a-c: Representative example and quantification of 23 control and 23 siBAF treated cells. Extended Data Fig. 6e, f: Sample number n = 21 cells. Extended Data Fig. 6g, h: Representative example and quantification of 41 cells. Extended Data Fig. 6i–j: Representative example and quantification of 27 cells. Extended Data Fig. 7a, b: Representative examples and quantification. Cell numbers: Ki-67 KO (n = 29), Ki-67 KO + EGFP-Ki-67 (n = 28). Extended Data Fig. 7c: Representative example of 2 experiments. Extended Data Fig. 7d, e: Representative examples and quantification. Cell numbers: Ki-67 KO (n = 115), Ki-67 KO + TSA (n = 111). Extended Data Fig. 7f, g: Representative examples and quantification. Cell numbers: Ki-67 KO (n = 21), Ki-67 WT (n = 31), Ki-67 KO + EGFP-Ki-67 (n = 32). Extended Data Fig. 8c, d: Cell numbers: WT (n = 22), RASA (n = 23). Extended Data Fig. 8e: Cell numbers: R-Ki-67(RASA)-G Pre Flavo (n = 32), R-Ki-67(RASA)-G Post Flavo (n = 28), G-Ki-67(RASA)-R Pre Flavo (n = 37), G-Ki-67(RASA)-R Post Flavo (n = 34). Extended Data Fig. 8f, g: Representative examples and quantification of two experiments. Cell numbers: wild-type pre-flavopiridol n = 38, wild-type 5 min post-flavopiridol n = 61, wild-type 10 min post-flavopiridol n = 72, wild-type 20 min post-flavopiridol n = 73, Ki-67 KO pre-flavopiridol n = 23, Ki-67 KO 5 min post-flavopiridol n = 61, Ki-67 KO 10 min post flavopiridol n = 65, Ki-67 KO 20 min post flavopiridol n = 55. Extended Data Fig. 9b, c: Cell numbers H2B-FKBP + H2B-FRB (n = 23), H2B-FKBP (n = 12). Extended Data Fig. 10a, b: Representative example and quantification of 15 cells.
Figure and video processing
In all figures contrast was linearly adjusted for visual representation. In all videos as well as figures showing GEM particles the channel displaying cytoplasmic marker was additionally processed with ImageJ’s “subtract background” function, using 50 pixel rolling ball radius.
Extended Data
Extended Data Figure 1. Characterization of GEM and L10 expressing stable cell lines.
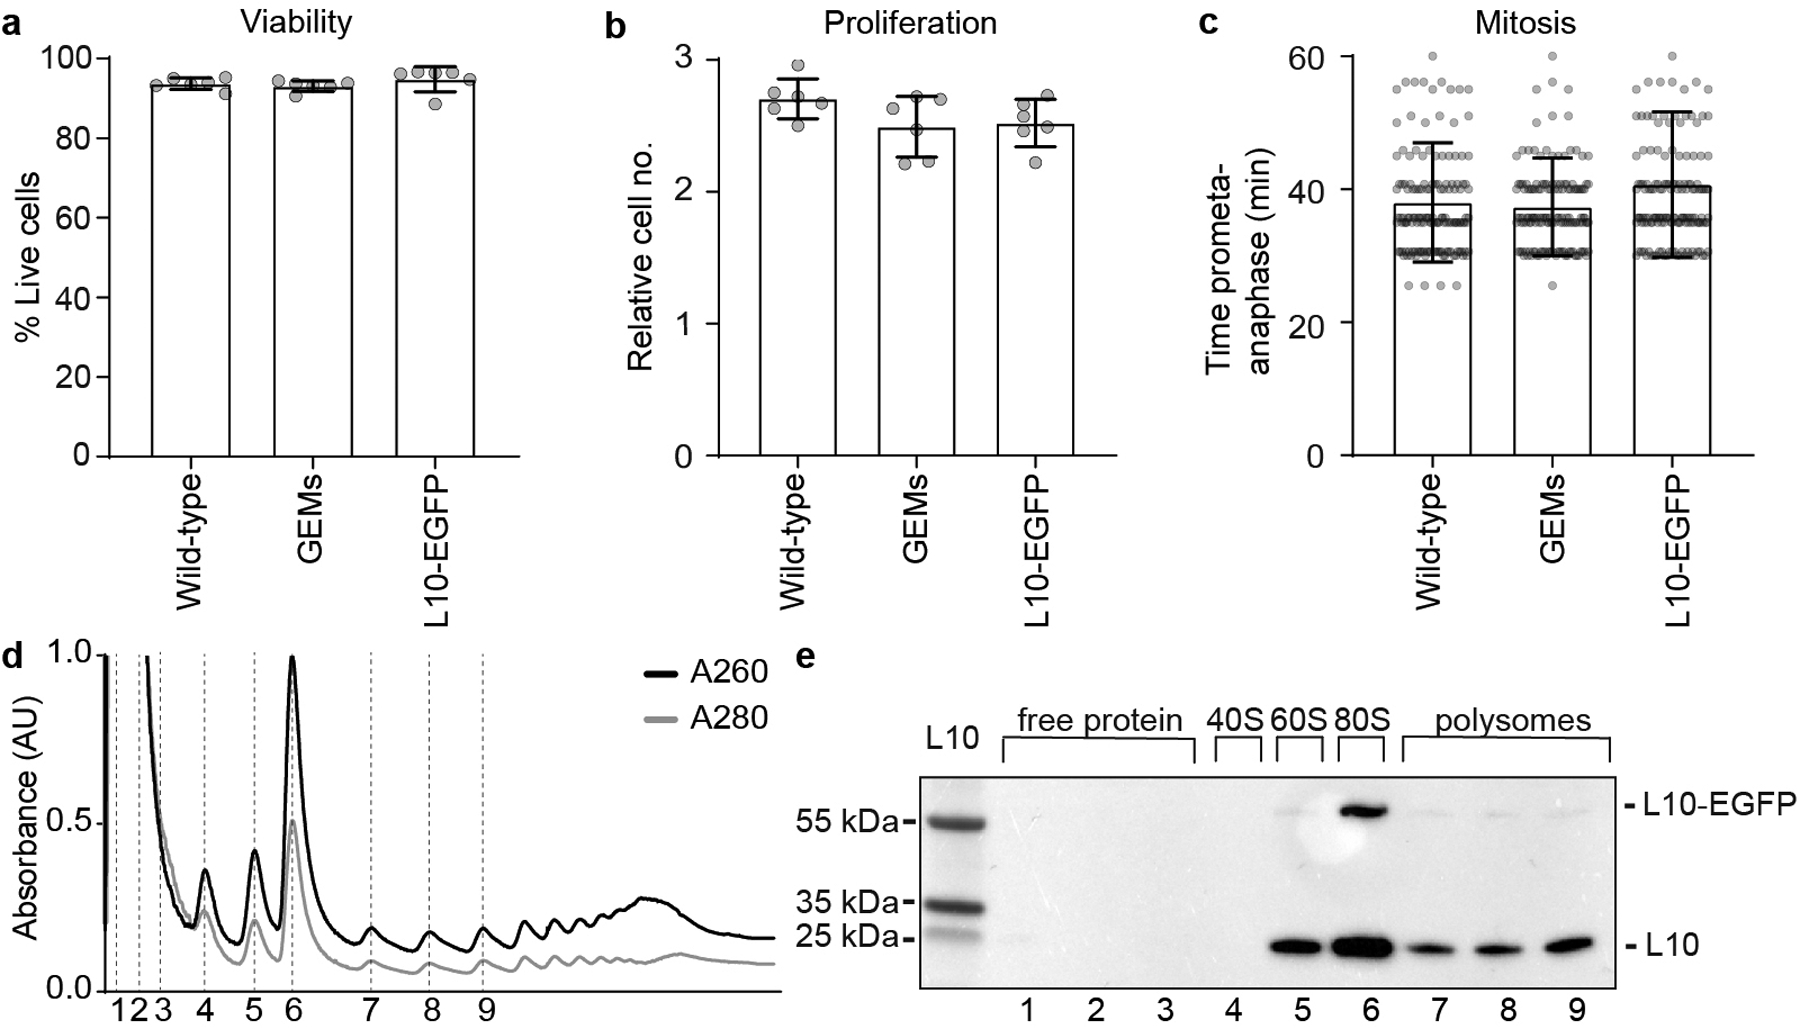
a, Viability of HeLa cell lines stably expressing markers as indicated, measured by counting Hoechst-stained cell nuclei that were negative for the cell death marker TO-PRO-3. Cell numbers: n = 754 (wild-type), n = 930 (GEMs), n = 603 (L10-EGFP). b, Proliferation of HeLa cell lines stably expressing markers as indicated, quantified as fold-change of live cells between 0 and 24 h in time-lapse microscopy videos. Cell number at 24 h: n = 2001 (wild-type), n = 2178 (L10-EGFP), n = 2283 (GEMs). c, Mitotic duration in HeLa cell lines stably expressing markers as indicated, scored by manual measurement of the time from prometaphase to anaphase onset. Cell numbers: n = 320 (wild-type), n = 320 (GEMs), n = 320 (L10-EGFP). d, e, Validation of L10-EGFP incorporation into ribosomes. d, Cell lysate fractions separated on a sucrose gradient. Dashed lines indicate fractions loaded on the gel blotted in (e). e, Immunoblot analysis of ribosomal protein L10 in cell lysate fractions, isolated from cells stably expressing L10-EGFP. Annotations of endogenous L10 and L10-EGFP are based on predicted molecular weights. For gel source data, see Supplementary Fig. 1. Bars indicate mean and error bars represent ± SD.
Extended Data Figure 2. Ribosomes are excluded from the nucleus in the absence of nuclear envelope transport.
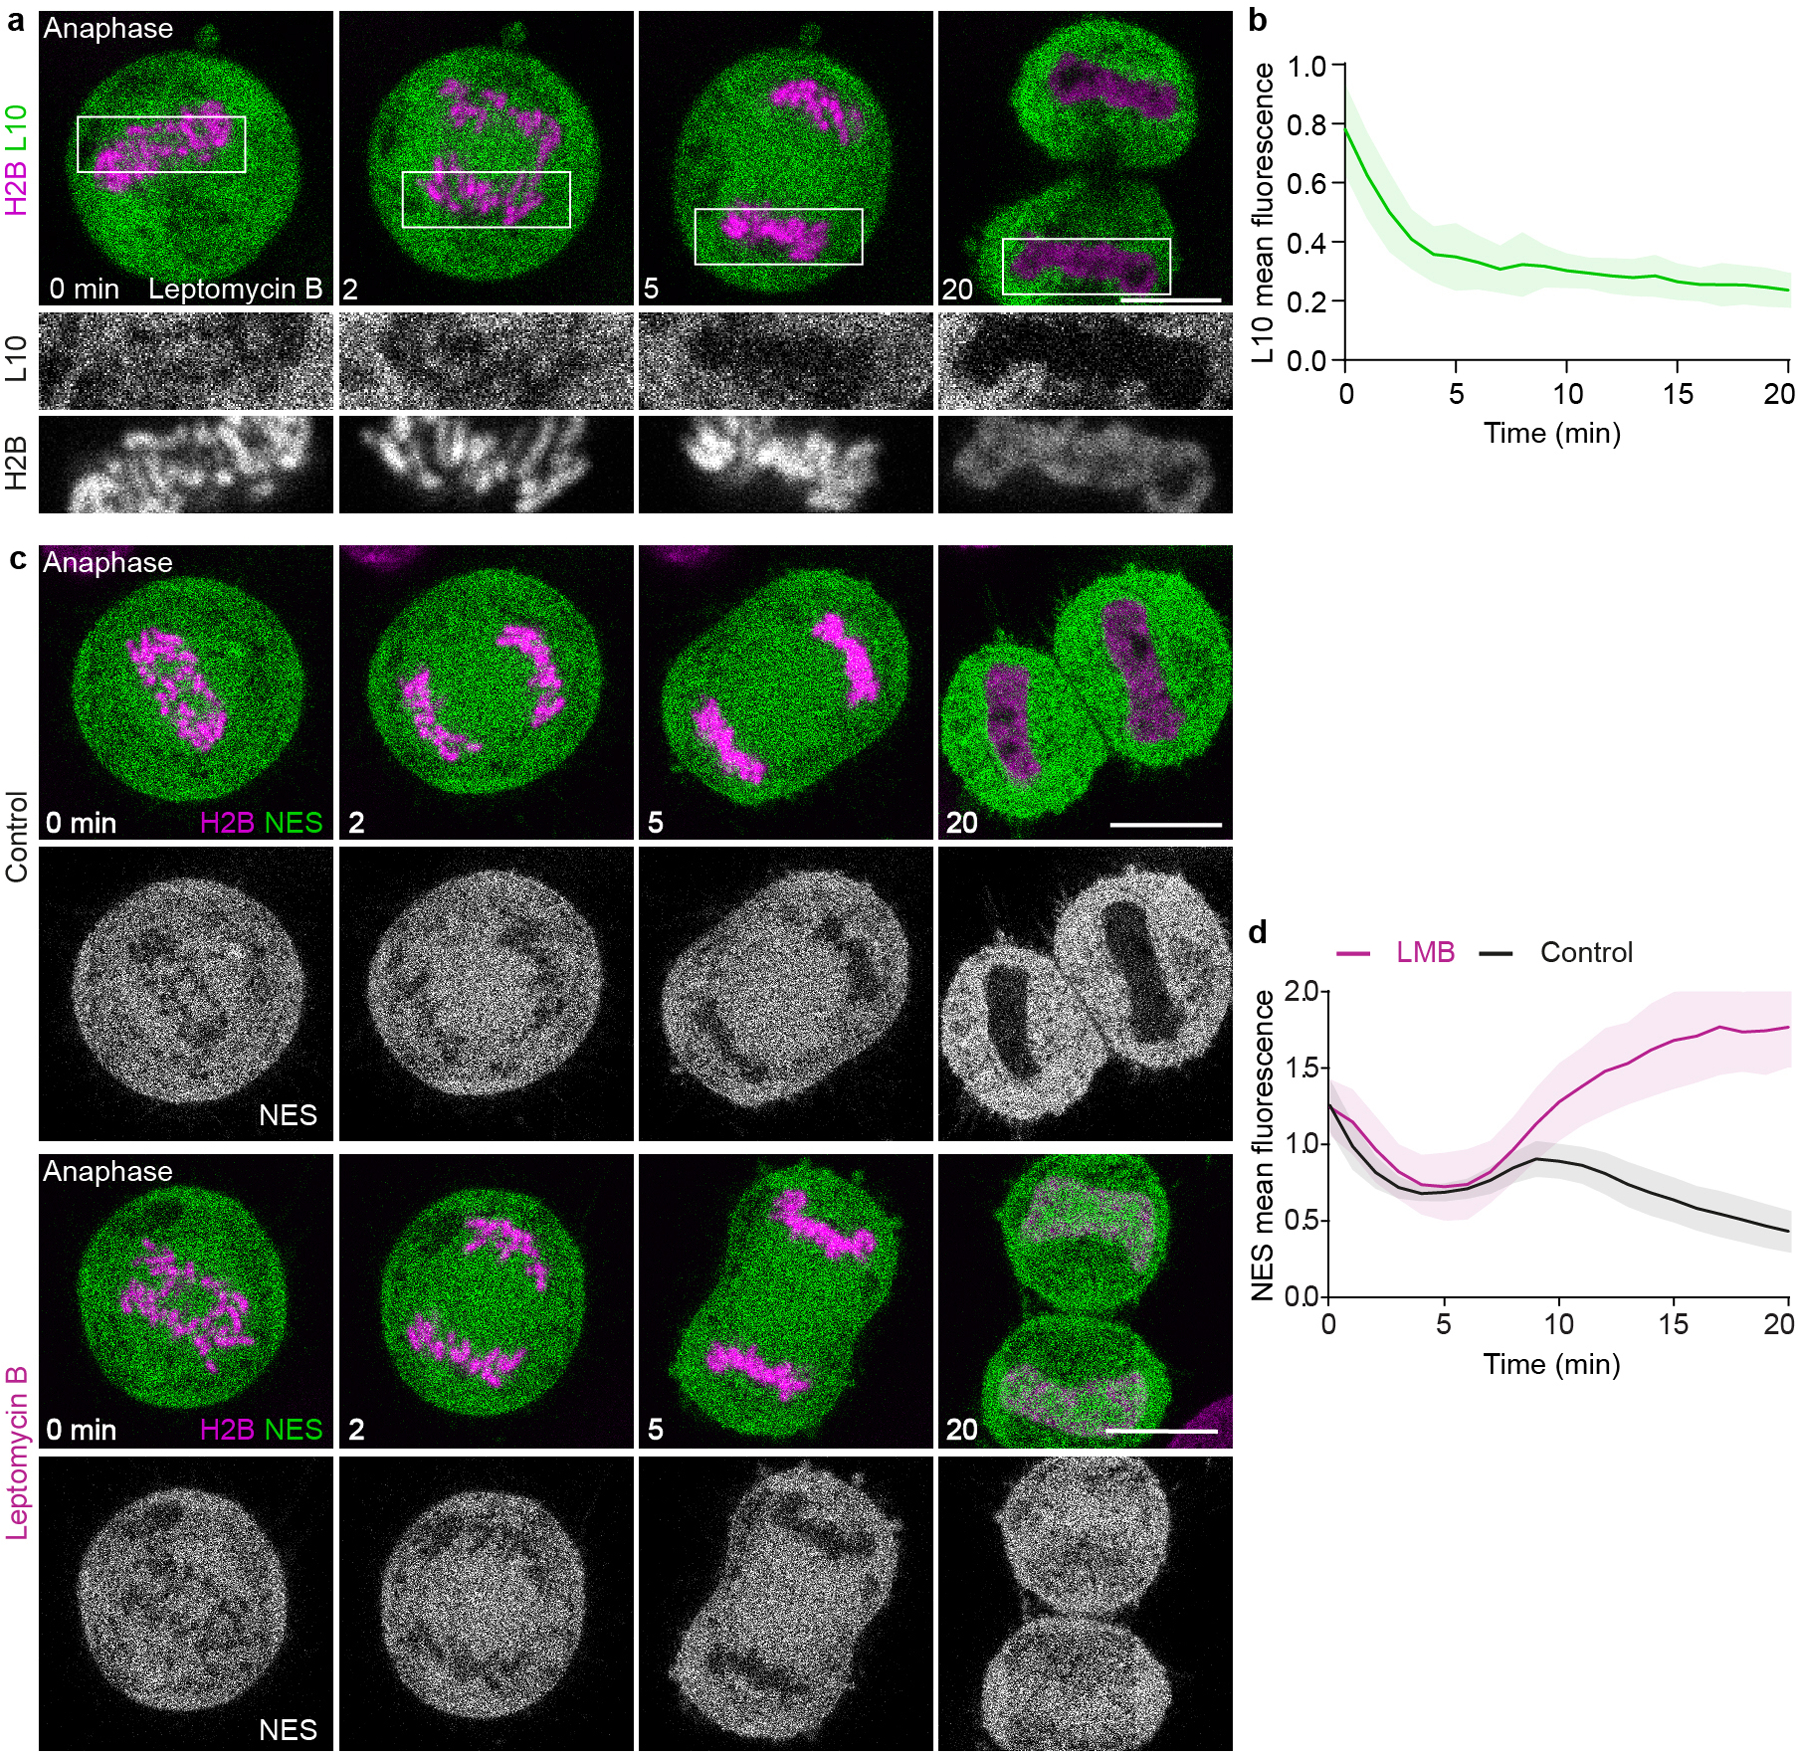
a, HeLa cell expressing the mature ribosome marker L10-EGFP and H2B-mCherry progressing through anaphase in the presence of Leptomycin B. b, Quantification of L10-EGFP mean fluorescence within the chromosomal region normalized to surrounding cytoplasm, in anaphase cells as in (a). n =16 cells. c, d, Validation of Exportin-1 inhibition by Leptomycin B. c, Live HeLa cells expressing fluorescently labeled H2B and NES-GFP were imaged during mitotic progression by time-lapse microscopy, either untreated (control) or in presence of leptomycin B. Time point 0 min refers to anaphase onset. d, Quantification of NES-GFP mean fluorescence intensity within the chromosomal region normalized to pre-anaphase in control and leptomycin B treated cells, as in (c). n = 18 cells (control), n = 15 cells (leptomycin B). Lines indicate mean and shaded areas represent ± SD. Scale bars, 10 μm.
Extended Data Figure 3. Chromosomes cluster and the nucleus reassembles in spindle-less cells upon induction of mitotic exit by different experimental procedures.
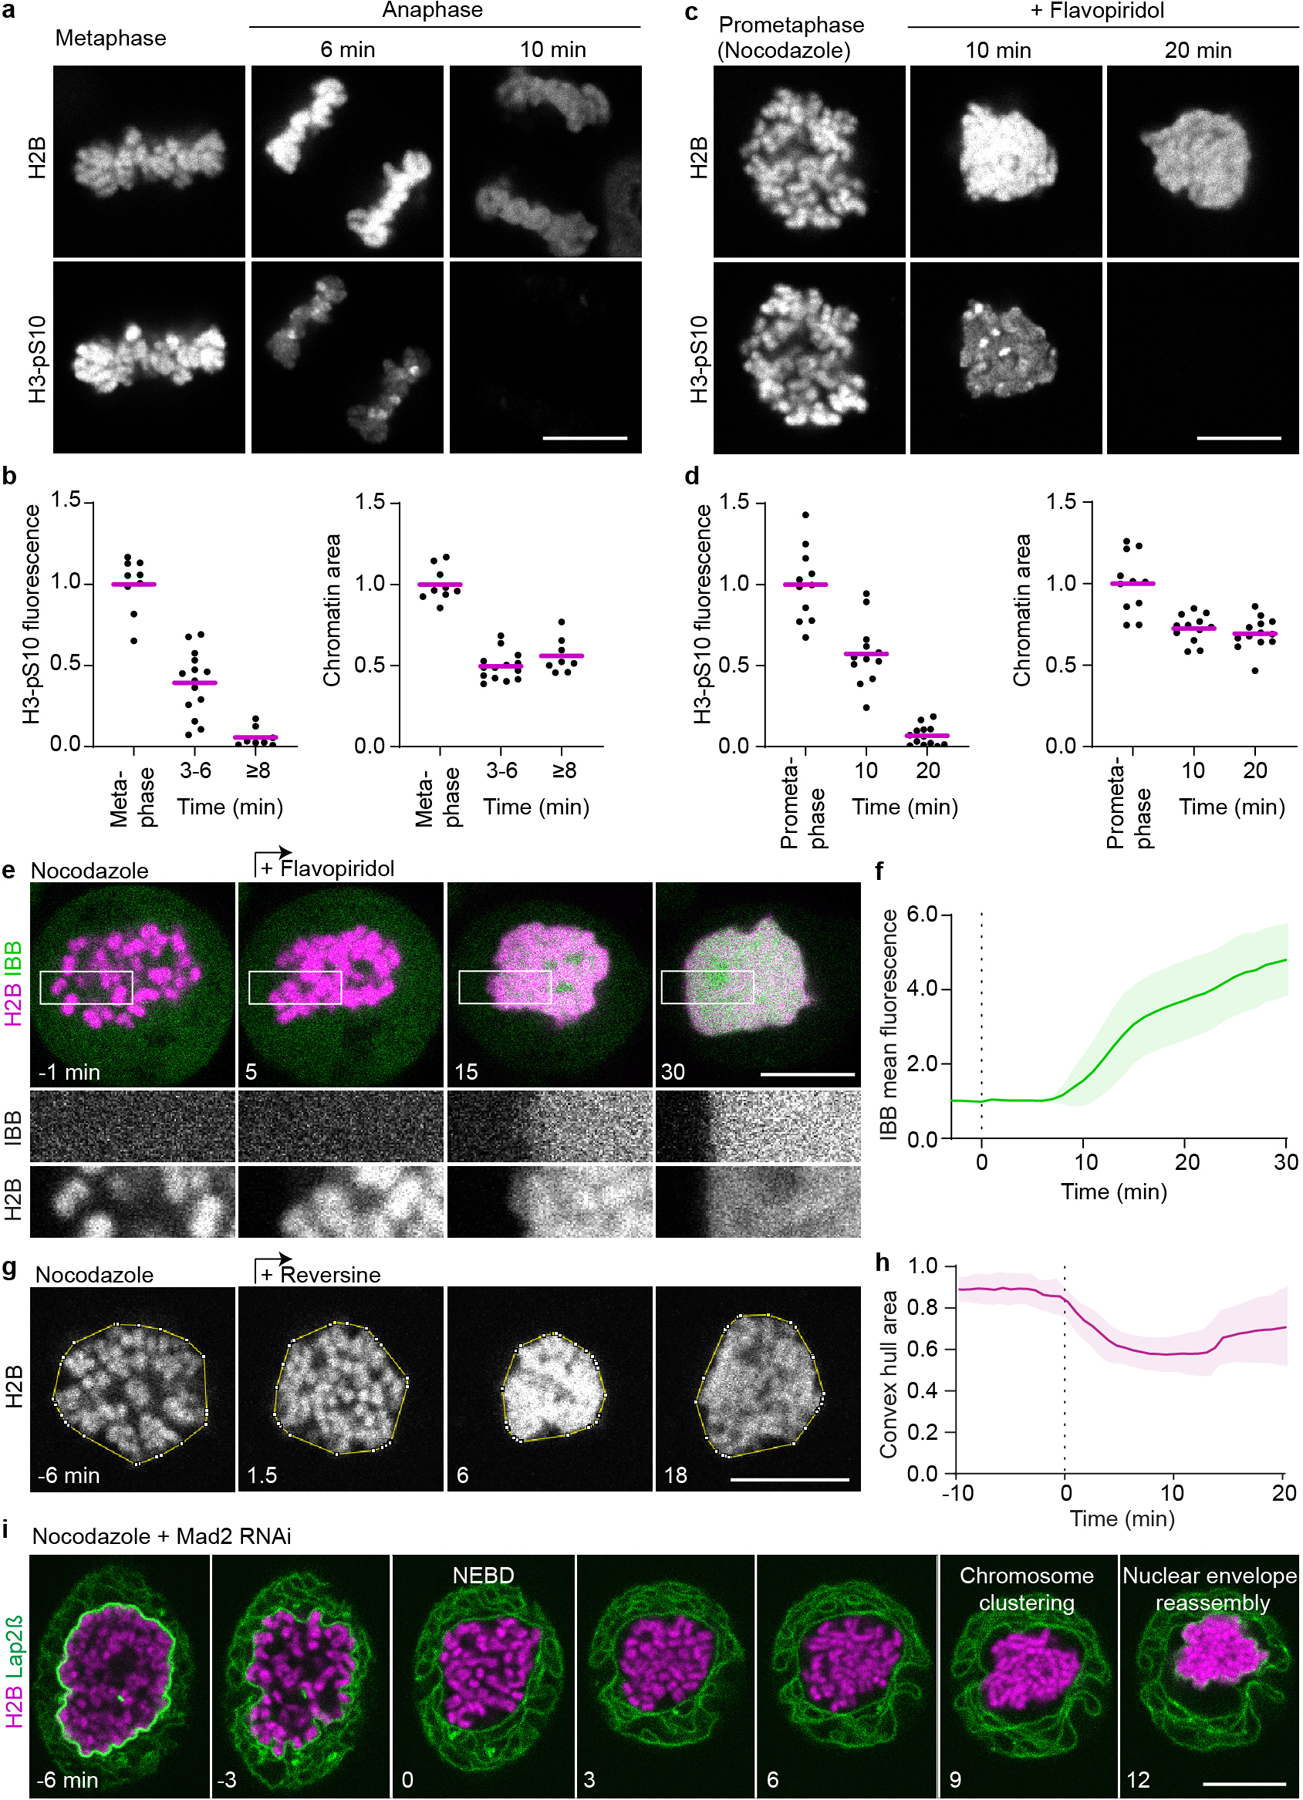
a-d, Validation of mitotic exit in spindle-less cells by comparing H3-S10 dephosphorylation kinetics during unperturbed anaphase and spindle-less mitotic exit. a, Example images of wild-type HeLa cells during unperturbed anaphase fixed after time-lapse imaging, in metaphase, 6 min (maximally clustered), and 10 min after anaphase onset. Upper panel: chromatin labelled with H2B-mCherry, lower panel: H3-pS10 immunofluorescence. Single Z-slice shown. b, Quantification of H3-pS10 mean fluorescence and chromatin area in unperturbed mitosis, as shown in (a). Cell numbers: n = 9 (metaphase), n = 14 (3–6 min after anaphase onset), n = 8 (≥8 min after anaphase onset). Normalization to average value of metaphase time point. c, Example images of wild-type HeLa cells during spindle-less mitosis fixed after time-lapse imaging, in prometaphase (no flavopiridol), 10 min (maximally clustered), and 20 min after flavopiridol addition. Imaging as in (a). d, Quantification of H3-pS10 mean fluorescence and chromatin area in spindle-less mitosis, as shown in (c), demonstrates that histone 3-serine 10 was efficiently dephosphorylated in flavopiridol-induced mitotic exit and chromosomes cluster to a degree comparable to that of normal late anaphase. Cell numbers: n = 11 (nocodazole arrested pro-metaphase), n = 12 (10 min after flavopiridol addition), n = 13 (20 min after flavopiridol addition). Normalization to average value of prometaphase time point. e, Time-lapse microscopy of HeLa cell expressing IBB-EGFP and H2B-mCherry incubated in nocodazole; flavopiridol was added (t = 0 min) to induce mitotic exit. f, Quantification of IBB-EGFP mean fluorescence within the chromosomal region, normalized to pre-flavopiridol time points, during spindle-less mitotic exit as in (e). n = 20 cells. g, Time-lapse microscopy of a HeLa cell expressing H2B-mCherry, progressing through reversine-induced mitotic exit in the absence of spindle. Yellow line indicates convex hull around chromosomes, single Z-slice shown. Time is relative to onset of clustering. h, Quantification of chromosome convex hull area of 11 cells as in (g). Individual cell curves were aligned based on half-maximum value of convex hull area. Normalization to average of first 4 time points. i, Live HeLa cell undergoing mitosis upon RNAi-mediated depletion of the spindle checkpoint protein Mad2 in the absence of a spindle. The cell line stably expresses H2B-mCherry and membrane marker AcGFP-Lap2β. Time relative to nuclear envelope breakdown (NEBD), single Z-slice shown. Representative example of 14 cells shown. Bars indicate mean in (b, d), lines and shaded areas indicate mean ± SD in (f, h). Scale bars, 10 μm.
Extended Data Figure 4. Chromosome clustering is independent of F-actin, precedes enwrapment by the nuclear envelope and suppresses chromosome mobility.
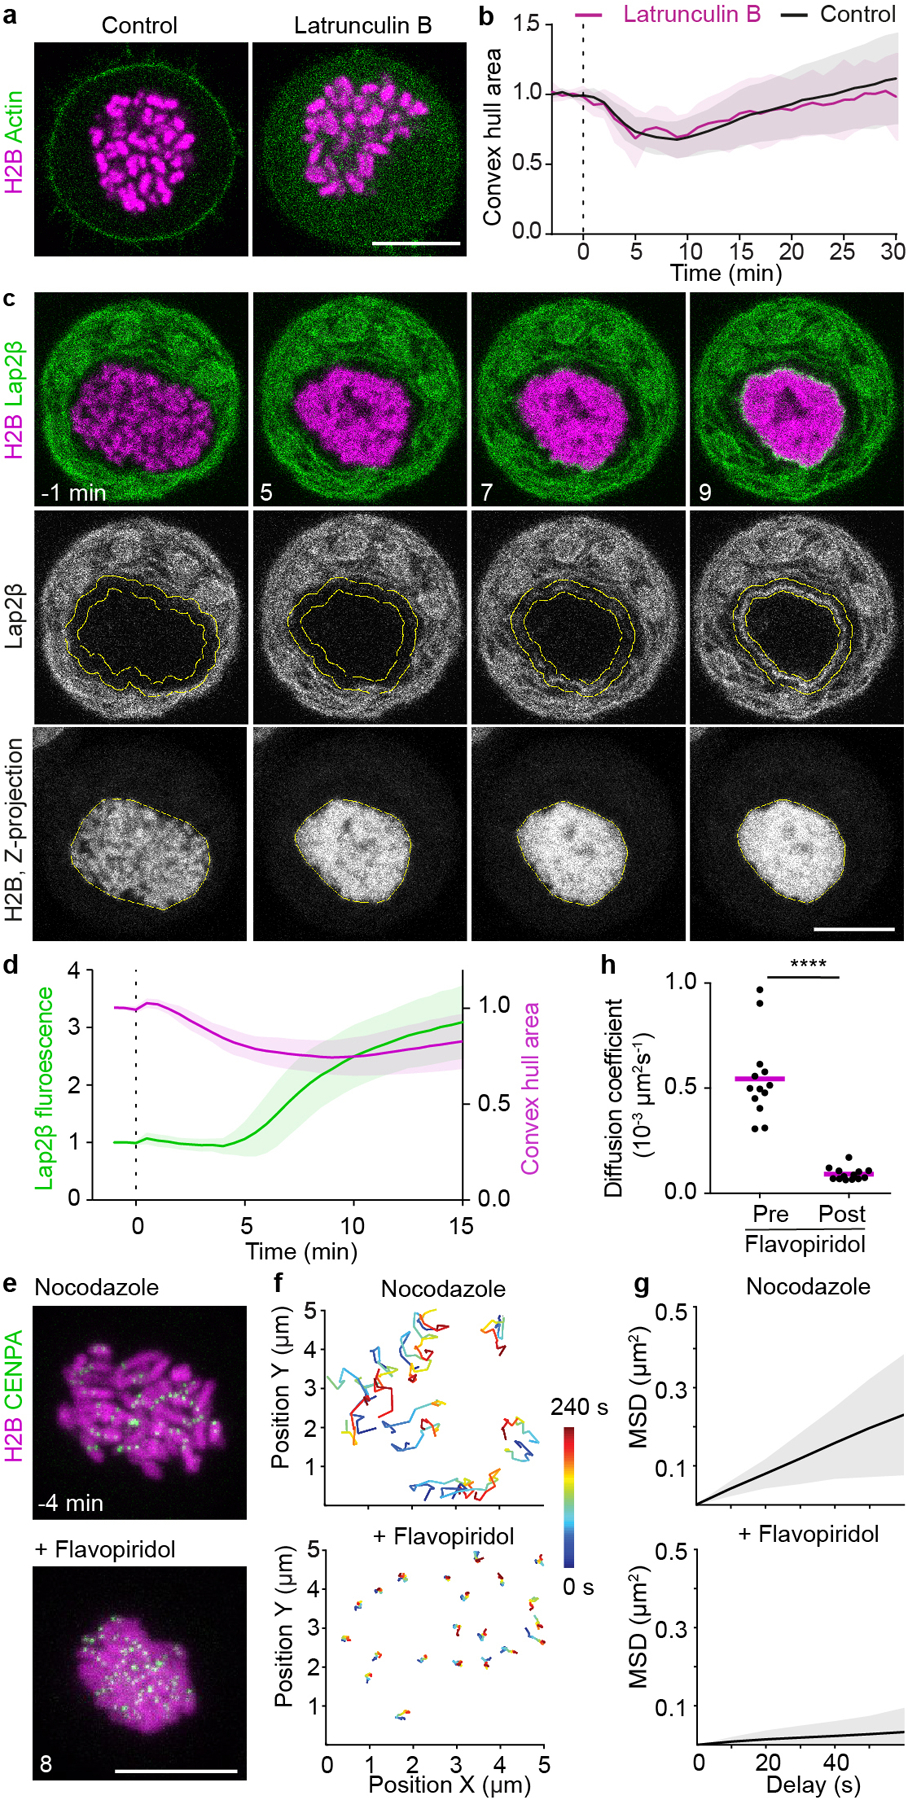
a, b, Effect of actin depolymerization on chromosome clustering. a, Live HeLa cells stably expressing actin-EGFP and H2B-mCherry were imaged in absence (control) or presence of latrunculin B. Nocodazole was present in both conditions. b, Quantification of chromosome convex hull area during a flavopiridol induced mitotic exit in the presence of nocodazole, in the absence (control) and presence of latrunculin B as shown in (a), normalized to average area pre-flavopiridol addition. Cell numbers: n = 13 (control), n = 22 (latrunculin B). c, Timing of chromosome clustering relative to nuclear envelopment. Live mitotic HeLa cell expressing H2B-mCherry and the inner nuclear envelope protein AcGFP-LAP2β were imaged in presence of nocodazole; flavopiridol was added at t = 0 min to induce mitotic exit. d, Quantification of chromosome area by convex hull (yellow line in H2B channel in (c)) and quantification of AcGFP-LAP2β accumulation at the surface of the chromatin region, within a rim of 1.6 μm width (yellow ROI in Lap2β channel in (c)). n = 21 cells. e-h, Kinetochore tracking in cells progressing through spindle-less mitotic exit. e, Live mitotic HeLa cell stably expressing H2B-mCherry and CENP-A-EGFP imaged in the presence of nocodazole before and after flavopiridol addition, time-lapse = 10 s; Z-projection. f, 240 s long kinetochore trajectories starting 240 s before and at 400 after flavopiridol addition. g, Representative mean squared displacement (MSD) analyses of kinetochore tracks (CENP-A–EGFP) of nocodazole-treated mitotic HeLa cells before and after flavopiridol addition. h, Diffusion coefficients derived from mean square displacement (MSD) analyses of trajectories as in (f). Significance was tested by a two-tailed ratio paired t-test (****P = 2.9 × 10⁻¹¹). n = 13 cells. Bars and lines indicate mean, shaded areas indicate ± SD, dashed vertical lines refer to flavopiridol addition. Scale bars, 10 μm.
Extended Data Figure 5. Chromosomes cluster in the presence of a mitotic spindle upon flavopiridol-mediated induction of mitotic exit.

Live cell microscopy of wild-type HeLa cells stably expressing H2B-mCherry synchronized to metaphase by MG132 treatment. a, Upper panel: negative control treated with dimethyl sulfoxide (DMSO) solvent, lower panel: mitotic exit induced through acute flavopiridol addition at t = 0 min. Chromosome arms extend out of the metaphase plate before flavopiridol addition, but densely cluster on the metaphase plate 8 min after flavopiridol addition. b, Quantification of chromosome convex hull area of 24 control and 25 flavopiridol treated cells, as in (a). c, Upper panel: acute mitotic spindle depolymerization by addition of nocodazole at t = 2 min leads to chromosome movement out of the metaphase plate; lower panel: mitotic exit was induced by flavopiridol (0 min), briefly before nocodazole-mediated spindle disassembly (2 min), preventing movement of chromosomes out of the metaphase plate. d, Chromosome convex hull area measurements of 27 nocodazole and 23 flavopiridol and nocodazole treated cells, as shown in (c). Values normalized to average of all frames prior to first drug treatment. Showing single Z-slices, lines and shaded areas indicate mean ± SD, dashed vertical lines indicate drug addition, scale bars 10 μm.
Extended Data Figure 6. Chromosome clustering is not mediated by association with BAF or removal of Ki-67.
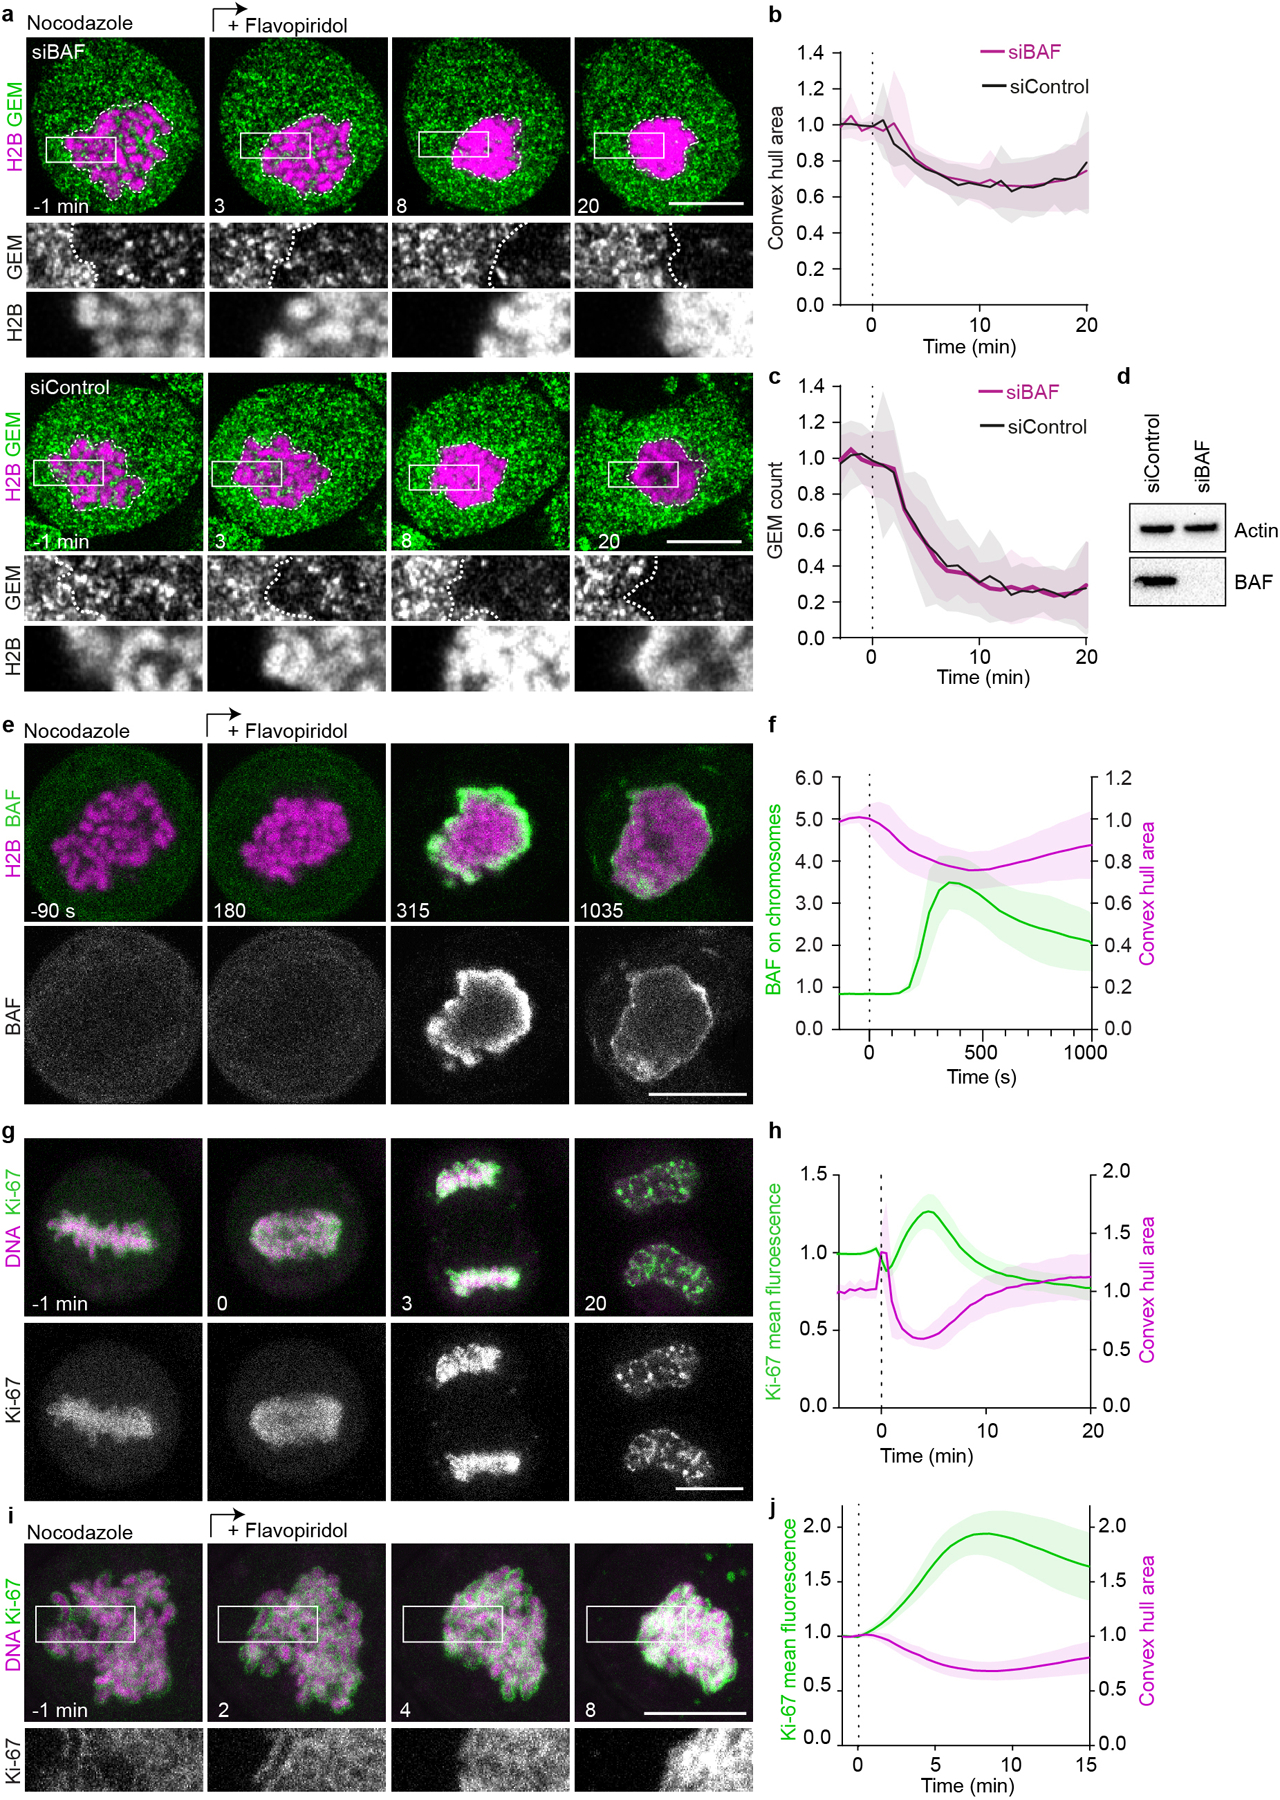
a-c, Effect of BAF depletion on chromosome clustering. a, Live mitotic HeLa cells stably expressing H2B-mCherry and GEMs were imaged 72 h after siRNA transfection, in the presence of nocodazole; flavopiridol was added at t = 0 min to induce mitotic exit. White dashed lines indicate chromosome areas, single Z-slice shown. b, Quantification of chromosome convex hull area, normalized to pre-flavopiridol addition. c, GEM particle count within chromosomal area normalized to pre-flavopiridol addition. n = 23 cells (siBAF), n = 23 cells (siControl). d, Immunoblot analysis of BAF and actin 72 h after siRNA transfection, showing one of two biological replicates. For gel source data, see Supplementary Fig. 1. e, Localization of BAF-EGFP in live mitotic HeLa cell imaged in the presence of nocodazole; flavopiridol was added at t = 0 s to induce mitotic exit. f, Quantification of chromosome convex hull area and BAF-EGFP accumulation at the surface of the chromatin region as in (e), normalized to pre-flavopiridol. n = 21 cells. g, Localization of Ki-67, EGFP tagged on endogenous loci in live HeLa cell progressing from metaphase to anaphase (anaphase onset = 0 min), DNA was stained with SiR-Hoechst, Z-projection. h, Quantification of chromosome convex hull area and EGFP-Ki-67 mean fluorescence on chromosomes, normalized to pre-anaphase, for 41 cells as in (g). i, Localization of Ki-67 during spindle-less mitotic exit. Time-lapse microscopy of mitotic HeLa cell as in (g), in the presence of nocodazole; flavopiridol was added (t=0 min) to induce mitotic exit. Z-projection. j, Quantification of chromosome convex hull area and EGFP-Ki-67 mean fluorescence on chromosomes of 27 cells as in (i). Shaded areas indicate ± SD, scale bars 10 μm.
Extended Data Figure 7. Ki-67 is required for chromosome clustering in Ki-67 KO cells upon histone overexpression or histone hyperacetylation.
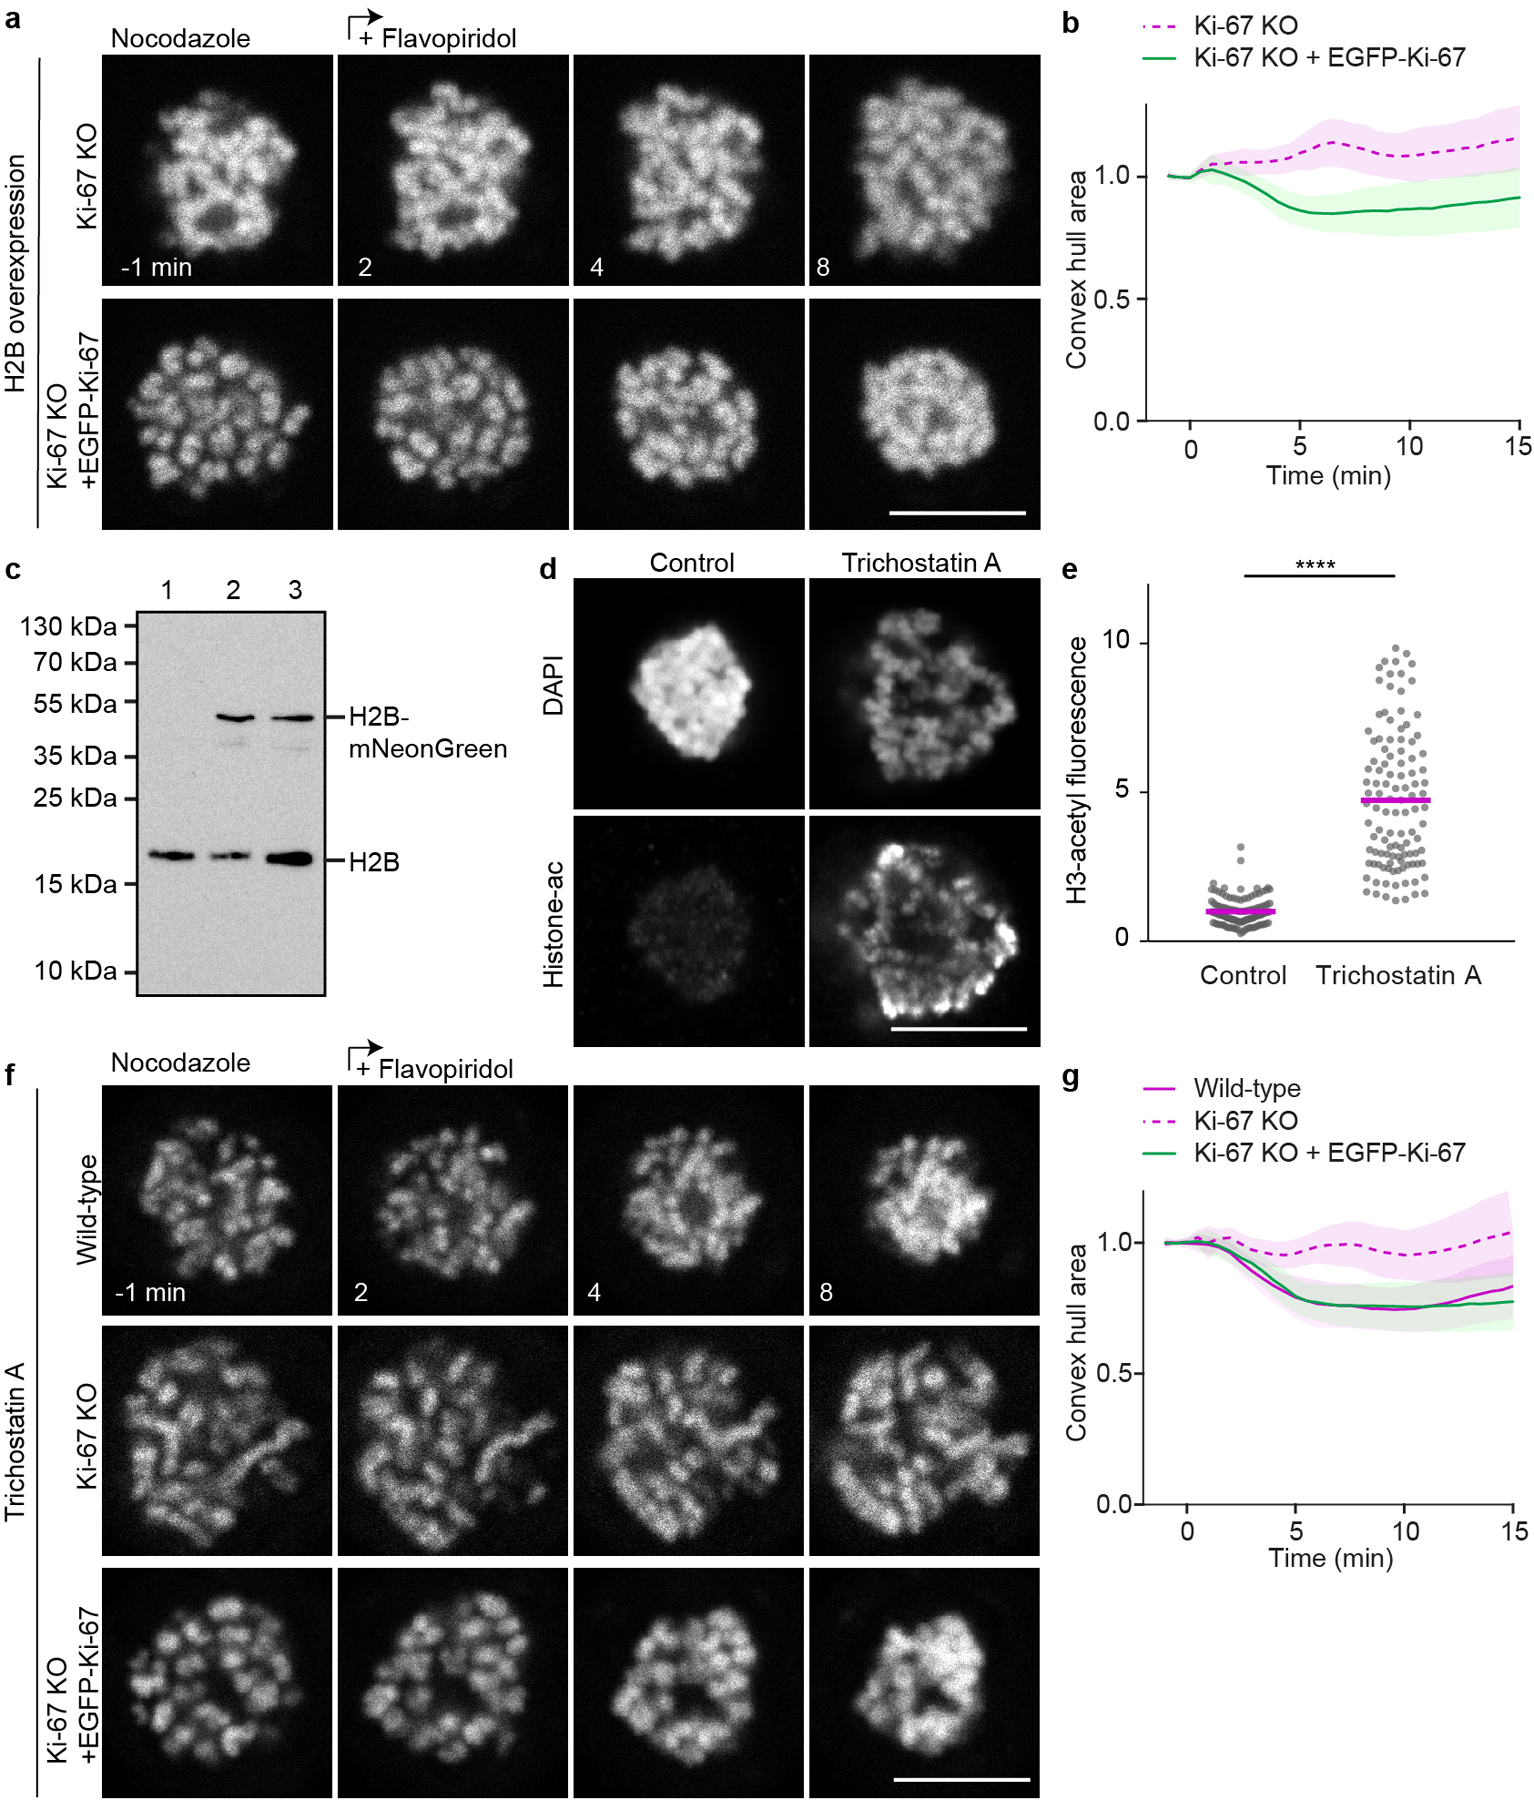
a, Time-lapse microscopy of clustering-deficient HeLa Ki-67 KO cell stably expressing H2B-mCherry to high levels during a flavopiridol-induced mitotic exit in the presence of nocodazole. Transient expression of EGFP-Ki-67 to levels at least matching Ki-67 endogenous levels (lower panel). Single Z-slice shown. b, Chromosome convex hull area quantification, normalized to pre-flavopiridol time points, of 29 Ki-67 KO and 28 Ki-67 KO + EGFP-Ki-67 cells as in (a). c, Immunoblot analysis of H2B from cell lysates, isolated from wildtype cells (1) or cells transiently expressing H2B-mNeonGreen (2,3). Sample 3 was lysed after 48 h while sample 2 was additionally FACS sorted for the 10% brightest cells which we estimated to represent the population of cells that suppress the Ki-67 knockout individualization failure phenotype. For gel source data, see Supplementary Fig. 1. n = 2 biological repeats. d, e, Immunofluorescence of acetylated H3 of Ki-67 KO cells arrested in nocodazole with or without trichostatin A. d, Representative examples. Single Z-slices shown. e, Quantification of acetylated H3 mean fluorescence intensity in Ki-67 KO cells arrested in nocodazole with and without trichostatin A. Bars represent mean, significance was tested with a two-tailed Kolmogorov-Smirnov test. (****P = 2.22×10⁻¹⁶). n = 115 cells (Ki-67 KO), n = 111 cells (Ki-67 KO + TSA). f, Time-lapse microscopy of HeLa wild-type or clustering-deficient Ki-67 KO cells with or without transient re-expression of Ki-67 during a flavopiridol-induced mitotic exit in the presence of nocodazole. Cells were treated with trichostatin A 2 h before imaging to rescue the Ki-67 knockout individualization failure phenotype in Ki-67 KO cells. Representative examples stained with SiR-Hoechst, single Z-slices shown. g, Chromosome convex hull area, normalized to pre flavopiridol time points, quantification of 21 Ki-67 KO, 31 wild-type and 32 Ki-67 KO + EGFP-Ki-67 cells as in (f). Lines and shaded areas indicate mean ± SD (b, g), scale bars, 10 μm.
Extended Data Figure 8. Ki-67 mediates chromosome clustering neither through PP1 recruitment nor through H3S10 dephosphorylation.
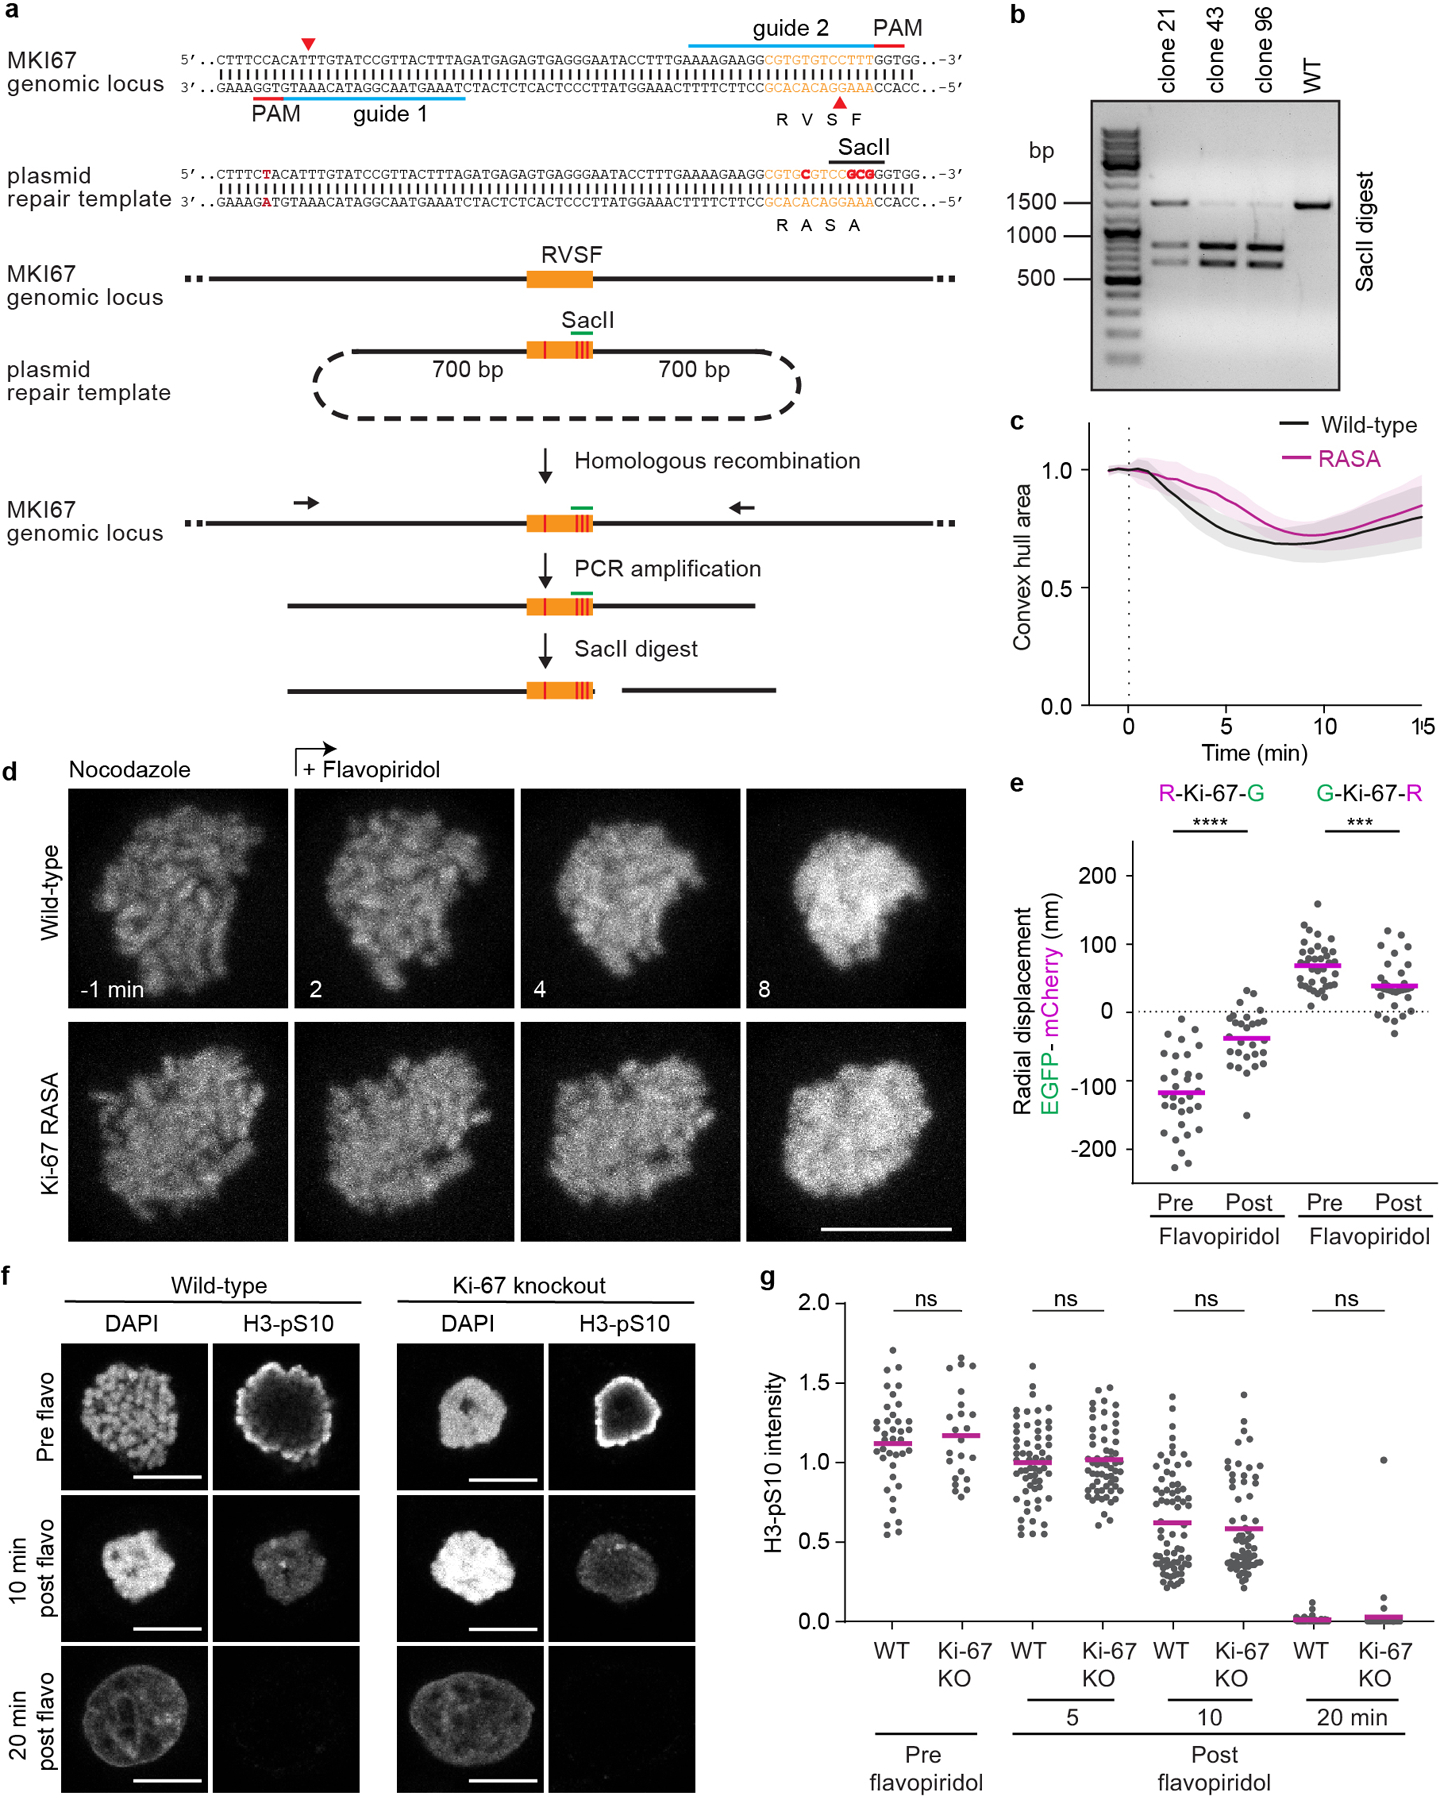
a, Schematic of genotyping strategy to endogenously mutate Ki-67’s PP1 binding motif RVSF to RASA. A newly generated SacII restriction site generated by CRISPR/Cas9 nickase as depicted was used to detect correctly mutated alleles. b, SacII restriction fragments were detected by gel electrophoresis following the assay depicted in (a), showing successful recombination of all three Ki-67 alleles present in HeLa cells for clone 43 and 96. Showing one example of 2 biological replicates. c-d, Spindle-less mitotic exit in wild-type cells and in homozygous Ki-67 RASA mutant cells. Live cells were imaged in the presence of nocodazole; flavopiridol was added (t = 0 min) to induce mitotic exit. Quantification of chromosome convex hull area, normalized to pre-flavopiridol time points (c) and representative examples stained with SiR-Hoechst (d). Z projection. Lines and shaded areas indicate mean ± SD. n = 22 cells (wild-type), n = 23 cells (RASA). e, Molecular organization of the Ki-67 RASA mutant on the surface of mitotic chromosomes before and after flavopiridol addition to taxol treated cells. Ki-67(RASA) was tagged by mCherry and EGFP on either protein end, respectively, and expressed in HeLa cells bearing the endogenous RASA mutation in all three copies of Ki-67. Bars represent mean, significance was tested by a two-tailed unpaired t-test (****P = 8.3 ×10⁻⁸, ***P = 0.00049). Chromosome numbers: n = 32 (R-Ki-67-G, Pre), n = 28 (R-Ki-67-G, Post), n = 37 (G-Ki-67-R, Pre), n = 34 (G-Ki-67-R, Post). f, g, Immunofluorescence of H3-pS10 during spindle-less mitotic exit in wild-type and Ki-67 KO cells. f, Representative examples of wild-type and Ki-67 KO cells before, 10 and 20 min after flavopiridol addition. Single Z-slice is shown. g, Quantification of H3-pS10 mean fluorescence intensity before (Wild-type n = 38 cells, Ki-67 KO n = 23 cells), 5 (Wild-type n = 61 cells, Ki-67 KO n = 61 cells), 10 (Wild-type n = 72 cells, Ki-67 KO n = 65 cells) and 20 min (Wild-type n = 73 cells, Ki-67 KO n = 55 cells) after mitotic exit induction with flavopiridol in wild-type and Ki-67 KO cells. Values normalized to average of wild-type 5 min time point. Showing combined data of two independent biological replicates. Bars represent mean, significance tested with a two-tailed Mann Whitney test (P = 0.72 for pre-flavopiridol time point, P = 0.96 for 5 min time point, P = 0.71 for 10 min time point and P = 0.26 for 20 min time point). Scale bars, 10 μm.
Extended Data Figure 9. Chromosome clustering can be artificially induced through increased adhesion between chromosomes.
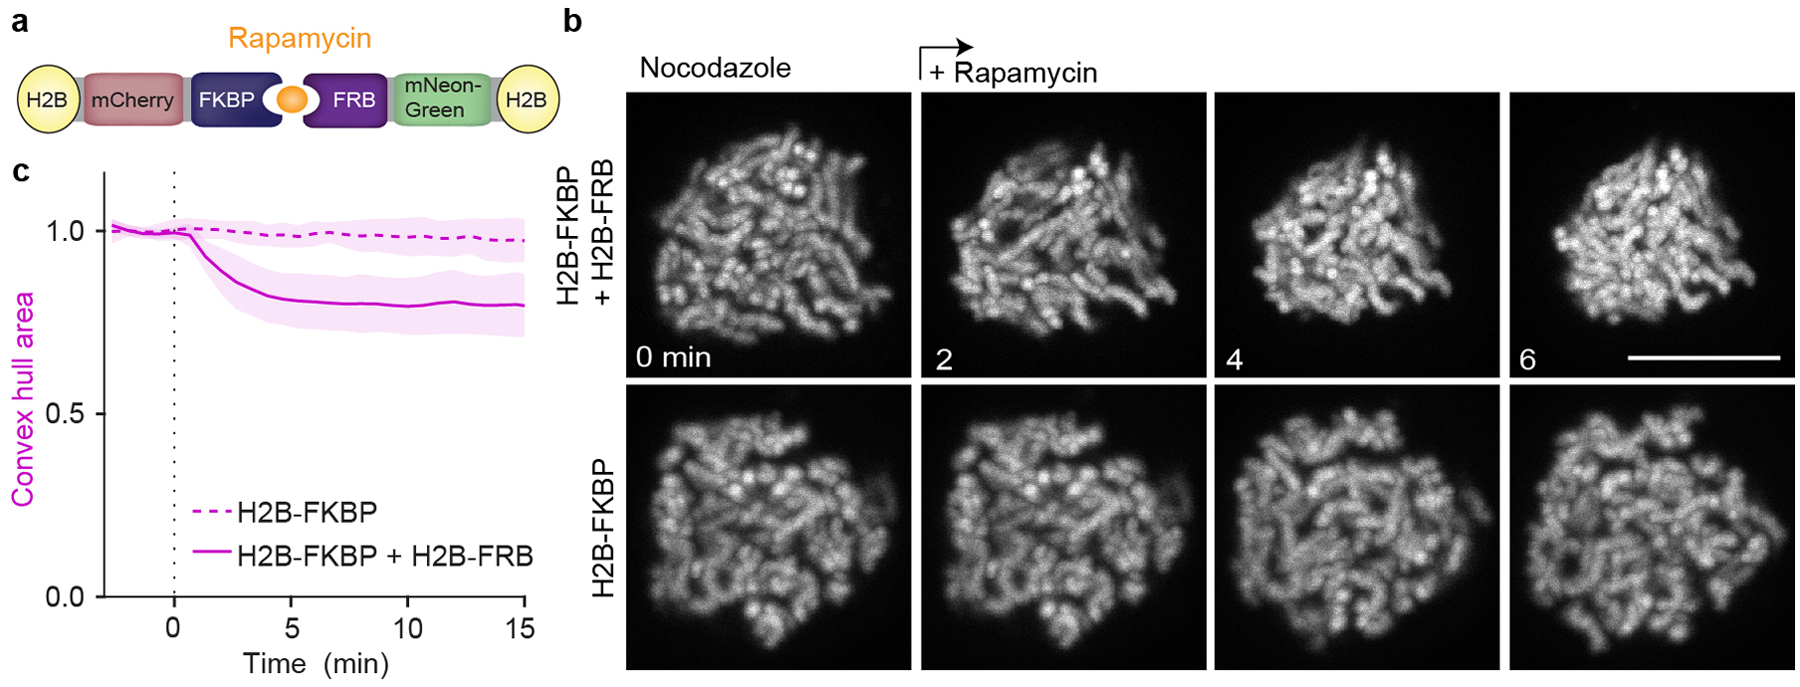
a, Design of an inducible H2B-H2B interaction system. b, Live HeLa cells expressing H2B-mCherry-FKBP and H2B-mNeonGreen-FRB or only H2B-mCherry-FKBP were imaged before and after rapamycin addition. Z-projection, scale bar 10 μm. c, Normalized chromosome convex hull area quantification as in (b) of 23 cells co-expressing H2B-mCherry-FKBP and H2B-mNeonGreen-FRB, versus 12 negative control cells expressing H2B-mCherry-FKBP alone. Lines and shaded areas indicate mean ± SD.
Extended Data Figure 10. Clustering-deficient cells assemble a transport-competent nuclear envelope.
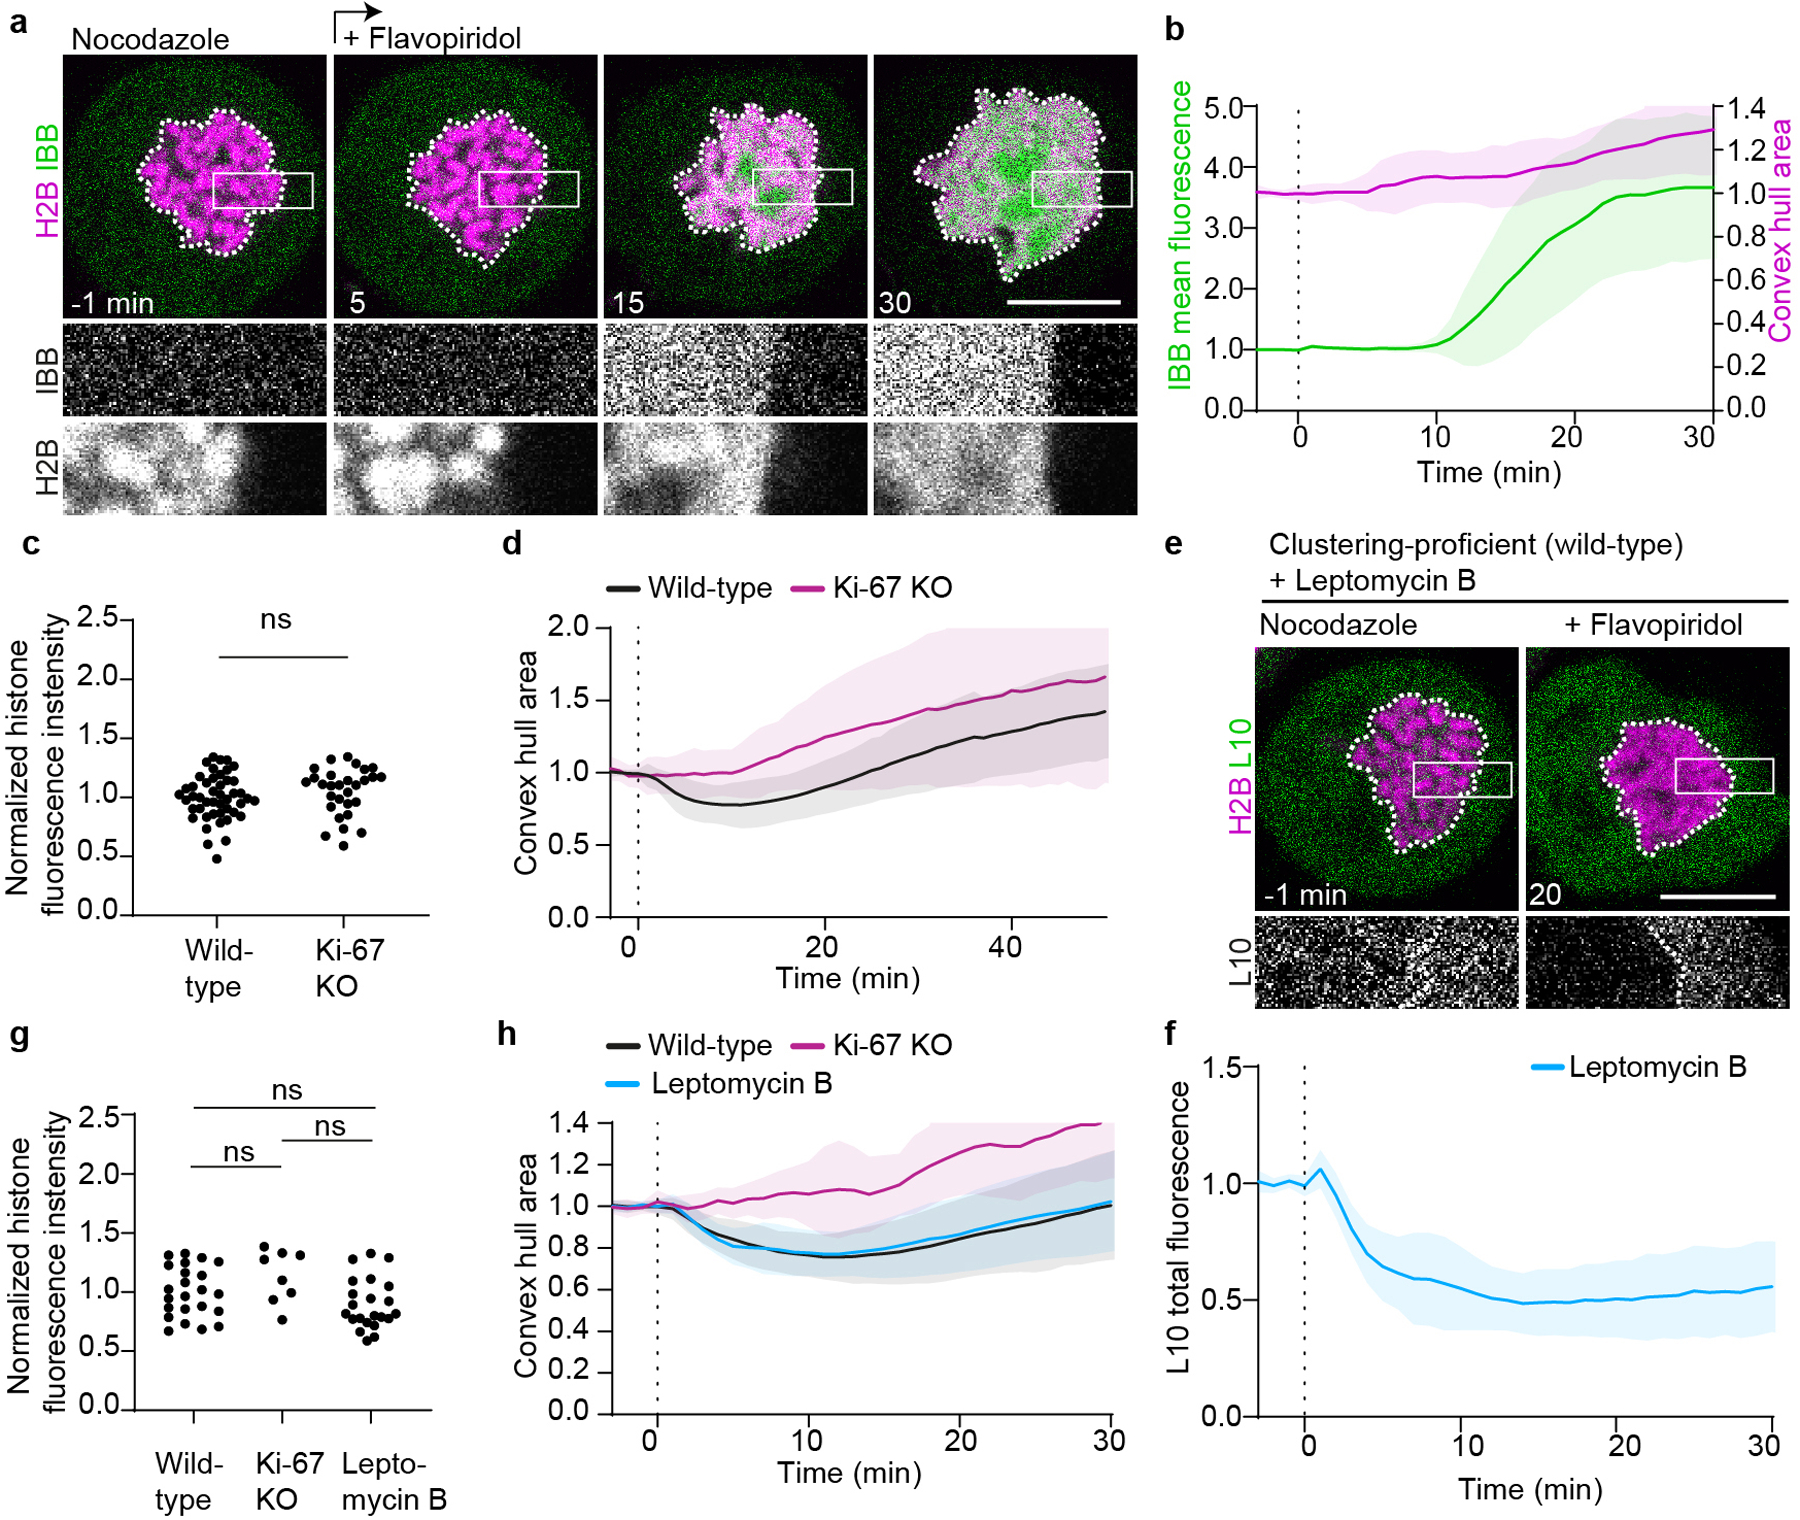
a, Time-lapse microscopy of clustering-deficient HeLa Ki-67 KO cell transiently expressing H2B-mCherry to high levels, and stably expressing IBB-EGFP, during a flavopiridol-induced mitotic exit in the presence of nocodazole. b, Quantification of IBB-EGFP mean fluorescence in chromosomal area (green) and quantification of chromosome convex hull area (magenta) in clustering-deficient cells as in (a), normalized to pre-flavopiridol. n = 15 cells. c, d, H2B-mCherry expression levels and chromosome area measurements for cells shown in Fig. 4a–c. c, Quantification of H2B-mCherry total fluorescence for cells analyzed in Fig. 4c (all data points normalized to mean of wild-type dataset). d, Chromosome convex hull area quantification (normalized to pre-flavopiridol area) for cells quantified in Fig. 4c. n = 46 cells (wild-type), n = 29 cells (Ki-67 KO). e, Clustering-proficient HeLa cell imaged as in Fig. 4d, but treated with leptomycin B. f, Quantification of total L10 fluorescence in nuclear regions as shown in (e), normalized to average of pre-flavopiridol addition. n = 22. g, h, Quantification of H2B-mCherry total fluorescence and chromosome convex hull area for cells analyzed in Fig. 4f and in (f). Normalizations as in (c, d), cell numbers: n = 23 wild-type, n = 8 Ki-67 KO, n = 22 leptomycin B. Individual Ki-67 KO curves shown in Supplementary Figure 2. Significance tested with two-sided unpaired t-test (P = 0.28 in GEM cell lines wild-type vs Ki-67 KO, P = 0.12 in L10 cell lines wild-type vs LMB treated and P = 0.13 in L10 cell lines wild-type vs Ki-67 KO). Lines and shaded areas indicate mean ± SD, dashed vertical lines indicate flavopiridol addition. Scale bars 10 μm, showing single Z-slices.
Supplementary Material
Acknowledgments
The authors thank S. Tietscher for histone level verification, K. F. Leesch and the IMBA/IMP/GMI BioOptics and Molecular Biology Service facilities for technical support, M. Tchórzewski for L10-EGFP plasmid, and Iain Patten and Life Science Editors for comments on the manuscript. Research in the laboratory of D.W.G. has been supported by the Austrian Academy of Sciences, an ERC Starting (Consolidator) Grant (nr. 281198), by the Wiener Wissenschafts-, Forschungs- und Technologiefonds (WWTF; project nr. LS14-009 and LS17-003), and by the Austrian Science Fund (FWF special research program “Chromosome Dynamics” SFB F34-06, Doktoratskolleg “Chromosome Dynamics” DK W1238). Research in the laboratory of S.C-H has been supported by the German Research Foundation (DFG, project number 402723784). M.P., A.H.A. and M.W.G.S. have received PhD fellowships from the Boehringer Ingelheim Fonds. S.C.-H. has received funding from a Human Frontier Science Program (LTF000996/2013 and CDA00045/2019). L.J.H was supported by the National Institutes of Health (R01GM132447) and by the Woods Hole Marine Biology labs Whitman Fellows program.
Footnotes
Competing interests
The authors declare no competing interests.
Supplementary information is available for this paper.
Data availability
Source data for Figs. 1–4 and Extended Data Figs. 1–10 are provided with the paper. Raw microscopy data are available from the corresponding authors upon request given its large file size.
Code availability
Since all image analyses steps performed in this study are described in detail to allow reproduction of the results, we only provide the code upon requests.
References
- 1.Maniatis T & Reed R An extensive network of coupling among gene expression machines. Nature 416, 499–506 (2002). [DOI] [PubMed] [Google Scholar]
- 2.Görlich D & Kutay U Transport between the cell nucleus and the cytoplasm. Annu Rev Cell Dev Biol 15, 607–660 (1999). [DOI] [PubMed] [Google Scholar]
- 3.Ungricht R & Kutay U Mechanisms and functions of nuclear envelope remodelling. Nat Rev Mol Cell Biol 18, 229–245 (2017). [DOI] [PubMed] [Google Scholar]
- 4.Panté N & Kann M Nuclear pore complex is able to transport macromolecules with diameters of about 39 nm. Mol Biol Cell 13, 425–434 (2002). [DOI] [PMC free article] [PubMed] [Google Scholar]
- 5.Bui KH et al. Integrated structural analysis of the human nuclear pore complex scaffold. Cell 155, 1233–1243 (2013). [DOI] [PubMed] [Google Scholar]
- 6.Eibauer M et al. Structure and gating of the nuclear pore complex. Nat Commun 6, 7532–9 (2015). [DOI] [PMC free article] [PubMed] [Google Scholar]
- 7.Beck M & Hurt E The nuclear pore complex: understanding its function through structural insight. Nat Rev Mol Cell Biol 18, 73–89 (2017). [DOI] [PubMed] [Google Scholar]
- 8.Cuylen S et al. Ki-67 acts as a biological surfactant to disperse mitotic chromosomes. Nature 535, 308–312 (2016). [DOI] [PMC free article] [PubMed] [Google Scholar]
- 9.Delarue M et al. mTORC1 Controls Phase Separation and the Biophysical Properties of the Cytoplasm by Tuning Crowding. Cell 174, 338–349.e20 (2018). [DOI] [PMC free article] [PubMed] [Google Scholar]
- 10.Deryło K et al. The uL10 protein, a component of the ribosomal P-stalk, is released from the ribosome in nucleolar stress. Biochimica et Biophysica Acta (BBA) - Molecular Cell Research 1865, 34–47 (2018). [DOI] [PubMed] [Google Scholar]
- 11.Görlich D, Henklein P, Laskey RA & Hartmann EA 41 amino acid motif in importin-alpha confers binding to importin-beta and hence transit into the nucleus. EMBO J 15, 1810–1817 (1996). [PMC free article] [PubMed] [Google Scholar]
- 12.Thomas F & Kutay U Biogenesis and nuclear export of ribosomal subunits in higher eukaryotes depend on the CRM1 export pathway. J Cell Sci 116, 2409–2419 (2003). [DOI] [PubMed] [Google Scholar]
- 13.Kudo N et al. Leptomycin B inactivates CRM1/exportin 1 by covalent modification at a cysteine residue in the central conserved region. PNAS 96, 9112–9117 (1999). [DOI] [PMC free article] [PubMed] [Google Scholar]
- 14.Potapova TA et al. The reversibility of mitotic exit in vertebrate cells. Nature 440, 954–958 (2006). [DOI] [PMC free article] [PubMed] [Google Scholar]
- 15.Samwer M et al. DNA Cross-Bridging Shapes a Single Nucleus from a Set of Mitotic Chromosomes. Cell 170, 956–972.e23 (2017). [DOI] [PMC free article] [PubMed] [Google Scholar]
- 16.Rosen MJ & Kunjappu JT Surfactants and interfacial phenomena. (John Wiley & Sons, 2012). [Google Scholar]
- 17.Cimini D, Mattiuzzo M, Torosantucci L & Degrassi F Histone hyperacetylation in mitosis prevents sister chromatid separation and produces chromosome segregation defects. Mol Biol Cell 14, 3821–3833 (2003). [DOI] [PMC free article] [PubMed] [Google Scholar]
- 18.Booth DG et al. Ki-67 is a PP1-interacting protein that organises the mitotic chromosome periphery. Elife 3, e01641 (2014). [DOI] [PMC free article] [PubMed] [Google Scholar]
- 19.Rivera VM et al. A humanized system for pharmacologic control of gene expression. Nat. Med 2, 1028–1032 (1996). [DOI] [PubMed] [Google Scholar]
- 20.Gautier T, Robert-Nicoud M, Guilly MN & Hernandez-Verdun D Relocation of nucleolar proteins around chromosomes at mitosis. A study by confocal laser scanning microscopy. J Cell Sci 102 (Pt 4), 729–737 (1992). [DOI] [PubMed] [Google Scholar]
- 21.Booth DG et al. 3D-CLEM Reveals that a Major Portion of Mitotic Chromosomes Is Not Chromatin. Mol Cell 64, 790–802 (2016). [DOI] [PMC free article] [PubMed] [Google Scholar]
- 22.Schmitz MHA et al. Live-cell imaging RNAi screen identifies PP2A-B55alpha and importin-beta1 as key mitotic exit regulators in human cells. 12, 886–893 (2010). [DOI] [PMC free article] [PubMed] [Google Scholar]
- 23.Lukinavičius G et al. SiR-Hoechst is a far-red DNA stain for live-cell nanoscopy. Nat Commun 6, 8497 (2015). [DOI] [PMC free article] [PubMed] [Google Scholar]
- 24.Ran FA et al. Double nicking by RNA-guided CRISPR Cas9 for enhanced genome editing specificity. Cell 154, 1380–1389 (2013). [DOI] [PMC free article] [PubMed] [Google Scholar]
- 25.Huang L-K & Wang M-JJ Image thresholding by minimizing the measures of fuzziness. Pattern Recognition 28, 41–51 (1995). [Google Scholar]
- 26.Sommer C, Hoefler R, Samwer M & Gerlich DW A deep learning and novelty detection framework for rapid phenotyping in high-content screening. Mol Biol Cell 28, 3428–3436 (2017). [DOI] [PMC free article] [PubMed] [Google Scholar]
- 27.Thévenaz P, Ruttimann UE & Unser M A pyramid approach to subpixel registration based on intensity. IEEE Trans Image Process 7, 27–41 (1998). [DOI] [PubMed] [Google Scholar]
- 28.Tarantino N et al. TNF and IL-1 exhibit distinct ubiquitin requirements for inducing NEMO–IKK supramolecular structures. The Journal of Cell Biology 204, 231–245 (2014). [DOI] [PMC free article] [PubMed] [Google Scholar]
Associated Data
This section collects any data citations, data availability statements, or supplementary materials included in this article.


