Abstract
Objectives
We aimed to develop a dynamic imaging technique for a novel PET superoxide tracer, [18F]DHMT, to allow for absolute quantification of myocardial reactive oxygen species (ROS) production in a large animal model.
Methods
Six beagle dogs underwent a single baseline dynamic [18F]DHMT PET study, whereas one animal underwent three serial dynamic studies over the course of chronic doxorubicin administration (1mg/kg/week for 15 weeks). During the scans, sequential arterial blood samples were obtained for plasma metabolite correction. The optimal compartment model and graphical analysis method were identified for kinetic modeling. Values for the left ventricular (LV) net influx rate, Ki, were reported for all the studies and compared with the LV standard uptake values (SUVs) and the LV-to-blood pool SUV ratios from the 60–90 min static images. Parametric images were also generated.
Results
[18F]DHMT followed irreversible kinetics once oxidized within the myocardium in the presence of superoxide, as evidenced by the fitting generated by the irreversible two-tissue (2Ti) compartment model and the linearity of Patlak analysis. Myocardial Ki values showed a weak correlation with LV SUV (R2 = 0.27), but a strong correlation with LV-to-blood pool SUV ratio (R2 = 0.92). Generation of high-quality parametric images showed superior myocardial to blood contrast compared to static images.
Conclusions
A dynamic PET imaging technique for [18F]DHMT was developed with full and simplified kinetic modeling for absolute quantification of myocardial superoxide production in a large animal model.
Keywords: Reactive oxygen species (ROS), positron emission tomography (PET), kinetic modeling
Introduction
Excessive reactive oxygen species (ROS) production (oxidative stress) has been implicated in the development and progression of a variety of cardiovascular diseases (CVDs), such as myocardial ischemia-reperfusion injury, anthracycline-induced cardiotoxicity and heart failure (1). Currently, the noninvasive measurement of ROS is limited to circulating or urinary biomarkers that assess either the activity of ROS generating enzymes, the oxidation products of ROS or antioxidants levels. However, these biomarkers are not specific to the myocardium and often detect ROS production from off-target tissues (2). Therefore, a non-invasive technique that allows for specific measurement of myocardial ROS production is essential for elucidating the underlying role of ROS in the pathophysiology and progression of many CVDs.
Positron emission tomography (PET) is a sensitive imaging modality with high spatial/temporal resolution and sensitivity that allows for in vivo molecular imaging and absolute quantification of radiotracer uptake. Recently, our group has developed a method for automated synthesis of a novel PET 18F-labeled radioanalogue of dihydroethidium, [18F]-6-(4-((1-(2-fluoroethyl)-1H-1,2,3-triazol-4-yl) methoxy)phenyl)-5-methyl-5, 6-dihydrophenanthridine-3, 8-diamine ([18F]DHMT), that allows for detection of in vivo myocardial superoxide generation (3). More recently, we have demonstrated the ability of [18F]DHMT PET imaging to detect an elevation in myocardial superoxide production, prior to a fall in left ventricular ejection fraction (LVEF), in a rodent model of progressive anthracycline-induced cardiotoxicity (4). Although these findings indicate that [18F]DHMT may allow for early detection of anthracycline-induced cardiotoxicity, we were unable to perform absolute quantification of radiotracer uptake due to technical challenges associated with small-animal imaging, such as insufficient blood volume for metabolite analysis and limited small animal PET spatial resolution (~1 – 1.5 mm). Thus, in this study, we aimed to develop a dynamic imaging technique for [18F]DHMT PET with full kinetic modeling and metabolite analysis. To develop the optimal analysis approach, we applied the imaging methods in 6 healthy beagle dogs and in one dog chronically receiving doxorubicin (DOX) over several weeks. Plasma metabolite analysis was performed during all imaging sessions. Following imaging, the optimal compartment model and graphical analysis method were investigated. Finally, the net influx rate (Ki) values of left ventricular (LV) myocardium were obtained using the optimal compartment model and the optimal graphical analysis method was also reported. In addition, Ki images were generated with voxel-by-voxel graphical analysis for all studies.
Materials and Methods
Animal model and experimental design
Seven retired female beagle breeders were included in this study and all experiments were performed in accordance with Yale University Institutional Animal Care and Use Committee standards and approval. The detailed information for each dog is listed in Table 1. In six dogs, dynamic PET imaging was performed for 90 min and referred to as baseline scan in the subsequent text. An additional animal underwent a chronic-DOX dosing protocol to elicit progressive systolic dysfunction by receiving weekly doses of DOX HCl (1 mg/kg/week) until a cumulative dose of 15 mg/kg was reached or a decline in LVEF below 50% was observed. Weekly chemotherapy doses were withheld if the animal experienced neutropenia (< 1500 cells/μL) or displayed signs/symptoms of systemic toxicity. This animal underwent serial dynamic PET imaging for 90 min at low (3 mg/kg), moderate (7 mg/kg) and high (12 mg/kg) cumulative doses of DOX.
Table 1.
Detailed information for dog studies
| Study | Subject | Weight (kg) | Cumulative Doxorubicin Dose (mg kg) |
|---|---|---|---|
|
| |||
| 1 | Dog #1 | 10.0 | 0 (Baseline) |
| 2 | Dog #2 | 11.5 | 0 (Baseline) |
| 3 | Dog #3 | 12.2 | 0 (Baseline) |
| 4 | Dog #4 | 11.0 | 0 (Baseline) |
| 5 | Dog #5 | 10.0 | 0 (Baseline) |
| 6 | Dog #6 | 12.0 | 0 (Baseline) |
| 7 | Dog #7 | 10.0 | 3 |
| 8 | Dog #7 | 10.3 | 7 |
| 9 | Dog #7 | 10.0 | 12 |
[18F]DHMT Synthesis
[18F]DHMT was synthesized by a manual synthesis approach and an optimized and fully automated process developed at the Yale University PET Center as recently described (3). The formulated [18F]DHMT product had a molar activity of 148 ± 144.3 MBq/nmol for the PET imaging studies.
[18F]DHMT Dynamic PET/CT Imaging
For all studies, anesthesia was induced with an intravenous injection of propofol (5 – 7 mg/kg). Following endotracheal intubation, animals were mechanically ventilated, and anesthesia maintained with isoflurane (1.5 – 2.0%) (Venturi, Cardiopulmonary Corp., Milford, CT) for the duration of the experiments. Anesthesia and ventilator settings were adjusted as needed to maintain blood gases in a physiological range, as described elsewhere (5). A small femoral cut-down (4 cm) was then performed to allow for serial arterial and venous blood draws and arterial pressure monitoring (Transpac® IV, ICU Medical) during the imaging session. In addition, cardiac rhythm and rate, oxygen saturation (pulse oximeter) and body temperature (rectal temperature probe) were continuously monitored throughout the experiment using a Phillips InteliVue MP50 monitor (Philips Healthcare).
All animals received an intravenous bolus injection of 167 ± 24 of MBq [18F]DHMT (2.5 ± 2.1 μg injected mass) over 20 s. The dynamic PET scan was performed using a Siemens mCT PET/CT scanner for 90 min. Sequential discrete arterial blood samples were acquired before tracer injection and at 3, 8, 15, 30, 60, 90, 120 min post-injection for radioactivity concentration measurements by well counting and plasma metabolite analysis by automatic column-switching high-performance liquid chromatography (HPLC) system. A non-contrast CT scan was performed before the PET scan using the parameters of 120 kVp and 22 mA for PET attenuation and scatter corrections. A contrast-enhanced CT was also acquired with 100 kVp and 180 mA at the end of the study to facilitate visualization.
The acquired 90 min PET data were reframed into 10 × 30 s and 17 × 5 min frames. All the reframed dynamic PET data were reconstructed using the vendor-provided ordered-subset expectation-maximization algorithm with point spread function modeling and time of flight information. The subset number was set to 21 and the iteration number was set to 2. All dynamic images were corrected for randoms, attenuation, scatter, normalization, and decay. The reconstructed image size was 400 × 400 × 111 with a voxel size of 2.036 × 2.036 × 2 mm3. A Gaussian filter was applied to the reconstructed images with a full-width-at-half- maximum (FWHM) of 3 mm. Static images were also generated using the PET data acquired from 60 to 90 min post-injection for each imaging session. The reconstruction parameters for the static image reconstruction were the same as for the dynamic images.
Kinetic modeling
Volumes of interest (VOIs) were manually drawn on 8 consecutive transverse slices for the LV myocardium and on 4 consecutive transverse slices for LV blood pool on dynamic PET images using 85–90 min PET images. For all the studies, the average number of voxels was 1257 ± 60 for the LV myocardium VOI and 217 ± 29 for the LV blood pool VOI. The image-derived blood time activity curve (TAC) and the LV myocardial TAC were obtained by calculating the mean activity concentration in the LV blood pool VOI and the LV myocardium VOI, respectively. For each study, both the blood-to-plasma ratio correction and the plasma metabolite correction were applied to the image-derived blood TAC to obtain the image-derived plasma input function.
Tracer kinetic modeling was performed with one-tissue (1T), reversible two-tissue (2T) and irreversible two-tissue (2Ti) compartment models (6) using weighted least squares with a Marquardt–Levenberg algorithm (7). The activity spill-in from the LV blood pool to the LV myocardium was corrected by including a blood volume term (Fv) in all models. The weights were calculated for each frame as following:
| Eq. 1 |
where L is the frame duration, DCF is the decay correction factor for each frame, and NEC is the noise equivalent counts (8) and calculated as:
| Eq. 2 |
where T, R and S are the true, random and scatter counts, respectively.
The Akaike information criterion (AIC) values of the three compartment models were calculated to identify the optimal model for [18F]DHMT. After the optimal kinetic model was selected, we also investigated the application of graphical analysis methods for [18F]DHMT, which are usually more computationally efficient than the compartment models. The optimal equilibration time t* was investigated for graphical analysis. Next, a parametric image for each study was obtained using voxel-by-voxel modeling with the optimal graphical analysis method.
Statistical Analyses
Wilcoxon signed-rank test were performed on the AIC values for all the studies (n=9) using 1T, 2T and 2Ti models to select the optimal kinetic model for [18F]DHMT. To select the optimal t* for graphical analysis, the mean absolute difference with standard deviation (SD) were compared between Ki values obtained from graphical analysis with different t* values and those from the optimal compartment model as the gold standard. Correlation value and least squares fit were calculated to compare Ki values derived from compartment modeling and graphical analysis. To compare the static and dynamic imaging results, correlation values and least squares fits were calculated to compare Ki values derived from dynamic imaging to the standard uptake value (SUV) of the LV myocardium and the LV-to-blood pool SUV ratio.
Results
Tracer distribution in dynamic images
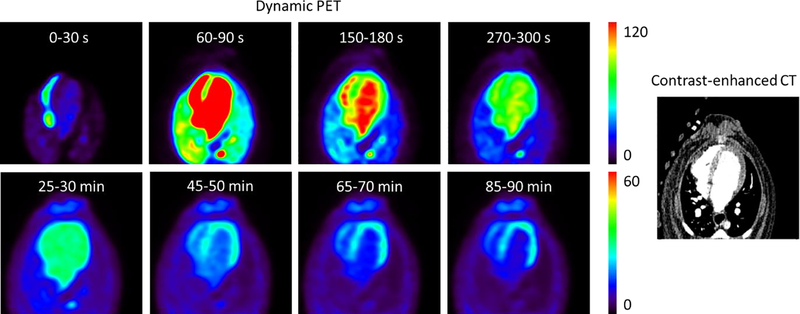
Figure 1 shows representative dynamic [18F]DHMT images in a healthy dog at baseline. The dynamic images show that the tracer slowly clears from the LV blood pool and enters into the myocardium, then it is retained in the myocardium until the late phase of the study.
Figure 1.
Representative dynamic PET images (unit: kBq/mL) of [18F]DHMT uptake and the aligned contrast-enhanced CT image in a healthy dog at baseline, shown in the transverse plane. Each row of the dynamic PET images is scaled to one maximum value (lower for the later 5-min frames).
Plasma Metabolite Analysis
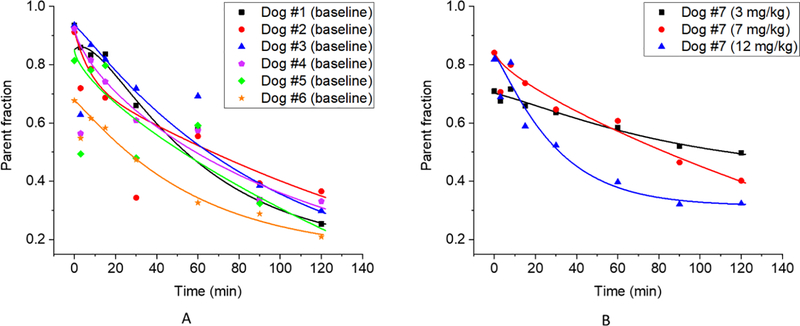
Figure 2 shows the plasma parent fraction data (both raw data and fitted curve) for the 6 baseline studies (Figure 2A) and for the three serial studies for the DOX-treated dog (Figure 2B). Visible inter-subject variability can be observed from the baseline studies in Figure 2A. In addition, differences were observed across studies for the same DOX-treated dog, as seen in Figure 2B. Therefore, metabolite correction was performed on a study-by-study basis by using the fitted parent fraction curve for each individual imaging session, rather than a population-based parent fraction (9, 10), to ensure accurate measurement of the arterial input function for [18F]DHMT quantification.
Figure 2.
Plasma parent fraction data (symbol: raw data; line: fitted curve) at baseline (n = 6) (A), and for the three serial PET scans for the DOX-treated dog at various cumulative DOX doses (B).
Optimization results for kinetic models
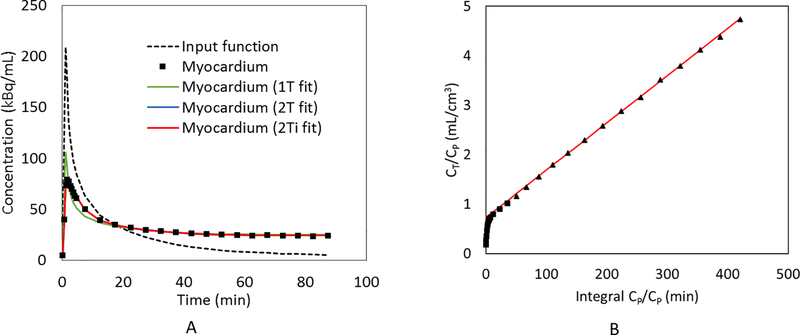
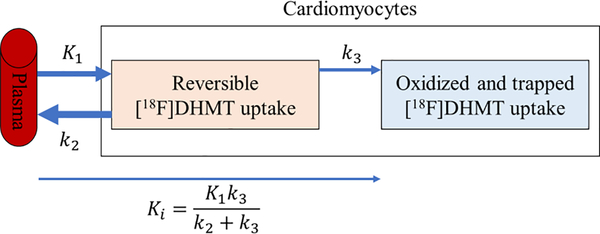
Figure 3A shows representative results of the fitted input function after blood-to-plasma ratio correction and metabolite correction, the myocardial TAC to be fitted, and the fitted myocardial TACs in a healthy dog at baseline with different compartment models. The results show that 1T model did not fit the data well. The fitted curve with the 2T model almost overlapped with the fitted curve with the 2Ti model. Given this similarity, several methods were used to determine optimal compartment model selection. First, detailed AIC values were calculated for each dog study as shown in Supplemental Table 1. Comparison of AIC between studies using a one-tailed Wilcoxon signed-rank test showed that both 2T and 2Ti models were significantly better than 1T model (n = 9; p = 0.002 when comparing 2T and 1T, p = 0.002 when comparing 2Ti and 1T). Two-tailed Wilcoxon signed-rank test results showed that there was no significant difference between 2T and 2Ti models in terms of AIC comparison (n = 9; p = 0.074). Next, for further comparison between 2T and 2Ti models, we reported the detailed K1, k2, k3, k4, Fv, Ki values and the relative standard errors of each estimated parameter with 2T fitting for each dog study as shown in Supplemental Table 2. In addition, we reported K1, k2, k3, Fv, Ki values and the relative standard errors with 2Ti fitting as detailed in Supplemental Table 3. Following these computations, it was evident that both 2T and 2Ti models provided similar estimations for K1 (2T: 0.445 ± 0.251 mL/min/cm3 vs. 2Ti: 0.460 ± 0.247 mL/min/cm3), k2 (2T: 0.719 ± 0.202 min−1 vs. 2Ti: 0.730 ± 0.233 min−1), k3 (2T: 0.022 ± 0.005 min−1 vs. 2Ti: 0.021 ± 0.005 min−1), and for Fv (2T: 0.206 ± 0.087 mL/cm3 vs. 2Ti: 0.196 ± 0.072 mL/cm3). Notably, all the estimations for K1, k2, k3, Fv using either 2T or 2Ti were reasonable with small relative standard errors, and the estimated Fv values were physiologically reasonable (5), lending credence to the model. Conversely for 2T fitting, k4 was relatively small (0.001 ± 0.002 min−1) and the relative standard error of k4 fitting was relatively large (364% ± 866%) when compared to K1, k2, and k3, indicating that the k4 parameter can be ignored in the fitting. Furthermore, no significant difference was observed between 2T derived Ki and 2Ti derived Ki (n = 9; p = 0.19; 0.0126 ± 0.0048 mL/min/cm3 with 2T vs. 0.0121 ± 0.0047 mL/min/cm3 with 2Ti). As a result, the 2Ti model was selected as the optimal compartment model for [18F]DHMT quantification in this large animal model. Figure 3B also shows that excellent linearity can be observed in the Patlak plot (11) with t* = 27.5 min, which further implies that [18F]DHMT is an irreversible tracer. The kinetics of [18F]DHMT following 2Ti compartment model is illustrated in Figure 4.
Figure 3.
The sample fitting results of the myocardial TAC in a healthy dog at baseline with (A) 1T, 2T and 2Ti compartment models; and (B) Patlak plot (t* = 27.5 min).
Figure 4.
Illustration of the kinetics of [18F]DHMT in the cardiomyocytes following the irreversible two-tissue (2Ti) compartment model. K1, k2 and k3 are the rate constants of [18F]DHMT movement between compartments, and Ki is the net influx rate of [18F]DHMT from the plasma into the irreversibly bound compartment.
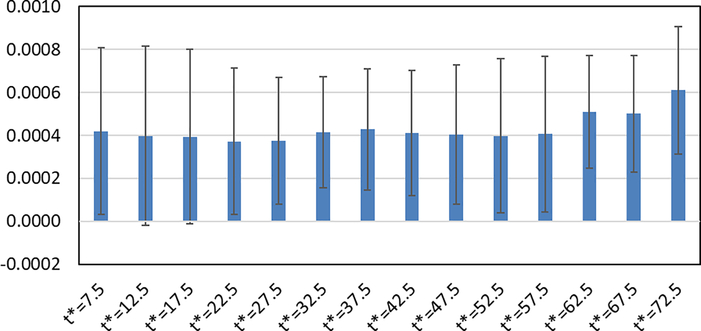
Figure 5 shows the absolute differences (mean ± SD) between Ki values obtained from Patlak plots and 2Ti model (as gold standard) in all studies. In this comparison, different t* values were investigated in the Patlak plot to select an optimal t* value. Considering both the mean and SD values for each t*, the results show that t* = 22.5 – 42.5 min can provide reasonable Ki results by Patlak analysis. In this study, t* = 27.5 min was selected as the optimal start time as it provided the lowest bias in this time range.
Figure 5.
Absolute differences (mean ± SD, unit: mL/min/cm3) between Ki values obtained from Patlak plots with different t* values (unit: min) and 2Ti model (as gold standard) for 9 studies.
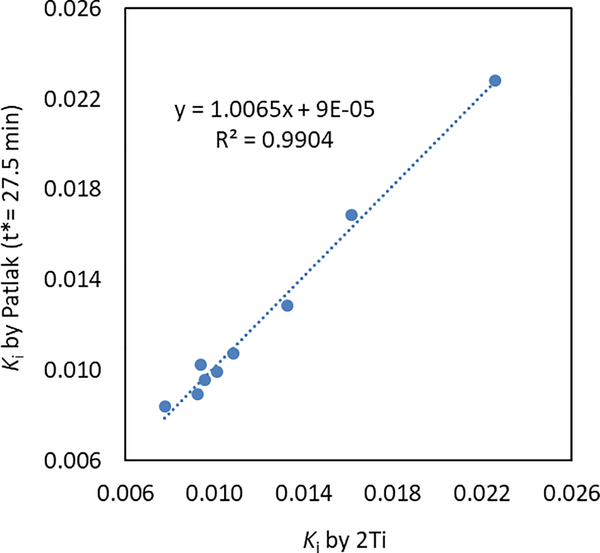
Figure 6 shows the correlation plot between Ki values derived from the 2Ti model and the Patlak plot (t* = 27.5 min). A strong linear correlation (p = 2.5e-8, R2 = 0.99) with a slope near 1 and an intercept near zero can be observed between these two methods, indicating that the Patlak plot can be used as a simplified model of 2Ti for [18F]DHMT kinetic modeling. In addition, the Patlak plot can be further used in the parametric imaging study with voxel-by-voxel fitting.
Figure 6.
Linear regression plot of Ki (mL/min/cm3) values derived from the 2Ti model and the Patlak plot (t* = 27.5 min).
Static and dynamic imaging results for all the studies
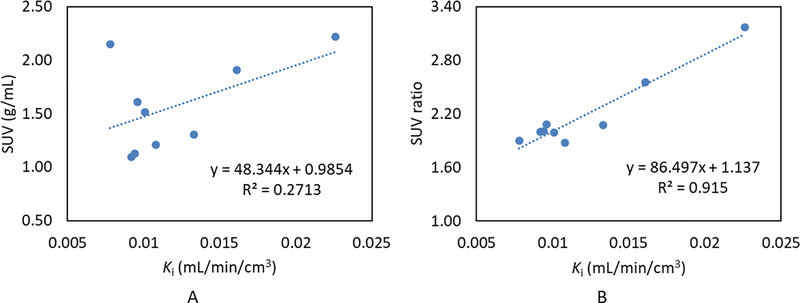
Table 2 summarizes the values of LV SUV, LV-to-blood pool SUV ratio and Ki with the 2Ti model for each dog study, as well as the mean and SD values obtained in the series of the 6 healthy dogs for each parameter. The SUVs and SUV ratios were calculated on the 60 – 90 min static PET images. Figure 7 shows the correlation results between Ki and the LV SUV, and between Ki and the LV-to-blood pool SUV ratio, respectively. A weak linear correlation was observed between Ki and the LV SUV (R2 = 0.27), whereas a strong linear correlation was observed between Ki and the LV-to-blood pool SUV ratio (R2 = 0.92). These results suggest that the LV-to-blood pool SUV ratio is a more appropriate simplified surrogate for ROS quantification than the LV SUV alone.
Table 2.
LV SUV (60 – 90 min), LV-to-blood pool SUV ratio (60 – 90 min) and 2Ti derived Ki values for each study.
| Study | Subject | Doxorubicin Dose (mg/kg) | SUV (g/mL) | SUV ratio | Ki(mL/min/cm3) |
|---|---|---|---|---|---|
|
| |||||
| 1 | Dog #1 | 0 | 1.91 | 2.56 | 0.0161 |
| 2 | Dog #2 | 0 | 1.61 | 2.08 | 0.0096 |
| 3 | Dog #3 | 0 | 2.15 | 1.90 | 0.0078 |
| 4 | Dog #4 | 0 | 1.13 | 2.01 | 0.0094 |
| 5 | Dog #5 | 0 | 1.51 | 1.99 | 0.0101 |
| 6 | Dog #6 | 0 | 2.22 | 3.17 | 0.0226 |
| 7 | Dog #7 | 3 | 1.09 | 2.00 | 0.0092 |
| 8 | Dog #7 | 7 | 1.21 | 1.88 | 0.0108 |
| 9 | Dog #7 | 12 | 1.30 | 2.07 | 0.0133 |
| mean | Dogs #1-6 | 0 | 1.76 | 2.29 | 0.0126 |
| SD | Dogs #1-6 | 0 | 0.42 | 0.49 | 0.0057 |
Figure 7.
Linear regression plots comparing the LV SUVs (A) and the LV-to-blood pool SUV ratios (B) to Ki values derived from a 2Ti model.
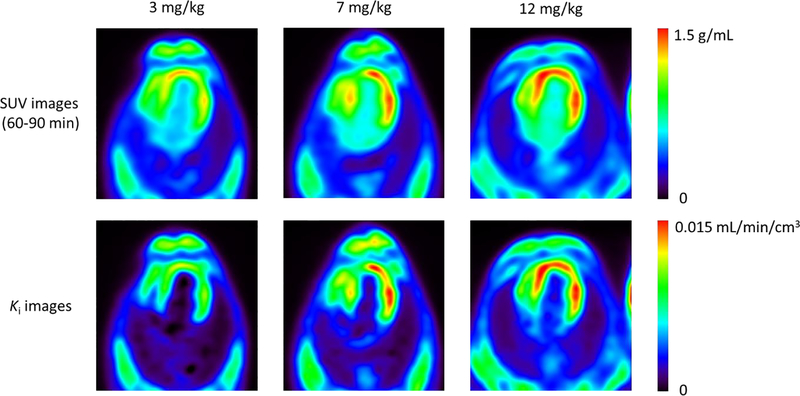
Figure 8 shows representative serial SUV images (60 – 90 min) and the Ki images obtained with voxel-by-voxel Patlak analysis (t* = 27.5 min) for the DOX-treated dog. The parametric Ki images showed superior image contrast between the LV myocardium and blood pool as compared to that of the static SUV images, which allows for a clearer representation of increased myocardial ROS production in this model. For all the studies, the contrast between the LV myocardium and blood pool was 5.1 ± 2.6 in the parametric Ki images and 2.2 ± 0.4 in the static SUV images.
Figure 8.
Representative serial SUV and Ki parametric images at the cumulative DOX doses of 3, 7 and 12 mg/kg for the chemotherapy treated animal, shown in the transverse plane. SUV images were obtained from PET data acquired between 60–90 mins post injection, whereas Ki images were derived from voxel-by-voxel Patlak analysis (t* = 27.5 min).
Discussion
The assessment of ROS production in vivo is challenging due to the highly reactive nature of these molecules and technical challenges related to translating sensitive measurement tools used in cells and small animals (electron spin resonance spectroscopy) to larger mammals. Therefore, biomarkers that indirectly assess the consequences of ROS (oxidized proteins or lipids), key ROS producing enzymes (myeloperoxidase) or antioxidants (reduced glutathione) have been used as surrogate markers of ROS/oxidative stress and have been widely used to demonstrate a relationship between elevated ROS production/oxidative stress and CVD (1). However, circulating biomarkers are non-specific to the myocardium and may represent ROS production in other tissues, especially in the presence of metabolic disease (12). Several groups have suggested PET imaging of key ROS (e.g., H2O2) (13) or ROS generating enzymes (e.g., nitric oxide synthase) (14) as strategies for the in vivo assessment and quantification of ROS. Recently, we demonstrated the ability to quantify myocardial superoxide production with the novel PET tracer, [18F]DHMT, in small animals using static PET imaging (4). This current work extends these findings, as we successfully developed a method to absolutely quantify [18F]DHMT retention within the myocardium in a large animal model using dynamic 4D PET. In this study, we confirmed that [18F]DHMT follows irreversible kinetics in vivo once oxidized within the myocardium, as evidenced by the fit generated by the 2Ti model and the linearity of Patlak analysis. In addition, we determined an optimal start time (t*) of 27.5 min for Patlak analysis after investigating various t* values. Ki values derived from this optimal t* for Patlak analysis showed a very good linear correlation with those derived from the 2Ti model. Furthermore, high quality parametric images of Ki were generated using voxel-by-voxel Patlak analysis that showed much higher myocardial to blood pool contrast compared to static SUV images. We also showed that the LV-to-blood pool SUV ratio derived from 60 – 90 min scan data strongly correlated with Ki values derived from the 2Ti model, suggesting that this ratio may serve as a simplified quantitative index for [18F]DHMT. Specifically, we demonstrate that healthy animals have a mean LV-to-blood pool SUV ratio of 2.29 (± 0.49). Thus, an elevation of this SUV ratio beyond levels associated with healthy myocardium indicates an elevation in myocardial superoxide production, which may be used as a prognosticator in CVDs associated with oxidative stress, such as anthracycline-induced cardiotoxicity, ischemia-reperfusion injury and congestive heart failure. Indeed, future large-scale clinical studies are needed to define the normal range.
Recently we demonstrated a step-wise increase in the [18F]DHMT LV-to-blood pool SUV ratio over time in DOX-treated rats when compared to control animals in a model of progressive DOX-induced cardiotoxicity (4). In the current study, we also observed a step-wise increase in Ki values over time with chronic DOX treatment in one animal. Since this study was designed to develop a fully quantitative method for [18F]DHMT, we were not sufficiently powered or designed to detect differences in [18F]DHMT uptake over time in chronically DOX-treated canines. Studies with a larger number of animals and in humans are needed to fully assess the value of [18F]DHMT PET imaging as an early detection tool for anthracycline-induced cardiotoxicity.
There are some limitations of the present study that should be discussed. First, our study sample was small, especially in the chemotherapy arm of the study. Thus, we were unable to determine the utility of [18F]DHMT as an early indicator of anthracycline-induced cardiotoxicity in this large-animal model as we have previously done in rodents. Second, ROS production is largely dependent on the rate of oxidative metabolism, which may have been affected by anesthesia and/or cardiotoxicity in these animals. Therefore, future investigations should take into account myocardial oxidative consumption when quantifying ROS production with [18F]DHMT, possibly with 11C-acetate PET imaging (15).
NEW KNOWLEDGE GAINED
We demonstrate, for the first time, the feasibility of absolute quantification of ROS in the myocardium of large animals in vivo, using [18F]DHMT PET dynamic imaging with full kinetic modeling and metabolite analysis. The net influx rate Ki values of LV myocardium obtained using 2Ti compartment model and Patlak analysis were reported in both healthy and chronically DOX-treated beagle dogs. This technique may allow for further elucidation of the relationship between ROS production and many CVDs, and also may be used to assess the response to established and novel therapeutics that influence myocardial ROS production.
Conclusions
We developed a dynamic PET imaging technique with full kinetic modeling and metabolite analysis for absolute quantification of the superoxide tracer, [18F]DHMT, in a large animal model. We demonstrated that [18F]DHMT is an irreversible tracer and selected 2Ti as the optimal compartment model for kinetic modeling. Patlak analysis was selected as the simplified graphical analysis method and was successfully used for generating high-quality parametric Ki images that had superior myocardium-to-blood contrast than static images. The proposed technique for quantifying in vivo myocardial superoxide production from dynamic PET imaging of [18F]DHMT may provide prognostic information in CVD, such as heart failure, in which oxidative stress plays a key role in disease development and progression.
Supplementary Material
Acknowledgments
We would like to thank Dr. Eva Romito, Tsa Shelton and Christi Hawley for their participation and support of the animal studies.
Funding: This work is supported by an internal funding from the Department of Radiology and Biomedical Imaging at Yale University, and the NIH grants R01HL123949 and T32HL098069.
Abbreviations
- ROS
reactive oxygen species
- [18F]DHMT
[18F]-6-(4-((1-(2-fluoroethyl)-1H-1,2,3-triazol-4-yl)methoxy)phenyl)-5-methyl-5, 6-dihydrophenanthridine-3, 8-diamine
- VOI
volume of interest
- TAC
time activity curve
- SUV
standard uptake value
- 2Ti
two-tissue irreversible
- DOX
doxorubicin
- LVEF
left ventricular ejection fraction
- K i
net influx rate
- AIC
Akaike information criterion
Footnotes
Disclosure
The authors declare that they have no conflict of interest.
Publisher's Disclaimer: This Author Accepted Manuscript is a PDF file of an unedited peer-reviewed manuscript that has been accepted for publication but has not been copyedited or corrected. The official version of record that is published in the journal is kept up to date and so may therefore differ from this version.
References
- 1.Sugamura K, Keaney JF Jr. Reactive oxygen species in cardiovascular disease. Free Radic Biol Med. 2011;51(5):978–92. [DOI] [PMC free article] [PubMed] [Google Scholar]
- 2.Frijhoff J, Winyard PG, Zarkovic N, Davies SS, Stocker R, Cheng D, et al. Clinical relevance of biomarkers of oxidative stress. Antioxid Redox Signal. 2015;23(14):1144–70. [DOI] [PMC free article] [PubMed] [Google Scholar]
- 3.Zhang W, Cai Z, Li L, Ropchan J, Lim K, Boutagy NE, et al. Optimized and automated radiosynthesis of [(18)F]DHMT for translational imaging of reactive oxygen species with positron emission tomography. Molecules. 2016;21(12). [DOI] [PMC free article] [PubMed] [Google Scholar]
- 4.Boutagy NE, Wu J, Cai Z, Zhang W, Booth CJ, Kyriakides TC, et al. In Vivo Reactive Oxygen Species Detection With a Novel Positron Emission Tomography Tracer, (18)F-DHMT, Allows for Early Detection of Anthracycline-Induced Cardiotoxicity in Rodents. JACC Basic Transl Sci. 2018;3(3):378–90. [DOI] [PMC free article] [PubMed] [Google Scholar]
- 5.Mohy-Ud-Din H, Boutagy NE, Stendahl JC, Zhuang ZW, Sinusas AJ, Liu C. Quantification of intramyocardial blood volume with (99m)Tc-RBC SPECT-CT imaging: A preclinical study. J Nucl Cardiol. 2018;25(6):2096–111. [DOI] [PMC free article] [PubMed] [Google Scholar]
- 6.Gunn RN, Gunn SR, Cunningham VJ. Positron emission tomography compartmental models. J Cereb Blood Flow Metab. 2001;21(6):635–52. [DOI] [PubMed] [Google Scholar]
- 7.Marquardt DW. An algorithm for least-squares estimation of nonlinear parameters. J Soc Indust Appl Math. 1963;11(2):431–41. [Google Scholar]
- 8.Strother SC, Casey ME, Hoffman EJ. Measuring PET scanner sensitivity: relating countrates to image signal-to-noise ratios using noise equivalents counts. IEEE Trans Nucl Sci. 1990;37(2):783–8. [Google Scholar]
- 9.Wu J, Lin SF, Gallezot JD, Chan C, Prasad R, Thorn SL, et al. Quantitative Analysis of Dynamic 123I-mIBG SPECT Imaging Data in Healthy Humans with a Population-Based Metabolite Correction Method. J Nucl Med. 2016;57(8):1226–32. [DOI] [PubMed] [Google Scholar]
- 10.Wu J, Gallezot JD, Lu Y, Ye Q, Liu H, Esserman DA, et al. Simplified Quantification and Acquisition Protocol for (123)I-MIBG Dynamic SPECT. J Nucl Med. 2018;59(10):1574–80. [DOI] [PubMed] [Google Scholar]
- 11.Patlak CS, Blasberg RG, Fenstermacher JD. Graphical evaluation of blood-to-brain transfer constants from multiple-time uptake data. J Cereb Blood Flow Metab. 1983;3(1):1–7. [DOI] [PubMed] [Google Scholar]
- 12.Houstis N, Rosen ED, Lander ES. Reactive oxygen species have a causal role in multiple forms of insulin resistance. Nature. 2006;440(7086):944–8. [DOI] [PubMed] [Google Scholar]
- 13.Carroll V, Michel BW, Blecha J, VanBrocklin H, Keshari K, Wilson D, et al. A boronate-caged [(1)(8)F]FLT probe for hydrogen peroxide detection using positron emission tomography. J Am Chem Soc. 2014;136(42):14742–5. [DOI] [PMC free article] [PubMed] [Google Scholar]
- 14.Huang HJ, Isakow W, Byers DE, Engle JT, Griffin EA, Kemp D, et al. Imaging pulmonary inducible nitric oxide synthase expression with PET. J Nucl Med. 2015;56(1):76–81. [DOI] [PMC free article] [PubMed] [Google Scholar]
- 15.Klein LJ, Visser FC, Knaapen P, Peters JH, Teule GJ, Visser CA, et al. Carbon-11 acetate as a tracer of myocardial oxygen consumption. Eur J Nucl Med. 2001;28(5):651–68. [DOI] [PubMed] [Google Scholar]
Associated Data
This section collects any data citations, data availability statements, or supplementary materials included in this article.


