1. Acute inflammation, including myocarditis, correlated with high numbers of circulating myeloid dendritic cells in older children with acute Kawasaki disease. 2. Low numbers of CD4+ ILT‐4+ tolerogenic myeloid dendritic cells (tmDC) correlated with enlarged lymph nodes as the initial clinical presentation. 3. CD4+ and CD8+ T cell lymphocytosis and lymphopenia did not correlate with any specific pattern within the innate populations.

Keywords: acute pediatric vasculitis, antigenic triggers, immune monitoring
Summary
Kawasaki disease (KD) is an acute pediatric vasculitis of unknown etiology that can cause coronary artery aneurysms, and is the leading cause of acquired heart disease in children. We studied aspects of the innate and adaptive immune response in 17 acute KD children prior to treatment with intravenous immunoglobulin. Distinct patterns within the innate immune response correlated with specific clinical features. Proinflammatory myeloid dendritic cells (mDC) were abundant in four of 17 (23·5%) subjects who were older and manifested severe inflammation with clinical myocarditis and elevated hepatobiliary enzyme levels. Of the nine subjects with low levels of anti‐inflammatory, tolerogenic mDC, six had enlarged cervical lymph nodes at diagnosis. In contrast, the adaptive immune repertoire varied greatly with no discernible patterns or associations with clinical features. Two subjects with aneurysms had numerous circulating CD8+ T cells. Ten subjects showed low CD4+ T cell numbers and seven subjects had CD4+ T cells in the normal range. CD4+ T cells expressed interleukin‐7 receptor (IL‐7R), suggesting repeated antigenic stimulation. Thymic‐derived regulatory T cells (nTreg) and peripherally induced regulatory T cells (iTreg) were also enumerated, with the majority having the nTreg phenotype. Natural killer (NK) and NK T cell numbers were similar across all subjects. Taken together, the results of the immune monitoring suggest that KD may have multiple triggers that stimulate different arms of the innate and adaptive compartment in KD patients. Thus, it is possible that diverse antigens may participate in the pathogenesis of KD.
Introduction
During the five decades since the original description of Kawasaki disease (KD), numerous etiological agents have been proposed and discarded [1, 2]. Although the diagnosis of KD is based on a defined set of clinical features, there can be variations in the clinical pattern at the time of presentation. For example, approximately one‐third of KD patients present with high serum levels of hepatobiliary enzymes, while another third present with only fever and enlarged cervical lymph nodes (node‐first presentation) that are followed later by the other classic mucocutaneous signs [3, 4]. Do these subtle variations in clinical presentation represent variations in the host genetic response, or could these differences represent responses to different triggers? To address this question, we characterized the repertoire of circulating immune cells and correlated these patterns with clinical and laboratory findings prior to administration of intravenous immunoglobulin (IVIG). Differences in patterns of the mononuclear innate immune response correlated with differences in features of the clinical presentation. In contrast, T cell enumeration was diverse, and no obvious response pattern emerged among the study population besides numerous circulating CD8+ T cells in two patients, who developed arterial complications. Perhaps the search for the etiological agent has been thwarted by the failure to recognize clinical subphenotypes and immune response patterns that raise the possibility of different triggers for KD.
Methods
Study population
Whole blood samples were collected in heparinized tubes from 17 acute, unselected KD subjects (12 males and five females aged 3 months to 11·8 years) prior to IVIG administration. Many of these children had abnormal Z‐scores on their initial echocardiogram and received infliximab for intensification of initial therapy, which is our standard protocol. Thus, the determination of response to IVIG alone was not possible, because these patients had already received additional anti‐inflammatory therapy (Table 1). Clinical features and laboratory data were prospectively recorded. Subjects were categorized by echocardiography on the basis of coronary artery Z‐scores [internal diameter of the right coronary artery (RCA) or left anterior descending artery (LAD) normalized for body surface area] as having normal (Z < 2·0) or aneurysmal CA (Z ≥ 2·5). Z‐worst was defined as the maximum Z‐score for the RCA or LAD during the first 6 weeks after fever onset.
TABLE 1.
Demographic, clinical and immunological characteristics of the Kawasaki disease study population
| CD4+ T cells high: > 30%, low: < 10% | CD8+ T cells high: > 20%, low: < 6% | Illness day at diagnosis* | Sex | Age at onset (years) | Race/ethnicity | EF (%) | Z‐worst** | WBC (× 103) | Plts (× 103) | ESR (mm/h) | CRP (mg/dl) | ALT (IU/l) | GGT (IU/l) | ||
|---|---|---|---|---|---|---|---|---|---|---|---|---|---|---|---|
| High mDC (> 10%) | KD 1 | Normal | Normal | 16 | M | 7·0 | Hispanic | 75·9 | 2·0 | 15·6 | 1093 | 58 | 4·4 | 93 | 656 |
| KD 2 | Normal | Normal | 4 | M | 9·1 | Hispanic | 67·0 | 0·2 | 18·0 | 299 | 66 | 6·3 | 333 | 365 | |
| High mDC Low tmDC | KD 3 | High | Low | 4 | F | 5·1 | Hispanic | 57·0 | 3·2 | 4·7 | 66 | 19 | 4·5 | 37 | 20 |
| KD 4 | Low | Low | 6 | F | 6·1 | Caucasian | 50·0 | 2·9 | 17·7 | 338 | >140 | 19·4 | 140 | 148 | |
| Low tmDC (< 6%) | KD 5 | High | High | 4 | M | 0·7 | African American | 72·3 | 4·0 | 22·8 | 394 | 62 | 21·4 | 34 | 98 |
| KD 6 | High | High | 6 | F | 0·8 | Chinese + Filipino | 65·5 | 4·6 | 16·9 | 587 | 129 | 19·6 | 44 | 51 | |
| KD 7 | High | Normal | 7 | M | 2·2 | Caucasian | 59·0 | 2·8 | 12·5 | 370 | 83 | 5·6 | 48 | 18 | |
| KD 8 | Low | Low | 11 | M | 2·3 | Caucasian | 76·0 | 3·1 | 11·0 | 362 | 76 | 7·6 | 15 | 11 | |
| KD 9 | Normal | Low | 6 | M | 3·1 | Hispanic | 69·3 | 3·9 | 21·6 | 339 | 86 | 23·4 | 78 | 62 | |
| KD 10 | Normal | High | 7 | F | 4·2 | Caucasian | 58·0 | 0·6 | 14·2 | 499 | 53 | 22 | 197 | 235 | |
| KD 11 | Normal | Normal | 4 | M | 11·8 | Filipino | 60·0 | 2·9 | 6·2 | 201 | 45 | 17·7 | 62 | 95 | |
| Others | KD 12 | High | Normal | 4 | F | 0·3 | Caucasian + Filipino | 69·4 | 2·0 | 18·5 | 401 | 66 | 7·1 | 44 | 26 |
| KD 13 | High | Normal | 5 | M | 0·4 | Caucasian + Chinese | 71·6 | 2·0 | 14·8 | 450 | 75 | 30·3 | 41 | 19 | |
| KD 14 | Normal | Normal | 6 | M | 3·5 | Filipino + Hispanic | 61·0 | 0·8 | 15·5 | 313 | 56 | 19·2 | 157 | 72 | |
| KD 15 | Normal | Normal | 7 | M | 7·8 | Hispanic | 67·0 | 2·8 | 10·7 | 279 | 102 | 13·9 | 29 | 15 | |
| KD 16 | Low | Low | 7 | M | 8·1 | Caucasian | 73·3 | 2·0 | 11·8 | 275 | 32 | 2·9 | 226 | 362 | |
| KD 17 | High | Normal | 5 | M | 9·1 | Hispanic | 63·0 | 1·3 | 7·8 | 223 | 47 | 0·6 | 80 | 145 |
Illness day 1 = first day of fever;
Z‐worst = maximum dimension during the first 6 weeks after fever onset of the right and left anterior descending coronary arteries normalized for body surface area.
EF = left ventricular ejection fraction; WBC = white blood cells; Plts = platelets; ESR = erythrocyte sedimentation rate; CRP = C‐reactive protein; ALT = alanine aminotransferase; GGT = gamma‐glutamyl transferase; mDC = myeloid dendritic cells; tmDC = tolerogenic myeloid dendritic cells.
We enrolled as controls six healthy children, two males (aged 3 and 8·5 years) and four females (aged 2·5, 4, 4·7 and 5·5 years), three Hispanic, one Caucasian and two with mixed ethnicity.
The protocol was reviewed by the Institutional Review Board at the University of California San Diego and parent consent and patient assent were obtained as appropriate.
Characterization of innate cells
Myeloid dendritic cells (mDC) and macrophage populations and their maturation stage were defined by binding of the following monoclonal antibodies (mAb) to cell surface markers and analyzed by flow cytometry: anti‐human CD11c allophycocyanin (APC), mouse immunoglobulin (Ig)G1κ, clone B‐ly6, anti‐human CD11b APC/cyanin 7 (Cy7), mouse IgG1κ, clone ICRF44, anti‐human CD14 phycoerythrin (PE)/Cy7, mouse IgG2aκ, clone M5E2, anti‐human CD86 fluorescein isothiocyanate (FITC), mouse IgG1κ, clone 2331 (FuN‐1), anti‐human CD4 AF700 mouse IgG1κ, clone RPA‐T4, anti‐human ILT‐4 peridinin chlorophyll (PerCp)/eF710 and mouse IgG2bκ, clone 42D1 from eBioscience (San Diego, CA, USA). Data for all immunophenotyping were acquired with fluorescence activated cell sorter (FACS) ARIA II and analyzed using FACSDiva (BD Biosciences, San Jose, CA, USA) software. Normal pediatric ranges for mDC and tolerogenic mDC (tmDC) were previously determined by our group [5, 6].
Characterization of T cells
CD4+ and CD8+ T cells were enumerated by labeling with anti‐human CD4 PerCp/Cy5·5, mouse IgG1κ, clone RPA‐T4 from eBioscience and anti‐human CD8 AF700, mouse IgG1κ, clone RPA‐T8 from BD Bioscience. The activation state was defined by staining with anti‐human human leukocyte antigen D‐related (HLA‐DR) APC/H7, mouse IgG2aκ, clone G46‐6 and anti‐human IL‐7R FITC and mouse IgG1κ, clone eBioRDR5 from BD Bioscience. Regulatory T cells were enumerated and their functional phenotype determined by labeling with the following mAbs: CD25 BV421, mouse IgG1κ and clone M‐A251 from BD Bioscience, and anti‐human CD4 PerCp/Cy5.5, mouse IgG1κ, clone RPA‐T4, anti‐human IL‐7R FITC, mouse IgG1κ, clone eBioRDR5, anti‐human HLA‐DR APC/H7 clone G46‐6, mouse IgG2aκ from eBioscience.
Natural killer (NK) and NK T cells
NK cells were defined by the expression of CD56 using anti‐human CD56 PE/Cy7, mouse IgG1κ, clone CMSSB from BD Bioscience. NK T cells were defined by the dual expression of CD56 and CD4: anti‐human CD56 PE/Cy7, mouse IgG1κ, clone CMSSB from BD Bioscience, and anti‐human CD4 PerCp/Cy5·5, mouse IgG1κ, clone RPA‐T4 from eBioscience.
Plasma cytokine levels
IL‐6 and tumor necrosis factor (TNF‐α) levels in plasma [ethylenediamine tetraacetic acid (EDTA)] were measured in a subset of six subjects using the Mesoscale Discovery multiplex V‐PLEX human cytokine 4‐plex kit (Mesoscale Discovery, Rockville, MD, USA) according to the manufacturer’s instructions.
Results
We characterized selected aspects of the innate and adaptive immune cell repertoire in our acute KD cohort. Healthy children served as controls in these experiments. The analysis of innate immune cells included dendritic cell (DC) populations that can be divided into proinflammatory (mDC) and anti‐inflammatory, tolerogenic (tmDC) subpopulations based on cell surface markers [6, 7, 8]. The circulating repertoire of DC in children differs markedly from adults with large numbers of tmDC, the anti‐inflammatory phenotype [6]. We characterized both DC populations as well as macrophages in our study cohort.
Subjects with high numbers of activated mDC
Mature, proinflammatory mDC were defined by the expression of CD11c and CD11b and the absence of CD14, a marker expressed on monocytes, immature myeloid dendritic cells, other myeloid populations with a tolerogenic phenotype and macrophages [8, 9]. In four subjects (subjects 1–4, Table 1), mDC were abundant [≥ 10% of total peripheral blood mononuclear cells (PBMC)] and represented the largest innate mononuclear cell population in circulation (Fig. 1). Of interest, the four patients with the highest percentage of mDC were older KD subjects who manifested severe inflammation with elevated erythrocyte sedimentation rates (ESR), disseminated intravascular coagulation (subject 3), elevated hepatobiliary enzymes (subjects 1, 2 and 4) and myocarditis, as manifested by low left ventricular ejection fraction (subjects 3 and 4) (Table 1).
Fig. 1.
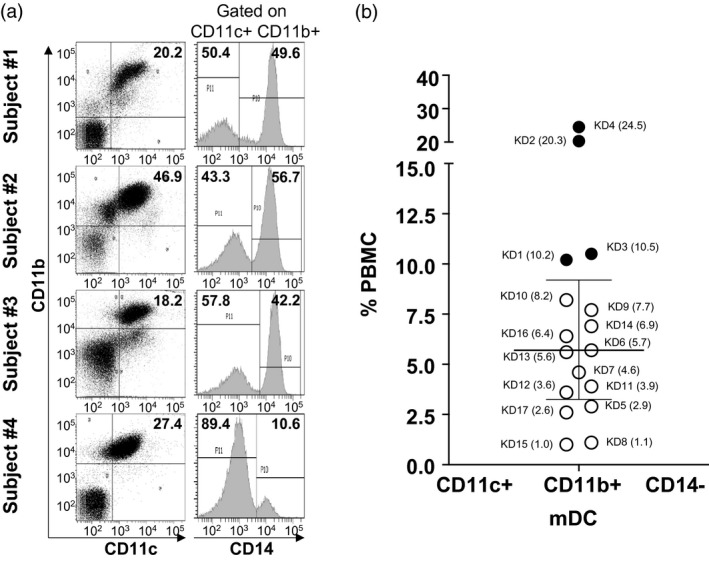
Myeloid dendritic cells (mDC) in acute Kawasaki disease (KD) subjects. CD11c+CD11b+CD14− mDC were enumerated by flow cytometry. mDC ≥ 10% of total peripheral blood mononuclear cells (PBMC) were considered to be above the normal range. (a) Fluorescence activated cell sorter (FACS) plots showing CD11c+CD11b+CD14− mDC from subjects 1–4 (Table 1) with high mDC. (b) Percentage of CD11c+CD11b+CD14− mDC in total PBMC from the 17 KD subjects. The data are shown as a scatter‐plot with median and interquartile range. Subject numbers (Table 1) are shown with the percentage of PBMC in parentheses. Open circle = KD subjects with normal mDC; filled circle = KD subjects with high mDC.
Subjects 3 and 4 also had very few tmDC in circulation, suggesting an even greater proinflammatory profile (Fig. 2).
Fig. 2.
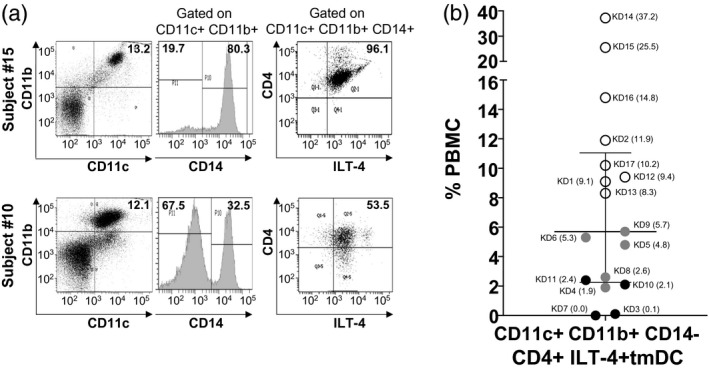
Tolerogenic myeloid dendritic cells (tmDC) in acute Kawasaki disease (KD) subjects. To study innate immune regulation in KD subjects, CD11c+CD11b+CD14+CD4+ immunoglobulin‐like transcript‐4 (ILT‐4)+ tmDC) were enumerated by flow cytometry. tmDC ≤ 6% of total peripheral blood mononuclear cells (PBMC) were considered to be below the normal range. (a) Representative fluorescence activated cell sorter (FACS) plots and gating strategies of KD subject 15 with normal tmDC and KD subject 10 with low tmDC. Percentage of CD11c+CD11b+ population in total PBMC is shown on the left panel. Next, CD14 expression was determined on gated double‐positive CD11c+CD11b+ populations (middle panel) followed by CD4+ILT‐4+ expression gated on CD11c+CD11b+CD14+ cells (right panel). (b) Percentage of CD11c+CD11b+CD14+CD4+ILT‐4+ tmDC in total PBMC from 17 KD subjects. The data are shown as a scatter‐plot with median and interquartile range. Subject numbers (Table 1) are shown with the percentage of PBMC in parentheses. White circle = KD subjects with normal tmDC; black circle = KD subjects with low tmDC; grey circle = KD subjects with low tmDC showed ‘lymph node first’ presentations.
Subjects with low numbers of tmDC
tmDC are an important subpopulation of mDC that are abundant in children, and play an important role in immune regulation [6]. These cells are defined by the expression of two specific markers on CD11c+CD11b+CD14+ myeloid cells: the immunoglobulin‐like transcript‐4 (ILT‐4) (CD85d) and the T cell co‐receptor CD4. tmDC secrete large amounts of the suppressive lymphokine IL‐10. tmDC were reduced in numbers (≤ 6%) in nine subjects (subjects 3–11), of whom five shared the ‘lymph node first’ presentation of KD with prominent cervical lymph nodes and fever as the first manifestations of their illness (subjects 4, 5, 6, 8 and 9) [3, 4]. Subject 4, with severe myocarditis and very high proinflammatory mDC, was also lacking circulating tmDC (Table 1, Figs. 1 and 2).
Coronary artery aneurysms are a complication of the acute vasculitis of KD, and eight of the nine subjects with low tmDC had small aneurysms with a Z‐worst > 2·5. Infants aged < 1 year are known to be at higher risk for aneurysms, and we studied four infant subjects. Subjects 5 and 6 had the largest aneurysms (Z worst: 4·0 and 4·6, respectively), low tmDC and very high CD4+ and CD8+ T cells. In contrast, the two remaining infants had normal numbers of tmDC, low levels of CD8+ T cells and no aneurysms. Although histological evidence of myocarditis is a universal feature of KD, clinically apparent myocarditis is less common. Of the nine subjects with low tmDC, four had left ventricular ejection fractions < 60% with recovery to > 65% in the subacute phase (data not shown). Subjects with normal or high numbers of circulating tmDC had normal ejection fractions throughout their clinical course.
The cell characterization by flow cytometry of a representative patient with normal and low numbers of tmDC is shown in Fig. 2a. We gated on CD11c+CD11b+CD14+ cells and looked at the co‐expression of ILT‐4 and CD4. Of note, the majority of tmDC were mature and activated, as evidenced by their expression of CD86 (Supporting information, Fig. S1). These tolerogenic innate cells, unique in pediatric subjects, control the activation of proinflammatory mDC, which may explain why their deficiency in circulation correlated with enlarged cervical lymph nodes, clinical myocarditis and coronary artery aneurysms. Enumeration of mDC and tmDC in healthy children showed similar median values compared to our KD subjects (Supporting information, Fig. S2A,B). CD11b+CD14+ macrophages were not abundant in circulation, suggesting that cells in the myeloid DC compartment are more relevant for KD pathogenesis (Fig. 3).
Fig. 3.
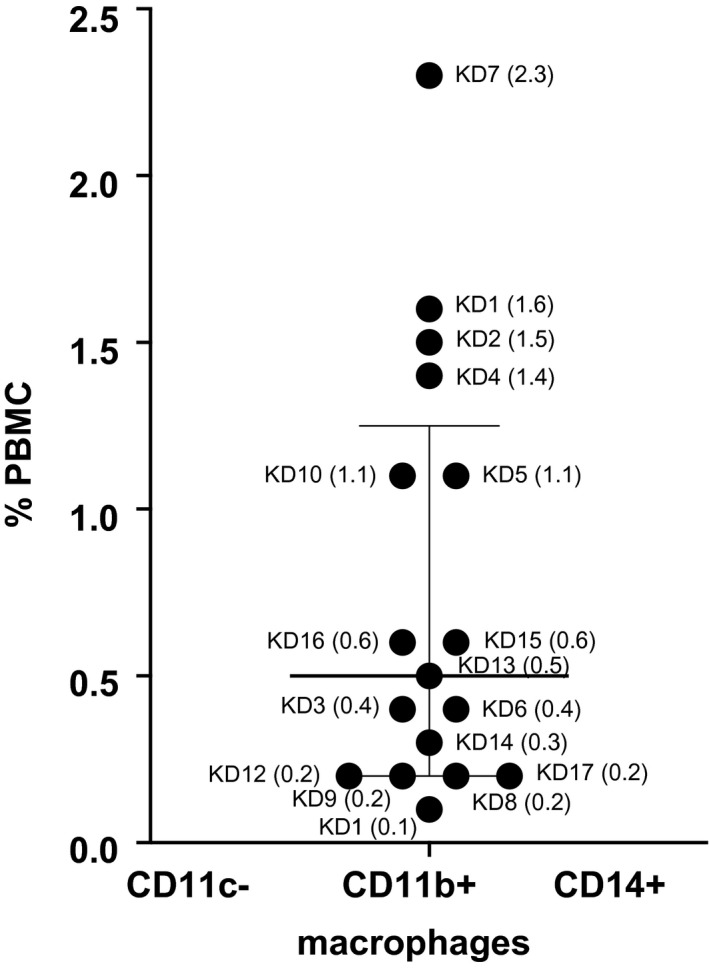
Macrophages in acute Kawasaki disease (KD) subjects. The percentage of CD11c−CD11b+CD14+ macrophages in total peripheral blood mononuclear cells (PBMC) is shown as a scatter‐plot with median and interquartile range. Subject numbers (Table 1) are shown with the percentage of PBMC in parentheses.
Enumeration of T cells suggests different antigenic stimuli
T cells were enumerated from PBMC with monoclonal antibodies to CD4 and CD8 and compared to healthy controls (Supporting information, Fig. S2C). The recent activation via T cell receptor (TCR) signaling was assessed by DR expression, and the active expansion and continuous stimulation of these cells was evaluated by co‐expression of the IL‐7R (CD127) [10]. Normal ranges of CD4+ T cells (≥ 20–60%) were found in seven subjects with great variability (Fig. 4a). Of these seven subjects, four showed a high percentage of CD4+IL‐7R+ T cells (Fig. 4a). Overall, CD4+ T cell enumeration correlated with a high number of CD4+IL‐7R + (r 2 = 0·7062, P < 0·0001) (Fig. 4c). The mean fluorescence intensity (MFI) of IL‐7R on CD4+IL‐7+ suggested comparable IL‐7R expression at a single‐cell level (Fig. 4c). Of note, among the patients with numerous CD4+IL‐7R+ T cells, only subjects 5 and 6, who developed aneurysms, showed higher numbers of CD8+ cytotoxic T cells in circulation (Fig. 4b). These two patients developed aneurysms and were IVIG‐resistant (Table 1). The serum levels of IL‐6 were high compared to others in the cohort (Supporting information, Fig. S3). As an example of the very diverse T cell response, subject 3 had fewer than 6% of CD8+ T cells, in sharp contrast to CD4+ T cells, that were 34·9% of PBMC and rapidly expanding. This patient was older, had clinically apparent myocarditis and had high numbers of mDC and low numbers of tmDC in circulation. The only subject with very high CD8+ T cells (subject 10) had very few tmDC in circulation (Figs. 2 and 4). Of interest, the percentage of CD8+ T cells that expressed the IL‐7R was fewer than CD4+ T cells (Fig. 4b). The MFI suggested modest increasing of IL‐7R expression at single cell level on CD8+ T cells (Fig. 4d).
Fig. 4.
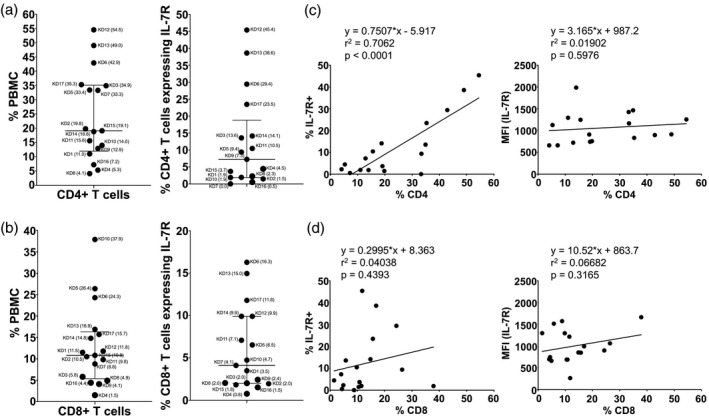
CD4+ and CD8+ T cells and their expression of interleukin‐7 receptor (IL‐7R) in acute Kawasaki disease (KD) subjects. The percentages of helper CD4+ T cells (a) and cytotoxic CD8+ T cells (b) in total peripheral blood mononuclear cells (PBMC) are shown as scatter‐plots with median and interquartile range. Subject numbers (Table 1) are shown with the percentage of PBMC in parentheses. We also measured the expression of the IL‐7R on CD4+ and CD8+ populations to explore possible continuous stimulation by antigens. Correlations of the percentage of IL‐7R+ (left panel) or the expression level of IL‐7R [right panel, shown as mean fluorescence intensity (MFI)] with CD4+ (c) and CD8+ T cells (d) are shown.
Lymphopenia involving CD4+ and CD8+ T cells was very pronounced in subjects 4, 8 and 14 (Table 1, Fig. 4). Subject 4 was an older patient with high mDC, low tmDC and clinically significant myocarditis. The enumeration of recently activated DR+ T cells was similar in all the subjects studied, regardless of their circulating T cell numbers or phenotype (Supporting information, Fig. S4).
Regulatory T cells (Treg) in circulation are predominantly natural thymic‐derived Treg
Treg were defined as peripherally induced (iTreg) or natural Treg (nTreg) by the presence (iTreg) or absence (nTreg) of the IL‐7R [11, 12, 13] (Fig. 5). We enumerated CD4+CD25high Treg in circulation and found a scattered distribution ranging from 0·01 to 1·5% of total PBMC, which was similar to healthy pediatric controls (Fig. 5b, Supporting information, Fig. S2C). Only subject 2, with elevated hepatobiliary enzymes and high mDC, had a large expansion of nTreg in circulation. The IL‐7R was not expressed on the majority of Treg, which confirms an nTreg phenotype (Fig. 5b). These results are consistent with our previously published data that the majority of Treg in circulation in acute KD are nTreg.
Fig. 5.
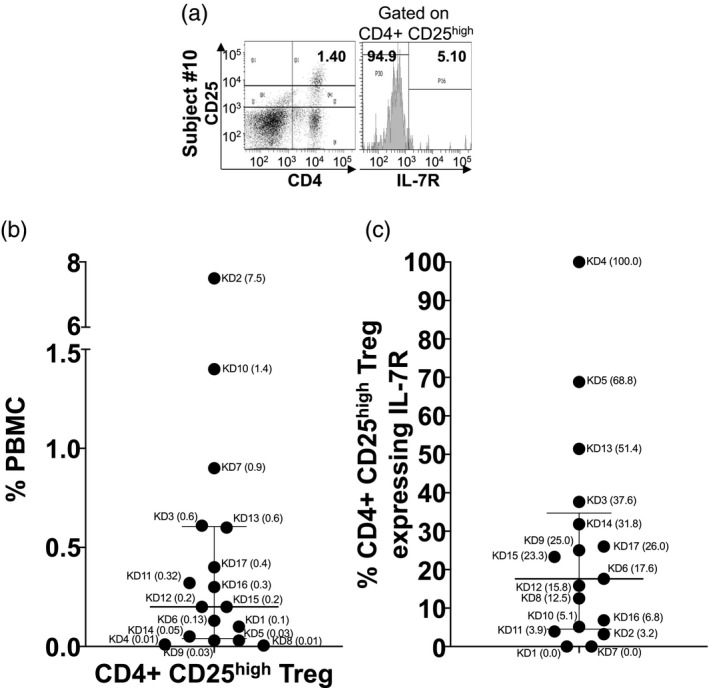
Thymic‐derived and peripherally induced CD4+CD25high regulatory T cells (Treg) in acute Kawasaki disease (KD) subjects. To study regulation by the adaptive immune system in KD subjects, we measured CD4+CD25high Treg in total peripheral blood mononuclear cells (PBMC) and the expression of interleukin‐17 receptor (IL‐7R) to identify thymic‐derived (IL‐7R−) and peripherally induced (IL‐7R+) Treg. (a) Representative fluorescence activated cell sorter (FACS) plots of thymic‐derived and peripherally induced Treg from KD subject 10. Percentage of CD4+CD25high Treg in total PBMC and IL‐7R expression is shown. (b) Percentage of CD4+CD25high Treg in total PBMC from the 17 KD subjects. Subject numbers (Table 1) are shown with the percentage of of PBMC or Treg in parentheses. (c) Percentage of CD4+CD25high Treg expressing IL‐7R (peripherally induced Treg). The data are shown as scatter‐plots with median and interquartile range.
Enumeration of NK cells and NK T cells
NK cells defined by the expression of CD56 were present within the normal range for children (< 15% of PBMC) in 15 of 17 subjects. Two subjects (3 and 10) had high numbers of NK in circulation (Fig. 6). Both subjects had low left ventricular ejection fractions and low tmDC. The NK T cells (CD4+CD56+) were present within normal ranges from 0·1 to 12% of PBMC (Fig. 6).
Fig. 6.
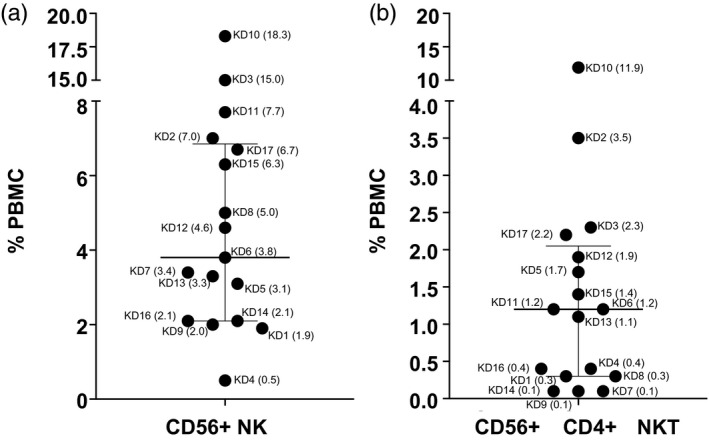
Natural killer (NK) and NK T cells in acute Kawasaki disease (KD) subjects. CD56+ NK cells (a) and CD56+CD4+ NK T (b) in total peripheral blood mononuclear cells (PBMC) from 17 KD subjects. The data are shown as scatter‐plots with median and interquartile range. Subject numbers (Table 1) are shown with the percentage of PBMC in parentheses.
Discussion
We report here the characterization of the innate and adaptive immune response in acute KD patients with the goal of defining patterns of host response. Surprisingly, the patterns varied greatly across the cohort, but certain innate response motifs were identified that corresponded to clinical subphenotypes. Although KD is often conceptualized as a monomorphic disease, it may be more accurate to characterize it as a syndrome with subtle variation among clinical subgroups. No single immune response pattern emerged, and there was no obvious association with age, sex, race or illness day in our small cohort. This led us to consider whether these disparate patterns of immune response reflected exposure to different antigenic stimuli.
The innate immune monitoring included the enumeration of mDC that play an important role in human vascular inflammation [14] and tmDC, a pediatric DC population with potent immune regulatory functions [6]. These two innate populations were more clearly linked with clinical subgroups, in contrast to the T cell populations that showed no specific pattern. Only older children showed high numbers of mature mDC in circulation, and this hallmark correlated with a severe inflammatory phenotype. Conversely, tmDC deficiency was strongly associated with enlarged cervical lymph nodes at presentation, which supports the important role of tmDC in the regulation of other innate cells in secondary lymphoid organs. These different clinical phenotypes may suggest different antigenic exposures, which is supported by the lack of correlation between the mDC and T cell patterns. In particular, different T cell lineages were circulating in different percentages in the cohort. T cells play an important role in KD pathogenesis, in particular CD8+ cytotoxic T cells, documented by histological examination of KD autopsy tissue in the arterial wall [15, 16, 17]. Similar findings have been replicated in the Lactobacillus caseii murine model of KD [18]. We enumerated CD4+ and CD8+ T cell populations and looked for evidence of continuous or repeated antigenic stimulations by measuring the expression of the IL‐7R on the cell surface. IL‐7 maintains the survival and homeostasis of naive T cells and the development of T cell memory under repeated TCR stimulation [10]. CD4+ T cells were in the normal and low range. Surprisingly, only three patients showed a significant CD8+ lymphocytosis, and two of these were the patients with the largest coronary artery aneurysms. CD4+IL‐7R+ T cells were numerous, but not CD8+IL‐7R+ T cells, which suggested that the antigenic stimulus for the CD4+ T cell population was still present at the time of diagnosis. The lack of IL‐7R expression on CD8+ T cells could be related to the fact that CD8+ T cells undergo apoptosis after TCR engagement, suggested by the expression of the activation marker DR and killing of their targets. CD8+ T cells could, in fact, have been stimulated prior to the acute symptoms. T cell numbers and phenotype showed no specific patterns in relation to the innate immune cell populations. Three subjects were profoundly lymphopenic, possibly suggesting a viral exposure, but there was no obvious clinical pattern that linked these three subjects. None had associated symptoms suggestive of a viral gastrointestinal or upper respiratory tract infection, but formal viral testing was not performed.
Only one subject (subject 2) had high circulating numbers of nTreg. This patient had high numbers of mDC and presented with elevated hepatobiliary enzyme levels. nTreg play an important role in the resolution of acute inflammation in KD, and this population expands dramatically after treatment with IVIG [19, 20].
Natural killer cells were high in two subjects: one with clinical myocarditis, high mDC and very low CD8+ T cells in circulation and one with very high numbers of CD8+ T cells in circulation and low tmDC. Once again, these results point to the possibility that there are diverse antigenic stimuli that activate different efferent arms of the immune response. Much attention has been given to NK T cells in vascular inflammation [21]. They are a unique subset of T cells whose function is more aligned with the innate immune response. They secrete both proinflammatory and regulatory lymphokines, and they target lipid antigens [22]. Our analysis suggests that NK T were not relevant in the response to antigens during the acute phase of KD.
We recognize both strengths and limitations to our study. This is the first characterization, to our knowledge, of aspects of the innate and adaptive immune response in KD children with detailed phenotyping that reflects the current understanding of circulating immune cell subpopulations. These results are relevant, given the possible role of SARS‐CoV‐2 as one of many triggers for the vascular inflammation as seen in acute KD. Although all subjects shared a diagnosis of KD, we did not perform molecular testing for concomitant viral respiratory pathogens that are common in children during the winter months. Thus, T cell populations could have been skewed by response to an antecedent viral infection that preceded KD but had lasting effects on the T cell repertoire. In addition, the cohort of patients was small and cytokine levels were only measured in a subset, which precluded any robust statistical conclusions. Other cells that clearly participate in the acute response in KD including neutrophils and platelets were not studied.
Conclusion
The diversity of the innate and adaptive immune responses in acute KD subjects raises the possibility that different antigenic triggers lead to expression of the clinical syndrome that we recognize as KD.
Disclosures
None of the authors have financial or commercial conflicts of interest.
Author contributions
J. C. B. enrolled KD patients and participated in writing the manuscript. A. F. designed and directed the study and wrote the manuscript. L. E. H., J. K. and N. B. performed the immune monitoring experiments and analyzed the results under the supervision of A. F. N. S. collected and managed the clinical data serving as a bridge between the clinic and the laboratory. C. S. provided lymphokine data. A. H. T. enrolled KD patients. All co‐authors participated in editing the manuscript.
Supporting information
Fig. S1. CD86 expression on different myeloid cell populations. The activation and maturation of different myeloid populations was determined by measuring CD86 expression on CD11c+ CD11b+ CD14‐ mDC (a), CD11c+ CD11b+ CD14+ CD4+ ILT‐4+ tmDC (b), and CD11c‐ CD11b+ CD14+ macrophages (c). Subject numbers (Table 1) are shown with the % of CD86+ cells in the specific cell populations in parentheses.
Fig. S2. Characterization of innate and adaptive immune cell repertoire in healthy pediatric controls. (a) Enumeration of CD11c+ CD11b+ CD14‐ mDC out of PBMC (left panel) and maturation stage measured by CD86 expression (right panel). (b) Enumeration of CD11c+ CD11b+ CD14+ CD4+ ILT‐4+ tmDC (left panel) and maturation stage measured by CD86 expression (right panel). (c) Enumeration of CD4+ T cells, CD8+ T cells, and CD4+ CD25high Treg in total. The data are shown as scatter plots with median and interquartile range.
Fig. S3. Plasma IL‐6 and TNFα levels in acute KD subjects. IL‐6 and TNFα from six acute KD subjects (subjects #3, 5, 6, 7, 8, and 15) were measured by multiplex ELISA. Each bar indicates the data derived from a single subject. Immunophenotyping results are shown for each patients below the cytokine levels.
Fig. S4. HLA‐DR expression on T cells. Recently activated CD4+ (a) and CD8+ (b) T cells were identified by the surface expression of HLA‐DR. The correlation between the expression levels of HLA‐DR (shown as MFI) and the percent of CD4+ and CD8+ T cells is shown (right panel).
Acknowledgements
This work was supported by the Marylin and Gordon Macklin Foundation, by a grant from the American Heart Association (15GRNT22760008), by a grant from the National Institutes of Health (RO1AI43586), a grant from the Praespero foundation and a fellowship from the Ministry of Science and Technology of Taiwan (107‐2917‐I‐564‐023) to L. E. H.
References
- 1. Yeung RS. Kawasaki disease: update on pathogenesis. Curr Opin Rheumatol 2010; 22:551–60. [DOI] [PubMed] [Google Scholar]
- 2. Newburger JW, Takahashi M, Gerber MA et al Diagnosis, treatment and long term management of Kawaski disease: a statement for health professionals from the Committee for Rheumatic Fever, Endocarditis and Kawaski Disease, Council on Cardiovascular Diseases in the Young. American Heart Association. Circulation 2004; 110:2747–71. [DOI] [PubMed] [Google Scholar]
- 3. Ting EC, Capparelli EV, Billman GF, Lavine JE, Matsubara T, Burns JC. Elevated gamma‐glutamyl transferase concentrations in patients with acute Kawasaki disease. Ped Infect Dis J 1998; 17:431–2. [DOI] [PubMed] [Google Scholar]
- 4. Kanegaye JT, Van Cott E, Tremoulet AH et al Differentiating lymph‐node‐first presentation of Kawasaki disease from bacterial lymphadenitis. J Pediatr 2013; 162:1259–63. [DOI] [PMC free article] [PubMed] [Google Scholar]
- 5. Burns JC, Song Y, Bujold M et al Immune‐monitoring in Kawasaki disease patients treated with infliximab and intravenous immunoglobulin. Clin Exp Immunol 2013; 174:337–44. [DOI] [PMC free article] [PubMed] [Google Scholar]
- 6. Franco A, Kumar J, Lin G et al Pediatric tolerogenic DCs expressing CD4 and immunoglobulin‐like transcript receptor (ILT)‐4 secrete IL‐10 in response to Fc and adenosine. Eur J Immunol 2018; 48:482–91. [DOI] [PubMed] [Google Scholar]
- 7. Reis e Sousa C. Dendritic cells in a mature age. Nat Rev Immunol 2006; 6:476–83. [DOI] [PubMed] [Google Scholar]
- 8. Sallusto F, Lanzavecchia A. Monocytes join the dendritic cell family. Cell 2010; 143:339–40. [DOI] [PubMed] [Google Scholar]
- 9. Sallusto F, Lanzavecchia A. Efficient presentation of soluble antigen by cultured human dendritic cells is maintained by granulocyte/macrophage colony‐stimulating factor plus interleukin 4 and downregulated by tumor necrosis factor alpha. J Exp Med 1994; 179:1109–8. [DOI] [PMC free article] [PubMed] [Google Scholar]
- 10. Sallusto F, Geginat J, Lanzavecchia A. Central memory and effector memory T cell subsets: function, generation, and maintenance. Annu Rev Immunol 2004; 22:745–63. [DOI] [PubMed] [Google Scholar]
- 11. Jordan MS, Boesteanu A, Reed AJ et al Thymic selection of CD4+CD25+ regulatory T cells induced by an agonist self‐peptide. Nat Immunol 2001; 2:301–6. [DOI] [PubMed] [Google Scholar]
- 12. Miyara M, Sakaguchi S. Natural regulatory T cells: mechanism of suppression. Trends Mol Med 2007; 13:108–16. [DOI] [PubMed] [Google Scholar]
- 13. Miyara M, Yoshioka Y, Kito A et al Functional delineation and differentiation dynamics of human CD4+ T cells expressing the FoxP3 transcription factor. Immunity 2009; 30:899–911. [DOI] [PubMed] [Google Scholar]
- 14. Han JW, Shimada K, Ma‐Krupa W et al Vessel wall‐embedded dendritic cells induce T‐cell autoreactivity and initiate vascular inflammation. Circ Res 2008; 102:546–53. [DOI] [PubMed] [Google Scholar]
- 15. Brown TJ, Crawford SE, Cornwal ML et al CD8 T lymphocytes and macrophages infiltrate coronary artery aneurysms in acute Kawasaki disease. J Infect Dis 2001; 187:940–3. [DOI] [PubMed] [Google Scholar]
- 16. Rowley AH, Wylie KM, Kim KY et al The transcriptional profile of coronary arteritis in Kawasaki disease. BMC Genom 2015; 16:1076. [DOI] [PMC free article] [PubMed] [Google Scholar]
- 17. Cameron SA, White SM, Arrollo D, Shulman ST, Rowley AH. Arterial immune protein expression demonstrates the complexity of immune responses in Kawasaki disease arteritis. Clin Exp Immunol 2017; 190:244–50. [DOI] [PMC free article] [PubMed] [Google Scholar]
- 18. Noval Rivas M, Lee Y, Wakita D et al CD8+ T cells contribute to the development of coronary arteritis in the Lactobacillus casei cell wall extract‐induced murine model of Kawasaki disease. Arthritis Rheumatol 2017; 69:410–21. [DOI] [PMC free article] [PubMed] [Google Scholar]
- 19. Franco A, Touma R, Song Y et al Specificity of regulatory T cells that modulates vascular inflammation. Autoimmunity 2014; 47:95–104. [DOI] [PubMed] [Google Scholar]
- 20. Burns JC, Touma R, Song Y et al Fine specificities of natural regulatory T cells after IVIG therapy in patients with Kawasaki disease. Autoimmunity 2015; 48:181–8. [DOI] [PMC free article] [PubMed] [Google Scholar]
- 21. Bonaccorsi I, Spinelli D, Cantoni C, Barillà C. Symptomatic carotid atherosclerotic plaques are associated with increased infiltration of natural killer (NK) cells and higher serum levels of NK activating receptor ligands. Front Immunol 2019; 10:1503. [DOI] [PMC free article] [PubMed] [Google Scholar]
- 22. Kotas ME, Locksley RM. Why innate lymphoid cells? Immunity 2018; 48:1081–90. [DOI] [PMC free article] [PubMed] [Google Scholar]
Associated Data
This section collects any data citations, data availability statements, or supplementary materials included in this article.
Supplementary Materials
Fig. S1. CD86 expression on different myeloid cell populations. The activation and maturation of different myeloid populations was determined by measuring CD86 expression on CD11c+ CD11b+ CD14‐ mDC (a), CD11c+ CD11b+ CD14+ CD4+ ILT‐4+ tmDC (b), and CD11c‐ CD11b+ CD14+ macrophages (c). Subject numbers (Table 1) are shown with the % of CD86+ cells in the specific cell populations in parentheses.
Fig. S2. Characterization of innate and adaptive immune cell repertoire in healthy pediatric controls. (a) Enumeration of CD11c+ CD11b+ CD14‐ mDC out of PBMC (left panel) and maturation stage measured by CD86 expression (right panel). (b) Enumeration of CD11c+ CD11b+ CD14+ CD4+ ILT‐4+ tmDC (left panel) and maturation stage measured by CD86 expression (right panel). (c) Enumeration of CD4+ T cells, CD8+ T cells, and CD4+ CD25high Treg in total. The data are shown as scatter plots with median and interquartile range.
Fig. S3. Plasma IL‐6 and TNFα levels in acute KD subjects. IL‐6 and TNFα from six acute KD subjects (subjects #3, 5, 6, 7, 8, and 15) were measured by multiplex ELISA. Each bar indicates the data derived from a single subject. Immunophenotyping results are shown for each patients below the cytokine levels.
Fig. S4. HLA‐DR expression on T cells. Recently activated CD4+ (a) and CD8+ (b) T cells were identified by the surface expression of HLA‐DR. The correlation between the expression levels of HLA‐DR (shown as MFI) and the percent of CD4+ and CD8+ T cells is shown (right panel).


