

Abstract
RNA conformational alteration has significant impacts on cellular processes and phenotypic variations. An emerging genetic factor of RNA conformational alteration is a new class of single nucleotide variant (SNV) named riboSNitch. RiboSNitches have been demonstrated to be involved in many genetic diseases. However, identifying riboSNitches is notably difficult as the signals of RNA structural disruption are often subtle. Here, we introduce a novel computational framework–RIboSNitch Predictor based on Robust Analysis of Pairing probabilities (Riprap). Riprap identifies structurally disrupted regions around any given SNVs based on robust analysis of local structural configurations between wild-type and mutant RNA sequences. Compared to previous approaches, Riprap shows higher accuracy when assessed on hundreds of known riboSNitches captured by various experimental RNA structure probing methods including the parallel analysis of RNA structure (PARS) and the selective 2′-hydroxyl acylation analyzed by primer extension (SHAPE). Further, Riprap detects the experimentally validated riboSNitch that regulates human catechol-O-methyltransferase haplotypes and outputs structurally disrupted regions precisely at base resolution. Riprap provides a new approach to interpreting disease-related genetic variants. In addition, we construct a database (RiboSNitchDB) that includes the annotation and visualization of all presented riboSNitches in this study as well as 24 629 predicted riboSNitches from human expression quantitative trait loci.
INTRODUCTION
RiboSNitch, an SNV located in an RNA that alters its secondary structure, has the potential to influence RNA biogenesis and regulation (1–5). RiboSNitch exists in diverse types of RNA sequences, including tRNAs (6,7), microRNAs (8–10), coding sequences (11–13), as well as 5′ and 3′ untranslated regions (UTRs) (14–18). RiboSNitch is also emerging in genome-wide association studies (GWAS) (17,19) or expression quantitative trait loci (eQTL) studies (20). To uncover the locations and roles of riboSNitches in the human genome, it is important to develop a systematic method to identify and annotate them.
While experimental approaches to identifying riboSNitches (21,22) are time-consuming, computational prediction of riboSNitches is still challenging (23). The general RNA folding algorithms, such as RNAfold (24) and RNAstructure (25), combined with a dissimilarity metric, can be applied to measure the structural difference between two RNA sequences (23). In the dissimilarity calculation, it has been reported that utilizing the base pairing probabilities (BPPs) of RNA structure ensembles rather than the binary output of paired or unpaired states from minimum free energy RNA structures can achieve better performance in riboSNitch prediction (19,23). Recently developed algorithms that intrinsically compare RNA structures between two RNA sequences improve the riboSNitch detection accuracy (23). In particular, SNPfold (17) calculates the Pearson correlation coefficient; remuRNA (26) compares the relative entropies; and RNAsnp (19) provides both Euclidian distance and Pearson's correlation measurement. In general, algorithms that consider local instead of global structural change perform better in the prediction (23). Even though algorithms designed specifically for predicting riboSNitches outperform general RNA folding algorithms, the accuracy of riboSNitch prediction is far from perfect (23). In addition, it has been reported that the design of the metric used to measure RNA structural variation is the reason of the better performance of the specialized methods (23).
We introduce a novel method for riboSNitch identification, named RIboSNitch Predictor based on Robust Analysis of Pairing probabilities (Riprap), which performs differential analysis of local structural configurations between wild-type (WT) and mutant RNA sequences. To demonstrate its advantage, we systematically compare Riprap with other existing methods on established experimental benchmarks from various types of RNA structure probing assays including parallel analysis of RNA structure (PARS) (22) and SHAPE (21). We also apply Riprap to a specific dataset of SNVs that regulate human catechol-O-methyltransferase (COMT) haplotypes and verified that Riprap can detect pathogenic riboSNitches. In addition, we present RiboSNitchDB, a comprehensive database for annotation and visualization of riboSNitches in human. Two groups of riboSNitches with different confidence levels are deposited in RiboSNitchDB that includes hundreds of PARS validated riboSNitches in human, and tens of thousands of predicted riboSNitches by applying Riprap to the human eQTLs. We further annotate the riboSNitches by checking whether they co-localize with RNA binding protein (RBP) binding sites, miRNA targeting sites, and N6-methyladenosine (m6A) modification sites, as well as whether they are associated with diseases in ClinVar database (27).
MATERIALS AND METHODS
Overview of the Riprap framework
Riprap contains three steps for riboSNitch identification (Figure 1): first, we employ general RNA folding algorithms to generate BPPs representing RNA conformation profiles of a given pair of WT and mutant RNAs that differ by an SNV. The RNA folding algorithms we use include RNAfold (24), RNAstructure (25) and UNAFold (28). Riprap provides the option for users to select one of the three aforementioned folding algorithms in calculating the BPPs. Second, we perform differential analyses of the BPPs between the WT and mutant RNAs for all possible local regions around the SNV. The local regions we consider are from a window of three bases to the full sequence length, where the minimum size of the window is adjustable. Third, we derive structural disruption scores (named as Riprap scores) based on the differential analyses, and report the largest score and the corresponding local region. The detailed workflow is described in the following subsections. The Riprap software is implemented in Python (2.7) and is freely available at http://people.umass.edu/ouyanglab/riprap and http://github.com/ouyang-lab/Riprap.
Figure 1.
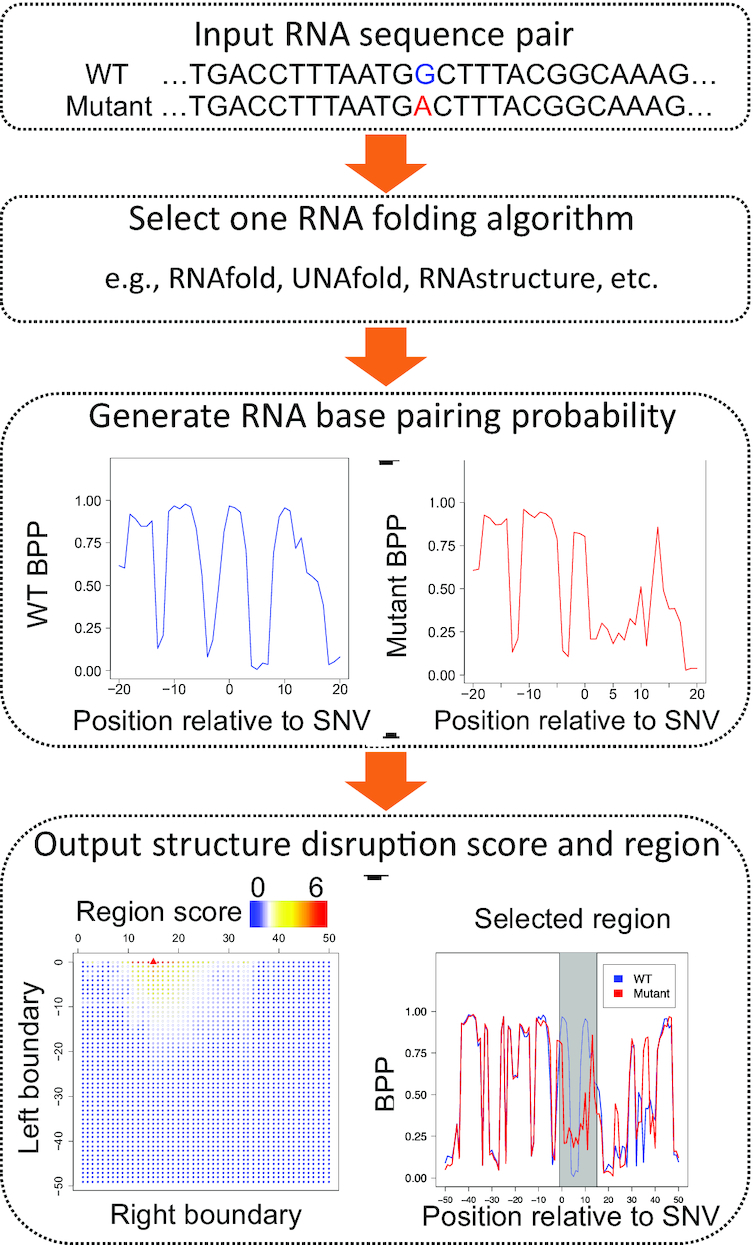
Flowchart of the Riprap program for a pair of WT and mutant sequences differing by an SNV. The heatmap indicates the Riprap score of structural disruption in all possible regions that contain the SNV. The structurally disrupted region selected by Riprap is highlighted in gray.
Calculation of base pairing probabilities
We calculate the BPPs for individual bases in both the WT and mutant RNAs from the BPP matrices (BPPMs) produced by general RNA folding algorithms, e.g. RNAfold (24), RNAstructure (25) and UNAFold (28). For a specific base i in an RNA sequence, its BPP is given by:
 |
(1) |
where  denotes the probability that the ith base is paired with the jth base (the value on the ith row and the jth column in the BPPM), and n is the length of the sequence. We generate the vectors of BPPs for both the WT and mutant RNAs, respectively.
The magnitude and statistical significance of structural disruption of a local region
In Riprap, we propose a robust measurement for characterizing structural disruption of a local region. Without loss of generality, the coordinate of the SNV site is assumed to be 0. For a given region  (
( ) that covers the SNV, we assess the structural disruption by comparing the BPPs of the WT and mutant RNAs. Specifically, we employ the following steps. First, we calculate the magnitude of structural disruption defined as the fold change of the median BPPs of the WT and mutant RNAs in the local region:
 |
(2) |
where  is the median
  within the local region [a, b]. The median BPP provides a robust measurement of the structural accessibility of a local region, Thus,
  measures the magnitude of structural disruption in terms of the change in structural accessibility in the local region [a,b]. Second, we define the statistical significance
  of structural disruption as the P-value of the Kolmogorov–Smirnov test of the BPPs defined in Equation (1) of the WT and mutant RNAs in the local region [a, b]. The Kolmogorov–Smirnov test is a robust approach to assessing whether two samples come from the same population without assuming the distributions of the datasets. Third, we develop a summarizing score by combining the magnitude and the statistical significance of the structural disruption of the local region:
 |
(3) |
Corley et al. (23) stated that designing the metric used to measure structure differences is the key to riboSNitch prediction algorithms. So we aim to construct an effective score to measure the difference. The combination of the magnitude and significance of the measured difference has been demonstrated to be robust in selecting differentially expressed genes by the work of Xiao et al. (29). So, we borrow the idea from Xiao et al. to construct the score shown in Equation (3). The above structural disruption score can be measured for any local region.
Selection of the focal region of structural disruption induced by an SNV
For a specific SNV, the Riprap algorithm is designed to report a region with the maximum structural disruption score (or Riprap score) over all possible local regions covering the SNV:
 |
(4) |
Specifically, we first search the WT and mutant RNAs with scanning windows of varying lengths (ranging from three bases to the full length of the sequence) covering the SNV, where the minimal scanning window size is adjustable. Then, we identify the RNA region with the maximal structural disruption score at the single nucleotide resolution. The Riprap algorithm does not need training datasets or contain tuning parameters.
Receiver operating characteristic (ROC) analysis
The ROC analysis is performed with the R package pROC version 1.16.1 (30). We followed the work by Corley et al. (23) to define the ROC curve's ‘best’ point as the point closest to the top left corner of the graph. Based on the threshold yielding the best point, we report the accuracy, specificity, and sensitivity values in Supplementary Table S1.
Datasets collection
We evaluate the prediction performance of Riprap and other existing algorithms using both benchmarks from the PARS (22) and the SHAPE (31) studies. The PARS study includes a dataset of non-redundant riboSNitches and non-riboSNitches compiled by Corley et al. (23) in a family trio of human lymphoblastoid cell lines (22). The PARS dataset contains rigorously validated subsets of 11 ‘probed’, 63 ‘validated’ and 223 ‘symmetric’ riboSNitches. The ‘probed’ subset contains the most rigorously validated riboSNitches that were confirmed using chemical probing, an orthogonal RNA structure mapping method. The ‘validated’ subset includes those validated by allele-specific mapping of the family trio. The ‘symmetric’ subset represents those congruously detected as riboSNitches in each of the pairwise comparisons between the father, the mother and the child in the family trio. The dataset also contains 835 ‘asymmetric’ riboSNitches that are differently indicated as riboSNitches in each of the pairwise comparison between the father, the mother and the child. We don’t use ‘asymmetric’ riboSNitches in our study because of this contradictory result. The equal numbers of top ranked non-riboSNitches are used as the negative control sets. For each of the SNVs studied, we extract the sequence of 50 bases upstream and downstream of the SNV site as the input sequence. No extracted sequences contain multiple SNVs. We used the hg19 assembly as the annotation in our analysis.
The SHAPE dataset is composed of SNVs in five RNAs (the human ferritin light chain (FTL), the Vibrio vulnificus adenine riboswitch, the Vibrio cholera glycine riboswitch, the cyclic dimeric guanosine monophosphate riboswitch and the P4P6 domain of the Tetrahymena thermopile group I intron) compiled by Ritz et al. (21). In total, the dataset includes 462 sequences, each of which contains a single-point mutation. In particular, two sequences contain two SNVs (nucleotide U to G at position 22 and nucleotide A to U at position 56) that are within the 5′ UTR of the FTL mRNA are associated with the hyperferritinemia cataract syndrome (17,32–33). It was proposed that the two SNVs disrupt the structure of the iron response element and then affect the binding of the iron response protein, which causes the abnormal regulation of FTL (34,35).
We collect the COMT dataset from the study of Nackley et al. (12). The major human COMT haplotypes are formed by four SNVs: rs6269, rs4633, rs4818 and rs4680. rs6269 does not contribute to pain phenotype, so we remove it from the dataset. COMT gene has four transcript isoforms, among which one transcript encodes soluble COMT (S-COMT) protein and the other three encode membrane-bound COMT (MB-COMT) protein. We use the longest transcript, NM_000754 in hg19 Refseq annotation downloaded from the UCSC Table Browser (36), among the three MB-COMT transcripts in our analysis.
The experimental disruption score and the predicted disruption score
The structural disruption coefficient (SDC) was proposed to measure the global structural disruption of an SNV on the entire RNA sequence (21). The experimental SDC (eSDC), calculated from the SHAPE probing reactivities of the entire RNA sequence, has been used to evaluate the ability of existing RNA folding algorithms for detecting riboSNitches. It is shown that the predicted SDC (pSDC), based on in silico BPPs of the entire RNA sequence, has insufficient accuracy of predicting eSDCs (21).
Here, we define the experimental score (eRiprap) as the structural disruption score of Riprap applied to SHAPE probing reactivities, and the predicted score (pRiprap) as the structural disruption score of Riprap applied to in silico BPPs. We calculate the pRiprap and pSDC scores using the same predicted BPPs from the RNA folding algorithm RNAfold in the ViennaRNA Package 2.0 (37). Similarly, we use the same SHAPE reactivity dataset as described above to calculate the eRiprap and eSDC scores.
To modify SDC for measuring the structure disruption locally, we calculated the local eSDC and the local pSDC as the largest eSDC and pSDC value among those of all the subsequences of the input sequence, respectively.
RiboSNitch database
We design a database for riboSNitch annotation and visualization, called RiboSNitchDB, which can be accessed via http://people.umass.edu/ouyanglab/ribosnitchdb/. RiboSNitchDB includes not only all the experimentally validated riboSNitches presented in this study, but also the in silico predicted riboSNitches in human eQTL datasets. We collect the annotation of the deposited riboSNitches based on the following databases: RBP binding sites downloaded from POSTAR2 (38) (http://lulab.life.tsinghua.edu.cn/postar/), miRNA targeting sites downloaded from UCSC Table Browser (https://genome.ucsc.edu/cgi-bin/hgTables), N6-methyladenosine (m6A) modification sites downloaded from m6AVar (39) (http://m6avar.renlab.org/), and clinical significance downloaded from ClinVar (27) (https://www.ncbi.nlm.nih.gov/clinvar/).
To detect riboSNitches in eQTLs, we download the eQTL datasets from the Genotype-Tissue Expression (GTEx) database (40) (https://www.gtexportal.org/home/) and the hg19 Refseq annotation from the UCSC Table Browser (https://genome.ucsc.edu/cgi-bin/hgTables). After excluding SNVs with multiple substitutions, we filter out the eQTLs in intronic and intergenic regions and keep those eQTLs that are located in mRNAs, which result in 44 170 eQTLs in total. We download the genomic region annotation of the SNVs from the dbSNP database (41) (https://www.ncbi.nlm.nih.gov/projects/SNP/).
RESULTS
Riprap improves the accuracy and resolution of riboSNitch detection
We evaluated the performance of Riprap on three benchmark datasets collected from the PARS study (22) (see the ‘Datasets collection’ subsection in the ‘Materials and Methods’ section for detailed description): ‘probed’, ‘validated’ and ‘symmetric’ riboSNitches. Each of the datasets contains a ‘non-riboSNitch’ set of matched size (23). We chose RNAfold (version 2.1.6 in the ViennaRNA Package 2.0) (37), which is the default folding algorithm in Riprap, to generate the input BPPMs of the WT and mutant mRNA sequences in these datasets. We compared Riprap with five other existing methods for riboSNitch identification. The first method we considered is based on the simple Euclidean distance of the BPPMs, denoted by ‘Simple’. The second method we considered is RNAsnp (19) (version 1.1), which is based on the largest Euclidean distance of the BPPs of all regions that are larger than 10 bases (we used -l 10). To accurately measure the structure disruption, we used the dmax output of RNAsnp (19) as the score to be compared. The third method is classSNitch (42) (version 1.0), which builds a classifier based on training data from SHAPE datasets using features that imitate the judgement of human beings on structural change. The fourth and fifth methods are remuRNA (26) and SNPfold (17) (version 1.01) tested in Corley et al. (23). We listed the commands for each method in Supplementary Table S2. We applied the proposed Riprap approach and the five existing methods to aforementioned benchmark datasets. We generated the ROC curves and calculated the area under curve (AUC) values for the six methods being compared on the three datasets (Table 1). One can see that Riprap has the highest AUC values among all the methods being compared on all the three benchmark datasets. The AUCs of Riprap differentiate the benchmark datasets with increased values in the order of ‘symmetric’, ‘validated’ and ‘probed’ riboSNitches, which are consistent with the increasing levels of rigorousness in constructing these benchmark datasets (23). To test whether the prediction performances are better than random guessing (AUC = 0.5), we employed the Mann–Whitney test for statistical significance. The AUCs of Riprap on the ‘probed’ (0.868), ‘validated’ (0.642) and ‘symmetric’ (0.585) datasets are significantly higher than 0.5 with much lower P-values compared to those of Simple, RNAsnp and classSNitch (Figure 2A–C). Since RNAsnp also outputs an empirical P-value for the distance score, we examined the performance of the P-value as well. We found that Riprap outperforms RNAsnp no matter which metric in RNAsnp was used (Table 1). If we apply the conventional P-value cutoff 0.05 to RNAsnp for the riboSNitch detection, the method fails to detect any riboSNitch in the ‘probed’ dataset (Supplementary Table S1), which suggests that it might not be a good strategy to call riboSNitches based on the P-value provided by RNAsnp. To note, classSNitch was originally designed for analyzing SHAPE data instead of the BPP profiles, so it is as expected that we have observed the lower performance in classSNitch on this dataset.
Table 1.
The AUCs of the ROC curves for the prediction of riboSNitches by different methods
| Method | Probed | Validated | Symmetric |
|---|---|---|---|
| Riprap | 0.868 | 0.642 | 0.585 |
| Simple | 0.686 | 0.596 | 0.579 |
| RNAsnp P-value | 0.777 | 0.583 | 0.568 |
| RNAsnp dmax | 0.769 | 0.593 | 0.571 |
| classSNitch** | 0.347 | 0.504 | 0.542 |
| remuRNA* | 0.736 | 0.557 | 0.543 |
| SNPfold* | 0.703 | 0.581 | 0.571 |
*The values for the methods were directly extracted from Corley et al. (23).
**The lower performance may result from the fact that classSNitch was trained on the experimental SHAPE data instead of BPP profiles.
Figure 2.

ROC analysis of Riprap, RNAsnp (dmax), Simple and classSNitch on riboSNitch benchmarks. (A–C) Shown are ROC curves for Riprap, RNAsnp, Simple and classSNitch on ‘probed’, ‘validated’ and ‘symmetric’ riboSNitches, respectively. The ROC curves for Riprap are highlighted as solid lines, those for RNAsnp are highlighted as dashed lines, those for Simple are highlighted as dotted lines and those for classSNitch are highlighted by dotdash lines. The colors of the curves represent the significance of the test; the null hypothesis of the test is that the AUC equals to 0.5. According to the color bars of P-values in the plots, the warmer the color is, the more significantly different the AUC is from 0.5.
As expected, Riprap and RNAsnp, taking advantage of the local measurement, both outperform the other methods on the most rigorously validated benchmark dataset. The better performance of Riprap compared to RNAsnp presumably results from the combination of both the magnitude and the statistical significance in the differential analysis, which is shown in Supplementary Figure S1. We then investigated why Riprap achieves better performance than RNAsnp as a local measurement by dissecting the identified regions by Riprap and RNAsnp. To call riboSNitches, we established a cutoff similar to Corley et al. (23). Specifically, we used the point closest to the top left corner on the ROC curve for the ‘probed’ dataset. If the calculated Riprap score is not less than the cutoff, we report the corresponding SNV as a riboSNitch. We compared the false negatives (FNs) and false positives (FPs) of Riprap with those of RNAsnp. Riprap has only one FN and two FPs, which were also wrongly predicted by RNAsnp. As comparison, RNAsnp has three more FNs and one more FPs than Riprap (Figure 3A). One can see that Riprap identified the three-base region around rs1050818, indicating its ability to detect the structurally disrupted regions of riboSNitches at base resolution (Figure 3B). In rs1047993 and rs1051677, although the magnitudes of the structural change are subtle, they were captured by Riprap as the significance test P-values of the regional structural change were small (3.0e-3 and 8.1e-7) (Figure 3C and D). It indicates the advantage of taking both the magnitude and statistical significance into consideration for riboSNitch detection. Furthermore, the disrupted regions called by Riprap are generally more focal than those by RNAsnp, especially on those missed by RNAsnp (Figure 3A). A focal region would be more informative than a relatively larger one in guiding the study of the consequences induced by a riboSNitch. In sum, Riprap's improvement confirms that local measurement and distance metric design are two essential factors in the riboSNitch detection.
Figure 3.

Riprap identifies the focal regions of structurally disrupted by RiboSNitches. (A) Shown are the barplot of the structural disrupted regions predicted by Riprap and RNAsnp on ‘probed’ riboSNitches. The X-axis shows the relative position of the region boundaries to the SNV sites; The Y-axis shows the ids of the 11 ‘probed’ riboSNitches. Disrupted region predicted by Riprap and RNAsnp are highlighted in red and blue, respectively. The predictions made by Riprap and RNAsnp are listed at the left side of the barplot, where a tick and a cross means prediction as a riboSNitch and a non-riboSNitch, respectively. (B) rs1050818. (C) rs1047993. (D) rs1051677. The X-axis represents the relative position to the identified riboSNitch, where negative numbers indicate the positions at the 5′ direction of the riboSNitch, and positive numbers indicate the positions at the 3′ direction. The Y-axis represents the BPPs. The blue curve is for the WT RNA, while the red curve is for the mutant RNA. The finally selected region by Riprap is highlighted in gray.
Assessing the robustness of Riprap
To further assess the advantage of combining the magnitude and the statistical significance of structural disruption, we applied the two components to the benchmark datasets individually. We found that neither of them can achieve as high AUCs as the combined Riprap score (Figure 4A). Interestingly, we found that using the Riprap's statistical significance of structural disruption alone outperforms RNAsnp in the ‘probed’ dataset.
Figure 4.

AUC of ROC barplots in Riprap with magnitude or significance only and AUC of ROC line chart of Riprap using different minimum window size. (A) Shown are the barplot of the AUC values of ROC analysis for Riprap, Riprap-FC and Riprap-p applied to ‘probed’, ‘validated’, ‘symmetric’, ‘asymmetric’ and ‘all’ datasets, respectively. The corresponding ROC curves for Riprap, Riprap-FC and Riprap-p are indicated by red, blue and green bars, respectively. (B) Shown are the line chart of the AUC values of ROC analysis for Riprap with different minimum spanning window size. The X-axis is the minimum window size and the Y-axis is the AUC value of ROC analysis. Riprap applied to ‘probed’, ‘validated’ and ‘symmetric’ are highlighted by red, blue and green, respectively. Riprap-FC, score based on the fold change of median BPPs. Riprap-p, score based on significance test.
To test the robustness of Riprap, we then examined different parameters used in Riprap. First, we tested whether it affects the performance to use different minimum window size in Riprap. The consistently good performance of Riprap with various minimum window sizes demonstrated the robustness of Riprap score (Figure 4B). In addition, we assessed the performance of Riprap when given BPPMs from different RNA folding algorithms as input. We named the Riprap algorithm applied on the BPPMs from RNAfold (version 2.1.6), UNAFold (version 3.8) and RNAstructure (version 5.4) as Riprap-RNAfold, Riprap-UNAfold and Riprap-RNAstructure, respectively. The AUC values of the ROC curves consistently increase with the rigorousness of the benchmark dataset in the order of ‘symmetric’, ‘validated’ and ‘probed’ riboSNitches for all three methods (Supplementary Figure S2a–c). Riprap-RNAfold achieved relatively better performance compared to Riprap-UNAfold and RNAstructure in the ‘probed’ riboSNitches (Supplementary Figure S2a) while gained similar performance in the other benchmark datasets (Supplementary Figure S2b and c), which resembles the patterns of performance from using these RNA folding algorithms as reported in Corley et al. (23). Thus, we make RNAfold as the default folding algorithm in the Riprap program and we recommend selecting RNAfold in the Riprap usage.
Riprap shows advantages to evaluate the structure disruption in SHAPE data
To further demonstrate the practical merit of our method, we compared Riprap with SDC on 437 SNVs with SHAPE reactivity data (31). SDC is a global approach based on whole sequence correlations between the WT and mutant structural profiles (21) (described in ‘Materials and Methods’ section), which cannot determine the boundaries of structurally disrupted regions. We calculated the eSDC score and predicted SDC score (pSDC) (21), as well as the experimental Riprap score (eRiprap) and predicted Riprap score (pRiprap) for these SNVs (described in ‘Materials and Methods’ section). The eSDC and eRiprap scores of these 437 SNVs served as the benchmarks for their pSDC and pRiprap scores, respectively. We first specified experimentally true positive and true negative sets with equal size of n based on eSDC and eRiprap scores for SDC and Riprap, respectively. We then generated ROCs using pSDC and pRiprap scores. Next, we calculated the corresponding AUCs for multiple choices of n. As shown in Figure 5A, the prediction performance of pRiprap on eRiprap increases as n decreases, suggesting the higher validity of the top riboSNitches measured by eRiprap. This pattern is expected when pRiprap is consistent with eRiprap. However, the AUCs of pSDC fluctuate when n increases, suggesting that pSDC is less consistent with eSDC (Figure 5A). In addition, pRiprap has much better prediction accuracy on eRiprap than pSDC on eSDC for the top riboSNitches (Figure 5A), which shows the advantage of measuring SNV-induced structural disruption by local metrics embedded in Riprap. As stated by Corley et al. (23), local predictors of structural changes perform in general better than global approaches. Therefore, to further investigate the performance of SDC, we constructed a local SDC metric (described in ‘Materials and Methods’ section) to measure the structure disruption. As expected, we found that the local pSDC has much worse prediction accuracy on the local eSDC (Supplementary Figure S3) compared to the global pSDC on eSDC (Figure 5A) possibly due to deviation from of its original design. These results confirm again the advantage of the Riprap score as a local structure disruption metric.
Figure 5.

Comparisons between the local metric Riprap score S and the global metric SDC and assessments on SHAPE data. (A) AUC values of ROC analysis on the top and bottom n SNVs ranked by eSDC and eS scores, respectively. The red solid curve and blue dashed curve represent the AUCs of pSDC on eSDC, and pS on eS, respectively. (B) The SHAPE reactivities and the ‘1-BPP’ signals for the WT and mutant RNAs for the SNV U22G in the human FTL 5′ UTR. The X-axis represents the position on the sequence. The WT RNA is highlighted with blue and the mutant RNA is highlighted with red. The finally selected region of structural disruption by Riprap is highlighted with a gray box. A vertical black line highlights the position of the SNV on the sequence. (C) Plots similar to (B) for the SNV A56U in the human FTL 5′ UTR. (D) Plots similar to (B) for the SNV G4A in the human FTL 5′ UTR, which shows no structure change from the mutation. No vertical black line was shown for the SNV position because the SNV is outside the boundary of this visualization. The schematic diagram of the human FTL 5′ UTR with the IRE indicated in blue is above the plots. BPP: base pairing probability.
Furthermore, we applied Riprap to two SNVs that were associated with the hyperferritinemia-cataract syndrome and were probed by SHAPE (21) (Figure 5B and C). The two SNVs are located in the 5′ UTR of the FTL gene close to the known iron response element (IRE). Strikingly, although the coordinates of both SNVs do not overlap with the IRE, the structurally disrupted regions predicted by Riprap for both SNVs covered and centered on the IRE (Figure 5B and C). As a negative control, we also applied Riprap to another SNV which was demonstrated to have no structural change effect on FTL (20). We found that this mutation is predicted as a non-riboSNitch by Riprap, which is validated by the similar profiles between the WT and mutant sequences in terms of both SHAPE reactivities and BPPs (Figure 5D). This analysis supported a proposed mechanism that mutations outside of the IRE may disrupt its structure and subsequent interaction with the IRE-binding protein (20).
Riprap identifies functional riboSNitch in human Catechol-O-Methyltransferase haplotypes
Nackley et al. reported that human COMT haplotypes, associated with pain sensitivity, regulate protein expression by altering mRNA secondary structure (12). The authors found there are two synonymous (rs4633 and rs4818), and one non-synonymous (rs4680) SNVs that contribute to pain sensitivity phenotypes by modulating the COMT enzymatic activity and protein expression. Specifically, rs4818, one of the synonymous SNVs that can alter the mRNAs’ secondary structure, results in the largest reduction among the haplotypes in both enzymatic activity and protein expression. This study encouraged us to evaluate Riprap in differentiating these well-studied SNVs. We applied Riprap to the three SNVs within two COMT mRNAs that encodes two distinct proteins: S-COMT and MB-COMT (Figure 6A, see details in ‘Materials and Methods’ section). We found that rs4818 obtained significantly higher Riprap score compared to rs4633 and rs4680, with P-value equal to 0.04 and 0.05, respectively (Figure 6B), which shows that Riprap successfully captured this experimentally-validated riboSNitch. In addition, Riprap identifies that the structural disruption region of rs4818 is from the 635th to the 699th nucleotide and from the 2nd to the 490th nucleotide in MB-COMT and S-COMT, respectively (Figure 6C and Supplementary Figure S4). Nackley et al. experimentally demonstrated that the critical region whose secondary structure contributes to the largest difference in COMT haplotypes is from the 625th to the 701st nucleotide and from the 403rd to the 479th nucleotide in MB-COMT and S-COMT, respectively (12), which significantly overlap with those reported by Riprap (hypergeometric test P-value equal to 2.1e-114 and 1.6e-50 for MB-COMT and S-COMT, respectively). These results not only validate Riprap's predictions experimentally, but also indicate that Riprap is potentially applicable to detecting pathogenic riboSNitches in the human genome.
Figure 6.

Riprap detects the riboSNitch in COMT haplotypes. (A) A schematic diagram showing COMT gene and SNV positions. (B) Barplot of the Riprap scores gained by rs4633, rs4818 and rs4680. Y-axis is the Riprap score. n = 2 (Riprap scores in MB-COMT and S-COMT) for each SNV and the error bars are indicated in the plots. *P ≤ 0.05 in one-sided Student's t-test. (C) BPP curves of rs4633, rs4818 and rs4680 in MB-COMT. The X-axis represents the nucleotide position on the mRNA. The Y-axis represents the BPPs. The blue curve is for the WT RNA, while the red curve is for the mutant RNA. The SNV position is highlighted by a red star and a black vertical line. The finally selected region by Riprap is highlighted in gray.
Database of riboSNitches with annotation and visualization
Based on our knowledge, even though certain riboSNitch prediction web server exists (19), there is no such an existing database consisting of both the experimentally validated and precisely predicted riboSNitches with annotation and visualization functions. For example, RBP-Var (43) only contains riboSNitches that are predicted by RNAsnp (19). To fill this gap, we constructed a comprehensive database, RiboSNitchDB, for the inquiry, annotation and visualization of riboSNitches (Figure 7). RiboSNitchDB includes all the examined riboSNitches in this study as well as tens-of-thousands of predicted riboSNitches by Riprap. We included the information of RBPs’ binding peaks, microRNA (miRNA) target sites, m6A RNA methylation sites, and the disease association as the annotation for each deposited riboSNitch (Supplementary Table S3). These annotations can reveal the potential consequences of the disrupted RNA structure by the riboSNitches and the disease-related annotation also makes it available to study human diseases from a RNA secondary structure perspective. For example, rs1051677 is detected as a riboSNitch in PARS, and it is associated with radiation complications and rectal cancer (44,45). We show that there are 35 distinct RBPs in 12 different cell lines that bind within upstream 100 nt to downstream 100 nt around the position of rs1051677 (Supplementary Figure S5a), which reveals the possibility that this riboSNitch affects the RBP binding via altering the structure. Users can also visualize the nucleotide sequence, BPPM and the MFE structure of both the WT and mutant sequence, as well as the structure-disrupted region (Supplementary Figure S5b–d). In addition to the riboSNitches detected experimentally, we also included the predicted riboSNitches that are associated with gene expression. To identify them, we used Riprap on 44 170 transcriptomic eQTLs from the GTEx (46) database (see ‘Materials and Methods’ section). With the aforementioned Riprap score cutoff, we identified 24 629 riboSNitches, a major (56%) subset of transcriptomic eQTLs. By including eQTLs with their Riprap scores, RiboSNitchDB provides a comprehensive resource of not only the known riboSNitches but also the riboSNitch candidates that are potential targets in the future study. RiboSNitchDB also provides the searching function via SNP id and genomic location for the users who have their interested riboSNitches to investigate. In sum, we constructed the first database that associates experimentally and computationally predicted riboSNitches with the information of gene expression regulation, RBP binding, miRNA targeting, m6A modification and clinical significance together by a large-scale application of Riprap, which will be helpful for interpreting the genetic variants from a novel perspective.
Figure 7.

RiboSNitch database construction.
DISCUSSION
We have developed Riprap, a new method for identifying RNA structural disruption induced by SNVs. Riprap maximizes a novel structural disruption score over all possible local regions around an SNV. We compared Riprap with existing computational methods on established riboSNitch benchmark datasets. We demonstrated improved performance of Riprap on identifying known riboSNitches. In addition, we showed that Riprap can detect the focal regions of structural disruption by applying Riprap to the dataset of human COMT haplotypes.
Riprap provides a novel metric by combining the magnitude and statistical significance of structural differences, which detects the consistent changes of BPPs in focal regions. We showed that measuring the consistent structural alterations of consecutive bases outperforms summarizing the differences of individual bases as did in other existing methods. Although the PARS benchmarks were constructed by comparing the PARS score in 5 nt around the SNVs (22), we found the performance of Riprap is robust at different minimum window size settings. Even though the difference of the accuracies for Riprap, Simple and RNAsnp on the ‘validated’ and ‘symmetric’ riboSNitches is not as high as that on the ‘probed’ riboSNitches, the fact that the difference follows the rigorousness of the benchmark datasets demonstrates the ability of Riprap on identifying high-confident riboSNitches. In the current version of Riprap, we implemented the score cutoff determined in the dataset that includes the most rigorously validated riboSNitches (‘probed’ dataset in PARS data) as the threshold to call a riboSNitch. The performance of Riprap with the score cutoff is similar to that with the threshold determined by the method of Corley et al. (23) in both ‘validated’ and ‘symmetric’ riboSNitches (Supplementary Table S1), which indicates the robustness of the score cutoff.
The structural disruption scores and regions outputted by Riprap are consistent for computationally and experimentally derived base pairing measurements. It suggests that Riprap may be used to leverage existing RNA folding algorithms (e.g. RNAfold, UNAFold (28), RNAstructure (25) and Sfold (47), etc.), as well as experimental measurements (e.g. SHAPE (21), PARS (22,48) and their derivatives (49,50)) to detect riboSNitches and structurally disrupted regions. In addition, reconstructed RNA structures from high-throughput experimental assays (51,52) can be incorporated into Riprap to further improve the identification of riboSNitches.
Riprap focuses on detecting the focal regions around riboSNitches that disrupt RNA structures. Some riboSNitches may cause long-range changes in RNA structure. For example, a newly discovered, clinically relevant riboSNitch in the 3′ UTR of FKBP5 was reported to alter the structure and the efficiency of microRNA binding located at ∼140 bases upstream regions (53). The current implementation of Riprap is designed to detect the focal region of structural disruption using scanning windows that include the SNV position. This design scheme will likely decrease the disruption score of a long-distance structure change by including the unchanged regions between the region and the SNV site. We will extend Riprap to accurately detect distantly located structure alteration regions related to a riboSNItch in future studies.
Riprap can be applied to analyze SNVs genome-wide. In addition, Riprap can be used to link SNVs with RNA functions, such as stability, degradation, translation or splicing. Riprap can also be incorporated into GWAS studies to provide functional annotation, interpretation, and prioritization of genetic variants associated with diseases, behaviors, and other phenotypes. Our database, RiboSNitchDB, consists of both experimentally validated and predicted riboSNitches, which is a comprehensive resource for future study in RNA secondary structure. We will keep updating our database when new public riboSNitch datasets are available and include further large-scale applications of Riprap to the SNVs in different species.
DATA AVAILABILITY
Riprap was implemented in Python (version 2.7.10). The source code of Riprap can be freely downloaded at http://people.umass.edu/ouyanglab/riprap or http://github.com/ouyang-lab/riprap. The database RiboSNitchDB can be freely accessed at http://people.umass.edu/ouyanglab/ribosnitchdb.
Supplementary Material
ACKNOWLEDGEMENTS
Z.O. thanks Elissa Chesler, Brenton Graveley and members of the Ouyang Lab for discussions. The authors thank the anonymous reviewers for their useful suggestions which improve the manuscript.
Contributor Information
Jianan Lin, Department of Biostatistics and Epidemiology, School of Public Health and Health Sciences, University of Massachusetts, Amherst, MA 01003, USA; The Jackson Laboratory for Genomic Medicine, Farmington, CT 06032, USA; Department of Biomedical Engineering, University of Connecticut, Storrs, CT 06269, USA.
Yang Chen, Department of Biostatistics and Epidemiology, School of Public Health and Health Sciences, University of Massachusetts, Amherst, MA 01003, USA.
Yuping Zhang, Department of Statistics, University of Connecticut, Storrs, CT 06269, USA; Institute for Systems Genomics, University of Connecticut, Farmington, CT 06030, USA; Center for Quantitative Medicine, University of Connecticut, Farmington, CT 06030, USA.
Zhengqing Ouyang, Department of Biostatistics and Epidemiology, School of Public Health and Health Sciences, University of Massachusetts, Amherst, MA 01003, USA.
SUPPLEMENTARY DATA
Supplementary Data are available at NARGAB Online.
FUNDING
NIGMS [R35GM124998 to Z.O.]; University of Connecticut, Faculty Research Excellence Program Award (to Y.Z.).
Conflict of interest statement. None declared.
REFERENCES
- 1. Buratti E., Baralle F.E.. Influence of RNA secondary structure on the pre-mRNA splicing process. Mol. Cell. Biol. 2004; 24:10505–10514. [DOI] [PMC free article] [PubMed] [Google Scholar]
- 2. Churkin A., Barash D.. RNAmute: RNA secondary structure mutation analysis tool. BMC Bioinformatics. 2006; 7:221. [DOI] [PMC free article] [PubMed] [Google Scholar]
- 3. de Smit M.H., van Duin J.. Secondary structure of the ribosome binding site determines translational efficiency: a quantitative analysis. Proc. Natl. Acad. Sci. U.S.A. 1990; 87:7668–7672. [DOI] [PMC free article] [PubMed] [Google Scholar]
- 4. Duan J., Wainwright M.S., Comeron J.M., Saitou N., Sanders A.R., Gelernter J., Gejman P.V.. Synonymous mutations in the human dopamine receptor D2 (DRD2) affect mRNA stability and synthesis of the receptor. Hum. Mol. Genet. 2003; 12:205–216. [DOI] [PubMed] [Google Scholar]
- 5. Tellam J., Smith C., Rist M., Webb N., Cooper L., Vuocolo T., Connolly G., Tscharke D.C., Devoy M.P., Khanna R.. Regulation of protein translation through mRNA structure influences MHC class I loading and T cell recognition. Proc. Natl. Acad. Sci. U.S.A. 2008; 105:9319–9324. [DOI] [PMC free article] [PubMed] [Google Scholar]
- 6. Wittenhagen L.M., Kelley S.O.. Impact of disease-related mitochondrial mutations on tRNA structure and function. Trends Biochem. Sci. 2003; 28:605–611. [DOI] [PubMed] [Google Scholar]
- 7. Yarham J.W., Elson J.L., Blakely E.L., McFarland R., Taylor R.W.. Mitochondrial tRNA mutations and disease. Wiley Interdiscip. Rev. RNA. 2010; 1:304–324. [DOI] [PubMed] [Google Scholar]
- 8. Hariharan M., Scaria V., Brahmachari S.K.. dbSMR: a novel resource of genome-wide SNPs affecting microRNA mediated regulation. BMC Bioinformatics. 2009; 10:108. [DOI] [PMC free article] [PubMed] [Google Scholar]
- 9. Thomas L.F., Saito T., Saetrom P.. Inferring causative variants in microRNA target sites. Nucleic Acids Res. 2011; 39:e109. [DOI] [PMC free article] [PubMed] [Google Scholar]
- 10. Gong J., Tong Y., Zhang H.M., Wang K., Hu T., Shan G., Sun J., Guo A.Y.. Genome-wide identification of SNPs in microRNA genes and the SNP effects on microRNA target binding and biogenesis. Hum. Mutat. 2012; 33:254–263. [DOI] [PubMed] [Google Scholar]
- 11. Bartoszewski R.A., Jablonsky M., Bartoszewska S., Stevenson L., Dai Q., Kappes J., Collawn J.F., Bebok Z.. A synonymous single nucleotide polymorphism in DeltaF508 CFTR alters the secondary structure of the mRNA and the expression of the mutant protein. J. Biol. Chem. 2010; 285:28741–28748. [DOI] [PMC free article] [PubMed] [Google Scholar]
- 12. Nackley A.G., Shabalina S.A., Tchivileva I.E., Satterfield K., Korchynskyi O., Makarov S.S., Maixner W., Diatchenko L.. Human catechol-O-methyltransferase haplotypes modulate protein expression by altering mRNA secondary structure. Science. 2006; 314:1930–1933. [DOI] [PubMed] [Google Scholar]
- 13. Shen L.X., Basilion J.P., Stanton V.P. Jr. Single-nucleotide polymorphisms can cause different structural folds of mRNA. Proc. Natl. Acad. Sci. U.S.A. 1999; 96:7871–7876. [DOI] [PMC free article] [PubMed] [Google Scholar]
- 14. Chatterjee S., Pal J.K.. Role of 5′- and 3′-untranslated regions of mRNAs in human diseases. Biol. Cell. 2009; 101:251–262. [DOI] [PubMed] [Google Scholar]
- 15. Meplan C., Crosley L.K., Nicol F., Horgan G.W., Mathers J.C., Arthur J.R., Hesketh J.E.. Functional effects of a common single-nucleotide polymorphism (GPX4c718t) in the glutathione peroxidase 4 gene: interaction with sex. Am. J. Clin. Nutr. 2008; 87:1019–1027. [DOI] [PubMed] [Google Scholar]
- 16. Naslavsky M.S., Crovella S., Lima Filho J.L., Rocha C.R.. The sound of silence: human beta-defensin-1 gene untranslated SNPs change the predicted mRNA secondary structure in a length-dependent manner. Immunol. Lett. 2010; 129:53–55. [DOI] [PubMed] [Google Scholar]
- 17. Halvorsen M., Martin J.S., Broadaway S., Laederach A.. Disease-associated mutations that alter the RNA structural ensemble. PLos Genet. 2010; 6:e1001074. [DOI] [PMC free article] [PubMed] [Google Scholar]
- 18. Martin J.S., Halvorsen M., Davis-Neulander L., Ritz J., Gopinath C., Beauregard A., Laederach A.. Structural effects of linkage disequilibrium on the transcriptome. RNA. 2012; 18:77–87. [DOI] [PMC free article] [PubMed] [Google Scholar]
- 19. Sabarinathan R., Tafer H., Seemann S.E., Hofacker I.L., Stadler P.F., Gorodkin J.. RNAsnp: efficient detection of local RNA secondary structure changes induced by SNPs. Hum. Mutat. 2013; 34:546–556. [DOI] [PMC free article] [PubMed] [Google Scholar]
- 20. Solem A.C., Halvorsen M., Ramos S.B., Laederach A.. The potential of the riboSNitch in personalized medicine. Wiley Interdiscip. Rev. RNA. 2015; 6:517–532. [DOI] [PMC free article] [PubMed] [Google Scholar]
- 21. Ritz J., Martin J.S., Laederach A.. Evaluating our ability to predict the structural disruption of RNA by SNPs. BMC Genomics. 2012; 13:S6. [DOI] [PMC free article] [PubMed] [Google Scholar]
- 22. Wan Y., Qu K., Zhang Q.C., Flynn R.A., Manor O., Ouyang Z., Zhang J., Spitale R.C., Snyder M.P., Segal E. et al.. Landscape and variation of RNA secondary structure across the human transcriptome. Nature. 2014; 505:706–709. [DOI] [PMC free article] [PubMed] [Google Scholar]
- 23. Corley M., Solem A., Qu K., Chang H.Y., Laederach A.. Detecting riboSNitches with RNA folding algorithms: a genome-wide benchmark. Nucleic Acids Res. 2015; 43:1859–1868. [DOI] [PMC free article] [PubMed] [Google Scholar]
- 24. McCaskill J.S. The equilibrium partition function and base pair binding probabilities for RNA secondary structure. Biopolymers. 1990; 29:1105–1119. [DOI] [PubMed] [Google Scholar]
- 25. Reuter J.S., Mathews D.H.. RNAstructure: software for RNA secondary structure prediction and analysis. BMC Bioinformatics. 2010; 11:129. [DOI] [PMC free article] [PubMed] [Google Scholar]
- 26. Salari R., Kimchi-Sarfaty C., Gottesman M.M., Przytycka T.M.. Sensitive measurement of single-nucleotide polymorphism-induced changes of RNA conformation: application to disease studies. Nucleic Acids Res. 2013; 41:44–53. [DOI] [PMC free article] [PubMed] [Google Scholar]
- 27. Landrum M.J., Lee J.M., Riley G.R., Jang W., Rubinstein W.S., Church D.M., Maglott D.R.. ClinVar: public archive of relationships among sequence variation and human phenotype. Nucleic Acids Res. 2014; 42:D980–D985. [DOI] [PMC free article] [PubMed] [Google Scholar]
- 28. Markham N.R., Zuker M.. UNAFold: software for nucleic acid folding and hybridization. Methods Mol. Biol. 2008; 453:3–31. [DOI] [PubMed] [Google Scholar]
- 29. Xiao Y., Hsiao T.H., Suresh U., Chen H.I., Wu X., Wolf S.E., Chen Y.. A novel significance score for gene selection and ranking. Bioinformatics. 2014; 30:801–807. [DOI] [PMC free article] [PubMed] [Google Scholar]
- 30. Robin X., Turck N., Hainard A., Tiberti N., Lisacek F., Sanchez J.C., Muller M.. pROC: an open-source package for R and S+ to analyze and compare ROC curves. BMC Bioinformatics. 2011; 12:77. [DOI] [PMC free article] [PubMed] [Google Scholar]
- 31. Wilkinson K.A., Merino E.J., Weeks K.M.. RNA SHAPE chemistry reveals nonhierarchical interactions dominate equilibrium structural transitions in tRNA(Asp) transcripts. J. Am. Chem. Soc. 2005; 127:4659–4667. [DOI] [PubMed] [Google Scholar]
- 32. Ferrari F., Foglieni B., Arosio P., Camaschella C., Daraio F., Levi S., Garcia Erce J.A., Beaumont C., Cazzola M., Ferrari M. et al.. Microelectronic DNA chip for hereditary hyperferritinemia cataract syndrome, a model for large-scale analysis of disorders of iron metabolism. Hum. Mutat. 2006; 27:201–208. [DOI] [PubMed] [Google Scholar]
- 33. Cremonesi L., Paroni R., Foglieni B., Galbiati S., Fermo I., Soriani N., Belloli S., Ruggeri G., Biasiotto G., Cazzola M. et al.. Scanning mutations of the 5′UTR regulatory sequence of L-ferritin by denaturing high-performance liquid chromatography: identification of new mutations. Br. J. Haematol. 2003; 121:173–179. [DOI] [PubMed] [Google Scholar]
- 34. Sanchez M., Galy B., Dandekar T., Bengert P., Vainshtein Y., Stolte J., Muckenthaler M.U., Hentze M.W.. Iron regulation and the cell cycle: identification of an iron-responsive element in the 3′-untranslated region of human cell division cycle 14A mRNA by a refined microarray-based screening strategy. J. Biol. Chem. 2006; 281:22865–22874. [DOI] [PubMed] [Google Scholar]
- 35. Burdon K.P., Sharma S., Chen C.S., Dimasi D.P., Mackey D.A., Craig J.E.. A novel deletion in the FTL gene causes hereditary hyperferritinemia cataract syndrome (HHCS) by alteration of the transcription start site. Hum. Mutat. 2007; 28:742. [DOI] [PubMed] [Google Scholar]
- 36. Karolchik D., Hinrichs A.S., Furey T.S., Roskin K.M., Sugnet C.W., Haussler D., Kent W.J.. The UCSC Table Browser data retrieval tool. Nucleic Acids Res. 2004; 32:D493–D496. [DOI] [PMC free article] [PubMed] [Google Scholar]
- 37. Lorenz R., Bernhart S.H., Honer Zu Siederdissen C., Tafer H., Flamm C., Stadler P.F., Hofacker I.L.. ViennaRNA Package 2.0. Algorithms Mol. Biol. 2011; 6:26. [DOI] [PMC free article] [PubMed] [Google Scholar]
- 38. Zhu Y., Xu G., Yang Y.T., Xu Z., Chen X., Shi B., Xie D., Lu Z.J., Wang P.. POSTAR2: deciphering the post-transcriptional regulatory logics. Nucleic Acids Res. 2019; 47:D203–D211. [DOI] [PMC free article] [PubMed] [Google Scholar]
- 39. Zheng Y., Nie P., Peng D., He Z., Liu M., Xie Y., Miao Y., Zuo Z., Ren J.. m6AVar: a database of functional variants involved in m6A modification. Nucleic Acids Res. 2018; 46:D139–D145. [DOI] [PMC free article] [PubMed] [Google Scholar]
- 40. Consortium G.T. The genotype-tissue expression (GTEx) project. Nat. Genet. 2013; 45:580–585. [DOI] [PMC free article] [PubMed] [Google Scholar]
- 41. Sherry S.T., Ward M.H., Kholodov M., Baker J., Phan L., Smigielski E.M., Sirotkin K.. dbSNP: the NCBI database of genetic variation. Nucleic Acids Res. 2001; 29:308–311. [DOI] [PMC free article] [PubMed] [Google Scholar]
- 42. Woods C.T., Laederach A.. Classification of RNA structure change by ‘gazing’ at experimental data. Bioinformatics. 2017; 33:1647–1655. [DOI] [PMC free article] [PubMed] [Google Scholar]
- 43. Mao F., Xiao L., Li X., Liang J., Teng H., Cai W., Sun Z.S.. RBP-Var: a database of functional variants involved in regulation mediated by RNA-binding proteins. Nucleic Acids Res. 2016; 44:D154–D163. [DOI] [PMC free article] [PubMed] [Google Scholar]
- 44. Wu H.C., Delgado-Cruzata L., Machella N., Wang Q., Santella R.M., Terry M.B.. DNA double-strand break repair genotype and phenotype and breast cancer risk within sisters from the New York site of the Breast Cancer Family Registry (BCFR). Cancer Causes Control. 2013; 24:2157–2168. [DOI] [PMC free article] [PubMed] [Google Scholar]
- 45. Naccarati A., Rosa F., Vymetalkova V., Barone E., Jiraskova K., Di Gaetano C., Novotny J., Levy M., Vodickova L., Gemignani F. et al.. Double-strand break repair and colorectal cancer: gene variants within 3′ UTRs and microRNAs binding as modulators of cancer risk and clinical outcome. Oncotarget. 2016; 7:23156–23169. [DOI] [PMC free article] [PubMed] [Google Scholar]
- 46. Aguet F., Brown A., Castel S. GTEx Consortium, Laboratory Data Analysis & Coordinating Center (LDACC)–Analysis Working Group, Statistical Methods groups–Analysis Working Group, Enhancing GTEx (eGTEx) groups, NIH Common Fund, NIH/NCI, NIH/NHGRI et al.. Genetic effects on gene expression across human tissues. Nature. 2017; 550:204–213. [DOI] [PMC free article] [PubMed] [Google Scholar]
- 47. Ding Y., Chan C.Y., Lawrence C.E.. RNA secondary structure prediction by centroids in a Boltzmann weighted ensemble. RNA. 2005; 11:1157–1166. [DOI] [PMC free article] [PubMed] [Google Scholar]
- 48. Kertesz M., Wan Y., Mazor E., Rinn J.L., Nutter R.C., Chang H.Y., Segal E.. Genome-wide measurement of RNA secondary structure in yeast. Nature. 2010; 467:103–107. [DOI] [PMC free article] [PubMed] [Google Scholar]
- 49. Wan Y., Qu K., Ouyang Z., Kertesz M., Li J., Tibshirani R., Makino D.L., Nutter R.C., Segal E., Chang H.Y.. Genome-wide measurement of RNA folding energies. Mol. Cell. 2012; 48:169–181. [DOI] [PMC free article] [PubMed] [Google Scholar]
- 50. Wan Y., Qu K., Ouyang Z., Chang H.Y.. Genome-wide mapping of RNA structure using nuclease digestion and high-throughput sequencing. Nat. Protoc. 2013; 8:849–869. [DOI] [PubMed] [Google Scholar]
- 51. Zou C., Ouyang Z.. Joint modeling of RNase footprint sequencing profiles for genome-wide inference of RNA structure. Nucleic Acids Res. 2015; 43:9187–9197. [DOI] [PMC free article] [PubMed] [Google Scholar]
- 52. Ouyang Z., Snyder M.P., Chang H.Y.. SeqFold: genome-scale reconstruction of RNA secondary structure integrating high-throughput sequencing data. Genome Res. 2013; 23:377–387. [DOI] [PMC free article] [PubMed] [Google Scholar]
- 53. Linnstaedt S.D., Riker K.D., Rueckeis C.A., Kutchko K.M., Lackey L., McCarthy K.R., Tsai Y.H., Parker J.S., Kurz M.C., Hendry P.L. et al.. A functional riboSNitch in the 3′ untranslated region of FKBP5 alters MicroRNA-320a binding efficiency and mediates vulnerability to chronic Post-Traumatic pain. J. Neurosci. 2018; 38:8407–8420. [DOI] [PMC free article] [PubMed] [Google Scholar]
Associated Data
This section collects any data citations, data availability statements, or supplementary materials included in this article.
Supplementary Materials
Data Availability Statement
Riprap was implemented in Python (version 2.7.10). The source code of Riprap can be freely downloaded at http://people.umass.edu/ouyanglab/riprap or http://github.com/ouyang-lab/riprap. The database RiboSNitchDB can be freely accessed at http://people.umass.edu/ouyanglab/ribosnitchdb.