

ABSTRACT
Background
Vitamin A (VA) stores are low in early infancy and may impair development of the immune system.
Objective
This study determined if neonatal VA supplementation (VAS) affects the following: 1) development of regulatory T (Treg) cells; 2) chemokine receptor 9 (CCR9) expression, which directs mucosal targeting of immune cells; and 3) systemic endotoxin exposure as indicated by changed plasma concentrations of soluble CD14 (sCD14). Secondarily, VA status, growth, and systemic inflammation were investigated.
Methods
In total, 306 Bangladeshi infants were randomly assigned to receive 50,000 IU VA or placebo (PL) within 48 h of birth, and immune function was assessed at 6 wk, 15 wk, and 2 y. Primary outcomes included the following: 1) peripheral blood Treg cells; 2) percentage of Treg, T, and B cells expressing CCR9; and 3) plasma sCD14. Secondary outcomes included the following: 4) VA status measured using the modified relative dose-response (MRDR) test and plasma retinol; 5) infant growth; and 6) plasma C-reactive protein (CRP). Statistical analysis identified group differences and interactions with sex and birthweight.
Results
VAS increased (P = 0.004) the percentage of CCR9+ Treg cells (13.2 ± 1.37%) relative to PL (9.17 ± 1.15%) in children below the median birthweight but had the opposite effect (P = 0.04) in those with higher birthweight (VA, 9.13 ± 0.89; PL, 12.1 ± 1.31%) at 6 and 15 wk (values are combined mean ± SE). VAS decreased (P = 0.003) plasma sCD14 (1.56 ± 0.025 mg/L) relative to PL (1.67 ± 0.032 mg/L) and decreased (P = 0.034) the prevalence of VA deficiency (2.3%) relative to PL (9.2%) at 2 y.
Conclusions
Neonatal VAS enhanced mucosal targeting of Treg cells in low-birthweight infants. The decreased systemic exposure to endotoxin and improved VA status at 2 y may have been due to VA-mediated improvements in gut development resulting in improved barrier function and nutrient absorption. This trial was registered at clinicaltrials.gov as NCT01583972 and NCT02027610.
Keywords: vitamin A, B cell, T cell, Treg cell, CCR9, sCD14, CRP, MRDR test, neonate, Bangladesh
Introduction
Vitamin A (VA) was first called “the anti-infective vitamin” early in the 20th century (1, 2), but it was not until nearly the end of the century that VA supplementation (VAS) was proven to reduce mortality from common infectious diseases in infants and children from 6 mo to 5 y of age (3). Presumably VAS corrects immune function impaired by VA deficiency (VAD) (4–6), thereby reducing mortality. VAS administered to neonates has since been evaluated for an impact on mortality in infants <6 mo of age, but results have been more equivocal, with a recent meta-analysis of randomized controlled trials finding no benefit VAS overall, although reduced mortality was seen in trials conducted in communities with a higher prevalence of maternal VAD (7). Although several studies have examined the effect on neonatal VAS on mortality, relatively little work has been done on the effects of VAS on immune function in infants, particularly at this early age.
We conducted a randomized, placebo (PL)-controlled trial of a single high-dose (50,000 IU) VAS administered within 48 h of birth to identify effects on immune function (8), and we previously reported results related to thymic function (9). In the present report, we describe the effects of VAS on 3 other primary outcome measures, amounts of regulatory T (Treg) cells in peripheral blood, expression of chemokine receptor 9 (CCR9) on peripheral blood lymphocytes, and plasma concentrations of soluble CD14 (sCD14). Treg cells were chosen as a primary endpoint because retinoic acid produced by dendritic cells, particularly in mucosal sites of the immune system, promotes development of Treg cells (10–14). CCR9 was chosen because it is directly regulated by retinoic acid and is an important component of the system that allows targeting of lymphocytes to mucosal tissues (15, 16). Given this potential impact of VA on mucosal immunity, we also chose to examine sCD14 as a marker of systemic exposure to endotoxin (17) as such exposure may increase when mucosal defenses are impaired by VAD. Secondary outcomes of interest that we report are 2 measures of VA status, the modified relative dose response (MRDR) test and plasma retinol; anthropometric measures of growth including z scores for weight for age, length for age, weight for length; and plasma C-reactive protein (CRP) as a marker of systemic inflammation that could be increased by intestinal or systemic infections.
Methods
Study design
The design of this study and the description of the study population have been published (8), and the allocation of subjects to treatment and PL has been previously reported as a CONSORT diagram (9). In brief, the study was conducted at the Maternal and Child Health Teaching Institute (MCHTI) in Dhaka, Bangladesh, among women receiving prenatal care who planned to bring their infants to MCHTI for postnatal care and routine immunizations. Laboratory work was carried out at the International Centre for Diarrhoeal Disease Research, Bengladesh (icddr, b) located 8 km from MCHTI. Blood was transported from the clinic to icddr, b the same day and processed, and plasma was stored at −80°C. Infant weight and length were measured as described (8) and converted to z scores using WHO Anthro software (18). Ethical approval was received from icddr, b and the WHO. Mothers were contacted during pregnancy to facilitate recruitment of infants soon after birth. After informed consent was obtained from a parent or guardian, singleton infants eligible for newborn immunizations (noneligibility for vaccination, which would result from evidence of infection, breathing difficulty, or injury of the infant, did not occur in this study) were randomly assigned in a 1:1 ratio to receive a single 50,000-IU (52.5 μmol) dose of VA in oil or an identical amount of PL within 48 h of birth. Random assignment was balanced by sex and birthweight using 4 random assignment lists (boys and girls independently, above and below expected median birthweight) as described (8). A total of 341 women gave consent during pregnancy, consent was withdrawn by 35 women after delivery, and 306 infants were enrolled between January 15, 2012, and March 21, 2013. Infants were initially followed through 15 wk of age, with study visits occurring within 48 h of birth and at 1, 6, 10, 11, 14, and 15 wk. Mothers received VAS at 6 wk postpartum, according to the standard practice in Bangladesh at the time, as has been reported (19). Following this initial study, which lasted until the infants were 15 wk of age (NCT015839720), the additional funding was secured, and infants were again recruited and completed visits between June 14, 2014, and May 5, 2015, for a follow-up visit at ∼2 y of age (NCT02027610). During the follow-up visit, blood was drawn, weight and height were measured, a stool sample was collected, and additional demographic and health history data were collected by the same staff and investigators.
MRDR test
Heparinized venous blood was collected from infants at 6 wk, 15 wk, and 2 y of age. Visits were rescheduled for infants with fever, diarrhea, or respiratory infection in the preceding 2 d. The MRDR test was performed on a subset of randomly selected infants (n = 30/group) at 15 wk old. Infants were given an oral dose of 3,4-didehydroretinyl acetate (3.5 μmol) and mothers were encouraged to breast feed their infants afterward. A blood sample was collected 5 h later. Plasma was isolated at the icddr, b and later transported in dry ice to the University of Wisconsin–Madison for analysis (20). The plasma retinol concentration (A1) and plasma didehydroretinol concentration (A2) were quantified by reversed-phase HPLC (Waters Corp.). A2 and A1 were determined (in ng/mL) from standard curves established in the laboratory. A2/A1 ratios ≥0.060 are indicative of VAD status (21).
Plasma retinol and RBP analysis
Plasma retinol from 15 wk was measured as described above. Plasma retinol from 2 y was measured in 75 samples by reverse-phase HPLC (Shimadzu) in the Nutritional Biochemistry Laboratory, icddr, b (22). Plasma RBP was measured using a human RBP4 kit (MSD) at the USDA Western Human Nutrition Research Center (WHNRC) in all plasma samples and was used along with plasma retinol measured on a subset of infants to estimate plasma retinol for all infants at all time points, as descried (23). Briefly, a linear regression model was developed (R2 = 0.369, P < 0.001) with 15 wk plasma retinol and RBP4 to predict plasma retinol from 6-wk and 15-wk RBP data using the following equation: retinol (μmol/L) = [RBP4 (mg/L) × 0.00882 (SE = 0.00185)] + 0.381 (SE = 0.0589). The same approach was used at 2 y with the 2-y retinol and RBP4 data (R2 = 0.320, P < 0.001) using the following equation: retinol (μmol/L) = [RBP4 (mg/L) × 0.0159 (SE = 0.00271)] + 0.432 (SE = 0.0869). In a secondary analysis to adjust for the lowering effect of CRP on plasma retinol, predicted retinol was adjusted for log10(CRP) with the regression method, adjusting to CRP = 0.1 mg/L using a separate regression model for each age.
Other laboratory methods
At the icddr, b laboratories in Dhaka, peripheral blood mononuclear cells (PBMCs) were isolated form blood by using sterile Ficoll-Paque PLUS (GE Health Care) density gradient centrifugation. Isolated PBMCs were stained for CD4 (AmCyan), CD8 (V450), CCR9 (Alexa Fluor® 647), CD25 (PE-Cy™5), and CD19 (PE-Cy™7) markers. Then the cells were permeabilized and stained for FoxP3 (Alexa Fluor® 488) and analyzed by FACSAria-III (BD Biosciences). Data were analyzed by FlowJo software (FlowJo, LLC). The gating strategy is shown in Supplemental Figure 1. The following 2 assays were performed at the WHNRC laboratories, after shipment of plasma on dry ice from icddr, b. Plasma sCD14 was assayed with an ELISA kit (R&D System DuoSet ELISA for Human CD14, catalog number Dy383) according to the manufacturer's instructions. Plasma CRP was analyzed using an Integra 400 Plus Chemistry Analyzer (Roche).
Statistical analysis
Data analysis was performed using SAS for Windows 9.4 (SAS Institute Inc.) essentially as has been described previously (9). Data were examined for normality (using a Shapiro–Wilk statistic >0.96) for equal variance and to identify outliers. Transformations required for normality included the following: CRP, B cells, CD8 T cells, and Treg cells, natural logarithm; and CD4 T cells, natural logarithm + 0.3. Aside from primary endpoints, 2-group comparisons were made using a Student t-test for normally distributed variables or Wilcoxon's rank-sum test for other continuous variables. Categorical variables were compared between groups using the chi-square or Fisher's exact test.
Statistical analysis to identify treatment effects for the principal outcome variables was conducted using intention-to-treat principles. A mixed linear model approach for repeated measures and an ANCOVA approach for variables only measured once was used to assess differences between the VA and PL groups. In addition to treatment group and age category, sex and a categorical variable for birth- weight median for each sex (BWM; above or below) were included in all statistical analyses per the original study design (8). For boys, 77 infants were below the BWM (range: 2030 to 2750 g) and 76 were above (2760 to 3940 g). For girls, 77 infants were below (1780 to 2640 g) and 76 were above (2650 to 3870 g). The statistical model thus included categorical variables for treatment group, sex, BWM, and age, as well as all higher-order interactions, and included a random effect of subject specifying an unstructured covariance matrix across age categories. Key maternal and infant characteristics at baseline were evaluated to identify differences between treatment groups that should be included in the statistical model. The prevalence of delivery type (C-section compared with vaginal) differed between groups; thus, it was included as a covariate without interaction terms for treatment group but with an interaction term for age. Month of year was also included as a covariate with an interaction term for age as it was associated with anthropometric and other variables. We originally envisioned that VAS could do as follows: 1) affect all subjects similarly, 2) affect girls and boys differentially, and 3) affect those with a greater or lesser risk of VAD at baseline (below or above the BWM, respectively) differentially, overall, or at specific ages. We thus used P < 0.05 for such group comparisons and used P < 0.10 to identify significant interactions for post hoc examination (in which we also used P < 0.05 for the preplanned group comparisons). P values for these analyses are shown in Supplemental Table 1.
Results
Infant characteristics
As previously reported (9), the 306 infants recruited within 48 h of birth were balanced by sex (50% male and 50% female), and 26.8% had a birthweight <2500 g; 7.6% had a gestational age <37 wk, and 96.1% were born in the hospital, with 59.8% of births by elective C-section. Exclusive breastfeeding was common (70.3% at 6 wk), and the prevalence of moderate malnutrition (−2 z scores) was 4.47% for wasting, 17.2% for stunting, and 9.62% for underweight. At the 2-y visit, 265 infants were re-enrolled (48.3% male) with a mean age of 27.2 mo, and their characteristics at birth were very similar to those of the overall group.
Peripheral blood Treg cells
Treg cell percentages were measured at 6 and 15 wk of age and mean Treg cell percentages did not differ between the VA and PL treatment groups overall or at either age (Figure 1). Treg percentages were significantly higher at 6 wk (3.67 ± 1.73%, n = 216) than at 15 wk (3.11 ± 1.68%, n = 267; P < 0.0001) in the group overall.
FIGURE 1.
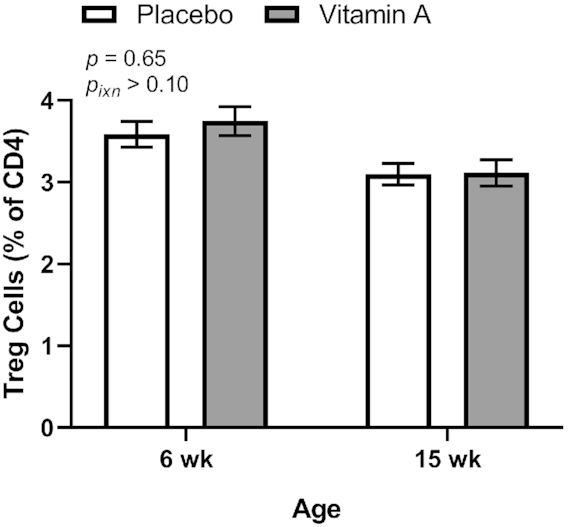
Treg cells in peripheral blood at 6 and 15 wk of age by treatment group in study infants receiving vitamin A (50,000 IU) or placebo capsules within 48 h of birth. P values indicate overall effect of treatment. Interaction P value (Pixn) is shown if P < 0.10 and indicates interaction of age with treatment group. Values are means ± SEs, n = 109 and 133 for the placebo group and n = 107 and 134 for the vitamin A group at 6 and 15 wk, respectively. Least square means derived from the regression model (see Supplemental Table 1 and Methods) are shown here (no transformation was required for normalization) and are thus adjusted for all covariates in the model. Treg, regulatory T.
CCR9 expression on peripheral blood lymphocytes
CCR9 expression was measured on the surface of peripheral blood B cells, CD8 T cells, CD4 T cells, and Treg cells (a subset of CD4 T cells) by flow cytometry at 6 and 15 wk of age. No significant differences in CCR9 expression (overall or at either age) were seen by treatment group for any of these cell types (Figure 2). However, the treatment group results showed interaction with the BWM category for Treg cells, CD4 T cells, and B cells; thus, group differences were examined in children with high (≥BWM) and low (<BWM) birthweight as our original study design presumed that VAS could have a greater effect in low-birthweight infants because their underlying VA status would likely be worse than the status in infants in the high-BWM category. In agreement with our initial hypothesis, CCR9 expression for both Treg cells and total CD4 T cells (but not B cells) was increased by the VA treatment relative to the PL treatment in low birthweight infants (Figure 3). However, for both Treg cells and B cells, VAS decreased CCR9 expression in infants in the high-birthweight category (Figure 3), an effect that was not expected. A 3-way interaction (group, BWM, and age) was seen for CD8 T cells, but no significant treatment group differences were seen in post hoc analysis (data not shown).
FIGURE 2.

Percentage of Treg cells (A), CD4 T cells (B), CD8 T cells (C), and B cells (D) positive for CCR9 expression in peripheral blood at 6 and 15 wk of age by treatment group in study infants receiving vitamin A (50,000 IU) or placebo capsules within 48 h of birth. P values indicate overall effect of treatment. Interaction P value (Pixn) is shown if P < 0.10 and indicates interaction of age with treatment group. Values are means ± SEs: For T reg cells, n = 109 and 133 for the placebo group and n = 107 and 134 for the vitamin A group at 6 and 15 wk, respectively (A). For CD4 and CD8 T cells and for B cells, n = 114 and 139 for the placebo group and n = 112 and 136 for the vitamin A group at 6 and 15 wk, respectively (B, C, D). Least-square means derived from the regression model (see Supplemental Table 1 and Methods) are shown here and are thus adjusted for all covariates in the model. Data were transformed for modeling (Treg, natural logarithm; CD4, natural logarithm + 0.3; CD8, natural logarithm; B cells, natural logarithm). Treg, regulatory T.
FIGURE 3.
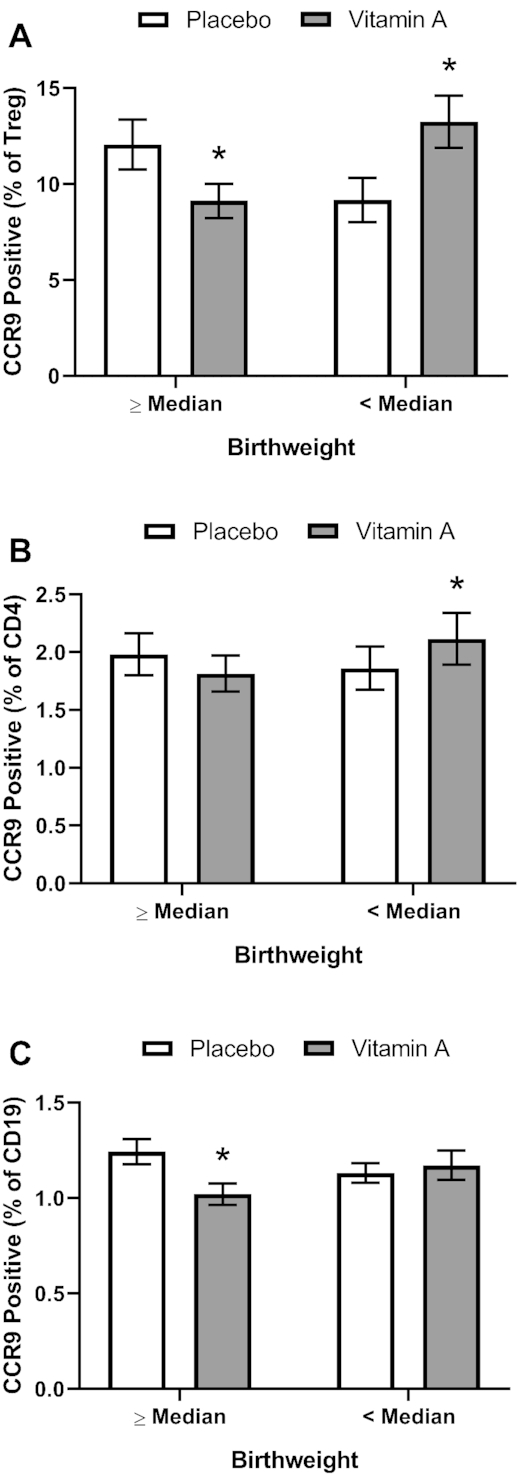
Percentage of Treg cells (A), CD4 T cells (B), and B cells positive for CCR9 expression (C) in peripheral blood by treatment group stratified by BWM category (below, <BWM; above, ≥BWM) in study infants receiving vitamin A (50,000 IU) or placebo capsules within 48 h of birth. Asterisks (*) indicate significant difference from the placebo group at P < 0.05. Significant interactions, P < 0.10, of treatment group with BWM category were seen for Treg cells (0.0005), CD4 T cells (0.021), and B cells (0.062); significant post hoc P values (<0.05) for comparing treatment group means are shown in the figure. Values are means ± SEs combining data from 6 and 15 wk for T reg cells, n = 121 and 121 for the placebo group and n = 120 and 121 for the vitamin A group above and below the BWM, respectively (A). For CD4 and CD8 T cells and for B cells, n = 129 and 124 for the placebo group and n = 115 and 125 for the above and below the BWM, respectively (B, C, D). Least square means derived from the regression model (see Supplemental Table 1 and Methods) are shown here and are thus adjusted for all covariates in the model. Data were transformed for modeling (Treg, natural logarithm; CD4, natural logarithm + 0.3; CD8, natural logarithm; B cells, natural logarithm). BWM, birthweight median; Treg, regulatory T.
Systemic endotoxin exposure
Plasma sCD14 was measured at 6 wk, 15 wk, and 2 y of age. An overall VA treatment effect (including all ages) was not seen but a significant interaction of VA treatment with age was seen and post hoc analysis showed that VA treatment decreased the sCD14 concentration relative to the PL treatment at 2 y of age (Figure 4). Plasma sCD14 increased with age, with the overall means differing significantly (P < 0.0001) from one another at all ages (6 wk, 0.984 ± 0.270 mg/L, n = 267; 15 wk, 1.24 ± 0.29 mg/L, n = 283; 2 y, 1.614 ± 0.330 mg/L, n = 258; P < 0.0001 for all).
FIGURE 4.
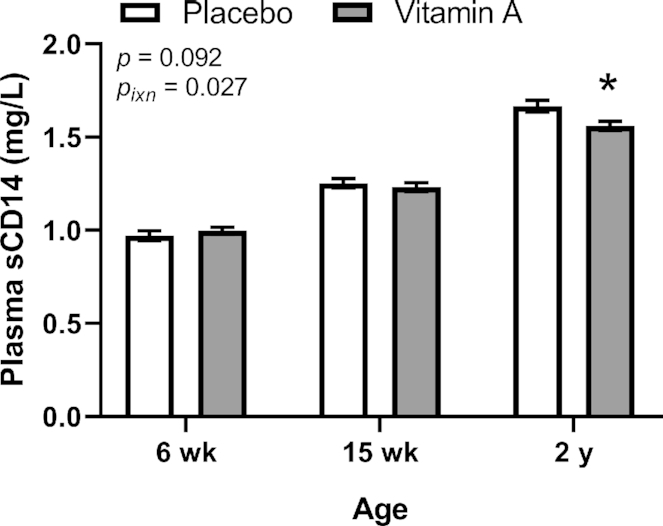
Plasma sCD14 concentration at 6 wk, 15 wk, and 2 y of age by treatment group in study infants receiving vitamin A (50,000 IU) or placebo capsules within 48 h of birth. Asterisks (*) indicate significant difference from the placebo group at P < 0.05. Interaction P value (Pixn) is shown if P < 0.10 and indicates interaction of age with treatment group; significant post hoc P values (< 0.05) for comparing treatment group means are shown in the figure. Values are means ± SEs, n = 133, 145 and 130 for the placebo group and n = 134, 138 and 128 for the vitamin A group at 6 wk, 15 wk and 2 y, respectively. Least square means derived from the regression model (see Supplemental Table 1 and Methods) are shown here (no transformation was required for normalization) and are thus adjusted for all covariates in the model.
Systemic inflammation
Plasma CRP was measured at 6 wk, 15 wk, and 2 y of age as a secondary endpoint. VA treatment did not affect plasma CRP overall or at specific ages (Figure 5). Plasma CRP increased with age, with the overall means differing significantly (P < 0.001) from one another (6 wk, 0.401 ± 0.775 mg/L, n = 267; 15 wk, 1.39 ± 3.77 mg/L, n = 283; 1.40 ± 4.78 mg/L, n = 258; P < 0.0001 for 6 wk vs. 15wk and 2 y, P = 0.49 for 15 wk vs. 2 y). The prevalence of active inflammation using a CRP cutoff of >5 mg/L did not differ between treatment groups at 6 wk (VA, 1/134, 0.75%; PL, 0/133, 0%; P = 1.00 by Fisher's exact test), 15 wk (VA, 5/138, 3.62%; PL, 10/145, 6.90%; P = 0.29), or 2 y (VA, 6/128, 4.7%; PL, 10/130, 7.7%; P = 0.44).
FIGURE 5.
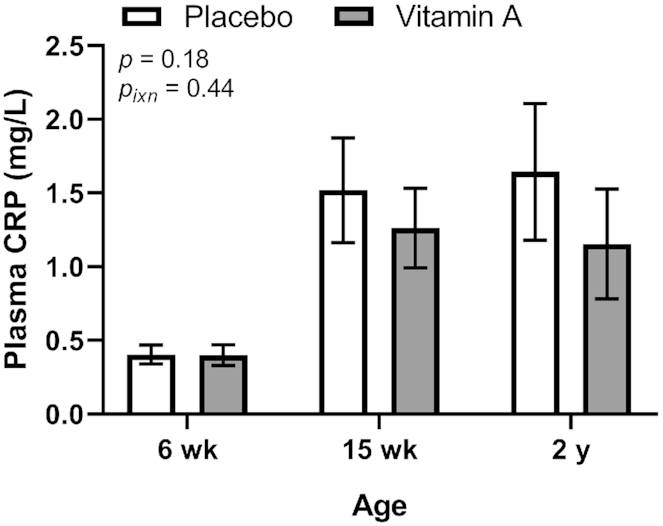
Plasma CRP concentration at 6 wk, 15 wk, and 2 y of age by treatment group in study infants receiving vitamin A (50,000 IU) or placebo capsules within 48 h of birth. P value indicate overall effect of treatment. Interaction P value (Pixn) is shown if P < 0.10 and indicates interaction of age with treatment group; significant post hoc P values (<0.05) for comparing treatment group means are shown in the figure. Values are means ± SEs, n = 133, 145 and 130 for the placebo group and n = 134, 138, and 128 for the vitamin A group at 6 wk, 15 wk, and 2 y, respectively. Least square means derived from the regression model (see Supplemental Table 1 and Methods) are shown here and are thus adjusted for all covariates in the model. A natural logarithm transformation was used for CRP data to normalize data. CRP, C-reactive protein.
Vitamin A status
The MRDR test was performed on a subset of infants at 15 wk of age as a measure of VA liver reserves. No significant effect of VA treatment was seen on the MRDR results: 9.5% (2/21) of infants in the VA group and 12.5% (3/24) in the PL group (P = 1.0, Fisher's exact test) had VAD (A2:A1: ≥0.060). Similarly, the mean A2:A1 in the VA group (0.029 ± 0.017) was not significantly different from that in the PL group (0.035 ± 0.020; P = 0.34 for comparison of log10 normalized data by Student t-test).
Plasma retinol was measured at 6 wk, 15 wk, and 2 y and was marginally higher overall (P = 0.0502) in the VA than the PL group (Figure 6). Adjusting for plasma CRP did not alter the outcome of this analysis with regard to the effect of the intervention (data not shown). Plasma retinol differed significantly (P < 0.0001) by age (6 wk, 0.620 ± 0.071 μmol/L, n = 266; 15 wk, 0.646 ± 0.080 μmol/L, n = 275; 2 y, 0.896 ± 0.135 μmol/L, n = 258; P < 0.0001 for all). The apparent prevalence of VAD using a plasma retinol cutoff of <0.70 μmol/L was very high in early infancy but did not differ between treatment groups at either 6 wk (VA, 121/133, 91.0%; PL, 118/133, 88.7%; P = 0.69 by Fisher's exact test) or 15 wk (VA, 107/134, 79.8%; PL, 117/141, 83.0%; P = 0.50). However, at 2 y the prevalence of VAD was significantly lower in the VA group (3/128, 2.3%) than in the PL group (12/130, 9.2%; P = 0.032). Similarly, when plasma retinol was adjusted for CRP, no differences were seen between the treatment groups at 6 or 15 wk of age (data not shown), but a significant difference was again seen at 2 y, with the prevalence of VAD remaining lower in the VA group (1/128, 0.78%) than in the PL group (8/130, 6.2%; P = 0.036).
FIGURE 6.
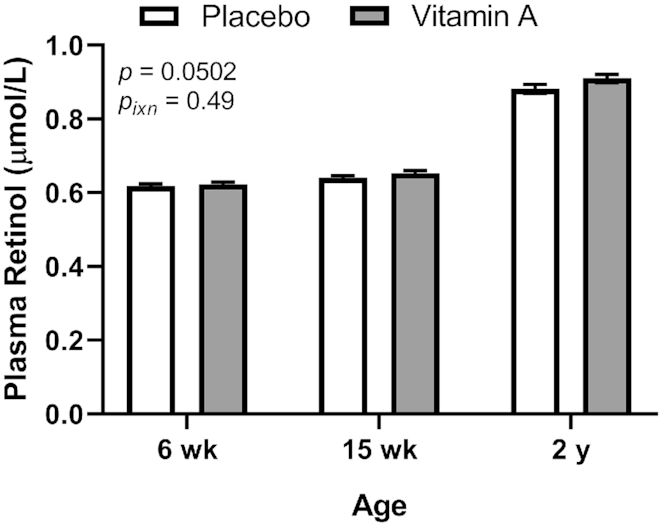
Plasma retinol concentrations at 6 wk, 15 wk, and 2 y of age by treatment group in study infants receiving vitamin A (50,000 IU) or placebo capsules within 48 h of birth. P value indicate overall effect of treatment. Interaction P value (Pixn) is shown if P < 0.10 and indicates interaction of age with treatment group. Values are means ± SEs, n = 133, 141, and 130 for the placebo group and n = 133, 134, and 128 for the vitamin A group at 6 wk, 15 wk and 2 y, respectively. Least square means derived from the regression model (see Supplemental Table 1 and Methods) are shown here (no transformation was required for normalization) and are thus adjusted for all covariates in the model.
Growth
Infant growth was monitored from birth through 15 wk of age and was again assessed at 2 y as a secondary endpoint. VAS did not affect weight-for-age, length-for-age, or weight-for-length values overall or at specific time points (Figure 7).
FIGURE 7.
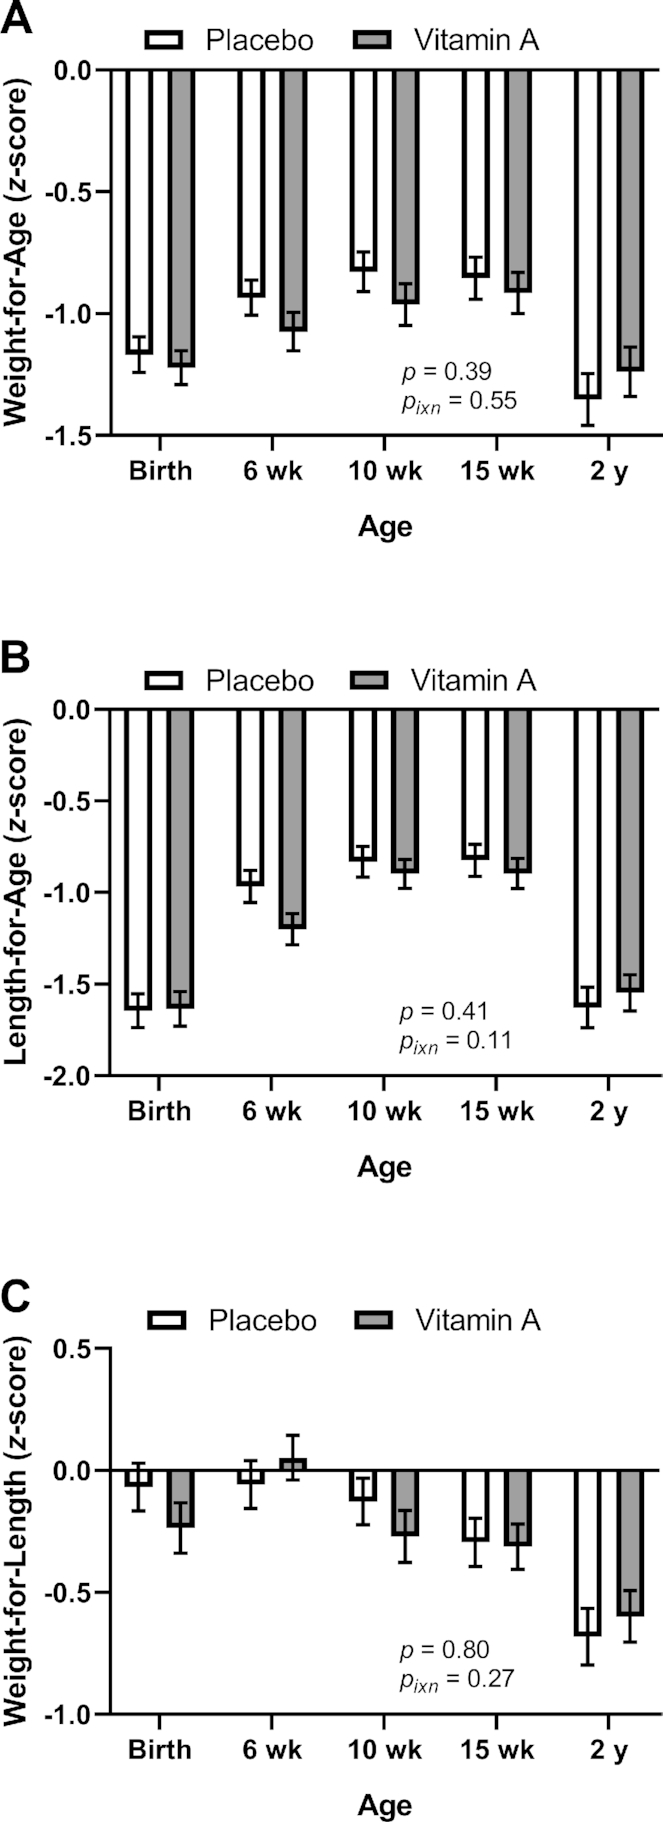
Anthropometric indicators of growth by treatment group in study infants receiving vitamin A (50,000 IU) or placebo capsules within 48 h of birth: weight-for-age (A), length-for-age (B), and weight-for-length (C) z scores. P value indicate overall effect of treatment. Interaction P value (Pixn) is shown if P < 0.10 and indicates interaction of age with treatment group. Values are means ± SEs for weight-for-age n = 153, 147, 144, 146, and 133 for the placebo group and n = 153, 144, 143, 144, and 131 for the vitamin A group at birth, 6 wk, 10 wk, 15 wk, and 2 y, respectively (A); for length-for-age, n = 153, 147, 144, 146, and 131 for the placebo group and n = 153, 144, 143, 144 and 128 for the vitamin A group at birth, 6 wk, 10 wk, 15 wk, and 2 y, respectively (B); and for weight-for-length, n = 129, 147, 144, 146, and 133 for the placebo group and n = 129, 144, 143, 144, and 131 for the vitamin A group at birth, 6 wk, 10 wk, 15 wk and 2 y, respectively (C). Least square means derived from the regression model (see Supplemental Table 1 and Methods) are shown here (no transformation was required for normalization) and are thus adjusted for all covariates in the model.
Discussion
Liver stores and plasma concentrations of VA are low during early infancy (24), a high-risk period for development of VAD (25, 26). During early infancy, the infant's immune system must respond to novel immunologic challenges, including first exposures to pathogens where protective responses are needed, as well as to commensal bacteria and food antigens, where tolerogenic responses, often involving Treg cells, are required (27). The VA metabolite retinoic acid affects many aspects of immune function (5), including the development of Treg cells in intestinal immune tissue (10–14). We thus had hypothesized that VAS during this sensitive period when infant VA stores may be low would increase percentages of Treg cells in peripheral blood. However, no effect of VAS on Treg percentages was seen. Interestingly, a similar result was seen in a study in which this phenomenon was examined in mice (28). That study found reduced oral tolerance to the protein ovalbumin in mice (fed VA-adequate diets) at 1 wk of age when plasma retinol was low (as is seen in human infants) compared to 3 wk of age when plasma retinol was higher. VAS allowed induction of oral tolerance at 1 wk similar to levels seen at 3 wk. However, as in our study, the Treg cell percentages (FoxP3+ T cells) did not increase as a result of supplementation, and the authors found that tolerance was mediated by the development of Th1 cells. To our knowledge, our study is the first to examine the effect of VAS on Treg cell percentages in infants. Although we did not examine development of oral tolerance, it is possible that other effects of VAS may have occurred in our study participants similar to the results in the mouse model system.
A few other studies have examined the effect of VA and retinoic acid on Treg cells in adults with chronic immune-mediated diseases, but the results of these studies have been inconclusive. One study in patients with eczema (29) found that retinoic acid increased Treg cell percentages at the site of inflammation and improved symptoms, but decreased Treg cells in peripheral blood (perhaps due to decreased disease activity). Another study used VA treatment in atherosclerosis patients (30), finding that expression of the Treg-specific transcription factor FoxP3 was increased in PBMC cultured ex vivo, suggesting enhanced Treg cell development.
Retinoic acid produced by dendritic cells in the intestinal lymphoid tissue induces expression of CCR9 on lymphocytes that, along with expression of α4β7 integrin, confers mucosal targeting on Treg and other immune cells (15, 16). We thus hypothesized that VAS would increase the percentage of Treg cells in peripheral blood. Our finding that CCR9 expression was increased on Treg cells as well as total CD4 T cells in infants with lower birthweight, who are at greater risk of nutritional deficiency, was consistent with this hypothesis. A similar observation has been made in a mouse model using mice on VA-deficient and VA-adequate diets when examining intestinal lymphoid tissue, although the same pattern of differences seen in blood was not statistically significant (31). In addition, a recent study treated healthy adult volunteers with retinoic acid while they received the oral typhoid fever vaccine Ty21a and found an increase in CCR9+ CD4 T cells in peripheral blood (32), presumably due to increased development of vaccine-specific CD4 T cells in the intestinal lymphoid tissue. Thus, our finding is consistent with data in the literature from mouse models as well as 1 human study. However, we also observed that CCR9 expression was decreased on Treg cells and on B cells in infants with birthweights above the group median. This finding was unexpected. One possible explanation is that accumulation of CCR9+ Treg and B cells may have been more effectively enhanced in this group than in the lower birthweight group, leaving a lower concentration in peripheral blood, though this explanation remains speculative.
Our hypothesis that VAS at birth would decrease plasma sCD14, a marker for exposure to bacterial endotoxin, was confirmed at the 2-y time point, although no difference was seen in early infancy closer to the time of supplementation. A possible explanation for this time lag is that in early infancy infants were protected from endotoxin by an age-specific factor such as breastfeeding, but a benefit of VAS became evident later when such protection was diminished. Although this apparent later benefit could be due to chance, we speculate that VAS at birth may have allowed development of a more effective intestinal barrier directly or, perhaps, indirectly via effects on the intestinal microbiome. Consistent with this second idea, we previously reported from this study (23) that infants in the VA group had higher numbers of commensal bifidobacteria than infants in the PL group in early infancy and, at least in subgroup analysis (when infants were examined by sex and birthweight categories), at 2 y of age. Further work is needed to test the hypothesis that such changes would decrease endotoxin exposure.
We also examined the effect of VAS at birth on VA status using the MRDR test and plasma retinol. No effect was seen in early infancy. This finding was not entirely unexpected, as even high-dose VAS at birth in the neonatal pig model showed improvement of stores in VA-deficient animals but no sustained increase in plasma retinol (33). In addition, the high prevalence of apparent VAD at 6 and 15 wk may not reflect true deficiency (and thus may not respond to supplementation) as plasma retinol is typically low in early infancy even in well-nourished populations (24). However, we did see a lower prevalence of VAD at 2 y in the VA group than the PL group. This improvement is not a direct effect of supplementation at birth increasing VA stores at 2 y, given the long time interval. It could be a chance effect related to dietary intake differences between the groups, although reported participation in VAS programs between the 15 wk and 2 y study visits did not differ by treatment group (23). However, we speculate that the same postulated improvement in intestinal integrity that might be responsible for lower plasma sCD14 at 2 y might also have improved VA absorption, or decreased losses that can result from infection or inflammation (6), during the first 2 y of life, thus indirectly improving VA status later in infancy.
In summary, we have found that in lower birthweight infants, VAS at birth increased expression of a retinoic acid–sensitive gene product, CCR9, confirming an expected functional response to this supplementation regimen in a preplanned subgroup analysis. Increased CCR9 expression on Treg cells in responsive infants could increase Treg cell percentages in the intestinal mucosa, which could have benefits for decreasing intestinal inflammation. VAS also appeared to improve intestinal integrity, based on the decreased sCD14 concentration at 2 y of age. This possible effect, along with the improved VA status at 2 y, suggests that VAS at birth has sustained benefits throughout infancy, perhaps by improving intestinal immune function leading to improved barrier function and better absorption of VA and perhaps other nutrients, though this mechanism remains speculative.
Supplementary Material
ACKNOWLEDGEMENTS
We thank Xiaowen Jang, Joe Domek, and Leslie Woodhouse for providing laboratory support.
The authors’ responsibilities were as follows—SMA: was a coinvestigator of the study and directed research activities at the clinical site and in the laboratory in Bangladesh, contributed to the development of the study protocol, oversaw the overall study operations including providing feedback to ethical committee, data and safety monitoring board, and funders, and mentored MNH to perform laboratory analysis; MNH: oversaw participant enrolment and follow-up, performed data collection, and performed laboratory analysis; RR: was a coinvestigator and contributed to the development of the study protocol; FQ: was a coinvestigator and contributed to the development of the study protocol; MJA and MNAA: performed data collection and laboratory analysis; JMP; performed statistical analysis; SAT: contributed to the study design and was responsible for the MRDR test; CBS: was principal investigator, helped develop the study protocol, and performed and oversaw statistical analysis and manuscript writing; and all authors: read and approved the final manuscript.
Notes
This work was funded by WHO project number 2010168947, which was funded by the Bill and Melinda Gates Foundation; Thrasher Research Fund grant number 11488 (CBS); USDA-ARS project number 2032-53000-001-00-D. RedCap database usage was supported by the National Center for Advancing Translational Sciences, NIH, through grant number UL1TR001860.
Author disclosures: The authors report no conflicts of interest. Charles B Stephensen is a member of the Journal of Nutrition Editorial Board.
The Supplementary Table and Figure are available from the “Supplementary data” link in the online posting of the article and from the same link in the online table of contents at https://academic.oup.com/jn/.
Abbreviations used: A1, plasma retinol concentration; A2, plasma didehydroretinol concentration; BWM, birth weight median; CCR9, chemokine receptor 9; CRP, C-reactive protein; icddr, b, International Centre for Diarrhoeal Disease Research; MCHTI, Maternal and Child Health Teaching Institute; MRDR, modified relative dose response; PBMC, peripheral blood mononuclear cells; PL, placebo; sCD14, soluble CD14; Treg, regulatory T; VA, vitamin A; VAD, vitamin A deficiency; VAS, vitamin A supplementation; WHNRC, USDA Western Human Nutrition Research Center.
Contributor Information
Shaikh M Ahmad, Infectious Diseases Division, International Centre for Diarrhoeal Disease Research, Bangladesh, Mohakhali, Dhaka, Bangladesh.
M Nazmul Huda, Infectious Diseases Division, International Centre for Diarrhoeal Disease Research, Bangladesh, Mohakhali, Dhaka, Bangladesh; USDA Western Human Nutrition Research Center at University of California, Davis, CA, USA; Nutrition Department, University of California, Davis, CA, USA.
Rubhana Raqib, Infectious Diseases Division, International Centre for Diarrhoeal Disease Research, Bangladesh, Mohakhali, Dhaka, Bangladesh.
Firdausi Qadri, Infectious Diseases Division, International Centre for Diarrhoeal Disease Research, Bangladesh, Mohakhali, Dhaka, Bangladesh.
Md Jahangir Alam, Infectious Diseases Division, International Centre for Diarrhoeal Disease Research, Bangladesh, Mohakhali, Dhaka, Bangladesh.
Md Nure Alam Afsar, Infectious Diseases Division, International Centre for Diarrhoeal Disease Research, Bangladesh, Mohakhali, Dhaka, Bangladesh.
Janet M Peerson, USDA Western Human Nutrition Research Center at University of California, Davis, CA, USA.
Sherry A Tanumihardjo, University of Wisconsin–Madison, Department of Nutritional Sciences, Madison, WI, USA.
Charles B Stephensen, USDA Western Human Nutrition Research Center at University of California, Davis, CA, USA; Nutrition Department, University of California, Davis, CA, USA.
References
- 1. Mellanby E, Green HN. Vitamin a as an anti-infective agent: its use in the treatment of puerperal septigaemia. Br Med J. 1929;1:984–6. [DOI] [PMC free article] [PubMed] [Google Scholar]
- 2. Semba RD. Vitamin A as “anti-infective” therapy, 1920–1940. J Nutr. 1999;129:783–91. [DOI] [PubMed] [Google Scholar]
- 3. Imdad A, Mayo-Wilson E, Herzer K, Bhutta ZA. Vitamin A supplementation for preventing morbidity and mortality in children from six months to five years of age. Cochrane Database Syst Rev. 2017;3:CD008524. [DOI] [PMC free article] [PubMed] [Google Scholar]
- 4. Brown CC, Noelle RJ. Seeing through the dark: new insights into the immune regulatory functions of vitamin A. Eur J Immunol. 2015;45:1287–95. [DOI] [PMC free article] [PubMed] [Google Scholar]
- 5. Larange A, Cheroutre H. Retinoic acid and retinoic acid receptors as pleiotropic modulators of the immune system. Annu Rev Immunol. 2016;34:369–94. [DOI] [PubMed] [Google Scholar]
- 6. Stephensen CB. Vitamin A, infection, and immune function. Annu Rev Nutr. 2001;21:167–92. [DOI] [PubMed] [Google Scholar]
- 7. West KP, Wu LS, Ali H, Klemm RDW, Edmond KM, Hurt L, Kirkwood B, Newton S, Shannon C, Taneja S et al. . Early neonatal vitamin A supplementation and infant mortality: an individual participant data meta-analysis of randomised controlled trials. Arch Dis Child. 2019;104:217–26. [DOI] [PMC free article] [PubMed] [Google Scholar]
- 8. Ahmad SM, Raqib R, Qadri F, Stephensen CB. The effect of newborn vitamin A supplementation on infant immune functions: trial design, interventions, and baseline data. Contemp Clin Trials. 2014;39:269–79. [DOI] [PubMed] [Google Scholar]
- 9. Ahmad SM, Raqib R, Huda MN, Alam MJ, Monirujjaman M, Akhter T, Wagatsuma Y, Qadri F, Zerofsky MS, Stephensen CB. High-dose neonatal vitamin a supplementation transiently decreases thymic function in early infancy. J Nutr. 2020;150:176–83. [DOI] [PMC free article] [PubMed] [Google Scholar]
- 10. Sun CM, Hall JA, Blank RB, Bouladoux N, Oukka M, Mora JR, Belkaid Y. Small intestine lamina propria dendritic cells promote de novo generation of Foxp3 T reg cells via retinoic acid. J Exp Med. 2007;204:1775–85. [DOI] [PMC free article] [PubMed] [Google Scholar]
- 11. Schambach F, Schupp M, Lazar MA, Reiner SL. Activation of retinoic acid receptor-alpha favours regulatory T cell induction at the expense of IL-17-secreting T helper cell differentiation. Eur J Immunol. 2007;37:2396–9. [DOI] [PubMed] [Google Scholar]
- 12. Mucida D, Park Y, Kim G, Turovskaya O, Scott I, Kronenberg M, Cheroutre H. Reciprocal TH17 and regulatory T cell differentiation mediated by retinoic acid. Science. 2007;317:256–60. [DOI] [PubMed] [Google Scholar]
- 13. Kang SG, Lim HW, Andrisani OM, Broxmeyer HE, Kim CH. Vitamin A metabolites induce gut-homing FoxP3+ regulatory T cells. J Immunol. 2007;179:3724–33. [DOI] [PubMed] [Google Scholar]
- 14. Benson MJ, Pino-Lagos K, Rosemblatt M, Noelle RJ. All-trans retinoic acid mediates enhanced T reg cell growth, differentiation, and gut homing in the face of high levels of co-stimulation. J Exp Med. 2007;204:1765–74. [DOI] [PMC free article] [PubMed] [Google Scholar]
- 15. Iwata M. Retinoic acid production by intestinal dendritic cells and its role in T-cell trafficking. Semin Immunol. 2009;21:8–13. [DOI] [PubMed] [Google Scholar]
- 16. Iwata M, Hirakiyama A, Eshima Y, Kagechika H, Kato C, Song SY. Retinoic acid imprints gut-homing specificity on T cells. Immunity. 2004;21:527–38. [DOI] [PubMed] [Google Scholar]
- 17. Brenchley JM, Price DA, Schacker TW, Asher TE, Silvestri G, Rao S, Kazzaz Z, Bornstein E, Lambotte O, Altmann D et al. . Microbial translocation is a cause of systemic immune activation in chronic HIV infection. Nat Med. 2006;12:1365–71. [DOI] [PubMed] [Google Scholar]
- 18. WHO Anthro for personal computers, version 3.2.2, 2011: software for assessing growth and development of the world's children [Internet][Accessed 2016]. (http://www.who.int/childgrowth/software/en/). [Google Scholar]
- 19. National Institute of Population Research and Training (NIPORT) MaA, and ICF International Bangladesh Demographic and Health Survey 2014. Dhaka (Bangladesh) and Rockville (MD): NIPORT, Mitra and Associates, and ICF International; 2016. [Google Scholar]
- 20. Tanumihardjo SA, Cheng JC, Permaesih D, Muherdiyantiningsih RE, Muhilal KD, Olson JA. Refinement of the modified-relative-dose-response test as a method for assessing vitamin A status in a field setting: experience with Indonesian children. Am J Clin Nutr. 1996;64:966–71. [DOI] [PubMed] [Google Scholar]
- 21. WHO Indicators for assessing vitamin A deficiency and their application in monitoring and evaluating intervention programmes. 1996. [Google Scholar]
- 22. Bieri JG, Tolliver TJ, Catignani GL. Simultaneous determination of α-tocopherol and retinol in plasma or red cells by high pressure liquid chromatography. Am J Clin Nutr. 1979;32:2143–9. [DOI] [PubMed] [Google Scholar]
- 23. Huda MN, Ahmad SM, Kalanetra KM, Taft DH, Alam MJ, Khanam A, Raqib R, Underwood MA, Mills DA, Stephensen CB. Neonatal vitamin A supplementation and vitamin A status are associated with gut microbiome composition in Bangladeshi Infants in early infancy and at 2 years of age. J Nutr. 2019;149:1075–88. [DOI] [PMC free article] [PubMed] [Google Scholar]
- 24. Tanumihardjo SA, Russell RM, Stephensen CB, Gannon BM, Craft NE, Haskell MJ, Lietz G, Schulze K, Raiten DJ. Biomarkers of nutrition for development (BOND)-vitamin a review. J Nutr. 2016;146:1816s–48s. [DOI] [PMC free article] [PubMed] [Google Scholar]
- 25. Olson JA, Gunning DB, Tilton RA. Liver concentrations of vitamin A and carotenoids, as a function of age and other parameters, of American children who died of various causes. Am J Clin Nutr. 1984;39:903–10. [DOI] [PubMed] [Google Scholar]
- 26. Olson JA. Liver vitamin A reserves of neonates, preschool children and adults dying of various causes in Salvador, Brazil. Arch Latinoam Nutr. 1979;29:521–45. [PubMed] [Google Scholar]
- 27. Simon AK, Hollander GA, McMichael A. Evolution of the immune system in humans from infancy to old age. Proc Biol Sci. 2015;282:20143085. [DOI] [PMC free article] [PubMed] [Google Scholar]
- 28. Turfkruyer M, Rekima A, Macchiaverni P, Le Bourhis L, Muncan V, van den Brink GR, Tulic MK, Verhasselt V. Oral tolerance is inefficient in neonatal mice due to a physiological vitamin A deficiency. Mucosal Immunol. 2016;9:479–91. [DOI] [PubMed] [Google Scholar]
- 29. Schindler M, Drozdenko G, Kuhl AA, Worm M. Immunomodulation in patients with chronic hand eczema treated with oral alitretinoin. Int Arch Allergy Immunol. 2014;165:18–26. [DOI] [PubMed] [Google Scholar]
- 30. Mottaghi A, Salehi E, Keshvarz A, Sezavar H, Saboor-Yaraghi AA. The influence of vitamin A supplementation on Foxp3 and TGF-beta gene expression in atherosclerotic patients. J Nutrigenet Nutrigenomics. 2012;5:314–26. [DOI] [PubMed] [Google Scholar]
- 31. Kang SG, Wang C, Matsumoto S, Kim CH. High and low vitamin A therapies induce distinct FoxP3+ T-cell subsets and effectively control intestinal inflammation. Gastroenterology. 2009;137:1391–402..e1391–6. [DOI] [PMC free article] [PubMed] [Google Scholar]
- 32. Mwanza-Lisulo M, Chomba MS, Chama M, Besa EC, Funjika E, Zyambo K, Banda R, Imikendu M, Sianongo S, Hancock REW et al. . Retinoic acid elicits a coordinated expression of gut homing markers on T lymphocytes of Zambian men receiving oral Vivotif, but not Rotarix, Dukoral or OPVERO vaccines. Vaccine. 2018;36:4134–41. [DOI] [PMC free article] [PubMed] [Google Scholar]
- 33. Gannon BM, Davis CR, Nair N, Grahn M, Tanumihardjo SA. Single high-dose vitamin A supplementation to neonatal piglets results in a transient dose response in extrahepatic organs and sustained increases in liver stores. J Nutr. 2017;147:798–806. [DOI] [PMC free article] [PubMed] [Google Scholar]
Associated Data
This section collects any data citations, data availability statements, or supplementary materials included in this article.