

Abstract
Evidence from previous coronavirus outbreaks has shown that infected patients are at risk for developing psychiatric and mental health disorders, such as depression, anxiety, and sleep disturbances. To construct a comprehensive picture of the mental health status in COVID‐19 patients, we conducted a systematic review and random‐effects meta‐analysis to assess the prevalence of depression, anxiety, and sleep disturbances in this population. We searched MEDLINE, EMBASE, PubMed, Web of Science, CINAHL, Wanfang Data, Wangfang Med Online, CNKI, and CQVIP for relevant articles, and we included 31 studies (n = 5153) in our analyses. We found that the pooled prevalence of depression was 45% (95% CI: 37–54%, I 2 = 96%), the pooled prevalence of anxiety was 47% (95% CI: 37–57%, I 2 = 97%), and the pooled prevalence of sleeping disturbances was 34% (95% CI: 19–50%, I 2 = 98%). We did not find any significant differences in the prevalence estimates between different genders; however, the depression and anxiety prevalence estimates varied based on different screening tools. More observational studies assessing the mental wellness of COVID‐19 outpatients and COVID‐19 patients from countries other than China are needed to further examine the psychological implications of COVID‐19 infections.
Keywords: depression, anxiety, sleep disturbance, coronavirus, meta‐analysis, pandemic
The objective of this systematic review and meta‐analysis was to assess the prevalence of depression, anxiety, and sleep disturbances in COVID‐19 patients. Our findings suggest that 45% of COVID‐19 patients experience depression, 47% of patients experience anxiety, and 34% of patients experience sleep disturbances. A majority of the included patients were inpatients and patients from China. We did not find any differences in prevalence between patients of different gender, however, the prevalence of depression and anxiety varied depending on the use of different screening tools.
Introduction
In December 2019, a series of acute, atypical respiratory diseases was identified in Wuhan, China. The source of the illnesses was attributed to a novel coronavirus, named the severe acute respiratory syndrome coronavirus‐2 (SARS‐CoV‐2), and the subsequent disease it causes was named the coronavirus disease 2019 (COVID‐19). 1 , 2 , 3 SARS‐CoV‐2 shares considerable homology with previous coronaviruses capable of infecting humans, including SARS‐CoV and MERS‐CoV, 4 , 5 which were responsible for causing the SARS epidemic and MERS outbreak in 2003 and 2012, respectively. However, preliminary studies have shown that SARS‐CoV‐2 may exceed previous coronaviruses in terms of transmissibility; its mean basic reproduction number (R0) was found to be 3.28 in a previous review, 6 as compared with 2.4 for SARS‐CoV, or 0.9 for MERS‐CoV. 7 As a result, COVID‐19 has quickly evolved into a global pandemic as declared by the World Health Organization on March 11, 2020. 8 , 9 Since its discovery, there have been nearly 25 million confirmed cases and 800,000 deaths in over 200 countries. 10
While much clinical attention and research focus has been given to treating the physiological fallout caused by the novel coronavirus, the psychological effects of the virus on infected patients should be considered as well. As evidenced by the previous SARS and MERS outbreaks, viral infections and the subsequent isolation and quarantine can quickly culminate into sleep disturbances, anxiety, and depressive episodes. 11 Among MERS patients, for example, 70.8% exhibited psychiatric symptoms and 41.7% received a definitive psychiatric diagnosis and medication throughout their hospital stay. 12 The psychological impact of the COVID‐19 pandemic, however, may exceed previous coronavirus outbreaks as a result of the rampant spread of misinformation enabled by social media, 13 , 14 as well as its colossal scale that overexerted healthcare workers and resulted in a shortage of critical supplies, such as ventilators. 15 In addition, previous studies have shown that hospitalization in intensive care units (ICUs) and the use of mechanical ventilation are both risk factors for developing acute psychiatric symptoms; 16 , 17 since COVID‐19 patients have a greater mean duration of stay in the ICU compared with previous coronavirus outbreaks, 18 , 19 it is possible that COVID‐19 patients who require intensive care could potentially become a high‐risk group for developing psychiatric disorders. 15 , 20
As healthcare workers are pressured to offer time‐efficient care amidst supply and personnel shortages during the COVID‐19 pandemic, the time that treatment teams spend with individual patients is severely limited. 21 As a result, psychiatric symptoms in patients diagnosed with COVID‐19 are likely underevaluated and undertreated as physicians prioritize physical illnesses. Yet, psychological health plays a crucial role in accelerating patient recovery. For instance, depressed inpatients have been shown to have poorer outcomes, increased length of hospital stay, and a greater likelihood of hospital readmission, as shown in a previous systematic review. 22 A recent small‐scale observational study has also found that higher cortisol levels, which were positively correlated with anxiety severity, were potentially linked to greater mortality in COVID‐19 patients. 23 In addition, hospitalized patients with psychiatric comorbidities may result in increased medical costs, 24 worsening the economic impact of the pandemic on healthcare networks, and financially disadvantaged individuals. 25 It is likely that these infection‐related psychiatric symptoms will persist long after recovery; as demonstrated by the SARS epidemic, psychiatric complications in SARS‐infected patients can last for more than 2 years after the outbreak. 26 These long‐term psychiatric disorders may, therefore, pose as significant economic and social burdens to the postpandemic world. 27
Despite the importance of managing psychiatric disorders in COVID‐19 patients, current evidence regarding the prevalence of psychiatric disorders in infected patients is lacking and unclear. In an early review paper published by Rogers et al. 28 summarizing psychiatric and neuropsychiatric presentations associated with SARS, MERS, and the COVID‐19 outbreaks, it was found that delirium was common in patients with acute stages of COVID‐19. However, the prevalence of other psychiatric disorders, such as depression, anxiety, and sleep disturbances, was not evaluated due to a lack of published data. 28 Recent case reports and observational studies have suggested that COVID‐19 patients are likely susceptible to developing depression, anxiety, and sleep disturbances, 29 and these disorders should be adequately diagnosed and addressed by clinicians to improve prognosis, decrease the length of stay, and avoid long‐term mental health issues. To construct a comprehensive picture on the impact of the pandemic on COVID‐19 patients’ mental health, as well as to raise awareness for the importance of psychiatric screening and treatment in COVID‐19 patients, we conducted a systematic review and meta‐analysis to assess the prevalence of depression, anxiety, and sleep disturbances in patients with COVID‐19.
Materials and methods
We conducted this systematic review and meta‐analysis in accordance with the Cochrane Handbook for Systematic Reviews of Interventions 30 and the Preferred Reporting Items for Systematic Reviews and Meta‐Analyses (PRISMA) 31 framework (see Table S1 for the PRISMA checklist, online only). This systematic review was prospectively registered on PROSPERO (CRD42020192093).
Search strategy
We searched the following databases from 2019 to August 18, 2020, for relevant studies: (1) MEDLINE, (2) EMBASE, (3) PubMed, (4) Web of Science, and (5) Cumulative Index of Nursing and Allied Health Literature (CINAHL). We also searched the following Chinese databases using a Chinese search strategy: (1) Wanfang Data, (2) Wanfang Med Online, (3) China National Knowledge Infrastructure (CNKI), and (4) Chongqing VIP Information (CQVIP). Nonpeer‐reviewed articles indexed on PubMed, such as the articles from the health sciences preprint server medRxiv, were included for article screening and selection as well. The search strategy used for the database searches can be found in Tables S2 and S3 (online only). In addition to the database searches, we hand‐searched the reference sections of previous reviews identified from the database search for relevant studies.
Inclusion criteria
Studies satisfying the following criteria were included in our systematic review: (1) included patients with COVID‐19, and (2) reported the prevalence of depression, anxiety, or sleep disturbances. We included all primary observational studies, including longitudinal cohort, cross‐sectional, or case−control studies with a sample size of ≥10 participants. Studies that specifically defined COVID‐19 patients with known mental disorders as their target population were excluded. We did not place limitations on the publication's language or its country of origin, nor did we limit the age or gender of the included patients.
Study selection
Duplicate entries from the database search were removed using EndNote X9. Eight reviewers (J.D., F.Z., W.H., Z.S., C.Y.W., O.C., E.H., and Q.K.Z.) screened the deduplicated entries independently and in duplicate using Rayyan 32 based on the aforementioned inclusion criteria. Entries deemed relevant by two reviewers were then entered into an in duplicate full‐text screening process. We resolved disagreements by recruiting a third author for arbitration.
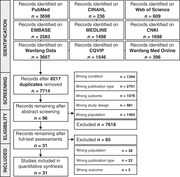
Figure 1 shows the PRISMA flow diagram 33 of our study identification and selection process. Studies were excluded due to wrong conditions (e.g., studies that assessed mental illness in patients with non‐COVID diseases), wrong publication type (e.g., review, editorials, and letters to the editor without usable data), wrong outcome (studies that did not report any of our outcomes of interest), wrong study design (e.g., animal studies and single patient case studies), and wrong population (e.g., studies focusing on the general population or other populations at‐risk for developing mental illness, such as university students, and studies that included COVID‐19 patients with known psychiatric disorders).
Figure 1.

PRISMA flowchart for the identification and selection of observational trials. CINAHL, Cumulative Index to Nursing and Allied Health Literature; CNKI, Chinese National Knowledge Infrastructure; CQVIP, Chongqing VIP Information.
Data extraction
Data extraction was completed by eight reviewers (J.D., F.Z., W.H., Z.S., C.Y.W., O.C., E.H., and Q.K.Z.) independently and in duplicate. We used a standardized data extraction form developed a priori. The data extraction form included the following items: (1) author names, (2) study title, (3) publication date, (4) digital object identifier, (5) country of origin, (6) study design, (7) sample size, (8) questionnaire response rate, (9) patient demographics (i.e., gender and mean/median age), (10) screening tools and cutoff values used to identify psychiatric disorders, (11) outcome measures, and (12) relevant subgroup data. For cohort studies, we extracted the outcome data from baseline. Disagreements were resolved by recruiting a third author to review the data. We made attempts to contact the principal investigators from studies with unclear or missing information to obtain relevant unpublished data.
Outcomes and measures
The main outcomes in this systematic review were the prevalence of depression, anxiety, and sleep disturbances, as assessed using clinical interviews or self‐ and clinician‐rated screening tools/questionnaires. Patients exhibiting depressive or anxious symptoms, such as hyperventilation, irritability, or fatigue, but were not assessed using interviews and/or questionnaires were not included in the analysis. Sleep disturbances were defined as sleep initiation or maintenance disorders, excessive somnolence, disorders of sleep−wake schedule, poor sleep quality, and/or other sleep impairments 34 as evaluated using interviews or questionnaires.
To comply with quarantine requirements and social distancing guidelines, a majority of patients were assessed using self‐rated electronic questionnaires, including Zung Self‐Rating Depression Scale (SDS), 35 Zung Self‐Rating Anxiety Scale (SAS), 36 General Anxiety Disorder 7‐item scale (GAD‐7), 37 Patient Health Questionnaire depression module‐9 (PHQ‐9), 38 the Hospital Anxiety and Depression Scale (HADS), 39 Symptom Checklist‐90 (SCL‐90), 40 Pittsburgh Sleep Quality Index (PSQI), 41 and Insomnia Severity Index (ISI). 42
Zung SDS
The SDS is a 20‐question self‐reporting survey aimed to assess patients’ level of depression. The questions are answered using a 4‐point Likert scale. 35 In our included studies, the raw total scores were multiplied by 1.25 to yield an index score. A majority of studies chose an index score ≥50 as the cutoff for diagnosing depression; however, two studies 43 , 44 used a cutoff of ≥53 as prior studies had suggested that this cutoff may be more appropriate for the Chinese population. 45 , 46 The SDS was only administered to Chinese patients in our included studies; its Chinese translation had been validated previously. 47 , 48
Zung SAS
The SAS is a 20‐question self‐reporting survey aimed at assessing patients’ anxiety levels. The questions are designed to quantify four manifestations of anxiety, including cognitive, autonomic, motor, and central nervous symptoms. It is scored on a 4‐point Likert scale. 36 Similar to the SDS, the raw scores for the SAS were multiplied by 1.25 to yield an index score. Only an index score cutoff of ≥50 was used for diagnosing anxiety in our included studies. The SAS was administered, typically with the SDS, to Chinese patients and its Chinese translation had been validated previously. 48 , 49 , 50
GAD‐7
The GAD‐7 is a self‐rated screening tool for the rapid detection of possible anxiety disorders. It consists of seven questions and is rated on a 4‐point Likert scale. 37 A cutoff value of ≥5 was used for diagnosing anxiety in our included studies. It was administered to patients from China, Iran, and Ecuador in Chinese, Persian/Farsi, and Spanish, respectively. It had been validated in these languages. 51 , 52 , 53 , 54 , 55
PHQ‐9
The PHQ‐9 is a self‐rated module for diagnosing depression. It consists of nine questions relating to the patients’ mental health, with each item rated on a 4‐point Likert scale. 38 A cutoff value of ≥5 was used for diagnosing depression in our included studies. It was administered, typically with the GAD‐7, to patients from China, Iran, and Ecuador in Chinese, Persian/Farsi, and Spanish respectively. It had been validated in these languages. 53 , 56 , 57 , 58 , 59 , 60
HADS
The HADS is a self‐reported screening tool used to measure patients’ psychological levels of anxiety and depression. The scale consists of 14 items across two subscales: HADS‐D for depression, and HADS‐A for anxiety. It employs a 4‐point Likert scale yielding a total score of 0–21 in each subscale. 39 In our included studies, a cutoff of ≥8 in each subscale was used for diagnosing anxiety or depression. It was only administered to Chinese patients and its Chinese translation had been previously validated. 61 , 62
SCL‐90
The SCL‐90 is a self‐reporting diagnostic tool for the assessment of a wide range of psychopathological distress. The survey contains 90 items, measuring nine principal dimensions in psychopathology, including somatization, obsessive‐compulsive behaviors, interpersonal sensitivity, depression, anxiety, hostility, phobic anxiety, paranoia, and psychoticism. 40 Only data relating to the depression and anxiety dimensions were included in the analysis. A cutoff score of ≥2 in these two dimensions was used for diagnosing anxiety or depression. The SCL‐90 was only administered to Chinese patients in our included studies and its Chinese translation had been previously validated. 63 , 64 , 65
PSQI
The PSQI is a self‐reporting questionnaire for the assessment of sleep quality. It consists of 19 items on a 4‐point Likert scale, and is designed to measure sleep disturbances and sleep habits over a 1‐month period. 41 In our included studies, a PSQI score between 16 and 21 was considered as an indication for sleep disturbance. It was administered to Chinese patients and had been previously validated in Chinese. 66 , 67 , 68
ISI
The ISI is a self‐reporting psychometric questionnaire designed to assess the severity of insomnia in adults. It consists of seven items rated on a 5‐point Likert scale. 42 A cutoff of ≥8 was used for diagnosing insomnia/sleep disturbance in our included studies. It was administered to Chinese patients and had been previously validated in Chinese. 69
Custom questionnaires and clinical interviews
Custom screening tools were used by four Chinese studies 70 , 71 , 72 , 73 for evaluating depression, anxiety, and/or sleep disturbances. Two studies 74 , 75 used interviews for evaluating depression, anxiety, and sleep disturbances. The interview results were reviewed and confirmed by expert neurologists; however, the exact diagnostic criteria and interview questions were not disclosed in these studies.
Quality assessment
We assessed the quality of our included studies using a modified version of the Newcastle−Ottawa Quality Assessment Scale adapted for cross‐sectional studies, 76 which is similar in format to the scale used in previous meta‐analyses. 77 Because we expected a majority of our included studies to be single‐arm observational studies, we removed irrelevant sections of the Newcastle−Ottawa Scale (NOS), such as comparability and assessment of the outcome. The modified scale evaluated the quality of our included studies based on five domains: (1) representativeness of the sample (inclusion of all subjects or the use of random sampling); (2) sample size (justified using methods such as power analysis); (3) nonrespondents (response rate is ≥80%); (4) valid measurement tool (appropriate screening tools used to evaluate depression, anxiety, or sleep disturbances); and (5) appropriate statistical analysis (appropriate and clearly described statistical tests). The total quality score ranged between 0 and 5; studies scoring ≥3 points were regarded to have a low risk of bias, while studies with <3 points were regarded to have a high risk of bias.
Statistical analysis
We conducted all statistical analyses using R 4.0.2 (https://www.r-project.org/), and random‐effects meta‐analyses were performed using the meta 4.12 library (https://cran.r-project.org/web/packages/meta/). 78 To avoid variance instability when the prevalence trends toward 0% or 100% and to prevent confidence intervals (CIs) from extending beyond 0% and 100%, we transformed the extracted prevalence values using the Freeman−Tukey double arcsine method for prevalence pooling. 79 We then converted the results back to prevalence values with 95% CIs for ease of interpretation.
The Cochran's Q‐test, with a significance level of P < 0.10, was used to assess the presence of heterogeneity, as recommended by the Cochrane Handbook. We further quantified heterogeneity using I 2 statistics. 30 , 80 An I 2 value ≥75% was considered to indicate serious heterogeneity as recommended by the Cochrane Handbook. 30
Subgroup analyses
We performed subgroup analyses by different screening tools and cutoff values, gender, country, study design, the severity of depression, anxiety, and sleep disturbances, as well as the patients’ hospitalization status. We also performed subgroup analyses to study differences in pooled prevalence from peer‐ and nonpeer‐reviewed (preprint) articles, and between articles using validated versus unvalidated screening tools.
Meta‐regression
We performed meta‐regression analyses 81 to examine correlations between the pooled prevalence and study‐level covariates. We chose the mean age and percentage male representation as our covariates of interest.
Sensitivity analyses
We performed sensitivity analyses by subtracting each study and calculating the pooled prevalence and I 2 of the remaining studies, in order to identify studies that may severely affect the pooled prevalence or heterogeneity.
Publication bias
We examined the presence of small study effects as an indication for publication bias using funnel plots and Egger's regression tests. 82 , 83 , 84
Results
Study characteristics
We included 31 studies 43 , 44 , 70 , 71 , 72 , 73 , 74 , 75 , 85 , 86 , 87 , 88 , 89 , 90 , 91 , 92 , 93 , 94 , 95 , 96 , 97 , 98 , 99 , 100 , 101 , 102 , 103 , 104 , 105 , 106 , 107 with 5153 patients in our analysis, including two preprint articles 43 , 93 (see Fig. 1). Table 1 shows the characteristics of the included studies. Twenty‐seven (87%) studies 43 , 44 , 70 , 71 , 72 , 73 , 85 , 86 , 87 , 88 , 89 , 90 , 91 , 92 , 93 , 94 , 96 , 97 , 98 , 99 , 100 , 101 , 102 , 103 , 104 , 105 , 107 were conducted in China, and the remaining four studies were, respectively, conducted in Italy, 75 Ecuador, 95 Turkey, 74 and Iran. 106 Twenty‐eight (90%) studies were cross‐sectional studies, 43 , 44 , 70 , 71 , 72 , 73 , 74 , 75 , 85 , 86 , 87 , 88 , 90 , 92 , 93 , 94 , 95 , 96 , 97 , 98 , 99 , 100 , 101 , 103 , 104 , 105 , 106 , 107 and three (10%) studies were single‐arm cohort studies. 89 , 91 , 102 The median number of participants with valid responses across the included studies was 97 (range 15–770), with a median male representation of 49% (range 25–62%). The median questionnaire response rate was 100% (range 52–100%).
Table 1.
Characteristics of included studies
| Assessment scales and cutoff value | |||||||||
|---|---|---|---|---|---|---|---|---|---|
| Study | Country | Study design | Response rate (%) | Sample size (n) | Male (%) | Age (mean ± SD) | Depression | Anxiety | Sleep disturbances |
| Cao et al. 85 | China | CS | – | 148 | 47 | 50.2 ± 15.6 | SDS ≥ 50 | SAS ≥ 50 | Custom questionnaire |
| Cheng et al. 86 | China | CS | 100 | 76 | 41 | 35.9 ± 10.6 | – | SAS ≥ 50 | – |
| Cheng et al. 70 | China | CS | 98.3 | 59 | 41 | – | Custom questionnaire | Custom questionnaire | – |
| Guo et al. 108 | China | CS | 100 | 103 | 57 | 42.5 ± 12.5 | PHQ‐9 ≥ 5 | GAD‐7 ≥ 5 | – |
| He et al. 88 | China | CS | 100 | 214 | 46 | – a | PHQ‐9 ≥ 5 | – | PSQI 16–21 |
| Hu et al. 98 | China | CS | 100 | 85 | 51 | 48.8 ± 14.3 | PHQ‐9 ≥ 5 | GAD‐7 ≥ 5 | ISI ≥ 8 |
| Huang et al. 71 | China | CS | 92.4 | 86 | 52 | – b | Custom questionnaire | – | Custom questionnaire |
| Karadaş et al. 74 | Turkey | CS | 100 | 239 | 56 | 46.5 ± 15.4 | – | – | Interview |
| Kong et al. 93 | China | CS | – | 144 | 49 | 49.9 ± 13.7 | HADS‐D ≥ 8 | HADS‐A ≥ 8 | – |
| Kuang et al. 89 | China | SAC | 100 | 68 | 47 | 35.2 ± 9.7 | SDS ≥ 50 | SAS ≥ 50 | – |
| Li et al. 90 | China | CS | 100 | 118 | 55 | 39.8 ± 12.4 | – | SAS ≥ 50 | – |
| Li et al. 103 | China | CS | 100 | 46 | 61 | – c | – | HADS‐A ≥ 8 | – |
| Liguori et al. 75 | Italy | CS | 100 | 103 | 57 | 55.0 ± 14.6 | Interview | Interview | Interview |
| Liu et al. 107 | China | CS | 100 | 15 | 53 | 47.0 ± 8.4 | PHQ‐9 ≥ 5 | GAD‐7 ≥ 5 | ISI ≥ 8 |
| Liu and Yu 72 | China | CS | 89.8 | 97 | – | 57.6 ± 9.2 | – | Custom questionnaire | – |
| Ma et al. 100 | China | CS | 98.2 | 770 | 48 | 50.4 ± 13.1 | PHQ‐9 ≥ 5 | – | – |
| Mi and Yu 91 | China | SAC | 100 | 20 | 50 | 39.0 ± 13.2 | – | SAS ≥ 50 | – |
| Nie et al. 94 | China | CS | 91.8 | 78 | 42 | – d | SDS ≥ 50 | SAS ≥ 50 | – |
| Paz et al. 95 | Ecuador | CS | – | 306 | 49 | 38.3 ± 10.9 | PHQ‐9 ≥ 5 | GAD‐7 ≥ 5 | – |
| Qi et al. 43 | China | CS | 52.4 | 41 | 42 | 40.1 ± 10.1 | SDS ≥ 53 | SAS ≥ 50 | – |
| Qin et al. 105 | China | CS | – | 112 | 53 | – e | SCL‐90 ≥ 2 | SCL‐90 ≥ 2 | – |
| Wang et al. 92 | China | CS | – | 376 | 25 | 36.1 ± 9.7 | SDS ≥ 50 | SAS ≥ 50 | PSQI 16–21 |
| Wang et al. 97 | China | CS | 99.0 | 484 | 50 | 52.5 ± 14.3 | – | – | ISI ≥ 8 |
| Wang et al. 104 | China | CS | 99.2 | 652 | 53 | 51.5 ± 13.9 | SCL‐90 ≥ 2 | SCL‐90 ≥ 2 | – |
| Xue et al. 73 | China | CS | 95.3 | 41 | 46 | – f | Custom questionnaire | Custom questionnaire | – |
| Zarghami et al. 106 | Iran | CS | 74.5 | 82 | 39 | – g | PHQ‐9 ≥ 5 | GAD‐7 ≥ 5 | – |
| Zhang et al. 44 | China | CS | – | 86 | 45 | 72.6 ± 12.1 | SDS ≥ 53 | SAS ≥ 50 | – |
| Zhang et al. 101 | China | CS | 98.9 | 296 | 58 | – | HADS‐D ≥ 8 | HADS‐A ≥ 8 | – |
| Zhang et al. 96 | China | CS | – | 57 | 51 | 46.9 ± 15.4 | PHQ‐9 ≥ 5 | GAD‐7 ≥ 5 | – |
| Zhao et al. 99 | China | CS | 100 | 106 | 43 | 35.9 ± 11.9 | PHQ‐9 ≥ 5 | GAD‐7 ≥ 5 | – |
| Zhu et al. 102 | China | SAC | 100 | 45 | 62 | 59.8 ± 15.4 | – | – | PSQI 16–21 |
The author indicated that all included patients were over 18 years old.
The author indicated that the age range of the included patients was 17–78.
The author indicated that the mean age was 60.9; however, no standard deviation was reported.
The author indicated that the mean age was 58.4; however, no standard deviation was reported.
The author reported that the median age was 40, with a range of 19–80.
The author reported a range of 18–82.
The author reported that the mean age of inpatients was 40.34 ± 14.39, and the mean age of outpatients was 43.62 ± 15.81.
CS, cross‐sectional; GAD‐7, General Anxiety Disorder 7‐Item Scale; HADS‐D, Hospital Anxiety and Depression Scale (Depression Subscale); HADS‐A, Hospital Anxiety and Depression Scale (Anxiety Subscale); ISI, Insomnia Severity Index; SD, standard deviation; SCL‐90, Symptom Checklist‐90; SDS, Self‐Rating Depression Scale; SAS, Self‐Rating Anxiety Scale; PHQ‐9, Patient Health Questionnaire Depression Module‐9; PSQI, Pittsburgh Sleep Quality Index; SAC, single‐arm cohort.
Note: Cells containing “–“ indicate that the study author did not provide any relevant information for that column.
Quality of included studies
Figure 2 shows the NOS of the included studies. The median NOS was 3 (range 2–4). Twelve (39%) studies 43 , 44 , 72 , 73 , 75 , 85 , 92 , 93 , 95 , 96 , 105 , 106 had a high risk of bias (quality score <3), and 19 (61%) studies 70 , 71 , 74 , 86 , 88 , 89 , 90 , 91 , 94 , 97 , 98 , 99 , 100 , 101 , 102 , 103 , 104 , 107 , 108 had a low risk of bias (quality score ≥3). While a majority of the studies employed appropriate statistical methods, used validated screening tools, and had low nonrespondent rates, very few studies justified their choice of sample size or used random sampling.
Figure 2.
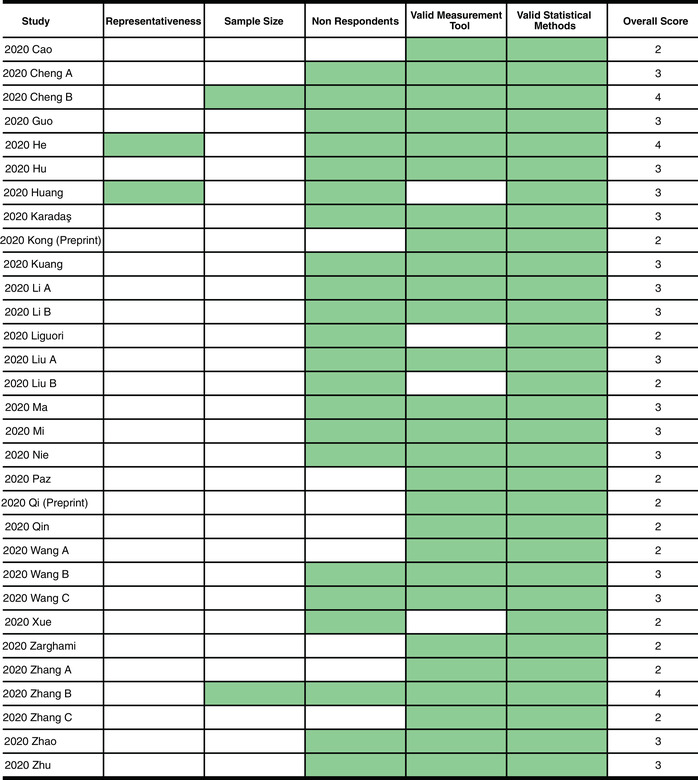
Quality ratings of included studies using the modified Newcastle−Ottawa Scale.
The pooled prevalence of depression
The pooled prevalence of depression of 23 studies (n = 4028) 43 , 44 , 70 , 71 , 73 , 75 , 85 , 87 , 88 , 89 , 92 , 93 , 94 , 95 , 96 , 98 , 99 , 100 , 101 , 104 , 105 , 106 , 107 was 45% (95% CI: 37–54%). There was significant serious between‐study heterogeneity (I 2 = 96%, P Q < 0.01).
Meta‐regression and publication bias
There were no significant correlations between the pooled depression prevalence and percentage male representation (P = 0.31) or mean age (P = 0.95) as shown by the meta‐regression analyses. There was no evidence of publication bias according to visual inspection of the funnel plot (see Fig. S1, online only) and Egger's regression test (P = 0.22).
Sensitivity analysis
In the sensitivity analysis, no study affected the pooled prevalence by over 2%, or affected the I 2 value by over 1%, when excluded (see Fig. S2, online only).
Study design and preprints
There was one single‐arm cohort study 89 that reported depression prevalence. The remaining studies were cross‐sectional studies. The single‐arm cohort study reported a prevalence of 74% (95% CI: 62–83%), which is significantly higher compared with the pooled prevalence of cross‐sectional studies (44%, 95% CI: 36–53%, I 2 = 96%). There was a significant subgroup difference between the pooled prevalence from cross‐sectional versus cohort studies (P < 0.01); however, omitting the cohort study did not result in any substantial changes in the pooled prevalence compared with the original analysis (see Fig. S3, online only).
Two preprint articles, 43 , 93 which were not peer‐reviewed, were included in the study. They yielded a pooled prevalence of 22% (95% CI: 16–28%, I 2 = 0%), which was significantly lower (P < 0.01) compared with the pooled prevalence of the peer‐reviewed articles (48%, 95% CI: 39–56%, I 2 = 97%). Omitting the preprint articles did not result in any substantial changes in the pooled prevalence compared with the original analysis (see Fig. S4, online only).
Depression screening tools
For depression assessment methods (see Fig. 3), nine studies 88 , 95 , 96 , 98 , 99 , 100 , 106 , 107 , 108 used the criteria of PHQ‐9 ≥5 with a pooled prevalence of 52% (95% CI: 45–59%, I 2 = 83%) and four studies 85 , 89 , 92 , 94 used SDS ≥50 with a pooled prevalence of 53% (95% CI: 42–65%, I 2 = 86%). Other criteria included HADS‐D ≥8, 93 , 101 SDS ≥53, 43 , 44 and SCL‐90 (depression subscale) ≥2, 104 , 105 which were used by two studies each and yielded a pooled prevalence of 20% (95% CI: 16–23%, I 2 = 0%), 53% (95% CI: 6–97%, I 2 = 97%), and 19% (95% CI: 17–22%, I 2 = 0%), respectively. The remaining studies used unvalidated custom questionnaires or interviews. There were significant subgroup differences between different screening tool subgroups (P < 0.01).
Figure 3.
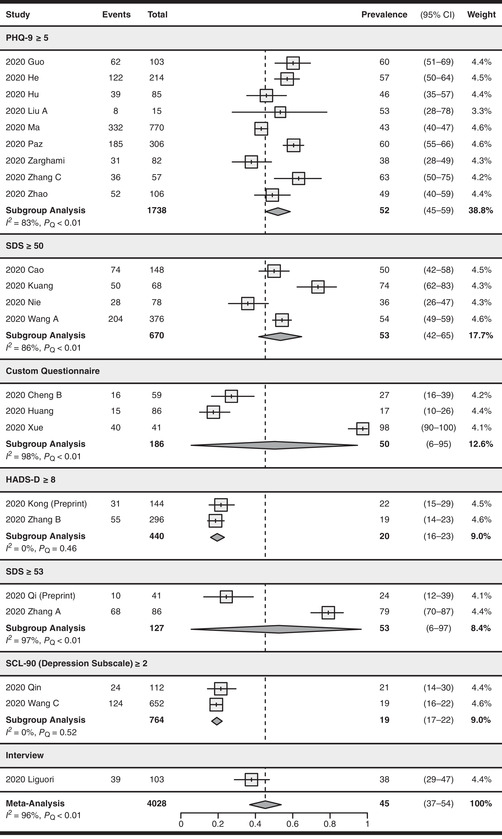
Forest plot for the pooling of depression prevalence. Studies were separated into subgroups based on the screening tool and cutoff values used for evaluating depression. The prevalence values are in percentages. Prevalence was not pooled for the interview subgroup as only one study was included. The differences between subgroups were statistically significant (P < 0.01). CI, confidence interval; PHQ‐9, Patient Health Questionnaire Depression Module‐9; HADS‐D, Hospital Anxiety and Depression Scale (Depression Subscale); SCL‐90, Symptom Checklist‐90; SDS, Self‐Rating Depression Scale.
Nineteen studies, 43 , 44 , 85 , 87 , 88 , 89 , 92 , 93 , 94 , 95 , 96 , 98 , 99 , 100 , 101 , 104 , 105 , 106 , 107 using validated screening tools, yielded a pooled depression prevalence of 45% (95% CI: 36–54%, I 2 = 96%). Four studies, 70 , 71 , 73 , 75 using unvalidated screening tools, reported a pooled prevalence of 47% (95% CI: 15–80%, I 2 = 97%). There were no significant subgroup differences between the two prevalence estimates (P = 0.92, see Fig. S5, online only).
The pooled prevalence of anxiety
Anxiety was assessed in 25 studies (n = 3315), 43 , 44 , 70 , 72 , 73 , 75 , 85 , 86 , 87 , 89 , 90 , 91 , 92 , 93 , 94 , 95 , 96 , 98 , 99 , 101 , 103 , 104 , 105 , 106 , 107 with a pooled prevalence of 47% (95% CI: 37–57%). There was significant serious between‐study heterogeneity (I 2 = 97%, P Q < 0.01).
Meta‐regression and publication bias
There were no significant correlations between pooled anxiety prevalence and percentage male representation (P = 0.68) or mean age (P = 0.44) as shown by the meta‐regression analyses. There was no evidence of publication bias (Egger's test, P = 0.06, see Fig. S6, online only).
Sensitivity analysis
The maximum effect of removing a study on the pooled prevalence was 3% according to the sensitivity analysis. The maximum effect on the I 2 value was 1% (see Fig. S7, online only).
Study design and preprints
There were two cohort studies 89 , 91 that reported anxiety prevalence. The remaining studies were cross‐sectional studies. The single‐arm cohort studies yielded a pooled prevalence of 89% (95% CI: 48–100%, I 2 = 93%), which is significantly higher (P < 0.05) compared with the pooled prevalence of cross‐sectional studies (43%, 95% CI: 33–53%, I 2 = 97%). Omitting the cohort studies did not result in any substantial changes in the pooled prevalence compared with the original analysis (see Fig. S8, online only).
Two preprint articles, 43 , 93 which were not peer‐reviewed, were included in the study. They yielded a pooled prevalence of 25% (95% CI: 8–46%, I 2 = 85%), which was significantly lower (P < 0.05), compared with the pooled prevalence of the peer‐reviewed articles (49%, 95% CI: 38–60%, I 2 = 97%). Omitting the preprint articles did not result in any substantial changes in the pooled prevalence compared with the original analysis (see Fig. S9, online only).
Anxiety screening tools
For anxiety assessment methods (see Fig. 4), nine studies 43 , 44 , 85 , 86 , 89 , 90 , 91 , 92 , 94 used the criteria of SAS ≥50 with a pooled prevalence of 54% (95% CI: 32–75%, I 2 = 98%), seven studies 95 , 96 , 98 , 99 , 106 , 107 , 108 used GAD‐7 ≥5 with a pooled prevalence of 47% (95% CI: 37–58%, I 2 = 86%), three studies 93 , 101 , 103 used HADS‐A ≥8 with a pooled prevalence of 34% (95% CI: 19–51%, I 2 = 91%), and two studies 104 , 105 used SCL‐90 (anxiety subscale) ≥2 with a pooled prevalence of 18% (95% CI: 15–21%, I 2 = 0%). The remaining studies used unvalidated custom questionnaires or interviews. There were significant subgroup differences between different screening tool subgroups (P < 0.01).
Figure 4.
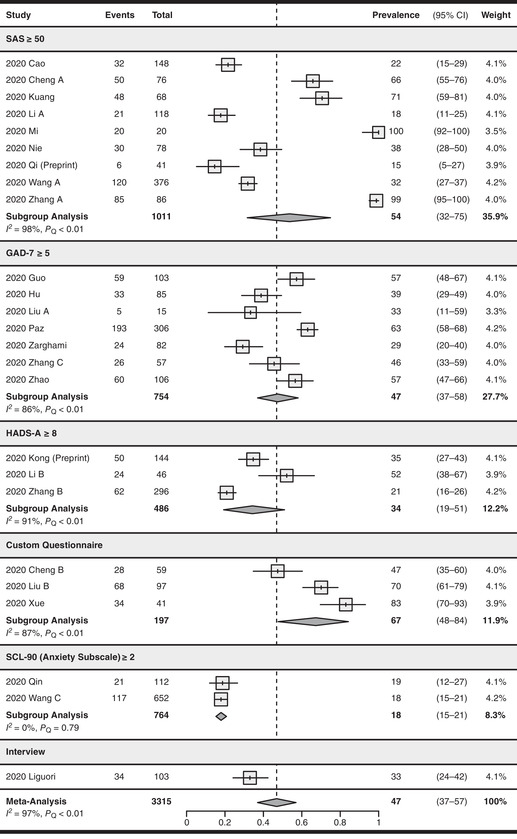
Forest plot for the pooling of anxiety prevalence. Studies were separated into subgroups based on the screening tool and cutoff values used for evaluating anxiety. The prevalence values are in percentages. Prevalence was not pooled for the interview subgroup as only one study was included. The differences between subgroups were statistically significant (P < 0.01). CI, confidence interval; GAD‐7, General Anxiety Disorder‐7; HADS‐A, Hospital Anxiety and Depression Scale (Anxiety Subscale); SAS, Self‐Rating Anxiety Scale; SCL‐90, Symptom Checklist‐90.
Twenty‐one studies 43 , 44 , 85 , 86 , 87 , 89 , 90 , 91 , 92 , 93 , 94 , 95 , 96 , 98 , 99 , 101 , 103 , 104 , 105 , 106 , 107 used validated screening tools and yielded a pooled anxiety prevalence of 45% (95% CI: 34–56%, I 2 = 97%). Four studies 70 , 72 , 73 , 75 using unvalidated screening tools reported a pooled prevalence of 59% (95% CI: 36–80%, I 2 = 93%). There were no significant subgroup differences between the two prevalence estimates (P = 0.28, see Fig. S10, online only).
Pooled prevalence of sleep disturbances
Sleep disturbances were reported in 10 studies (n = 1795), 71 , 74 , 75 , 85 , 88 , 92 , 97 , 98 , 102 , 107 with a pooled prevalence of 34% (95% CI: 19–50%). There was significant serious between‐study heterogeneity (I 2 = 98%, P Q < 0.01).
Meta‐regression and publication bias
There were no significant correlations between the pooled prevalence of sleep disturbances and percentage male representation (P = 0.11) or mean age (P = 0.16) as shown by the meta‐regression analyses. There was no evidence of publication bias (Egger's test, P = 0.45, see Fig. S11, online only).
Sensitivity analysis
According to the sensitivity analyses, the maximum effect of removing a study on the pooled prevalence was 5%, with a maximum effect of 1% on the I 2 value (see Fig. S12, online only).
Study design and preprints
There was one single‐arm cohort study 102 that reported sleep disturbances with a prevalence of 2% (95% CI: 0–9%). This is significantly lower (P < 0.01) compared with the pooled prevalence of the remaining studies (39%, 95% CI: 23–55%, I 2 = 98%), which were all cross‐sectional studies (see Fig. S13, online only). No preprint article reported sleep disturbances as one of their outcomes.
Sleep disturbances screening tools
The most common criteria for assessing sleep disturbances were PSQI 16−2188,92,102 and ISI ≥8,97,98,107 which are used by three studies each, yielding a pooled prevalence of 19% (95% CI: 0–68%, I 2 = 99%) and 43% (95% CI: 31–56%, I 2 = 73%), respectively. The remaining studies used unvalidated custom questionnaires or interviews for assessing sleep disturbances. There were no significant subgroup differences between different screening tool subgroups (P = 0.21, see Fig. 5).
Figure 5.
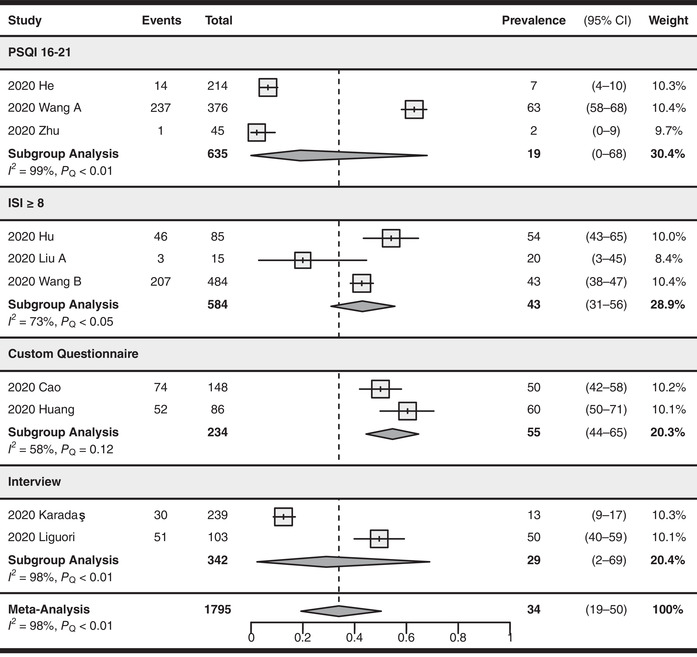
Forest plot for the pooling of sleep disturbance prevalence. Studies were separated into subgroups based on the screening tool and cutoff values used for evaluating sleep disturbances. The prevalence values are in percentages. The differences between subgroups were not statistically significant (P = 0.21). CI, confidence interval; ISI, Insomnia Severity Index; PSQI, Pittsburgh Sleep Quality Index.
Six studies 88 , 92 , 97 , 98 , 102 , 107 used validated screening tools and yielded a pooled prevalence of 29% (95% CI: 10–52%, I 2 = 98%). Four studies 71 , 74 , 75 , 85 used unvalidated screening tools and reported a pooled prevalence of 42% (95% CI: 18–68%, I 2 = 97%). There were no significant subgroup differences between the two prevalence estimates (P = 0.45, see Fig. S14, online only).
Subgroup analyses
Results of the subgroup analysis of the prevalence of depression, anxiety, and sleep disturbances by gender, severity, country, and hospitalization status are summarized in Table 2.
Table 2.
Subgroup analysis of depression, anxiety, and sleep disturbance prevalence
| Depression | Anxiety | Sleep disturbances | ||
|---|---|---|---|---|
| Gender | Male |
39%, 95% CI: 26–53% I 2 = 92% |
35%, 95% CI: 21–49% I 2 = 88% |
43%, 95% CI: 30–57% I 2 = 77% |
| Female |
50%, 95% CI: 38–62% I 2 = 89% |
49%, 95% CI: 37–62% I 2 = 84% |
52%, 95% CI: 41–64% I 2 = 66% |
|
| Country | China |
45%, 95% CI: 36–55% I 2 = 97% |
48%, 95% CI: 37–59% I 2 = 97% |
35%, 95% CI: 19–54% I 2 = 98% |
| Iran | 38%, 95% CI: 28–49% a | 29%, 95% CI: 20–40% a | – | |
| Turkey | – | – | 13%, 95% CI: 9–17% a | |
| Italy | 38%, 95% CI: 29–47% a | 33%, 95% CI: 24–42% a | 50%, 95% CI: 40–59% a | |
| Ecuador | 60%, 95% CI: 55–66% a | 63%, 95% CI: 58–68% a | – | |
| Hospitalization | Inpatients |
48%, 95% CI: 35–61% I 2 = 97% |
42%, 95% CI: 31–54% I 2 = 95% |
29%, 95% CI: 13–48% I 2 = 98% |
| Outpatients | 35%, 95% CI: 22–48% a | 33%, 95% CI: 21–46% a | – | |
| Severity | Mild |
33%, 95% CI: 26–39% I 2 = 86% |
29%, 95% CI: 23–36% I 2 = 82% |
20%, 95% CI: 2–49% I 2 = 80% |
| Moderate |
14%, 95% CI: 11–16% I 2 = 36% |
12%, 95% CI: 6–21% I 2 = 94% |
16%, 95% CI: 9–25% I 2 = 0% |
|
| Severe |
7%, 95% CI: 4–10% I 2 = 83% |
6%, 95% CI: 3–10% I 2 = 87% |
2%, 95% CI: 0–7% I 2 = 0% |
|
Only one study was included in this subgroup.
CI, confidence interval.
Gender subgroups
Subgroup data by gender were reported by nine studies 70 , 73 , 75 , 94 , 98 , 100 , 101 , 106 , 108 for depression prevalence, with a pooled prevalence of 39% for male and 50% for female patients (see Fig. S15, online only). Eight studies 70 , 73 , 75 , 94 , 98 , 101 , 106 , 108 reported subgroup data for anxiety prevalence, with a pooled prevalence of 35% for males and 49% for females (see Fig. S16, online only). Three studies 75 , 97 , 98 reported subgroup data for sleep disturbance, with a pooled prevalence of 43% for males and 52% for females (see Fig. S17, online only). There were no statistically significant between‐group differences in any of the gender subgroups (P = 0.24, 0.15, and 0.32 for depression, anxiety, and sleep disturbances, respectively).
Country subgroups
Twenty Chinese studies 43 , 44 , 70 , 71 , 73 , 85 , 88 , 89 , 92 , 93 , 94 , 96 , 98 , 99 , 100 , 101 , 104 , 105 , 107 , 108 reported a pooled depression prevalence of 45% from China. The depression prevalence for Italy, 75 Ecuador, 95 and Iran 106 was 38%, 60%, and 38%, respectively, as reported by one study in each subgroup (see Fig. S18, online only). Twenty‐two studies 43 , 44 , 70 , 72 , 73 , 85 , 86 , 89 , 90 , 91 , 92 , 93 , 94 , 96 , 98 , 99 , 101 , 103 , 104 , 105 , 107 , 108 reported a pooled anxiety prevalence of 48% from China. The anxiety prevalence for Italy, 75 Ecuador, 95 and Iran 106 was 33%, 63%, and 29%, respectively, as reported by one study in each subgroup (see Fig. S19, online only). Eight studies 71 , 85 , 88 , 92 , 97 , 98 , 102 , 107 reported a pooled prevalence of sleep disturbances of 35% from China. The prevalence of sleep disturbances for Turkey 74 and Italy 75 was 13% and 50%, respectively, as reported by one study in each subgroup (see Fig. S20, online only). There were significant between‐group differences for subgroup analysis by country for prevalence of depression, anxiety, and sleep disturbances (P < 0.01 for all three outcomes).
Inpatient and outpatient subgroups
Only one study 106 reported depression and anxiety prevalence for outpatients, which was 35% and 33%, respectively. These figures are lower compared with the pooled prevalence for inpatients, which was 48% (reported by 12 studies, 73 , 75 , 88 , 92 , 94 , 98 , 99 , 104 , 105 , 106 , 107 , 108 see Fig. S21, online only) and 42% (reported by 13 studies, 72 , 73 , 75 , 92 , 94 , 98 , 103 , 104 , 105 , 106 , 107 , 108 see Fig. S22, online only) for depression and anxiety, respectively; however, these differences between inpatients and outpatients were not significant (P = 0.16 and 0.28 for depression and anxiety prevalence, respectively).
There were no outpatient data reported for prevalence of sleep disturbances. The pooled prevalence of sleep disturbances was 29% for inpatients, as reported by eight studies (see Fig. S23, online only). 74 , 75 , 88 , 92 , 97 , 98 , 102 , 107
Severity subgroups
Eleven studies 44 , 85 , 89 , 94 , 95 , 96 , 98 , 99 , 100 , 107 , 108 reported the prevalence of mild, moderate, and severe depression. Additionally, one study 92 only reported the prevalence of severe depression. The pooled prevalence of mild, moderate, and severe depression was 33%, 14%, and 7%, respectively (see Fig. S24 for the criteria used for determining depression severity, online only). Thirteen studies 44 , 72 , 85 , 86 , 89 , 90 , 94 , 95 , 96 , 98 , 99 , 107 , 108 reported the prevalence of mild, moderate, and severe anxiety, with one study 92 only reporting the prevalence of severe anxiety. The pooled prevalence of mild, moderate, and severe anxiety was 29%, 12%, and 6%, respectively (see Fig. S25 for the criteria used for determining anxiety severity, online only). Two studies 98 , 107 reported the pooled prevalence of mild, moderate, and severe sleep disturbances as 20%, 16%, and 2%, respectively (see Fig. S26 for the criteria used for determining the severity of sleep disturbances, online only).
Discussion
This systematic review and meta‐analysis aimed to provide an up‐to‐date estimate of the prevalence of depression, anxiety, and sleep disturbances among COVID‐19 patients by combining the data of 31 observational studies with a total of 5153 patients. Our results showed that the overall prevalence of depression, anxiety, and sleep disturbances among COVID‐19 patients is 45%, 47%, and 34%, respectively.
These data on the prevalence of depression in COVID‐19 patients can be examined in comparison to that of prepandemic depression prevalence in hospital inpatients and outpatients, which are estimated to be 5–34% 109 and 27.0%, 110 respectively. In this meta‐analysis, we found the prevalence of depression for COVID‐19 inpatients to be 48%, which is a substantial increase compared with prepandemic depression levels. Additionally, the prevalence of depression for outpatients, estimated to be 35% based on one study, is also higher compared with the prepandemic prevalence. Furthermore, these prevalence estimates of depression, anxiety, and sleep disturbances display a substantial increase to that of the general population during the COVID‐19 pandemic, which are estimated to be 33.7%, 31.9%, 111 and 20.1%, 112 respectively.
Effect of screening tools on prevalence
We found that the screening tools used for assessing depression and anxiety had a significant effect on the resultant prevalence values. Regarding depression prevalence, both PHQ‐9 (with a cutoff of ≥5) and Zung SDS (with a cutoff of ≥50 or ≥53) yielded similar prevalence values at 52–53%. However, this prevalence estimate is substantially higher than the prevalence yielded by HADS‐D at a cutoff of ≥8 and SCL‐90 (depression subscale) at a cutoff of ≥2, which estimated the prevalence at 19–20%. This matches previous findings that determined that the difference in depression prevalence between assessments using PHQ‐9 ≥5 and HADS‐D ≥8 was around 30%. 113 Similarly, GAD‐7 (with a cutoff of ≥5) and Zung SAS (with a cutoff of ≥50) yielded higher anxiety prevalence values compared with HADS‐A (with a cutoff value of ≥8) and SCL‐90 (anxiety subscale) with a cutoff value of ≥2. One likely explanation for these observations may be due to the use of low cutoff values for PHQ‐9, GAD‐7, SAS, and SDS. Whereas previous studies had shown that the cutoffs used for HADS (≥8) were optimal, 114 using a cutoff value of 8–11 for PHQ‐945 and GAD‐7, 115 as well as 60 for SDS, 116 may increase the validity of these scales. The increased cutoff values will likely result in decreased prevalence of mental illness as assessed using these scales, potentially increasing agreement with HADS. For example, by using a cutoff value of ≥10 for the PHQ‐9, its agreement with HADS‐D ≥8 was significantly improved compared with a cutoff of ≥5. 113 For future studies, higher cutoffs should be considered to increase the validity of PHQ‐9, GAD‐7, SDS, and SAS, as well as to increase agreement with HADS.
However, it must also be noted that there were substantial differences in the sample size of different screening tool subgroups. Subgroups with higher prevalence, such as PHQ‐9 and SAS, included more studies and patients compared with subgroups with lower prevalence estimates, such as HADS and SCL‐90. Thus, it is unclear whether the significant subgroup differences we observed were valid. In addition, there was significant, serious between‐study heterogeneity in the PHQ‐9, GAD‐7, SAS, SDS, and HADS‐A subgroups. This suggests that the results from individual studies in these subgroups are inconsistent; therefore, the validity of the subgroup prevalence estimates was uncertain. These factors should be considered when interpreting the results of the subgroup analyses by screening tools, as the addition of future studies may improve between‐study consistency, increase the validity of subgroup estimates, and reduce the observed subgroup differences. 117
While there were no significant differences between the prevalence values yielded by different sleep disturbance assessment tools, the results of the subgroup analysis must be interpreted with caution due to differences in the design of PSQI and ISI questionnaires, as well as the cutoff values of PSQI. For assessing sleep disturbances, PSQI is preferred over ISI as it provides an overview of sleep quality by assessing multiple categories of sleep disturbances. By contrast, ISI is limited to insomnia and does not include items relevant to other sleep disturbances. 118 Additionally, PSQI had been shown to have an optimal cutoff of 6; 119 , 120 the 16–21 cutoff used by the included studies was typically used to detect severe forms of sleep impairment 121 and may have resulted in an underestimation of the prevalence of sleep disturbances.
Several studies used custom questionnaires or interviews to assess the prevalence of mental illnesses. While these unvalidated tools produced similar prevalence estimates compared with validated tools, these studies did not publish their questionnaire or interview items nor report the reliability and validity of their screening tools. Future investigations should adopt validated scales with optimal cutoff values or structured interviews to both increase the validity of their studies and the transparency of their methodology.
Interpretation of subgroup analyses
Given that a majority of the included studies were rapidly conducted and disseminated during the early phases of the pandemic, the patient population were often limited to those who were easily accessible by the investigators via convenience sampling. As a result, we found that a majority of the patient population were limited to Chinese and hospitalized patients. Our subgroup results for outpatients and patients originating from Italy, Ecuador, Iran, and Turkey were based on single studies. Therefore, the subgroup analyses by country and hospitalization status were not useful for detecting subgroup differences. This calls for further investigations into the mental status of outpatients and patients from non‐Chinese countries in order to provide a more complete picture of the mental impact of COVID‐19.
Our subgroup analyses by gender showed that there was no significant difference between the prevalence of depression, anxiety, and sleep disturbances in male and female patients, and there was no significant reduction in heterogeneity in both gender subgroups compared with the original analysis. In regards to the severity of depression, anxiety, and sleep disturbances, most patients only presented with mild symptoms, with a low proportion of patients suffering from severe symptoms of mental illness. Regardless, the prevalence of moderate and severe mental illness symptoms in COVID‐19 patients may be higher compared with other patient groups and the general population. For example, a previous large‐scale observational study found the prevalence of moderate and severe depression in cancer patients to be 11.3% and 3.7%, respectively, 122 as compared with 14% and 7% in COVID‐19 patients. This indicates that a similar or greater proportion of COVID‐19 patients may experience moderate or severe depression compared with patients with serious, chronic conditions such as cancer. The increase in the prevalence of moderate and severe symptoms is more evident when compared with the general population before the pandemic, which reported a prevalence of 5.1% and 1.5% for moderate and severe depression, respectively. 122 These findings indicate that the severity of mental illnesses may be increased as well in addition to the overall prevalence in COVID‐19 patients compared with other populations.
Study strengths and limitations
Since this meta‐analysis was conducted using data from early stages of the pandemic, it has several shortcomings, which must be noted. First, we observed significant between‐study heterogeneity that was not resolved by our proposed subgroup analyses, sensitivity analyses, and meta‐regressions. Second, all but two of our included studies used self‐rating scales for assessing the prevalence of mental illness. While this was likely due to local quarantine guidelines, self‐rated scales generally have lower sensitivity and specificity compared with clinician/observer−rated scales 123 or structured clinical interviews (e.g., the Structured Clinical Interview for DSM‐5). 124 Thus, our results should be considered with this limitation in mind and future studies should incorporate clinician‐rated tools or interviews, perhaps with the assistance of telemedicine technologies. 125 , 126 Lastly, there was a lack of subgroup data, which diminished the usefulness of our subgroup analyses by hospitalization status and country.
However, this study also has several notable strengths. First, we did not detect signs of publication bias as shown by funnel plots and Egger's regression analysis. In addition, our results were not substantially affected by the omission of one included study, nor were they greatly affected by the removal of preprint articles or single‐arm cohort studies. We also did not find significant differences between the pooled prevalence from validated versus unvalidated screening tools. Last of all, a majority of our studies had a low risk of bias with high response rates, validated screening tools, and appropriate statistical methods.
Clinical implications
In our subgroup analyses, we found that many COVID‐19 patients experience depression, anxiety, and/or sleep disturbances. The cause of these psychiatric disorders is likely multifactorial. One possible factor is a lack of contact with families and loved ones during quarantine or hospitalization. 127 Fear relating to the disease due to poor knowledge 128 or misinformation 13 regarding to COVID‐19, feeling of self‐blame, 129 and social stigma 130 , 131 may also facilitate the development of psychiatric disorders in COVID‐19 patients. In severe cases, COVID‐19 patients had demonstrated suicidal and self‐destructive tendencies, 132 , 133 which highlights the importance of early detection and intervention for mental health problems in this population. Hospitals should implement remote mental health screening programs and psychiatric consultations using technologies, such as telemedicine and internet‐based mental health interventions, 134 , 135 along with establishing a system allowing proper communication between hospitalized/quarantined patients and their families. 127 Improving health literacy 136 and curbing false information for both COVID‐19 patients and the general public may also help to reduce social stigma surrounding COVID‐19 patients and to improve patients’ mental health.
Our study has also demonstrated the need for further investigations into the mental health status of COVID‐19 patients. Specifically, future research should focus more on COVID‐19 outpatients who were underrepresented in this meta‐analysis because of the excessive use of convenience sampling in hospital settings. Additionally, patients from countries with a high number of cases, such as the United States, Brazil, and India, 10 should be assessed for mental disorders as well. There are currently no such studies originating from these countries as per our latest database search.
Conclusions
The objective of this systematic review and meta‐analysis was to assess the prevalence of depression, anxiety, and sleep disturbances in COVID‐19 patients. Our findings suggest that 45% of COVID‐19 patients experience depression, 47% of patients experience anxiety, and 34% of patients experience sleep disturbances. A majority of the included patients were inpatients and patients from China. We did not find any differences in prevalence between patients of different gender; however, the prevalence of depression and anxiety varied depending on the use of different screening tools. Further investigations assessing the mental health of COVID‐19 outpatients and patients from different geographical regions around the world are needed to gain a more complete picture of the psychological implications of COVID‐19 infections.
Author contributions
J.D. conceptualized and designed the methodology of the study, performed database searches, supervised and performed article screening and data extraction, performed all statistical analyses, drafted the manuscript, and critically reviewed and revised the manuscript. F.Z., W.H., Z.S., C.Y.W., O.C., E.H., and Q.K.Z. performed article screening, data extraction, and critically reviewed and revised the manuscript. All authors have read and approved the final version of the manuscript to be submitted and published. J.D. accepts responsibility for the integrity of the data analyzed.
Competing interests
The authors declare no competing interests.
Supporting information
Table S1. PRISMA checklist.
Table S2. English search strategy (MEDLINE).
Table S3. Chinese search strategy (CNKI).
Figure S1. Funnel plot, depression prevalence.
Figure S2. Sensitivity analysis, depression prevalence.
Figure S3. Subgroup analysis by study design, depression prevalence.
Figure S4. Subgroup analysis by peer‐review status, depression prevalence.
Figure S5. Subgroup analysis by validated tools, depression prevalence.
Figure S6. Funnel plot, anxiety prevalence.
Figure S7. Sensitivity analysis, anxiety prevalence.
Figure S8. Subgroup analysis by study design, anxiety prevalence.
Figure S9. Subgroup analysis by peer‐review status, anxiety prevalence.
Figure S10. Subgroup analysis by validated tools, anxiety prevalence.
Figure S11. Funnel plot, prevalence of sleep disturbances.
Figure S12. Sensitivity analysis, prevalence of sleep disturbances.
Figure S13. Subgroup analysis by study design, prevalence of sleep disturbances.
Figure S14. Subgroup analysis by validated tools, prevalence of sleep disturbances.
Figure S15. Subgroup analysis by gender, depression prevalence.
Figure S16. Subgroup analysis by gender, anxiety prevalence.
Figure S17. Subgroup analysis by gender, prevalence of sleep disturbances.
Figure S18. Subgroup analysis by country, depression prevalence.
Figure S19. Subgroup analysis by country, anxiety prevalence.
Figure S20. Subgroup analysis by country, prevalence of sleep disturbances.
Figure S21. Subgroup analysis by hospitalization status, depression prevalence.
Figure S22. Subgroup analysis by hospitalization status, anxiety prevalence.
Figure S23. Subgroup analysis by hospitalization status, prevalence of sleep disturbances.
Figure S24. Subgroup analysis by severity, depression prevalence.
Figure S25. Subgroup analysis by severity, anxiety prevalence.
Figure S26. Subgroup analysis by severity, prevalence of sleep disturbances.
Acknowledgments
The authors had received no external support or funding for the completion of this study.
References
- 1. Lotfi, M. , Hamblin M.R. & Rezaei N.. 2020. COVID‐19: transmission, prevention, and potential therapeutic opportunities. Clin. Chim. Acta 508: 254–266. [DOI] [PMC free article] [PubMed] [Google Scholar]
- 2. Zhai, P. , Ding Y., Wu X., et al. 2020. The epidemiology, diagnosis and treatment of COVID‐19. Int. J. Antimicrob. Agents 55: 105955. [DOI] [PMC free article] [PubMed] [Google Scholar]
- 3. Yuki, K. , Fujiogi M. & Koutsogiannaki S.. 2020. COVID‐19 pathophysiology: a review. Clin. Immunol. 215: 108427. [DOI] [PMC free article] [PubMed] [Google Scholar]
- 4. Zhu, N. , Zhang D., Wang W., et al. 2020. A novel coronavirus from patients with pneumonia in China, 2019. N. Engl. J. Med. 382: 727–733. [DOI] [PMC free article] [PubMed] [Google Scholar]
- 5. Lu, R. , Zhao X., Li J., et al. 2020. Genomic characterisation and epidemiology of 2019 novel coronavirus: implications for virus origins and receptor binding. Lancet 395: 565–574. [DOI] [PMC free article] [PubMed] [Google Scholar]
- 6. Liu, Y. , Gayle A.A., Wilder‐Smith A., et al. 2020. The reproductive number of COVID‐19 is higher compared to SARS coronavirus. J. Travel Med. 27. 10.1093/jtm/taaa021 [DOI] [PMC free article] [PubMed] [Google Scholar]
- 7. Petersen, E. , Koopmans M., Go U., et al. 2020. Comparing SARS‐CoV‐2 with SARS‐CoV and influenza pandemics. Lancet Infect. Dis. [DOI] [PMC free article] [PubMed] [Google Scholar]
- 8. World Health Organization . Accessed June 29, 2020. https://www.who.int/emergencies/diseases/novel-coronavirus-2019/events-as-they-happen.
- 9. Shereen, M.A. , Khan S., Kazmi A., et al. 2020. COVID‐19 infection: origin, transmission, and characteristics of human coronaviruses. J. Advert. Res. 24: 91–98. [DOI] [PMC free article] [PubMed] [Google Scholar]
- 10. COVID‐19 Map . Johns Hopkins Coronavirus Resource Center. Accessed July 1, 2020. https://coronavirus.jhu.edu/map.html.
- 11. Khan, S. , Siddique R., Li H., et al. 2020. Impact of coronavirus outbreak on psychological health. J. Glob. Health 10: 010331. [DOI] [PMC free article] [PubMed] [Google Scholar]
- 12. Kim, H.‐C. , Yoo S.‐Y., Lee B.‐H., et al. 2018. Psychiatric findings in suspected and confirmed middle East respiratory syndrome patients quarantined in hospital: a retrospective chart analysis. Psychiatry Investig. 15: 355–360. [DOI] [PMC free article] [PubMed] [Google Scholar]
- 13. Mian, A. & Khan S.. 2020. Coronavirus: the spread of misinformation. BMC Med. 18: 89. [DOI] [PMC free article] [PubMed] [Google Scholar]
- 14. Zarocostas, J. 2020. How to fight an infodemic. Lancet 395: 676. [DOI] [PMC free article] [PubMed] [Google Scholar]
- 15. Sommer, I.E. & Bakker P.R.. 2020. What can psychiatrists learn from SARS and MERS outbreaks? Lancet Psychiatry 7: 565–566. [DOI] [PMC free article] [PubMed] [Google Scholar]
- 16. Hatch, R. , Young D., Barber V., et al. 2018. Anxiety, depression and post traumatic stress disorder after critical illness: a UK‐wide prospective cohort study. Crit. Care 22: 310. [DOI] [PMC free article] [PubMed] [Google Scholar]
- 17. Jackson, P. & Khan A.. 2015. Delirium in critically ill patients. Crit. Care Clin. 31: 589–603. [DOI] [PubMed] [Google Scholar]
- 18. Adhikari, S.P. , Meng S., Wu Y.‐J., et al. 2020. Epidemiology, causes, clinical manifestation and diagnosis, prevention and control of coronavirus disease (COVID‐19) during the early outbreak period: a scoping review. Infect. Dis. Poverty 9: 29. [DOI] [PMC free article] [PubMed] [Google Scholar]
- 19. Petrosillo, N. , Viceconte G., Ergonul O., et al. 2020. COVID‐19, SARS and MERS: are they closely related? Clin. Microbiol. Infect. 26: 729–734. [DOI] [PMC free article] [PubMed] [Google Scholar]
- 20. Kotfis, K. , Williams Roberson S., Wilson J.E., et al. 2020. COVID‐19: ICU delirium management during SARS‐CoV‐2 pandemic. Crit. Care 24: 176. [DOI] [PMC free article] [PubMed] [Google Scholar]
- 21. Arya, A. , Buchman S., Gagnon B., et al. 2020. Pandemic palliative care: beyond ventilators and saving lives. CMAJ 192: E400–E404. [DOI] [PMC free article] [PubMed] [Google Scholar]
- 22. Dennis, M. , Kadri A. & Coffey J.. 2012. Depression in older people in the general hospital: a systematic review of screening instruments. Age Ageing 41: 148–154. [DOI] [PubMed] [Google Scholar]
- 23. Ramezani, M. , Simani L., Karimialavijeh E., et al. 2020. The role of anxiety and cortisol in outcomes of patients with Covid‐19. Basic Clin. Neurosci. 11: 179–184. [DOI] [PMC free article] [PubMed] [Google Scholar]
- 24. Jansen, L. , van Schijndel M., van Waarde J., et al. 2018. Health‐economic outcomes in hospital patients with medical‐psychiatric comorbidity: a systematic review and meta‐analysis. PLoS One 13: e0194029. [DOI] [PMC free article] [PubMed] [Google Scholar]
- 25. Churchwell, K. & Roll J.T.. 2020. Surprise medical billing: compelling need to address uncertainty, anxiety, and financial peril for patients. Circulation 142: e1–e2. [DOI] [PubMed] [Google Scholar]
- 26. Mak, I.W.C. , Chu C.M., Pan P.C., et al. 2009. Long‐term psychiatric morbidities among SARS survivors. Gen. Hosp. Psychiatry 31: 318–326. [DOI] [PMC free article] [PubMed] [Google Scholar]
- 27. Trautmann, S. , Rehm J. & Wittchen H.‐U.. 2016. The economic costs of mental disorders: do our societies react appropriately to the burden of mental disorders? EMBO Rep. 17: 1245–1249. [DOI] [PMC free article] [PubMed] [Google Scholar]
- 28. Rogers, J.P. , Chesney E., Oliver D., et al. 2020. Psychiatric and neuropsychiatric presentations associated with severe coronavirus infections: a systematic review and meta‐analysis with comparison to the COVID‐19 pandemic. Lancet Psychiatry 7: 611–627. [DOI] [PMC free article] [PubMed] [Google Scholar]
- 29. Fu, R. & Zhang Y.. 2020. Case report of a patient with suspected COVID‐19 with depression and fever in an epidemic stress environment. Gen. Psych. 33: e100218. [DOI] [PMC free article] [PubMed] [Google Scholar]
- 30. Higgins, J.P.T. & Green S.. 2008. Cochrane Handbook for Systematic Reviews of Interventions. New Jersey: Wiley. [Google Scholar]
- 31. Moher, D. , Liberati A., Tetzlaff J., et al. 2009. Preferred reporting items for systematic reviews and meta‐analyses: the PRISMA statement. BMJ 339: b2535. [DOI] [PMC free article] [PubMed] [Google Scholar]
- 32. Ouzzani, M. , Hammady H., Fedorowicz Z., et al. 2016. Rayyan—a web and mobile app for systematic reviews. Syst. Rev. 5: 210. [DOI] [PMC free article] [PubMed] [Google Scholar]
- 33. Liberati, A. , Altman D.G., Tetzlaff J., et al. 2009. The PRISMA statement for reporting systematic reviews and meta‐analyses of studies that evaluate healthcare interventions: explanation and elaboration. BMJ 339: b2700. [DOI] [PMC free article] [PubMed] [Google Scholar]
- 34. Walker, H.K. , Hall W.D. & Hurst J.W.. 1990. Clinical Methods: The History, Physical, and Laboratory Examinations. Boston, MA: Butterworth‐Heinemann. [PubMed] [Google Scholar]
- 35. Zung, W.W. 1965. A self‐rating depression scale. Arch. Gen. Psychiatry 12: 63–70. [DOI] [PubMed] [Google Scholar]
- 36. Zung, W.W.K. 1971. A rating instrument for anxiety disorders. Psychosomatics 12: 371–379. [DOI] [PubMed] [Google Scholar]
- 37. Spitzer, R.L. , Kroenke K., Williams J.B.W., et al. 2006. A brief measure for assessing generalized anxiety disorder: the GAD‐7. Arch. Intern. Med. 166: 1092–1097. [DOI] [PubMed] [Google Scholar]
- 38. Kroenke, K. , Spitzer R.L. & Williams J.B.. 2001. The PHQ‐9: validity of a brief depression severity measure. J. Gen. Intern. Med. 16: 606–613. [DOI] [PMC free article] [PubMed] [Google Scholar]
- 39. Snaith, R.P. 2003. The hospital anxiety and depression scale. Health Qual. Life Outcomes 1: 29. [DOI] [PMC free article] [PubMed] [Google Scholar]
- 40. Derogatis, L.R. & Cleary P.A.. 1977. Confirmation of the dimensional structure of the SCL‐90: a study in construct validation. J. Clin. Psychol. 33: 981–989. [Google Scholar]
- 41. Buysse, D.J. , Reynolds 3rd C.F., Monk T.H., et al. 1989. The Pittsburgh Sleep Quality Index: a new instrument for psychiatric practice and research. Psychiatry Res. 28: 193–213. [DOI] [PubMed] [Google Scholar]
- 42. Bastien, C.H. , Vallières A. & Morin C.M.. 2001. Validation of the Insomnia Severity Index as an outcome measure for insomnia research. Sleep Med. 2: 297–307. [DOI] [PubMed] [Google Scholar]
- 43. Qi, R. , Chen W., Liu S., et al. 2020. Psychological morbidities and fatigue in patients with confirmed COVID‐19 during disease outbreak: prevalence and associated biopsychosocial risk factors. 10.1101/2020.05.08.20031666 [DOI]
- 44. Zhang, J.L. , Sun R. & Yang J.. 2020. Anxiety and depression in elderly patients during epidemic of coronavirus disease 2019 and its influencing factors. Chin. J. Mult. Organ Dis. Elderly 19: 246–250. [Google Scholar]
- 45. Dunstan, D.A. & Scott N.. 2019. Clarification of the cut‐off score for Zung's self‐rating depression scale. BMC Psychiatry 19: 177. [DOI] [PMC free article] [PubMed] [Google Scholar]
- 46. Wang, C.F. , Cai Z.H. & Xu Q.. 2009. Evaluation analysis of self‐rating disorder scale in 1,340 people. Chin. J. Nervous Mental Dis. 12: 267–268. [Google Scholar]
- 47. Lee, H.C. , Chiu H.F., Wing Y.K., et al. 1994. The Zung Self‐rating Depression Scale: screening for depression among the Hong Kong Chinese elderly. J. Geriatr. Psychiatry Neurol. 7: 216–220. [DOI] [PubMed] [Google Scholar]
- 48. Zhang, Y. , Liu R., Li G., et al. 2015. The reliability and validity of a Chinese‐version Short Health Anxiety Inventory: an investigation of university students. Neuropsychiatr. Dis. Treat. 11: 1739–1747. [DOI] [PMC free article] [PubMed] [Google Scholar]
- 49. Lindsay, W.R. & Michie A.M.. 1988. Adaptation of the Zung self‐rating anxiety scale for people with a mental handicap. J. Ment. Defic. Res. 32(Pt 6): 485–490. [DOI] [PubMed] [Google Scholar]
- 50. Pang, Z. , Tu D. & Cai Y.. 2019. Psychometric properties of the SAS, BAI, and S‐AI in Chinese university students. Front. Psychol. 10: 93. [DOI] [PMC free article] [PubMed] [Google Scholar]
- 51. Tong, X. , An D., McGonigal A., et al. 2016. Validation of the Generalized Anxiety Disorder‐7 (GAD‐7) among Chinese people with epilepsy. Epilepsy Res. 120: 31–36. [DOI] [PubMed] [Google Scholar]
- 52. Zeng, Q.Z. , He Y.L., Liu H., et al. 2013. Reliability and validity of Chinese version of the Generalized Anxiety Disorder 7‐item (GAD‐7) scale in screening anxiety disorders in outpatients from traditional Chinese internal department. Chin. Ment. Health J. 27: 163–168. [Google Scholar]
- 53. Li, W. , Lukai D., Rongjing D., et al. 2014. GW25‐e4488 The value of Chinese version GAD‐7 and PHQ‐9 to screen anxiety and depression in cardiovascular outpatients. J. Am. Coll. Cardiol. 64: C222. [Google Scholar]
- 54. Naeinian, M. , Shaeiri M., Sharif M., et al. 2011. To study reliability and validity for a brief measure for assessing Generalized Anxiety Disorder (GAD‐7). Sci. J. Clin. Psychol. Personal. 2: 41–50. [Google Scholar]
- 55. García‐Campayo, J. , Zamorano E., Ruiz M.A., et al. 2010. Cultural adaptation into Spanish of the generalized anxiety disorder‐7 (GAD‐7) scale as a screening tool. Health Qual. Life Outcomes 8: 8. [DOI] [PMC free article] [PubMed] [Google Scholar]
- 56. Wang, W. , Bian Q., Zhao Y., et al. 2014. Reliability and validity of the Chinese version of the Patient Health Questionnaire (PHQ‐9) in the general population. Gen. Hosp. Psychiatry 36: 539–544. [DOI] [PubMed] [Google Scholar]
- 57. Yeung, A. , Fung F., Yu S.‐C., et al. 2008. Validation of the Patient Health Questionnaire‐9 for depression screening among Chinese Americans. Compr. Psychiatry 49: 211–217. [DOI] [PMC free article] [PubMed] [Google Scholar]
- 58. Dadfar, M. , Kalibatseva Z. & Lester D.. 2018. Reliability and validity of the Farsi version of the Patient Health Questionnaire‐9 (PHQ‐9) with Iranian psychiatric outpatients. Trends Psychiatry Psychother. 40: 144–151. [DOI] [PubMed] [Google Scholar]
- 59. Zhong, Q. , Gelaye B., Fann J.R., et al. 2014. Cross‐cultural validity of the Spanish version of PHQ‐9 among pregnant Peruvian women: a Rasch item response theory analysis. J. Affect. Disord. 158: 148–153. [DOI] [PMC free article] [PubMed] [Google Scholar]
- 60. Wulsin, L. , Somoza E. & Heck J.. 2002. The feasibility of using the Spanish PHQ‐9 to screen for depression in primary care in Honduras. Prim. Care Companion J. Clin. Psychiatry 4: 191–195. [DOI] [PMC free article] [PubMed] [Google Scholar]
- 61. Leung, C.M. , Wing Y.K., Kwong P.K., et al. 1999. Validation of the Chinese‐Cantonese version of the hospital anxiety and depression scale and comparison with the Hamilton Rating Scale of Depression. Acta Psychiatr. Scand. 100: 456–461. [DOI] [PubMed] [Google Scholar]
- 62. Yang, Y. , Ding R., Hu D., et al. 2014. Reliability and validity of a Chinese version of the HADS for screening depression and anxiety in psycho‐cardiological outpatients. Compr. Psychiatry 55: 215–220. [DOI] [PubMed] [Google Scholar]
- 63. Chen, I.‐H. , Lin C.‐Y., Zheng X., et al. 2020. Assessing mental health for China's police: psychometric features of the Self‐Rating Depression Scale and Symptom Checklist 90‐Revised. Int. J. Environ. Res. Public Health 17. http://doi.10.3390/ijerph17082737 [DOI] [PMC free article] [PubMed] [Google Scholar]
- 64. Zhang, J. & Zhang X.. 2013. Chinese college students’ SCL‐90 scores and their relations to the college performance. Asian J. Psychiatr. 6: 134–140. [DOI] [PubMed] [Google Scholar]
- 65. Yu, Y. , Wan C., Huebner E.S., et al. 2019. Psychometric properties of the symptom check list 90 (SCL‐90) for Chinese undergraduate students. J. Ment. Health 28: 213–219. [DOI] [PubMed] [Google Scholar]
- 66. Guo, S. , Sun W., Liu C., et al. 2016. Structural validity of the Pittsburgh Sleep Quality Index in Chinese undergraduate students. Front. Psychol. 7: 1126. [DOI] [PMC free article] [PubMed] [Google Scholar]
- 67. Ho, R.T.H. & Fong T.C.T.. 2014. Factor structure of the Chinese version of the Pittsburgh sleep quality index in breast cancer patients. Sleep Med. 15: 565–569. [DOI] [PubMed] [Google Scholar]
- 68. Tsai, P.‐S. , Wang S.‐Y., Wang M.‐Y., et al. 2005. Psychometric evaluation of the Chinese version of the Pittsburgh Sleep Quality Index (CPSQI) in primary insomnia and control subjects. Qual. Life Res. 14: 1943–1952. [DOI] [PubMed] [Google Scholar]
- 69. Badiee Aval Baghyahi, S. , Gao Y., Bahrami Taghanaki H.R., et al. 2013. 2738 – Reliability and validity of the Chinese translation of insomnia severity index (C‐ISI) in Chinese patients with insomnia. Eur. Psychiatry 28: 1.21920709 [Google Scholar]
- 70. Cheng , J. , Tan X., Zhang L., et al. 2020. Research on the psychological status and influencing factors of novel coronavirus pneumonia patients and people under medical observation. J. Nurs. Adm. 20. [Google Scholar]
- 71. Huang, S. , Xu X., Xu M., et al. 2020. Investigation and intervention of psychological status of COVID‐19 patients. Mil. Med. Sci. 44: 307–309. [Google Scholar]
- 72. Liu, X.Y. & Yu S.X.. 2020. Analysis of psychological characteristics of COVID‐19 patients and nursing interventions. Med. J. Natl. Defend. Forces Southwest China 30: 496–499. [Google Scholar]
- 73. Xue, Y.L. , Liu X. & Dong G.F.. 2020. [Discussion about the importance of psychological care for patients with 2019 novel coronavirus pneumonia]. J. Colorectal Anal Surg. 26: 183–184. [Google Scholar]
- 74. Karadaş, Ö. , Öztürk B. & Sonkaya A.R.. 2020. A prospective clinical study of detailed neurological manifestations in patients with COVID‐19. Neurol. Sci. 41: 1991–1995. [DOI] [PMC free article] [PubMed] [Google Scholar]
- 75. Liguori, C. , Pierantozzi M., Spanetta M., et al. 2020. Subjective neurological symptoms frequently occur in patients with SARS‐CoV2 infection. Brain Behav. Immun. 88: 11–16 [DOI] [PMC free article] [PubMed] [Google Scholar]
- 76. Modesti, P.A. , Reboldi G., Cappuccio F.P., et al. 2016. Panethnic differences in blood pressure in Europe: a systematic review and meta‐analysis. PLoS One 11: e0147601. [DOI] [PMC free article] [PubMed] [Google Scholar]
- 77. Pappa, S. , Ntella V., Giannakas T., et al. 2020. Prevalence of depression, anxiety, and insomnia among healthcare workers during the COVID‐19 pandemic: a systematic review and meta‐analysis. Brain Behav. Immun. 88: 901–907. [DOI] [PMC free article] [PubMed] [Google Scholar]
- 78. Fleiss, J.L. 1993. The statistical basis of meta‐analysis. Stat. Methods Med. Res. 2: 121–145. [DOI] [PubMed] [Google Scholar]
- 79. Barendregt, J.J. , Doi S.A., Lee Y.Y., et al. 2013. Meta‐analysis of prevalence. J. Epidemiol. Community Health 67: 974–978. [DOI] [PubMed] [Google Scholar]
- 80. Higgins, J.P.T. , Thompson S.G., Deeks J.J., et al. 2003. Measuring inconsistency in meta‐analyses. BMJ 327: 557–560. [DOI] [PMC free article] [PubMed] [Google Scholar]
- 81. Viechtbauer, W. 2010. Conducting meta‐analyses in R with the metafor package. J. Stat. Softw. 36. 10.18637/jss.v036.i03 [DOI] [Google Scholar]
- 82. Egger, M. , Davey Smith G., Schneider M., et al. 1997. Bias in meta‐analysis detected by a simple, graphical test. BMJ 315: 629–634. [DOI] [PMC free article] [PubMed] [Google Scholar]
- 83. Sterne, J.A. & Egger M.. 2001. Funnel plots for detecting bias in meta‐analysis: guidelines on choice of axis. J. Clin. Epidemiol. 54: 1046–1055. [DOI] [PubMed] [Google Scholar]
- 84. Mavridis, D. & Salanti G.. 2014. How to assess publication bias: funnel plot, trim‐and‐fill method and selection models. Evid. Based Ment. Health 17: 30. [DOI] [PubMed] [Google Scholar]
- 85. Cao, J. , Wen M., Shi Y., et al. 2020. Prevalence and factors associated with anxiety and depression in patients with coronavirus disease 2019 (COVID‐19). J. Nurs. Sci. 35: 15–17. [Google Scholar]
- 86. Cheng, L. , Zheng L., Yan S., et al. 2020. Anxiety status and related factors in patients with coronavirus disease 2019. Zhejiang Med. 42: 315–317. [Google Scholar]
- 87. Guo, Q. , Zheng Y., Shi J., et al. 2020. Immediate psychological distress in quarantined patients with COVID‐19 and its association with peripheral inflammation: a mixed‐method study. Brain Behav. Immun. 88: 17–27. [DOI] [PMC free article] [PubMed] [Google Scholar]
- 88. He, X. , Liu Q., Yang J., et al. 2020. The sleep quality of patients with coronavirus disease 2019 in Fangcang hospital and its related influencing factors. Chin. Clin. Nurs. 12: 190–195. [Google Scholar]
- 89. Kuang, C. , Li A., Chen T., et al. 2020. [Analysis and investigation of anxiety and depression in patients with novel coronavirus during hospitalization]. Lingnan J. Emerg. Med. 25: 116–117. [Google Scholar]
- 90. Li, W. , Huang Y., Wang C., et al. 2020. Anxiety investigation among COVID‐19 patients in a cabin hospital. China J. Health Psychol. Accepted. [Google Scholar]
- 91. Mi, W. & Yu J.. 2020. [The application of clinical care pathways in novel coronavirus patients]. Anhui Med. J. 41: 376–378. [Google Scholar]
- 92. Wang, R. , Li J., Mei J., et al. 2020. Research on the suicide risk, sleep, psychological status and influencing factors of coronavirus disease 2019 patients. J. Third Mil. Med. Univ. 14: 1462–1468. 10.16016/j.1000-5404.202003229. [DOI] [Google Scholar]
- 93. Kong, X. , Zheng K., Tang M., et al. 2020. Prevalence and factors associated with depression and anxiety of hospitalized patients with COVID‐19. 10.1101/2020.03.24.20043075 [DOI]
- 94. Nie, X.‐D. , Wang Q., Wang M.‐N., et al. 2020. Anxiety and depression and its correlates in patients with coronavirus disease 2019 in Wuhan. Int. J. Psychiatry Clin. Pract. 1–6. 10.1080/13651501.2020.1791345 [DOI] [PubMed] [Google Scholar]
- 95. Paz, C. , Mascialino G., Adana‐Díaz L., et al. 2020. Anxiety and depression in patients with confirmed and suspected COVID‐19 in Ecuador. Psychiatry Clin. Neurosci. http://doi.10.1111/pcn.13106 [DOI] [PMC free article] [PubMed] [Google Scholar]
- 96. Zhang, J. , Lu H., Zeng H., et al. 2020. The differential psychological distress of populations affected by the COVID‐19 pandemic. Brain Behav. Immun. 87: 49–50. [DOI] [PMC free article] [PubMed] [Google Scholar]
- 97. Wang, Y. , Zhu L.‐Y., Ma Y.‐F., et al. 2020. Association of insomnia disorder with sociodemographic factors and poor mental health in COVID‐19 inpatients in China. Sleep Med. 75: 282–286. [DOI] [PMC free article] [PubMed] [Google Scholar]
- 98. Hu, Y. , Chen Y., Zheng Y., et al. 2020. Factors related to mental health of inpatients with COVID‐19 in Wuhan, China. Brain Behav. Immun. 89: 587–593. [DOI] [PMC free article] [PubMed] [Google Scholar]
- 99. Zhao, Q. , Hu C.H., Feng R.J., et al. 2020. Investigation of the mental health of patients with COVID‐19. Chin. J. Neurol. 53: 432–436. [Google Scholar]
- 100. Ma, Y.‐F. , Li W., Deng H.‐B., et al. 2020. Prevalence of depression and its association with quality of life in clinically stable patients with COVID‐19. J. Affect. Disord. 275: 145–148. [DOI] [PMC free article] [PubMed] [Google Scholar]
- 101. Zhang, J. , Yang Z., Wang X., et al. 2020. The relationship between resilience, anxiety and depression among patients with mild symptoms of COVID‐19 in China: a cross‐sectional study. J. Clin. Nurs. 29: 4020–4029. [DOI] [PMC free article] [PubMed] [Google Scholar]
- 102. Zhu, X.P. , Zhao N., Jiang Y., et al. 2020. [Changes in sleep quality of patients with novel coronavirus pneumonia]. J. Clin. Anesthesiol. 36: 490–491. [Google Scholar]
- 103. Li, L. , Li B.B., Zhang B.Y., et al. 2020. Anxiety status of hospitalized COVID‐19 patients. Chin. J. Orthop. Trauma 22: 577–580. [Google Scholar]
- 104. Wang, H. , Huang L.H., Hu L.H., et al. 2020. Psychological stress status and its influencing factors among inpatients with COVID‐19. J. Nurs. Sci. 35: 75–79. [Google Scholar]
- 105. Qin, X.M. , Shu K.L., Wang M., et al. 2020. Mental health status of patients with coronavirus disease 2019 in Changsha. J. Cent. South Univ. (Med. Sci.) 45: 657–664. [DOI] [PubMed] [Google Scholar]
- 106. Zarghami, A. , Farjam M., Fakhraei B., et al. 2020. A report of the telepsychiatric evaluation of SARS‐CoV‐2 patients. Telemed. J. E. Health 10.1089/tmj.2020.0125 [DOI] [PubMed] [Google Scholar]
- 107. Liu, S.S. , Luo S., Liu M., et al. 2020. Psychological analysis of 15 COVID‐19 patients and exploration of psychological intervention strategies. Health Res. 40: 268–272. [Google Scholar]
- 108. Guo, Q. , Zheng Y., Shi J., et al. 2020. Immediate psychological distress in quarantined patients with COVID‐19 and its association with peripheral inflammation: a mixed‐method study. Brain Behav. Immun. 88: 17–27. [DOI] [PMC free article] [PubMed] [Google Scholar]
- 109. Walker, J. , Burke K., Wanat M., et al. 2018. The prevalence of depression in general hospital inpatients: a systematic review and meta‐analysis of interview‐based studies. Psychol. Med. 48: 2285–2298. [DOI] [PubMed] [Google Scholar]
- 110. Wang, J. , Wu X., Lai W., et al. 2017. Prevalence of depression and depressive symptoms among outpatients: a systematic review and meta‐analysis. BMJ Open 7: e017173. [DOI] [PMC free article] [PubMed] [Google Scholar]
- 111. Salari, N. , Hosseinian‐Far A., Jalali R., et al. 2020. Prevalence of stress, anxiety, depression among the general population during the COVID‐19 pandemic: a systematic review and meta‐analysis. Glob. Health 16: 57. [DOI] [PMC free article] [PubMed] [Google Scholar]
- 112. Lin, L.‐Y. , Wang J., Ou‐Yang X.‐Y., et al. 2020. The immediate impact of the 2019 novel coronavirus (COVID‐19) outbreak on subjective sleep status. Sleep Med. 10.1016/j.sleep.2020.05.018. [DOI] [PMC free article] [PubMed] [Google Scholar]
- 113. Hansson, M. , Chotai J., Nordstöm A., et al. 2009. Comparison of two self‐rating scales to detect depression: HADS and PHQ‐9. Br. J. Gen. Pract. 59: e283–e288. [DOI] [PMC free article] [PubMed] [Google Scholar]
- 114. Olssøn, I. , Mykletun A. & Dahl A.A.. 2005. The Hospital Anxiety and Depression Rating Scale: a cross‐sectional study of psychometrics and case finding abilities in general practice. BMC Psychiatry 5: 46. [DOI] [PMC free article] [PubMed] [Google Scholar]
- 115. Johnson, S.U. , Ulvenes P.G., Øktedalen T., et al. 2019. Psychometric properties of the General Anxiety Disorder 7‐Item (GAD‐7) Scale in a heterogeneous psychiatric sample. Front. Psychol. 10: 1713. [DOI] [PMC free article] [PubMed] [Google Scholar]
- 116. Manea, L. , Gilbody S. & McMillan D.. 2012. Optimal cut‐off score for diagnosing depression with the Patient Health Questionnaire (PHQ‐9): a meta‐analysis. CMAJ 184: E191–E196. [DOI] [PMC free article] [PubMed] [Google Scholar]
- 117. Richardson, M. , Garner P. & Donegan S.. 2019. Interpretation of subgroup analyses in systematic reviews: a tutorial. Clin. Epidemiol. Glob. Health 7: 192–198. [Google Scholar]
- 118. Smith, M.T. & Wegener S.T.. 2003. Measures of sleep: the Insomnia Severity Index, Medical Outcomes Study (MOS) Sleep Scale, Pittsburgh Sleep Diary (PSD), and Pittsburgh Sleep Quality Index (PSQI). Arthritis Rheum. 49: S184–S196. [Google Scholar]
- 119. Dietch, J.R. , Taylor D.J., Sethi K., et al. 2016. Psychometric evaluation of the PSQI in U.S. college students. J. Clin. Sleep Med. 12: 1121–1129. [DOI] [PMC free article] [PubMed] [Google Scholar]
- 120. Salahuddin, M. , Maru T.T., Kumalo A., et al. 2017. Validation of the Pittsburgh Sleep Quality Index in community dwelling Ethiopian adults. Health Qual. Life Outcomes 15: 58. [DOI] [PMC free article] [PubMed] [Google Scholar]
- 121. Santhosh Pai, B. H. , Chandran N. & Prabhu D.. 2020. Sleeplessness in patients with end‐stage renal disease undergoing dialysis therapy in a tertiary care center. Int. J. Cont. Med. Res. 10.21276/ijcmr.2020.7.6.16. [DOI] [Google Scholar]
- 122. Hinz, A. , Mehnert A., Kocalevent R.‐D., et al. 2016. Assessment of depression severity with the PHQ‐9 in cancer patients and in the general population. BMC Psychiatry 16: 22. [DOI] [PMC free article] [PubMed] [Google Scholar]
- 123. Möller, H.J. 2000. Rating depressed patients: observer‐ vs self‐assessment. Eur. Psychiatry 15: 160–172. [DOI] [PubMed] [Google Scholar]
- 124. Stuart, A.L. , Pasco J.A., Jacka F.N., et al. 2014. Comparison of self‐report and structured clinical interview in the identification of depression. Compr. Psychiatry 55: 866–869. [DOI] [PubMed] [Google Scholar]
- 125. Doarn, C.R. 2018. Telemedicine and psychiatry—a natural match. Mhealth 4: 60. [DOI] [PMC free article] [PubMed] [Google Scholar]
- 126. Kannarkat, J.T. , Smith N.N. & McLeod‐Bryant S.A.. 2020. Mobilization of telepsychiatry in response to COVID‐19—moving toward 21 century access to care. Adm. Policy Ment. Health 47: 489–491. [DOI] [PMC free article] [PubMed] [Google Scholar]
- 127. Dubey, S. , Biswas P., Ghosh R., et al. 2020. Psychosocial impact of COVID‐19. Diabetes Metab. Syndr. 14: 779–788. [DOI] [PMC free article] [PubMed] [Google Scholar]
- 128. Paakkari, L. & Okan O.. 2020. COVID‐19: health literacy is an underestimated problem. Lancet Public Health 5: e249–e250. [DOI] [PMC free article] [PubMed] [Google Scholar]
- 129. Belen, H. 2020. Self‐blame regret, fear of COVID‐19 and mental health during post‐peak pandemic. Research Square. 10.21203/rs.3.rs-56485/v1 [DOI] [Google Scholar]
- 130. Sotgiu, G. & Dobler C.C.. 2020. Social stigma in the time of coronavirus disease 2019. Eur. Respir. J. 56: 2002461. [DOI] [PMC free article] [PubMed] [Google Scholar]
- 131. Bagcchi, S. 2020. Stigma during the COVID‐19 pandemic. Lancet Infect. Dis. 20: 782. [DOI] [PMC free article] [PubMed] [Google Scholar]
- 132. Liu, Y. , Cao L., Li X., et al. 2020. Awareness of mental health problems in patients with coronavirus disease 19 (COVID‐19): a lesson from an adult man attempting suicide. Asian J. Psychiatr. 51: 102106. [DOI] [PMC free article] [PubMed] [Google Scholar]
- 133. Goyal, K. , Chauhan P., Chhikara K., et al. 2020. Fear of COVID 2019: first suicidal case in India! Asian J. Psychiatr. 49: 101989. [DOI] [PMC free article] [PubMed] [Google Scholar]
- 134. Zhou, X. , Snoswell C.L., Harding L.E., et al. 2020. The role of telehealth in reducing the mental health burden from COVID‐19. Telemed. J. E. Health 26: 377–379. [DOI] [PubMed] [Google Scholar]
- 135. Qiu, J. , Shen B., Zhao M., et al. 2020. A nationwide survey of psychological distress among Chinese people in the COVID‐19 epidemic: implications and policy recommendations. Gen. Psychiatr. 33: e100213. [DOI] [PMC free article] [PubMed] [Google Scholar]
- 136. Kontoangelos, K. , Economou M. & Papageorgiou C.. 2020. Mental health effects of COVID‐19 pandemia: a review of clinical and psychological traits. Psychiatry Investig. 17: 491–505. [DOI] [PMC free article] [PubMed] [Google Scholar]
Associated Data
This section collects any data citations, data availability statements, or supplementary materials included in this article.
Supplementary Materials
Table S1. PRISMA checklist.
Table S2. English search strategy (MEDLINE).
Table S3. Chinese search strategy (CNKI).
Figure S1. Funnel plot, depression prevalence.
Figure S2. Sensitivity analysis, depression prevalence.
Figure S3. Subgroup analysis by study design, depression prevalence.
Figure S4. Subgroup analysis by peer‐review status, depression prevalence.
Figure S5. Subgroup analysis by validated tools, depression prevalence.
Figure S6. Funnel plot, anxiety prevalence.
Figure S7. Sensitivity analysis, anxiety prevalence.
Figure S8. Subgroup analysis by study design, anxiety prevalence.
Figure S9. Subgroup analysis by peer‐review status, anxiety prevalence.
Figure S10. Subgroup analysis by validated tools, anxiety prevalence.
Figure S11. Funnel plot, prevalence of sleep disturbances.
Figure S12. Sensitivity analysis, prevalence of sleep disturbances.
Figure S13. Subgroup analysis by study design, prevalence of sleep disturbances.
Figure S14. Subgroup analysis by validated tools, prevalence of sleep disturbances.
Figure S15. Subgroup analysis by gender, depression prevalence.
Figure S16. Subgroup analysis by gender, anxiety prevalence.
Figure S17. Subgroup analysis by gender, prevalence of sleep disturbances.
Figure S18. Subgroup analysis by country, depression prevalence.
Figure S19. Subgroup analysis by country, anxiety prevalence.
Figure S20. Subgroup analysis by country, prevalence of sleep disturbances.
Figure S21. Subgroup analysis by hospitalization status, depression prevalence.
Figure S22. Subgroup analysis by hospitalization status, anxiety prevalence.
Figure S23. Subgroup analysis by hospitalization status, prevalence of sleep disturbances.
Figure S24. Subgroup analysis by severity, depression prevalence.
Figure S25. Subgroup analysis by severity, anxiety prevalence.
Figure S26. Subgroup analysis by severity, prevalence of sleep disturbances.