Abstract
Objective
Efficiency of preantral follicle culture in vitro is low and is dependent on species, development stage, and follicle‐stimulating hormone (FSH) concentration. Here, we optimized the preantral follicle in vitro culture system in mice.
Methods
The primary follicles (PM follicles, 80‐100 μm diameter ) and early secondary follicles (ES follicles, 110‐130 μm diameter) isolated from 14‐day female mice were cultured in mediums containing 10 mIU/mL or 100 mIU/mL r‐FSH. The follicle growth and oocyte maturation were observed. Estradiol (E2) was detected by ELISA. FSH receptor (FSHR), Ki‐67, 3β‐HSD, CYP17, and CYP19 levels were detected by immunofluorescence and Western blot.
Results
The antrum formation and oocyte maturation rates of ES follicles were significantly higher than those of PM follicles (P < .05). They were also significantly higher in ES follicles with 100 mIU/mL r‐FSH than with 10 mIU/mL r‐FSH (P < .05). A higher FSHR level was found in ES follicles. Meanwhile, with 10 mIU/mL r‐FSH, the ES follicles exhibited a pattern of flat growth, whereas a pattern of stereoscopic spatial growth was observed with 100 mIU/mL r‐FSH. The 100 mIU/mL r‐FSH stimulated granulosa cell proliferation more significantly than 10 mIU/mL r‐FSH. Moreover, FSH significantly promoted ES follicle granulosa cell proliferation compared to PM follicular granulosa cells. The secretion of E2 and the expressions of 3β‐HSD, CYP 17, and CYP 19 in ES follicles with 100 mIU/mL r‐FSH were significantly higher than those with 10 mIU/mL r‐FSH.
Conclusions
The 100 mIU/mL r‐FSH ideally promotes the development of ES follicles, whose growth pattern can more reasonably simulate the growth of follicles in vivo.
Keywords: early secondary follicles, FSH, FSHR, primary follicles, steroid hormone synthesis
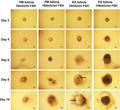
Growth and development of PM follicles and ES follicles in vitro. Scale bar: 100 μm. Arrows indicate follicular antrum. Day 2, follicles that adhered to the wall. Day 4, follicles with granulose cells breaking through the basement membrane. Day 6, follicles with granulose cells bulging. Day 8, antral follicles. Day 10, follicles close to maturity.
1. INTRODUCTION
The culture systems of preantral follicle include two‐dimensional culture and three‐dimensional culture. Two‐dimensional culture system is commonly used in mouse preantral follicle culture. 1 , 2 , 3 Since the two‐dimensional culture system does not require encapsulation of follicles, the operation is relatively simple. Therefore, this culture system can not only be used to expand the source of available oocytes, but also become a good research model for predicting premature ovarian failure and screening ovarian toxic substances, to reduce the use of experimental animals and improve animal welfare. 2 Although the in vitro culture of preantral follicles of mice has achieved high birth rates in several studies, 4 , 5 , 6 the maturation rate of oocytes cultured in vitro from preantral follicles has been unstable (varied from 20% to 70%) in most studies. 1 , 7 , 8 , 9 , 10 Many factors, including breed, FSH concentration, follicle size, and use of mineral oil, can affect the development of preantral follicles of mice in vitro. Therefore, how to optimize and stabilize the in vitro culture of preantral follicles is continuously being investigated. 1 , 7 , 11 , 12 , 13 , 14
The growth and development of follicles are regulated by hormones. Follicular development includes primordial follicles, primary follicles (PM), secondary follicles, antral follicles, and mature follicles. 15 Follicle‐stimulating hormone (FSH) and luteinizing hormone (LH) from the pituitary gland are the two major hormones that regulate follicular development. According to the dependence of FSH, follicular development is divided into FSH‐dependent phase and FSH‐independent phase. 16 FSH plays an important role in the growth and development of antral follicles and the synthesis of steroid hormones. 17 However, its role in the growth and development of preantral follicles remains unclear.
Pedersen et al 18 and Mandl et al 19 have divided the preantral follicles of mice into primordial follicles, PM follicles, and secondary follicles. They defined preantral follicles containing a layer of intact or incomplete flat granulosa cells as primordial follicles (Grade I follicles) and preantral follicles containing 1‐2 layers of cubic granulosa cells as PM follicles (Grade II‐III follicles). Meanwhile, preantral follicles containing 3 layers of cubic granulosa cells without follicular antrum are considered to be early secondary follicles (ES follicles, Grade IV‐Va follicles), while preantral follicles containing more than 3 layers of cubic granulosa cells without antrum are advanced secondary follicles (Grade Vb follicles). Halpin et al found that preantral follicles (Grade V) with a diameter of 150‐180 μm could not grow in vitro in the absence of FSH. 20 Cortvrindt R et. al also showed that FSH could promote the survival of preantral follicles with a diameter of 95‐142 μm in mice. 21 Recently, preantral follicles with a diameter of 80‐180 μm are often selected and used for in vitro culture, 13 , 22 , 23 and follicles in this diameter range include grade II, III, IV, and V follicles. The different grades of follicles have different amounts of granulosa cells and different sizes. Their sensitivity to FSH in each grade of follicles is unknown. So we speculate that these follicles probably have different sensitivity to FSH and different development rate stimulated by FSH. If we only select specific grade of follicles for culture, we might obtain the high development rate of preantral follicles in vitro.
In this study, we selected and cultured the PM follicles (Grade III follicles with a diameter of about 80‐100 μm and containing 1‐2 layers of cubic granulosa cells) and ES follicles (Grade IV follicles with a diameter of about 110‐130 μm containing 3 layers of granulosa cells follicles) with FSH of different concentrations. The effects of FSH on the spatial growth pattern and secretory ability of follicles were studied. We determined the optimal developmental period and FSH concentration of preantral follicular culture in mice. Furthermore, by optimizing the two‐dimensional culture system of preantral follicles, we improved the developmental rate of preantral follicles of mice in vitro.
2. MATERIALS AND METHODS
2.1. Animals
The 14‐day‐old female ICR mice were provided by experimental animal center of Jilin University. All mice were provided with free access to a standard laboratory mouse diet and sterile water. This study was conducted with approval from the Ethics Committee of Jilin Medical University.
2.2. Culture of preantral follicles in vitro
Mice were sacrificed by cervical dislocation, and the bilateral ovaries were rapidly removed into L‐15 medium with 10% FBS (Gibco BRL, Gaithersburg, MD). Follicles were mechanically isolated by gently scraping the ovary with 26G needles after the tissues around the ovaries were removed. Released preantral follicles were then washed in L‐15 medium. The preantral follicles were selected according to the Pedersen and Peter's grading criteria 18 , 19 for PM follicles (Grade III) with the diameter of 80‐100 μm and ES follicles (Grade IV) with the diameter of 110‐130 μm. Culture dishes with 60 mm diameter (Falcon, Becton Dickinson, NJ) were pre‐equilibrated and contained fifteen 20 µL culture droplets of α‐MEM medium (Gibco BRL, Gaithersburg, MD) supplemented with 5%FBS, 1%ITS (Gibco BRL, Gaithersburg, MD) and different concentrations of r‐FSH (10 mIU/mL or 100 mIU/mL) covered with 5 mL of mineral oil (Sigma‐Aldrich, M5310). The selected preantral follicles were placed individually into the culture droplets and incubated at 37°C, 5%CO2 for 10 days.
The medium was changed and collected on Day 2, Day 4, Day 6, Day 8, and Day 10, and the growth of the follicles was recorded at the same time. During follicular growth, the follicles with lighter color, no stereoscopic growth change were atretic follicles. The follicles with obvious stereoscopic growth pattern, dark color, and gradually increasing follicle diameter were normal follicles. At the end of the culture, follicles were further cultured in α‐MEM medium containing 2.5 IU/mL hCG (Merck Serono, Darmstadt, Germany) for another 16 hours for ovulation. Then, the COCs (Cumulus‐Oocyte Complexes) were expelled from the follicles. Oocyte maturation was examined by removing the granulosa cells surrounding the oocytes under the stereoscopic microscope. Oocytes with first polar bodies and homogeneous cytoplasm were considered normal mature oocytes. Oocytes with first polar bodies, large granules in the cytoplasm, and small cytoplasmic fragments in the perivitelline space were considered abnormal mature oocytes. Mature oocytes that are at the meiosis II stage are called MII oocytes. The adherent area of the follicles was measured by Image Pro‐Plus 6.0 software. The follicles isolated in vivo before ovulation were used to compare with the follicles cultured in vitro at day 10 before ovulation.
2.3. Immunofluorescence
Ovarian tissue was fixed in 4% paraformaldehyde for 4 hours and dehydrated with gradient ethanol. After xylene treatment, the tissues were embedded in paraffin and cut into 5 μm slides. The dewaxed slides were blocked with 1% BSA for 1 hour at 37°C. Thereafter, the slides were incubated with rabbit FSH receptor (FSHR) antibody (bs‐20658R; Bioss, Beijing, China) overnight at 4°C. In the negative control group, antibody dilution buffer was added instead of FSHR antibody. After washing, FITC‐labeled goat anti‐rabbit secondary antibodies were added, and the samples were further incubated at room temperature for 1 hour. Then, the slides were incubated with 5 μg/mL Hoechst 33 342 at room temperature for 15 minutes for the nuclei staining. Observation and photographing were carried out using a fluorescence microscope (Olympus, BX53, Japan). Fluorescence intensity was analyzed using Image Pro‐Plus 6.0 image analysis software. Five sections from one ovary were randomly selected for staining analysis. Five PM follicles and five ES follicles were taken from each tissue section for fluorescence intensity analysis under 400× magnification. The experiment was repeated 5 times, and 3 mice were used each time.
2.4. ELISA
The supernatant from each cultured follicle was used for estradiol (E2) analysis. E2 was detected by an ELISA kit (Bioss China, bsk00483) according to the instructions. Briefly, all samples and standards were added into a 96‐well plate and incubated at 37°C for 30 minutes. After washing, a coloring solution was added and incubated at 37°C in the dark for 10 minutes. The absorbance value OD450 was measured using a microplate reader (USA, Biotek, EL × 800).
2.5. Western blot
The 100 follicles were pooled from 5 mice at a time for each group. Total protein was extracted from PM and ES follicles using RIPA lysate (P0013B, Beyotime Biotech, Beijing, China) for Western blotting analysis. After SDS‐PAGE, the proteins were transferred to PVDF membrane, which was blocked with 5% skim milk for 1 hour at room temperature. Then, the membrane was incubated with antibodies to FSHR (bs‐20658R; Bioss), Ki‐67 (A2094; ABclonal), 3β‐hydroxysterol dehydrogenase (3β‐HSD) (bs‐3906R; Bioss), P450 17alpha‐hydroxylase (CYP17) (bs‐3853R; Bioss), P450 aromatase (CYP19) (bs‐0114R; Bioss), GAPDH (bs‐2188R; Bioss) or β‐actin (Ac026, ABclonal) overnight at 4°C. After washing, secondary antibody of HRP‐labeled goat anti‐rabbit antibody (bs‐0295G‐HRP; Bioss) was added and incubated for 1 hour at room temperature. Finally, the membrane was subjected to color development and photographed using a Tanon 4600 imaging system. Image was further analyzed by grayscale analysis using Tanon GIS ID software. The experiment for each group was repeated 5 times, and 5 mice were used each time.
2.6. Statistical analysis
All data were analyzed using SPSS 17.0 statistical software and expressed as mean ± standard deviation (SD). Independent sample t test was used for comparison between two groups. Multiple comparisons were performed with one‐way ANOVA followed by LSD post hoc test. A P < .05 was considered to be statistically significant.
3. RESULTS
3.1. Isolation of preantral follicles in mice
After the mouse ovaries were mechanically separated, primordial follicles, PM follicles, and ES follicles were obtained, respectively. In this study, PM follicles were 80‐100 μm in diameter (grade III follicles) containing 1‐2 layers of granulosa cells (Figure 1A), and ES follicles were 110‐130 μm in diameter (grade IV follicles) containing 3 layers of granulosa cells (Figure 1B) (Table 1). The preantral follicles were then cultured in vitro, and the growth was continuously observed.
FIGURE 1.
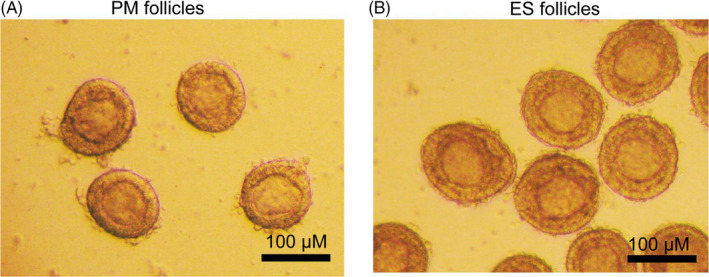
PM follicles and ES follicles isolated in vitro. A, PM follicles, about 80‐100 μm in diameter, containing 1‐2 layers of cubic granulosa cells. B, ES follicles, approximately 110‐130 μm in diameter, containing 3 layers of cubic granulosa cells. Scale bar: 100 μm
TABLE 1.
Separated follicles of PM and ES from D14 mouse ovaries
| Group | Diameter (μm) | No. of mice | No. of follicles |
|---|---|---|---|
| PM follicle | 80‐100 | 40 | 800 |
| ES follicle | 110‐130 | 40 | 800 |
3.2. Effect of FSH on the growth and development of preantral follicles in vitro
The PM and ES follicles were cultured in medium containing 10 mIU/mL and 100 mIU/mL r‐FSH, respectively. And the follicular growth on Day 2, Day 4, Day 6, Day 8, and Day 10 was observed (Figure 2). We found that most follicles began adherent growth on Day 2. Adherent follicles were considered living follicles, while non‐adherent follicles suspended in culture media were considered dead follicles. On Day 4, the granulosa cells proliferated and grew out through the basal membrane, which was more obvious in the ES follicles. The granulosa cells of ES follicles on Day 6 continued to proliferate and bulged to the surroundings, but the granulosa cells of the PM follicles did not. Most of the ES follicles began to form follicular antrum on Day 8, while only a few follicular antra were found in PM follicles cultured at 100 mIU/mL r‐FSH. On Day 10, the follicular antrum continued to increase, and the follicles were close to maturity. Although some follicles did not form follicular antrum, the morphology of follicles was normal and thus was considered to be in the stage of development arrest. Degenerating follicles, which were separated from the granulosa cells and formed naked oocytes, were also observed.
FIGURE 2.
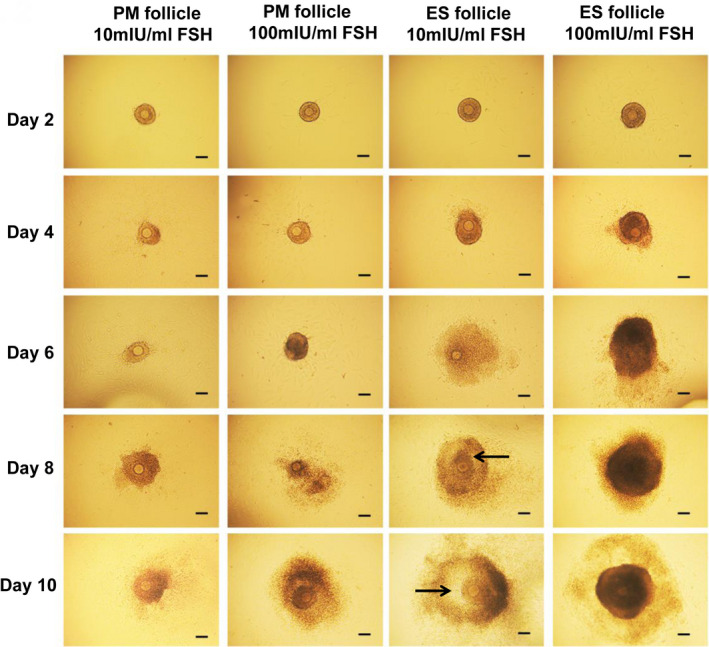
Growth and development of PM follicles and ES follicles in vitro. Scale bar: 100 μm. Arrows indicate follicular antrum. Day 2, follicles that adhered to the wall. Day 4, follicles with granulose cells breaking through the basement membrane. Day 6, follicles with granulose cells bulging. Day 8, antral follicles. Day 10, follicles close to maturity
We then performed the statistical analysis for the adherent rates of follicules, antrum formation, development arrest, and degeneration (Tables 2 and 3). The adherent rate of PM follicles in 100 mIU/mL r‐FSH on Day 2 was significantly higher than that in 10 mIU/mL r‐FSH, but the adherent rate of ES follicles was not significantly affected by FSH (Table 2). In the 10 mIU/mL r‐FSH, the adherent rate of ES follicles was significantly higher than that of PM follicles. These results indicated that the effect of FSH on follicular adherence depended on the development stage of follicles. PM follicle cultured in 10 mIU/mL r‐FSH culture medium could not form antral follicles. Most of them formed degenerating follicles (93.23%), and a small number were in development arrest stage (6.77%) (Table 3). In the culture medium of 100 mIU/mL r‐FSH, 36.14% of PM follicles formed antral follicles (Table 3). ES follicles formed antral follicles in 10 mIU/mL r‐FSH and 100 mIU/mL r‐FSH, and the ratio of antral follicles formed in 100 mIU/mL r‐FSH was significantly higher than that in 10 mIU/mL r‐FSH (92.74% vs 78.63%) (P < .05) (Table 3). The rate of ES follicle degeneration in 100 mIU/mL r‐FSH was significantly less than 10 mIU/mL r‐FSH (2.19% vs 19.72%) (P < .05) (Table 3). The antrum formation rate of ES follicles was significantly higher than that of PM follicles. Therefore, ES follicles have greater development potential than PM follicles in the two‐dimensional culture environment in vitro.
TABLE 2.
The adherent rate of preantral follicles on day 2 of culture in vitro
| Group | No. of mice | No. of follicles | No. of adherent follicles | Rate of adherent follicles | |
|---|---|---|---|---|---|
| PM follicle | 10 mIU/mL FSH | 10 | 200 | 186 | 93.23 ± 1.98 |
| 100 mIU/mL FSH | 10 | 200 | 199 | 99.50 ± 1.12 a | |
| ES follicle | 10 mIU/mL FSH | 15 | 300 | 295 | 98.35 ± 1.64 b |
| 100 mIU/mL FSH | 15 | 300 | 298 | 99.60 ± 0.89 | |
Data were shown as mean ± SD.
P < .05, PM follicle in 100 mIU/mL FSH group compared with PM follicle in 10mIU/mL FSH group.
P < .05, ES follicle in 10 mIU/mL FSH group compared with PM follicle in 10 mIU/mL FSH group.
TABLE 3.
Percentages of antral follicles, arrested follicles, and degraded follicles on day 10
| Group | NO. of adherent follicles | NO. of antral follicles | NO. of arrested follicles | NO. of degraded follicles | The percentage of antral follicles | The percentage of arrested follicles | The percentage of degraded follicles | |
|---|---|---|---|---|---|---|---|---|
| PM follicle | 10 mIU/mL FSH | 186 | 0 | 13 | 173 | 0.00 ± 0.0 | 6.77 ± 1.89 | 93.23 ± 2.00 |
| 100 mIU/mL FSH | 199 | 72 | 2 | 125 | 36.14 ± 4.02 a | 0.80 ± 0.04 a | 63.06 ± 3.02 a | |
| ES follicle | 10 mIU/mL FSH | 295 | 232 | 5 | 58 | 78.63 ± 4.13 c | 1.65 ± 0.27 c | 19.72 ± 3.86 c |
| 100 mIU/mL FSH | 298 | 276 | 15 | 7 | 92.74 ± 2.54 b , d | |||
Data were shown as mean ± SD.
P < .05, PM follicle in 100 mIU/mL FSH group compared with PM follicle in 10 mIU/mL FSH group.
P < .05, ES follicle in 100 mIU/mL FSH group compared with ES follicle in 10 mIU/mL FSH group.
P < .05, ES follicle in 10 mIU/mL FSH group compared with PM follicle in 10 mIU/mL FSH group.
P < .05, ES follicle in 100 mIU/mL FSH group compared with PM follicle in 100 mIU/mL FSH group.
3.3. Effect of FSH on follicular maturation
After 10 days of culture, hCG was added to the culture medium to promote ovulation (Figure 3A) and oocyte maturation (Figure 3B). There was no mature oocyte because no antral follicles were formed in PM follicles with 10 mIU/mL r‐FSH. The COCs expelling rate of PM follicles with 100 mIU/mL r‐FSH was not significantly different from that of ES follicles (94.44% vs 100%) (P > .05) (Table 4). The maturation rate of oocytes in ES follicles with 10 mIU/mL or 100 mIU/mL r‐FSH was significantly higher than that of PM follicles (Table 4). Moreover, the oocyte maturation rate of ES follicles with 100 mIU/mL r‐FSH was significantly higher than that with 10 mIU/mL r‐FSH (80.88% vs 48.55%) (P < .05). Therefore, ES follicular phase was the best period for culture of preantral follicles in vitro and that 100 mIU/mL r‐FSH was more suitable to promote the maturation of the oocytes from ES follicles.
FIGURE 3.
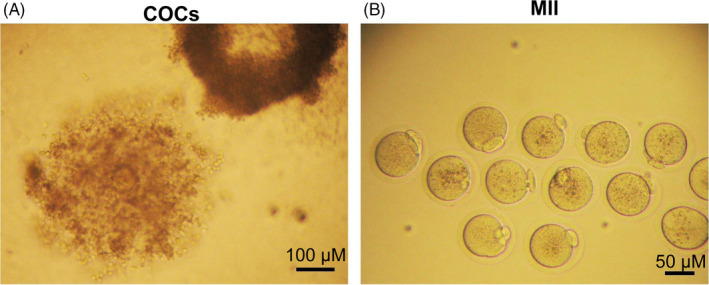
COCs and MII oocytes expelled after ES follicle maturation. A, COCs expelled from mature follicles. Scale bar: 100 μm. B, MII oocytes having a first polar body. Scale bar: 50 μm
TABLE 4.
The rate of mature oocytes cultured for 11 d in vitro
| Group | NO. of antral follicles | NO. of expelled COCs | NO. of mature oocytes | The rate of expelled COCs | The rate of mature oocytes | |
|---|---|---|---|---|---|---|
| PM follicles | 10 mIU/mL FSH | 0 | 0 | 0 | 0.00 ± 0.00 | 0.00 ± 0.00 |
| 100 mIU/mL FSH | 72 | 68 | 16 | 94.44 ± 2.03 | 23.54 ± 7.62 a | |
| ES follicles | 10 mIU/mL FSH | 232 | 230 | 112 | 99.14 ± 0.57 | 48.55 ± 3.73 c |
| 100 mIU/mL FSH | 276 | 276 | 223 | 100.00 ± 0.00 | 80.88 ± 4.02 b , d | |
Data were shown as mean ± SD.
P < .05, PM follicle in 100 mIU/mL FSH group compared with PM follicle in 10 mIU/mL FSH group.
P < .05, ES follicle in 100 mIU/mL FSH group compared with ES follicle in 10 mIU/mL FSH group.
P < .05, ES follicle in 10 mIU/mL FSH group compared with PM follicle in 10 mIU/mL FSH group.
P < .05, ES follicle in 100 mIU/mL FSH group compared with PM follicle in 100 mIU/mL FSH group.
3.4. Effect of FSH on the spatial growth of follicles in vitro
During the development of follicles in vitro, we found that most PM follicles did not continue to grow after 6 days of culture. However, ES follicles had two growth modes with different concentrations of r‐FSH. As shown in Figure 4A, the color of the ES follicles grown in the 100 mIU/mL r‐FSH medium was darker, and the ES follicles exhibited a three‐dimensional spatial growth pattern. This growth pattern is more like the growth of the follicles in vivo. However, the ES follicles in the 10 mIU/mL r‐FSH medium grew in a flatted growth pattern (Figure 4A). The adherent area of the ES follicles in the 100 mIU/mL r‐FSH medium was significantly smaller than that in the 10 mIU/mL r‐FSH medium (Figure 4B). These results indicated that follicular growth was more appropriate to mimic the growth pattern in vivo with 100 mIU/mL r‐FSH.
FIGURE 4.
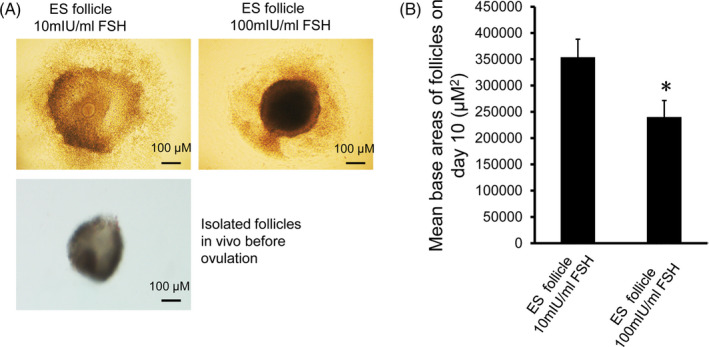
Analysis of adherence of antral follicles formed by ES follicles after culture for 10 d. A, Antral follicles formed by ES follicles after culture for 10 d and isolated follicles in vivo before ovulation. Upper left panel: Antral follicles grew in 10 mIU/mL r‐FSH medium, spreading in a flat pattern, with a large adherent area; Upper right panel: Antral follicles grew in a medium with 100 mIU/mL r‐FSH showing a three‐dimensional spacial growth pattern. Lower left panel: Isolated follicles in vivo before ovulation. Scale bar: 100 μm. B, Analysis of adherent areas of antral follicles. The adherence areas of D10 antral follicles grown in 10 mIU/mL and 100 mIU/mL r‐FSH culture medium were measured by Image Pro‐Plus 6.0 image analysis software (n = 100). Comparison was performed using the t test. Compared with 10 mIU/mL r‐FSH, *P < .05
3.5. Effect of FSH on proliferation of granulosa cells
Ki‐67 is related to ribosomal RNA transcription and is usually used as a marker of cell proliferation. We used Western blot to detect Ki‐67 in granulosa cells. The results showed that Ki‐67 levels in ES follicle granulosa cells were significantly higher than PM follicles after ten days of culture (Figure 5A,B). In addition, the levels of Ki‐67 in ES follicles and PM follicular granulosa cells in 100 mIU/mL r‐FSH were significantly higher than those in 10 mIU/mL r‐FSH. We conclude that ES follicle granulosa cells had a significantly higher proliferation capacity than PM follicles in vitro, and 100 mIU/mL r‐FSH significantly stimulated granulosa cell proliferation.
FIGURE 5.
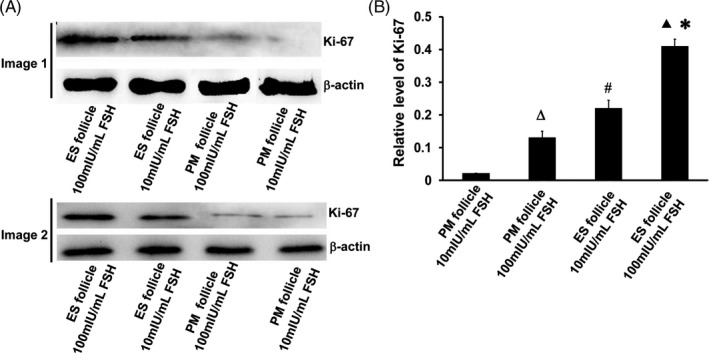
Cell proliferation of follicular granulosa by assessing Ki‐67 expression. A, Ki‐67 levels in different experimental groups on day 10. Image 1 and image 2 were representative Western blot images of two groups of mice. B, Relative expression of Ki‐67 by grayscale analysis. ΔP < 0.05, PM follicle 100 mIU/mL FSH group compared with PM follicle 10 mIU/mL FSH group; ▲P < .05, ES follicle 100 mIU/mL FSH group compared with ES follicle 10 mIU/mL FSH group; #P < .05, ES follicle 10 mIU/mL FSH group compared with PM follicle 10 mIU/mL FSH group; *P < .05, ES follicle 100 mIU/mL FSH group compared with PM follicle 100 mIU/mL FSH group
3.6. Effect of FSH on the secretion of E2 by follicles
E2 is the most important hormone secreted by follicles, which reflects the function of follicles. Herein, E2 levels after D4, D6, D8, and D10 culture were detected by ELISA (Table 5). The E2 levels from ES follicles at D4, D6, D8, and D10 were significantly higher than those from PM follicles with 10 mIU/mL or 100 mIU/mL r‐FSH (P < .05). However, there was no significant difference in E2 levels between 10 mIU/mL and 100 mIU/mLr‐FSH (P ≥ .05) for PM follicles. For ES follicles, the E2 level in the 100 mIU/mL r‐FSH medium was significantly higher than that in the 10 mIU/mL r‐FSH medium. These data suggested that 100 mIU/mL r‐FSH stimulated the secretion of E2 by the follicles from ES follicle culture more effectively.
TABLE 5.
Concentrations of E2 in supernatant from each cultured follicle
| Group | NO. of mice | NO. of follicles | D0 | D4 | D6 | D8 | D10 | |
|---|---|---|---|---|---|---|---|---|
| PM follicle |
10 mIU/mL FSH |
8 | 160 | 0.00 ± 0.00 | 1.18 ± 0.40 | 1.74 ± 0.43 | 2.45 ± 0.44 | 3.30 ± 0.34 |
|
100 mIU/mL FSH |
8 | 160 | 0.00 ± 0.00 | 2.35 ± 0.59 | 2.89 ± 1.12 | 3.84 ± 1.03 | 4.62 ± 0.61 | |
| ES follicle |
10 mIU/mL FSH |
8 | 160 | 0.00 ± 0.00 | 4.21 ± 0.69 b | 4.94 ± 0.42 b | 5.29 ± 0.47 b | 8.62 ± 0.62 b |
|
100 mIU/mL FSH |
8 | 160 | 0.00 ± 0.00 | 6.49 ± 1.81 a , c | 7.69 ± 1.66 a , c | 9.97 ± 1.86 a , c | 14.08 ± 1.75 a , c | |
Data were shown as mean ± SD.
P < .05, ES follicle in 100 mIU/mL FSH group compared with ES follicle in 10 mIU/mL FSH group.
P < .05, ES follicle in 10 mIU/mL FSH group compared with PM follicle in 10 mIU/mL FSH group.
P < .05, ES follicle in 100 mIU/mL FSH group compared with PM follicle in 100 mIU/mL FSH group.
3.7. Expression of FSH receptor in preantral follicle
Next, we used immunofluorescence to detect the expression of FSHR. FSHR was expressed in granulosa cells instead of oocytes or theca cells of follicle (Figure 6A). The mean fluorescence intensity of FSHR in ES follicles was significantly higher than that in PM follicles (P < .05, Figure 6B). The obtained PM follicles and ES follicles were separately subjected to Western blot analysis (Figure 7A). The results showed that the levels of FSHR in ES follicles were significantly higher than that in PM follicles (P < .05, Figure 7B). Thus, FSHR level was higher in ES follicles than that in PM follicles and ES follicles were more sensitive to FSH than PM follicles.
FIGURE 6.
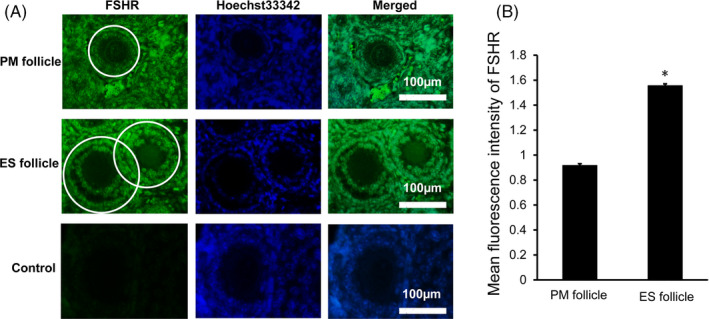
FSHR expression in PM follicles and ES follicles in ovarian tissue of D14 female mice. A, Immunofluorescence staining of FSHR in PM follicles and ES follicles. The FSHR was stained green, and the nuclei were stained blue. The white circle indicates the area used for analyzing relative fluorescence intensity of FSHR expression. The control group was a negative control group. Scale bar: 100 μm. B, Relative fluorescence intensity analysis of FSHR expression. Compared with PM follicles, *P < .05
FIGURE 7.
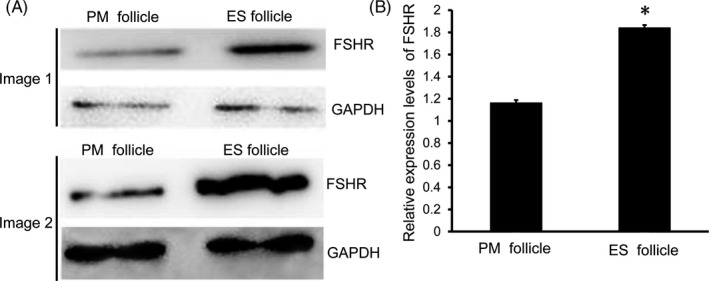
Expression levels of FSHR in PM follicles and ES follicles. A, Western blot was used to detect the expression of FSHR in PM follicles and ES follicles. Image 1 and image 2 were representative Western blot images of two groups of mice. B, Analysis of relative expression levels of FSHR in PM follicles and ES follicles. Compared with PM follicles, *P < .05
3.8. Effect of FSH on the expressions of rate‐limiting enzymes in steroid hormone synthesis in follicles
We used Western blot to detect the expressions of rate‐limiting enzymes in steroid hormone synthesis in follicles, including 3β‐HSD, CYP17, and CYP19. The results showed that there were no significant differences between PM follicles grown at 10 mIU/mL and 100 mIU/mL r‐FSH (Figure 8A,B). However, the expressions of these enzymes in the developing follicles from ES follicle culture were higher than those from PM follicle culture. Their expression in ES follicles grown in 100 mIU/mL r‐FSH was significantly higher than that of ES follicles grown in 10 mIU/mL r‐FSH (Figure 8A,B). Therefore, the secretion of E2 by the developing follicles from ES follicle culture was significantly higher than that from PM follicle culture. Together, we found that the expression of 3β‐HSD, CYP17, and CYP19 in the developing follicles from ES follicle culture was higher than that from PM follicle culture, and their expression by the developing follicles from ES follicle culture in 100 mIU/mL r‐FSH was significantly higher than that in 10 mIU/mL r‐FSH.
FIGURE 8.
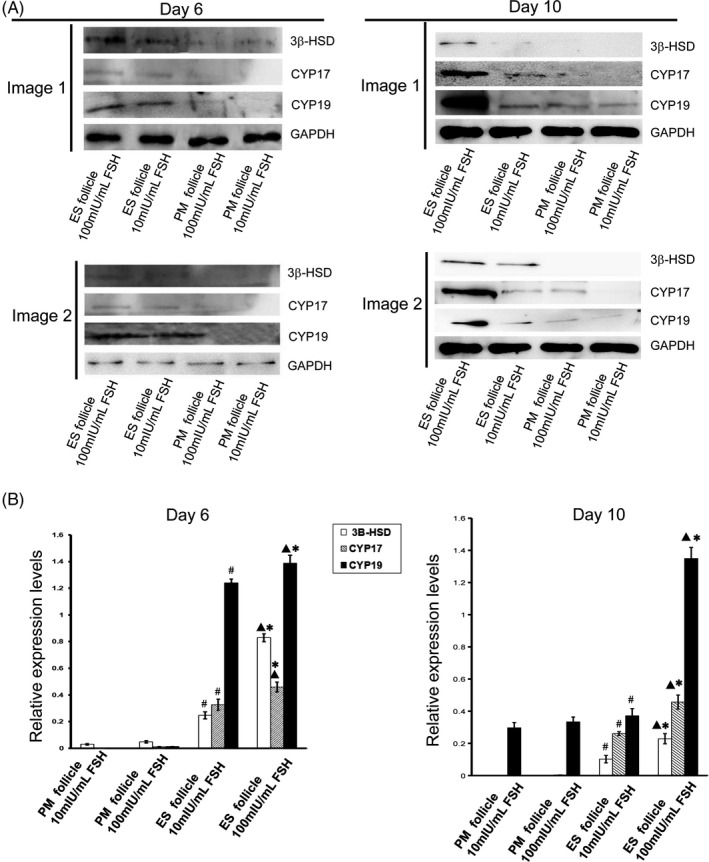
Expression levels of steroid hormone synthesis rate‐limiting enzyme in follicles. A, Western blot analysis of the expressions of 3β‐HSD, CYP 17, and CYP 19 in Day 6 and Day 10 follicles. Image 1 and image 2 were representative Western blot images of two groups of mice. B, Analysis of relative expression levels of 3β‐HSD, CYP 17, and CYP 19 in follicles. ▲P < .05, ES follicle 100 mIU/mL FSH group compared with ES follicle 10 mIU/mL FSH group; #P < .05, ES follicle 10 mIU/mL FSH group compared with PM follicle 10 mIU/mL FSH group; *P < .05, ES follicle 100 mIU/mL FSH group compared with PM follicle 100 mIU/mL FSH group
4. DISCUSSION
Currently, the most commonly used method for in vitro culture of mouse preantral follicle is the two‐dimensional droplet method. 1 , 2 , 3 The 80‐180 μm preantral follicle is selected for in vitro culture, 13 , 22 , 23 and the commonly used r‐FSH concentration is 10 mIU/mL or 100 mIU/mL. 13 , 23 , 24 Under the same conditions, the average in vitro maturation rate of follicular oocytes is 60%‐70%. 1 , 2 , 3 The in vitro maturation is unstable, and the maturation rate varies greatly (8%‐80.88%). 2 , 24 , 25 Cortvrindt et al performed a two‐dimensional culture with follicles of 95‐142 μm and 100 mIU/mL r‐FSH, and obtained 41% of MII oocytes. 21 In this study, ES follicles were selected and cultured in a culture medium containing 100 mIU/mL r‐FSH, and an oocyte maturation rate of 80.88% was obtained. We suppose that the great difference in oocyte maturation rate may be as follows. The preantral follicle of 80‐180 μm includes the follicles of the two stages of PM and ES. 18 , 19 The follicles of these two stages have different diameters and different number of granulosa cells, 18 , 19 and thus, they may have different sensitivity to FSH stimulation. Therefore, under the same concentration of FSH, PM follicles and ES follicles may have different development rates and maturation rates, thus leading to the differences in oocyte maturation rate of in vitro culture of preantral follicle.
The response of follicles to FSH stimulation is closely related to the expression of FSHR. 23 Otkay et al found that FSHR was expressed on primary follicles containing a layer of granulosa cells. 26 Our study also found that FSHR was expressed on both primary and secondary follicles. Although the expression of FSHR was found on both primary and secondary follicles, Hardy et al found that the growth rate of follicles with a diameter of <110 μm had no significant difference with or without treatment with 10 ng/mL r‐FSH. 27 After knocking out the FSH gene, Kumar et al found that the growth of primary follicles could be maintained and that primary follicles could develop well to the secondary follicles. 28 Dierich et al found that in the absence of FSHR, female mice cannot ovulate, but follicles can develop into antral follicles. 29 The above studies indicate that the growth of mouse primary follicle may not be dependent on FSH. This study also found that during the in vitro culture of PM follicles with different concentrations of FSH, most PM follicles could slowly grow to D6, but cannot form a follicular antrum. Therefore, in the process of in vitro culture of preantral follicles, if PM follicles are also cultured, the development rate and maturation rate of follicles will be greatly reduced. We suppose that the current two‐dimensional culture system of preantral follicles in mice may be not suitable for the culture of PM follicles. Further research is needed to investigate the in vitro culture system of PM follicles.
Follicles at different developmental stages have different FSHR expression levels, and thus, they have different sensitivities to FSH stimulation. 23 Saraiva et al found that with the development of follicles, the expression of FSHR increased significantly. 2 Therefore, they used the sequence culture method for the culture of preantral follicles, that is, 100 ng/mL FSH was added at D0‐D12, 500 ng/mL FSH at D6‐D12, and 1000 ng/mL FSH at D12‐D18, which significantly improved the survival of preantral follicles and the formation of antral follicles. 30 In this study, we found that ES follicles had higher FSHR expression levels than PM follicles, suggesting that ES follicles may develop better at higher FSH concentrations. Therefore, we compared the effects of 10 mIU/mL r‐FSH and 100 mIU/mL r‐FSH on ES follicle development. The results showed that 100 mIU/mL r‐FSH significantly stimulated the development of ES follicles, obtained a higher oocyte maturation rate. FSH binds to the FSHR on the granulosa cell membrane and stimulates the expression of steroid hormone synthesis rate‐limiting enzyme in granulosa cells. 31 , 32 The expression of these enzymes converts androstenedione synthesized from follicular theca cells into E2. Therefore, for ES follicles with high FSHR expression, 100 mIU/mL FSH can significantly stimulate the secretion of E2. It has been indicated that estrogens stimulate the proliferation of GCs and are absolutely necessary for the normal follicle growth. 31 Currently, researchers commonly use 10 mIU/mL r‐FSH or 100 mIU/mL r‐FSH to culture mouse preantral follicles. However, because PM follicles and ES follicles are not cultured separately, the results are unstable, and the concentration of FSH is also uncertain. In this study, PM follicles and ES follicles were separately cultured. The results showed that the in vitro development rate of preantral follicles was better when ES follicles were cultured with 100 mIU/mL r‐FSH.
This study reported for the first time that FSH affected not only the in vitro development rate of preantral follicles, but also their in vitro development patterns. In 10 mIU/mL r‐FSH culture medium, ES follicles exhibited a tiled growth pattern, with large adherence area; while in 100 mIU/mL r‐FSH culture medium, they presented a three‐dimensional growth pattern, with small adherence area. Although studies have reported that FSH affects the development of preantral follicles, 33 , 34 , 35 there is no report regarding the effect of FSH on the growth pattern of preantral follicles in vitro. The reason may be that the PM follicles and ES follicles were cultured together in previous studies. When the development rate is not high, no difference in development patterns has been found. In this study, ES follicles and PM follicles were cultured separately, allowing us to observe the effect of FSH on the growth pattern of follicles in vitro. Additionally, the three‐dimensional growth pattern of ES follicles in the culture medium of 100 mIU/mL r‐FSH was similar to the growth pattern of follicles before ovulation in vivo, thus better simulating the growth of follicles in vivo. Therefore, the culture of ES follicles in a culture medium of 100 mIU/mL r‐FSH not only improves the secretory function of the follicles and the development rate in vitro, but also simulates the in vivo growth of follicles.
In summary, the two‐dimensional culture system of preantral follicles in mice may be not suitable for the culture of PM follicles. The optimal in vitro culture system for PM follicles needs further investigation. Higher in vitro development and maturation rates of ES follicles (110‐130μm) can be obtained in a two‐dimensional culture system with 100 mIU/mL r‐FSH. The 100 mIU/mL r‐FSH can stimulate ES follicle granulosa cells to quickly proliferate and grow in a three‐dimensional pattern, and, promote ES follicles to express more steroid hormone synthesis rate‐limiting enzymes and synthesize and secrete more estrogens, finally achieving a higher oocyte maturation rate. Therefore, the two‐dimensional droplet culture system with 100 mIU/mL r‐FSH is an optimal in vitro culture system for ES follicles that can simulate the growth pattern of follicles in vivo.
CONFLICT OF INTEREST
None.
ACKNOWLEDGMENTS
This study was supported by the Scientific and Technological Research Project of Jilin Province (20190304071YY; 20200201132JC), the Hygiene and Health Research Project of Jilin Province for the training of high‐tech youth talents (2018Q047), the Scientific and Technological Innovation Project of Jilin City (201831721; 20190403224), the “Thirteenth Five‐Year” Scientific and Technological Research Projects of Education Department of Jilin Province [JJKH20191065KJ, JJKH20200454KJ], and Undergraduate Training Programs for Innovation and Entrepreneurship of Jilin Province (dc201952, dc201954).
Wang X, Wang L, Sun Y, et al. The optimized research of the in vitro culture of preantral follicles in mice. J Clin Lab Anal. 2020;34:e23498 10.1002/jcla.23498
REFERENCES
- 1. Lee J, Kim EJ, Kong HS, et al. Comparison of the oocyte quality derived from two‐dimensional follicle culture methods and developmental competence of in vitro grown and matured oocytes. Biomed Res Int. 2018;2018:7907092. [DOI] [PMC free article] [PubMed] [Google Scholar]
- 2. Zhang T, Chen Y, Yang Y, et al. The potentiality of two‐dimensional preantral follicle culture as an in vitro model in predicting premature ovarian failure. Exp Toxicol Pathol. 2017;69(7):477‐484. [DOI] [PubMed] [Google Scholar]
- 3. Koohestani NV, Zavareh S, Lashkarbolouki T, Azimipour F. Exposure to cell phone induce oxidative stress in mice preantral follicles during in vitro cultivation: an experimental study. Int J Reprod Biomed (Yazd). 2019;17(9):637‐646. [DOI] [PMC free article] [PubMed] [Google Scholar]
- 4. Liu J, Van der Elst J, Van den Broecke R, Dhont M. Live offspring by in vitro fertilization of oocytes from cryopreserved primordial mouse follicles after sequential in vivo transplantation and in vitro maturation. Biol Reprod. 2001;64(1):171‐178. [DOI] [PubMed] [Google Scholar]
- 5. Hasegawa A, Mochida N, Ogasawara T, Koyama K. Pup birth from mouse oocytes in preantral follicles derived from vitrified and warmed ovaries followed by in vitro growth, in vitro maturation, and in vitro fertilization. Fertil Steril. 2006;86(4 Suppl):1182‐1192. [DOI] [PubMed] [Google Scholar]
- 6. Wang X, Catt S, Pangestu M, Temple‐Smith P. Successful in vitro culture of pre‐antral follicles derived from vitrified murine ovarian tissue: oocyte maturation, fertilization, and live births. Reproduction. 2011;141(2):183‐191. [DOI] [PubMed] [Google Scholar]
- 7. Majdi Seghinsara A, Shoorei H, Hassanzadeh Taheri MM, et al. Panax ginseng extract improves follicular development after mouse preantral follicle 3d culture. Cell J. 2019;21(2):210‐219. [DOI] [PMC free article] [PubMed] [Google Scholar]
- 8. Jamalzaei P, Valojerdi MR, Ebrahimi B, Farrokhi A. Oocyte maturation and expression pattern of follicular genes during in‐vitro culture of vitrified mouse pre‐antral follicles. Gene Expr Patterns. 2016;20(1):63‐70. [DOI] [PubMed] [Google Scholar]
- 9. Kim JH, Jee BC. Effects of butylparaben supplementation on in vitro development of mouse preantral follicle. Reprod Sci. 2020;27(6):1365‐1371. [DOI] [PubMed] [Google Scholar]
- 10. Shoorei H, Khaki A, Ainehchi N, et al. Effects of matricaria chamomilla extract on growth and maturation of isolated mouse ovarian follicles in a three‐dimensional culture system. Chin Med J (Engl). 2018;131(2):218‐225. [DOI] [PMC free article] [PubMed] [Google Scholar]
- 11. Laird M, Thomson K, Fenwick M, Mora J, Franks S, Hardy K. Androgen stimulates growth of mouse preantral follicles in vitro: interaction with follicle‐stimulating hormone and with growth factors of the TGFβ superfamily. Endocrinology. 2017;158(4):920‐935. [DOI] [PMC free article] [PubMed] [Google Scholar]
- 12. Xi G, Wang W, Fazlani SA, et al. C‐type natriuretic peptide enhances mouse preantral follicle growth. Reproduction. 2019;157(5):445‐455. [DOI] [PubMed] [Google Scholar]
- 13. Tanaka Y, Matsuzaki T, Tanaka N, Iwasa T, Kuwahara A, Irahara M. Activin effects on follicular growth in in vitro preantral follicle culture. J Med Invest. 2019;66(1.2):165‐171. [DOI] [PubMed] [Google Scholar]
- 14. Sadr SZ, Fatehi R, Maroufizadeh S, Amorim CA, Ebrahimi B. Utilizing fibrin‐alginate and matrigel‐alginate for mouse follicle development in three‐dimensional culture systems. Biopreserv Biobank. 2018;16(2):120‐127. [DOI] [PubMed] [Google Scholar]
- 15. Edson MA, Nagaraja AK, Matzuk MM. The mammalian ovary from genesis to revelation. Endocr Rev. 2009;30(6):624‐712. [DOI] [PMC free article] [PubMed] [Google Scholar]
- 16. Celik O, Tagluk ME, Hascalik S, Elter K, Celik N, Aydin NE. Spectrotemporal changes in electrical activity of myometrium due to recombinant follicle‐stimulating hormone preparations follitropin alfa and beta. Fertil Steril. 2008;90(4 Suppl):1348‐1356. [DOI] [PubMed] [Google Scholar]
- 17. Abel MH, Wootton AN, Wilkins V, Huhtaniemi I, Knight PG, Charlton HM. The effect of a null mutation in the follicle‐stimulating hormone receptor gene on mouse reproduction. Endocrinology. 2000;141(5):1795‐1803. [DOI] [PubMed] [Google Scholar]
- 18. Pedersen T, Peters H. Proposal for a classification of oocytes and follicles in the mouse ovary. Reprod Fert. 1968;17(3):555‐557. [DOI] [PubMed] [Google Scholar]
- 19. Mandl AM, Zuckerman S. Numbers of normal and atretic oocytes in unilaterally spayed rats. J Endocr. 1951;7(2):112‐119. [DOI] [PubMed] [Google Scholar]
- 20. Halpin DM, Charlton HM. Effects of short‐term injection of gonadotrophins on ovarian follicle development in hypogonadal (hpg) mice. J Reprod Fertil. 1988;82(1):393‐400. [DOI] [PubMed] [Google Scholar]
- 21. Cortvrindt R, Smitz J, Van Steirteghem AC. Assessment of the need for follicle stimulating hormone in early preantral mouse follicle culture in vitro. Hum Reprod. 1997;12(4):759‐768. [DOI] [PubMed] [Google Scholar]
- 22. Nagao S, Baba T, Fujibe Y, et al. Pioglitazone suppresses excessive follicular development in murine preantral follicles. J Ovarian Res. 2019;12(1):82. [DOI] [PMC free article] [PubMed] [Google Scholar]
- 23. Fujibe Y, Baba T, Nagao S, et al. Androgen potentiates the expression of FSH receptor and supports preantral follicle development in mice. J Ovarian Res. 2019;12(1):31. [DOI] [PMC free article] [PubMed] [Google Scholar]
- 24. Wang X, Jiang S‐W, Wang L, et al. Interfering effects of bisphenol A on in vitro growth of preantral follicles and maturation of oocyes. Clin Chim Acta. 2018;485:119‐125. [DOI] [PubMed] [Google Scholar]
- 25. Wang Y. Comparison of two‐dimensional and three‐dimensional in vitro systems of preantral mouse ovarian follicles. Wuhan: Huazhong University of Science and Technology; 2012:1‐34. [Google Scholar]
- 26. Oktay K, Briggs D, Gosden RG. Ontogeny of follicle‐stimulating hormone receptor gene expression in isolated human ovarian follicles. J Clin Endocrinol Metab. 1997;82(11):3748‐3751. [DOI] [PubMed] [Google Scholar]
- 27. Hardy K, Fenwick M, Mora J, Laird M, Thomson K, Franks S. Onset and heterogeneity of responsiveness to FSH in mouse preantral follicles in culture. Endocrinology. 2017;158(1):134‐147. [DOI] [PMC free article] [PubMed] [Google Scholar]
- 28. Kumar TR, Wang Y, Lu N, Matzuk MM. Follicle stimulating hormone is required for ovarian follicle maturation but not male fertility. Nat Genet. 1997;15(2):201‐204. [DOI] [PubMed] [Google Scholar]
- 29. Dierich A, Sairam MR, Monaco L, et al. Impairing follicle‐stimulating hormone (FSH) signaling in vivo: targeted disruption of the FSH receptor leads to aberrant gametogenesis and hormonal imbalance. Proc Natl Acad Sci. U S A. 1998;95(23):13612‐13617. [DOI] [PMC free article] [PubMed] [Google Scholar]
- 30. Saraiva MV, Celestino JJ, Araujo VR, et al. Expression of follicle‐stimulating hormone receptor (FSHR) in goat ovarian follicles and the impact of sequential culture medium on in vitro development of caprine preantral follicles. Zygote. 2011;19(3):205‐214. [DOI] [PubMed] [Google Scholar]
- 31. Payne AH, Hales DB. Overview of steroidogenic enzymes in the pathway from cholesterol to active steroid hormones. Endocr Rev. 2004;25:947‐970. [DOI] [PubMed] [Google Scholar]
- 32. Shoorei H, Banimohammad M, Kebria MM, et al. Hesperidin improves the follicular development in 3D culture of isolated preantral ovarian follicles of mice. Exp Biol Med (Maywood). 2019;244(5):352‐361. [DOI] [PMC free article] [PubMed] [Google Scholar]
- 33. Egbert JR, Fahey PG, Reimer J, et al. Follicle‐stimulating hormone and luteinizing hormone increase Ca2+ in the granulosa cells of mouse ovarian follicles†. Biol Reprod. 2019;101(2):433‐444. [DOI] [PMC free article] [PubMed] [Google Scholar]
- 34. Devillers MM, Petit F, Cluzet V, et al. FSH inhibits AMH to support ovarian estradiol synthesis in infantile mice. J Endocrinol. 2019;240(2):215‐228. [DOI] [PubMed] [Google Scholar]
- 35. Liu J, Han Y, Tian Y, et al. Regulation by 3,5,3'‐tri‐iodothyronine and FSH of cytochrome P450 family 19 (CYP19) expression in mouse granulosa cells. Reprod Fertil Dev. 2018;30(9):1225‐1233. [DOI] [PubMed] [Google Scholar]


