Abstract
The design and performance of the ACE1 (Active Complex Electrode) electrical impedance tomography system for single-ended phasic voltage measurements is presented. The design of the hardware and calibration procedures allow for reconstruction of conductivity and permittivity images. Phase measurement is achieved with the ACE1 active electrode circuit which measures the amplitude and phase of the voltage and the applied current at the location at which current is injected into the body. An evaluation of the system performance under typical operating conditions includes details of demodulation and calibration and an in-depth look at insightful metrics, such as signal-to-noise ratio variations during a single current pattern. Static and dynamic images of conductivity and permittivity are presented from ACE1 data collected on tank phantoms and human subjects to illustrate the system’s utility.
Keywords: biomedical imaging, thoracic imaging, electrical impedance tomography
I. Introduction
Electrical Impedance Tomography (EIT) is a technique in which dynamic images of biological tissue impedance are formed from measurements of voltages on surface electrodes arising from injected low amplitude alternating current. Electrodes are placed circumferentially around the plane desired for image reconstruction. The images are created by solving an inverse problem to recover the distributions of conductivity and/or permittivity (complex impedance) in the body’s interior. As an imaging technique, EIT is advantageous because it is radiation-free, low-cost, portable and has a high temporal resolution. However, it often suffers from low signalto-noise ratios (SNR) and is sensitive to several modeling errors [1], [2], [3].
Thoracic EIT has been widely used to obtain images of ventilation and perfusion in the chest for a diverse array of clinical applications, too numerous to survey here. To name a few, EIT has been shown to provide information on regional ventilation distribution [4], [5], [6], [7], [8], [9] and detection of pneumothorax [10]. EIT is also a promising tool to guide setting mechanical ventilator pressures and volumes [11], [2], [12], [13]. Regional ventilation results have been verified using nitrogen washout and plethysmography, as well as dynamic CT [14], [6] and radionuclide scanning [15].
While data needed for conductivity image reconstructions is easier to obtain, certain clinical applications, such as distinguishing between pleural effusion and atelectasis (lung collapse), or pneumothorax versus lung hyperinflation [10] may benefit from the use of permittivity images. To create dynamic images which reflect changes in complex tissue impedance, the measurement of voltage phase is necessary. There are limited permittivity image reconstructions published using human subject data acquired on single frequency pairwise injection systems, but several works using the non-pairwise data from the ACT3 system, such as [16], [17], [18] and other works by the Rensselaer Polytechnic Institute EIT group.
This work details the ACE1 design and performance tests assessing key measurement system features, such as precision and accuracy which greatly influence the quality of reconstructed images. This single frequency pairwise injection system has allowed us to collect human subject and tank phantom data for difference and absolute image reconstructions of permittivity and suscectivity.
A. Review of EIT systems
The design and performance of the ACE1 electrical impedance tomography system is presented in this work. To highlight differences in this design, information about several existing EIT systems is given in Table I. Some of the biggest differences between systems include typical frame rates, frequencies of injected currents, and the type of current patterns used. For example, adaptive and trigonometric systems inject on all electrodes while pairwise systems often inject current on two electrodes at a time (bipolar).
TABLE I.
A review of existing commercial and academic EIT systems.
| System | Num. Elect. | Frames per s | Freq. [kHz] | Current Patterns |
|---|---|---|---|---|
| Timpel Englight⋆ | 32 | 50 | 125 | bipolar |
| PulmoVista 500⋆ | 16 | 20 | 80–130 | bipolar |
| Swisstom BB2 ⋆ | 16 | 10–30 | 100 | bipolar |
| Sheffield MK3.5⋆ | 8 | 25 | multi up to 1600 | bipolar |
| Goe MF II | 16 | 13 typical | 50 | bipolar |
| GE Genesis | 16 or 32 | 7.5 or 18 | 10 | Trig |
| Sheffield Mk 3a ⋆ | 16 | 33 | multi 9.6–1200 | Interlaced |
| High-Speed EIT | 32 | <100 | 30 | Tetrapolar |
| ACE1 | 32 | <33.2 | <200 | bipolar |
Commercially avaliable systems in Table I at the time of this publication are indicated by a ⋆. Table I includes the ENLIGHT R by Timpel [19], [20], PulmoVista® 500 by Dräger [21], Swisstom BB2 [22], the Sheffield MK 3.5 by Maltron [23], [24], and the Goe MF II previously produced by CareFusion [25], [26], [27]. The Genesis system is a prototype by General Electric [28] and is based on the the ACT III EIT system [29] developed Rensselaer Polytechnic Institute, which is no longer in use. The following academic systems are also included in the comparison: the Sheffield Mk 3a [25], [24], the Dartmouth High-speed Electrical Impedance Tomography System [30], and the active complex electrode (ACE1) EIT system of this paper. Most EIT systems possess unique characteristics differentiating them from others. For example, the Dartmouth high-speed EIT system applies either voltage or current and is adapted for use on several custom platforms [30], the Timpel ENLIGHT system includes an electrocardiogram (ECG) and pneumotachometer, and the Swisstom BB2 system includes a 3D accelerometer (accel.) to track body position.
One approach in EIT system design to achieve high accuracy and precision is to employ a current source with very high output impedance and use shielded cables to minimize leak current and stray capacitance between the source and the load [31], [32], [33], [34], [35], [36], [37]. An alternative design approach is to use active electrodes [38], [39] consisting of a small circuit very close to the electrode that is in contact with the subject’s skin. For accurate reconstructed images, thoracic EIT systems must measure current, but only ACE1 reports measuring current amplitude and phase with the active electrode circuit. A distinct feature of the ACE1 electrode design is that a current source with a modest output impedance can be used and reconstructions of conductivity and permittivity (or equally well, susceptivity) can still be obtained.
II. MATERIALS AND METHODS
Features of the ACE1 hardware are discussed in the following sections.
A. System Design Overview
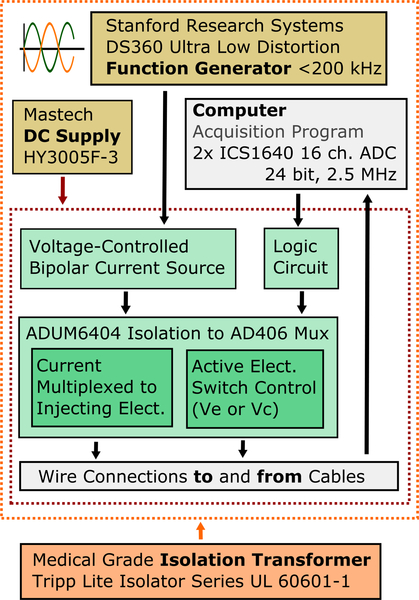
In this work, the design and performance of the ACE1 electrical impedance tomography system is presented. It was designed as a collaboration between Colorado State University (CSU) and the University of São Paulo. The ACE1 system was designed to obtain phasic-voltage measurements at a user-specified frequency of up to 200 kHz. ACE1 collects data at up to 30 ms per image frame on up to 32 electrodes. However, to acquire data with increased signal-to-noise ratio (SNR), data is most often collected at 40 ms or 62 ms per image frame. The basic system architecture is described in Figure 1, and is similar to the design of other pairwise injection systems, with the exception of the additional controls for the active electrode switches, described in more detail in Section II-C.
Fig. 1.
As shown in this overview of the ACE1 system design, it uses multiplexed digital signals to control current application and acquisition of voltages on the active electrodes (Ve or Vc).
The system in Figure 1 works by applying alternating current produced by a voltage controlled current source in a pairwise manner to all electrodes placed around the perimeter of a domain. ACE1 is capable of applying currents with amplitudes up to 5.0 mA at frequencies up to 200 kHz. Resulting voltage amplitude and phase is simultaneously measured on all electrodes and is controlled by the circuit multiplexing signals to the active electrode. The number of passive electrodes between injecting electrodes is referred to as the skip pattern. For all skip patterns, one frame is composed of a series of current patterns, which describe the position of current injection as it is rotated around the perimeter of the domain. Usually, the number of current patterns needed is the same as the number of electrodes used. As each pair of electrodes inject, current spreads through the body or phantom generating electric potentials on all electrodes. Electrical potentials are buffered from noise by the active electrodes and wired to two 16-channel synchronized ICS-1640 (GE, Intelligent Platforms) analog to digital converters (ADC) with 24 bit resolution and a sampling rate of 2.5 MHz.
B. Bipolar Current Source
The system uses an improved bipolar Howland current source, modeled after the proposed designs of Bertemes [40]. The use of the active electrode design reduces the need for a high output impedance of the current source, since the current is measured at the electrode through the calculation described in Section II-D. Thus, the main criteria for source performance in ACE1 is high frame-to-frame consistency and little mismatch between both halves of the bipolar current source.
Since the main purpose of ACE1 is for human data collection to image ventilation and perfusion, the performance of the source was assessed on human data sets. For 600 frames of data collected on a human volunteer in the EIT lab at CSU during breath-holding taken at the 512 point sample rate with mean current amplitude of 4.5 mA, amplitudes of the bipolar source were mismatched by an average of 18.7 μV and mismatched in phase by 0.0593 radians (3.40 degrees). This is well within the metrics of system precision and reproducibility discussed in Section III-B, resulting in minimal noise contributions to the system.
C. Active Complex Electrode Design
Since reconstructed image resolution is influenced by the SNR of the measured data, EIT systems often employ a current source with very high output impedance and use shielded cables to minimize leak current and stray capacitance between the source and the load [32], [35]. An alternative design approach is to use active electrodes [38] comprised of a small circuit, commonly a buffer amplifier, very close to the electrode that is in contact with the subject’s skin.
One key feature in the ACE1 design is the placement of the current measurement circuit on the active electrode. The ACE1 active electrodes measure voltages associated with electrical potentials on the periphery of the body or with injected current at a distance of <3 cm from the subject’s skin, and as a result, the injected current need not be precisely preserved between the source and the electrode. An advantage of the ACE1 design is that a low-cost current source with a modest output impedance can be used. The active electrodes are paired with low profile stranded cables to obtain both voltage amplitude and phase in addition to current amplitude and phase for every measurement channel. This also increases comfort in clinical situations. We will refer to the circuit as the active electrode and the electrode either on the tank or in contact with the skin simply as the electrode. To obtain an accurate calculation of the applied current, a distance less than 5 cm between the active electrode and the electrode has been found to be desirable [38].
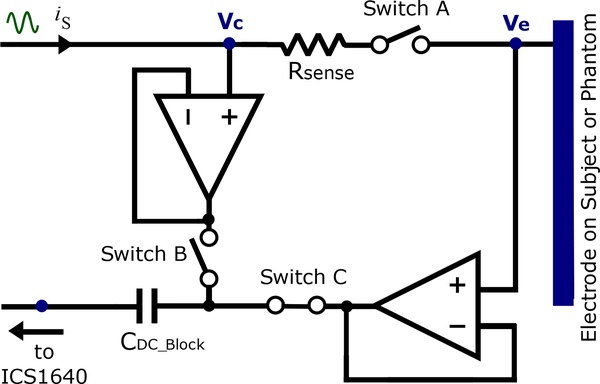
The active electrode circuit in Figure 2 includes an ADG442 switch and a small sensing resistor. Either Ve or Vc are measured on all 32 electrodes simultaneously, regardless of which pairs of electrodes are injecting. For a given current pattern, all electrodes not injecting current have switches A and B opened and C closed. This configuration allows measuring Ve (amplitude and phase) at the electrode surface when other electrodes on the subject or phantom are injecting. The pair of electrodes injecting current have switch A closed to allow current to pass, while switches B and C function in opposite states. When B is opened (and C is closed) the active electrode measures Ve (amplitude and phase). When B is closed (and C is opened) the active electrode measures Vc (amplitude and phase). With both measurements across the sensing resistor of the injecting electrodes, current can be computed. The following paragraph details the procedure of measuring Ve and Vc in the electrodes injecting current.
Fig. 2.
The design of the ACE1 active electrode allows for determining injected current and measuring electrical potentials arising on the surface of the skin.
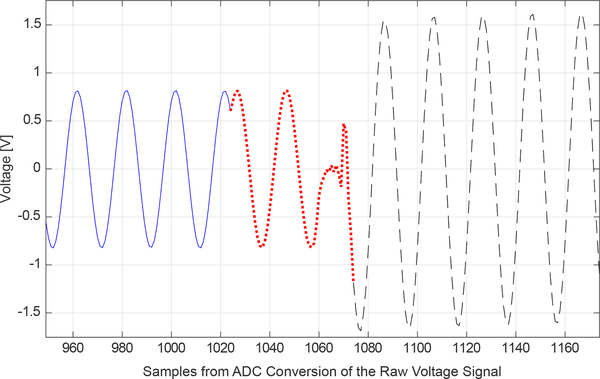
Samples resulting from ADC conversion comprise a raw voltage signal on a single injecting electrode is shown in Figure 3. The first half or first 1024 samples capture the raw Ve signal. Typically, acquiring 1024 samples with the ADC at 2.5 MHz for Ve will maximize precision and accuracy while maintaining a frame rate that is sufficient to capture most changes in ventilation and perfusion in the thorax. 256 or 512 samples are acquired when faster frame rates are desired. In the second half, another 1024 samples are acquired. In this portion (Vc), a control signal is sent to the active electrodes to change the states of switches B and C. As indicated in Figure 3, is acquired before a short switching transient and is followed by . Use of the amplitude and phase from the raw voltage signal is further described in Section II-D. When 32 electrodes are used and 1024 total samples are acquired on each electrode during a single current pattern, this results in a frame rate of 16 frames/second. Frame rates depend upon on the number of electrodes used, increasing as the number of electrodes decreases. For example, when 1024 total samples are acquired on 20 electrodes (which requires 20 current patterns), the frame rate is 40 frames/second.
Fig. 3.
Samples located in the middle of the raw voltage signal of a single injecting channel can be used illustrate key components of ACE1 measurements. The 2048 samples in the raw voltage signal on a tank phantom was sampled at 2.5 MHz. The solid blue line is Ve. The dotted red line is and includes the discarded transient from the switching operation (1060–1070), and the dashed black line is .
D. Demodulation of Phasic Voltages
The raw voltage signals on each electrode are demodulated by a matched filter to produce a phasic voltage measurement for use in image reconstruction. Portions of the raw signal from ADC conversion on each electrode are demodulated separately, as they represent different parts of amplitude and phase the Ve and Vc.
Samples 950–1170 from 2048 total samples of a raw voltage signal on one electrode is found in Figure 3. When the active electrode is set to measure Ve, the phase of the measurement on the positive injection electrode is set to zero, shifting the phase of on all other electrodes by . When the active electrode changes state to measure Vc, the voltage drop across the sensing resistor is measured. The closing of the switch induces a transient, which proves useful for obtaining the phase of the voltage. There is a delay that occupies approximately 1.5 cycles and the transient settles after about 350 samples. Referring to Figure 3, it is evident that there is a delay before the transient occurs. The delay is intrinsic to parallel port, and allows us to determine the correct phase of the applied current. Denoting the portion of the signal allotted to the voltage measurement at the sensing resistor before the transient by and the portion after the transient by , the phasic current is calculated from
| (1) |
where Rs is the value of the sensing resistor. In practice, the impedance of the switch is also taken into account. Regardless of which electrodes are injecting current, , , and are measured on each electrode during each current pattern. The phase for the positive injection electrode is chosen to be the reference phase for the current and is subsequently subtracted from each computed on each electrode for a given current pattern. Finally, the phases of the voltages on the electrodes are shifted by the reference frame for the current.
III. Performance
The performance of the ACE1 systems was assessed in a variety of ways. Firstly, the signal-to-noise ratio (Section III-A) was measured. Variations in SNR during a single current pattern are not only insightful about the performance of ACE1, but bring to light limitations that likely extend to other pairwise injection systems. The limits were determined from precision and reproducibility of measured data (Section III-B), as well as the distinguishability of tank phantoms (Section III-C).
A. Signal to Noise Ratio of Measurements
There are several factors that can influence the signal to noise ratio (SNR). These factors include: (1) quantization noise (from the finite precision of the ICS-1640 ADC), (2) noise and interference inherent to the ACE1 system, (3) noise and interference from the environment, such as those caused by person-to-person differences, lights, nearby electronic equipment and/or other medical devices attached to the patient and (4) shot noise and random noise due to thermal agitation of electrons in resistors and/or tiny fluctuations in voltages and currents of integrated circuits and components in the system [41]. In this case, noise was considered to be the difference of a demodulated voltage measurement in one frame from the average voltage measurement over many frames.
Denote the amplitude of the demodulated voltage on the lth electrode for the kth current pattern and ith frame by and denote the average over N frames by . The SNR for the lth electrode and kth current pattern is defined by:
| (2) |
A disadvantage of pairwise current injection EIT systems when compared to adaptive or trigonometric current pattern systems is that the SNR is significantly lower on non-injection electrodes, and so the overall SNR is lower on pairwise systems. Additionally in EIT, there exists a trade-off between the frame-rate and the number of samples that can be acquired.
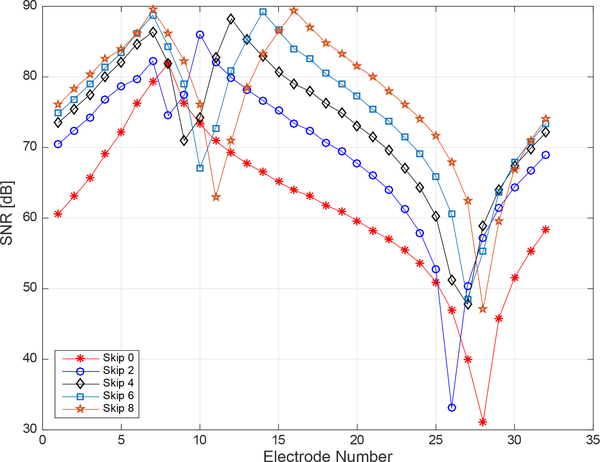
The experimentally determined SNR of each channel in the ACE1 the system was computed by collecting 250 frames of data on a saline-filled tank with an approximate conductivity of 0.8 mS/cm. This data was collected at 16 frames/second on 32 electrodes for a 125 kHz applied current with 2.8 mA amplitude. In Figure 4, the SNR on each electrode is plotted for the 7th current pattern for the Skip patterns 0, 2, 4, 6, and 8. The decrease in SNR as distance from the injection electrodes increases is evident in Figure 4, where values of SNR vary from as high as 90 dB on injection electrodes to as low as 32 dB on a distant electrode for the Skip 0 pattern. As the number of electrodes skipped in a pattern increases, the SNR of electrodes furthest from the injection electrodes also increase.
Fig. 4.
Experimental signal-to-noise ratio differences were computed for each electrode for current pattern (k) 7 from 5 different datasets using different skip patterns. Each dataset contains 250 frames of data collected on a saline-filled tank at 16 frames/second. In k=7, electrode 7 is an injecting electrode and the skip pattern specifies the number of electrodes in between 7 and the next injecting electrode.
The SNR on injecting and near electrodes is consistent with reported SNR values of EIT systems surveyed in a recent review by Avery which report the SNR of most systems to be approximately 80 dB with a maximum reported value of 120 dB [42]. Reported ACE1 SNR values reflect typical operating conditions for most human subject and tank data collections. As the measurements from injecting electrodes can be and often are used in ACE1 reconstructed images, they are included in Figure 4.
B. Precision and Reproducibility of Data
Since the resolution of EIT images is limited by the precision of measured data, the precision and reproducibility of ACE1 data was tested.
Precision is defined as the variability of the smallest detectable change in voltage measurements [43]. In this work, we use one standard deviation (std) to define the precision of the amplitude and phase of the demodulated Ve measurement. Denoting the total number of frames by N, the total number of electrodes by L, the total number of applied current patterns by K, and the amplitude of the measured voltage on the lth electrode for the kth current pattern by , the following formula was used to calculate the precision of amplitude measurements for the lth electrode and kth current pattern:
| (3) |
The mean precision is defined to be the mean of all values of , l, k = 1, …, L.
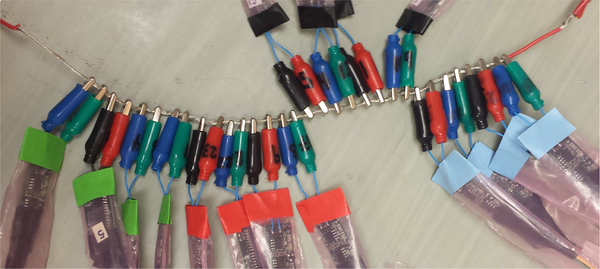
To demonstrate the precision and accuracy of the system, all channels were connected to the same NIST traceable voltage source, and 100 frames of data were collected. See Figure 5 for a photo of the experimental configuration.
Fig. 5.
Test set-up where all of the ACE1 cables were connected to the same voltage source and 100 frames of data were collected. Inputs to the ACE1 current source were grounded.
At 125 to 175 kHz applied frequencies, voltage amplitude measurements are precise to 25 μV when 2048 samples are acquired at 2.5 MHz on all electrodes (or at 16 frames/second for L = 32). The choice of skip pattern did not influence the amplitude precision, but in tests acquiring more samples or decreasing the frame rate often improved amplitude precision by approximately 10–20 μV.
Define a relative, or percent, precision for l, k = 1, …, L and f = 1, …, N by
| (4) |
where, as before, is a mean over the number of frames N. Define the percent mean precision to be the average of for l, k = 1, … L, f = 1, …, N. Values of the percent mean precision for a 0.25 Vpk voltage signal at 75, 125, and 175 kHz are reported in Table II, where additionally, the values in this table take the mean of the mean percent precisions for skip 0, 2, 4, 6 and 8 datasets to best represent the overall behavior of the system. The percent precision of the amplitude measurements improves as the number of raw measurement samples acquired increases. For example, %P improves from 0.0098% at 125 kHz to 0.0076% when increasing the number of samples from 512 to 1024. This improvement is true for all skip patterns and tested frequencies.
TABLE II.
Percent mean precision of amplitude and phase .
| Freq. (kHz) | 512 samples | 1024 samples | 512 samples | 1024 samples |
|---|---|---|---|---|
| 175 | 0.0055 | 0.0039 | 0.899 | 0.557 |
| 125 | 0.0098 | 0.0076 | 0.782 | 0.658 |
| 75 | 0.0391 | 0.0277 | 0.614 | 0.398 |
Since the phase of the voltage source is not specified for each frame, the precision of the phase only considers the change in the phase profile over all electrodes for each current pattern k as k varies over all frames. Therefore, the precision of the phase of the voltage measurements is computed over f and l and is defined for the kth current pattern by:
| (5) |
The relative, or percent phase precision for l, k = 1, …, L and f = 1, …, N is given by
| (6) |
where is the mean of over the electrodes, and the overall mean %Pθ is given by the mean of over the total number of frames and current patterns. All tested frequencies were precise to within 0.045 radians (2.6 degrees). The precision of phase values was not greatly influenced by the choice of skip pattern or frame rate. Percent phase precision for different frequencies and averaged over the tested skip patterns is given in Table II.
Accuracy of the voltage measurements is defined to be the difference between the measured quantity and true value v [43]. v was accepted to be the settings on the NIST traceable Stanford Research Systems Model DS260 Ultra Low Distortion high precision function generator. The accuracy of amplitude measurements is taken as the mean value of over all frames. The percent accuracy for l, k = 1, …, L and f = 1, …, N is defined by
| (7) |
The mean percent accuracy is the average of over all electrodes, current patterns, and frames.
ACE1 system accuracy varies from 96.309% to 97.912% at frequencies from 75 to 175 kHz. The most accurate measurements were collected at 125 kHz.
The reproducibility of system measurements is the ability to measure the same output for the same input over a period of time [43]. The reproducibility with respect to amplitude and phase, respectively, is defined by
| (8) |
| (9) |
Measures of reproducibility take into account the geometry and layout of the ACE1 system, variations in contact impedance for each channel, source performance, and precision of measurements. Reproducibility experiments were performed on a homogeneous tank phantom containing approximately 0.8 mS/cm saline, and datasets contain 250 frames collected for an injected 125 kHz current with a 2.8 mA amplitude. The precision with which voltage amplitudes are reproducible was calculated using (3). At 125 kHz, voltage amplitudes were reproducible to within 60 μV, and most voltage phase measurements were reproducible to within 0.05 to 0.1 radians.
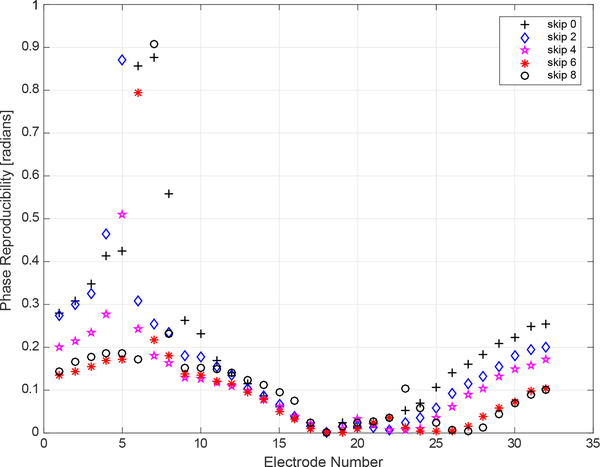
Amplitude reproducibility is not dependent upon electrode location relative to the injecting pair of electrodes, but this location does make a difference in phase reproducibility as shown in Figure 6. As seen in the figure, electrodes 4 – 8 (which are located on the opposite side of the tank from injecting electrodes) exhibited a significant decrease in reproducibility for some of the applied current patterns. Future improvements to the ACE1 system will focus on improving phase reproducibility so that the values are near the limits of the precision of the system on all electrodes no matter their proximity to the pair of injecting electrodes (which for k = 18 is electrodes 18 and 19 for skip 0, electrodes 18 and 21 for skip 2, and similarly for the other skip patterns). As illustrated in Figure 6, the further the measurement electrode is from the injecting electrodes, the less reproducible the phase measurement. Improving this aspect of ACE1 performance will result in improved susceptivity image reconstructions in the future.
Fig. 6.
Phase reproducibility at 125 kHz for 250 frames of tank data acquired at 1024 sample/rate for a single current pattern (k = 18).
C. Distinguishability Experiments
Distinguishability is a measure of a system’s ability to resolve differences between two different conductivity distributions. Several definitions of distinguishability have been given in the literature and compared [44], [45], and the best choice of definition is often dependent upon the desired calculation. The presence of an inhomogeneity can be detected if at least one measured voltage difference , where denotes the measured voltage with a target in the tank and the homogeneous tank, is larger than the measurement precision of the system [45].
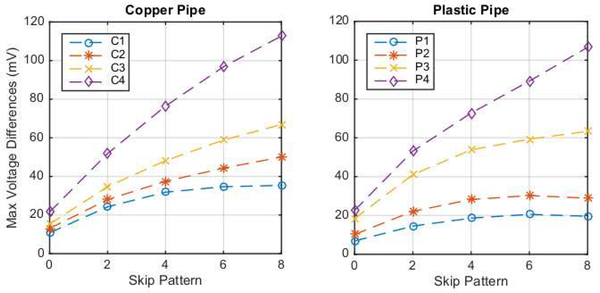
To determine the extent to which the ACE1 system voltages are able to resolve differences between tank phantom targets, a simple experiment was performed. In this test, the voltage measurements on 32 electrodes were compared for differences between acquired data at 125 kHz, 16 frames/second, and a current amplitude of 2.4 mA on a saline-filled tank with saline conductivity 0.18 S/m and data with a copper or plastic pipe of variable diameter placed in the center. The plastic and copper pipe targets had outer diameters 0.95 cm, 1.3 cm, 2.2 cm, and 2.88 cm for the plastic targets P1, P2, P3, P4, respectively, and 1.1 cm, 1.45 cm, 1.8 cm and 2.45 cm for the copper targets C1, C2, C3, C4, respectively.
Maximum differences in voltage measurements defined by
| (10) |
are plotted in Figure 7 for the copper pipe and plastic targets as a function of skip pattern. All patterns and targets exhibit a maximum voltage difference greater than the experimentally determined amplitude precision of 25 μV and reproducibility of 60 μV.
Fig. 7.
Max voltage differences over all electrodes and current patterns for copper and plastic pipe targets in the center of a saline-filled tank compared to voltages in a homogeneous tank with data collected at 125 kHz with 1.8 mS/cm saline and current amplitude of 2.4 mA.
Difference images computed using the 2-D D-bar method with the texp approximation [46] clearly indicated the presence of the target with good spatial resolution and few to no artefacts, except in the case of the smallest targets C1 and P1 with the skip 0 current pattern. In that case the target was arguably not visible due to significant blurring and the presence of artefacts with magnitudes similar to that of the targets. This problem is likely due to the lack of depth of penetration of the skip 0 patterns, making a target in the center very difficult to detect. Since the reconstructions consist of simply an inhomogeneity in the center of the image, they are not included in the manuscript in favor of including the reconstructions of biological targets and human subject data found in the next section.
IV. Reconstructions
Arguably the most important measure of an EIT system’s worth is the quality of the images produced from its data. While the images are also highly algorithm dependent, good images cannot be produced from low-quality data. Here we show results from several types of images: absolute and difference images from data collected on a saline-filled tank, difference images of ventilation and perfusion on a healthy human subject in the lab, and reconstructions from a data set collected on a patient at Children’s Hospital Colorado (CHCO) during normal tidal breathing, demonstrating the robustness of the ACE1 system for hospital use. Reconstructions were computed using an iterative Gauss-Newton algorithm for the experimental tank data and by the D-bar method and Calderón’s method for human subject data to demonstrate the suitability of the data for use with various algorithms. We chose to use the D-bar and Calderón algorithms for reporting results on human subjects because of their ability to provide fast (real-time) reconstructions [46], [47] without the need for an accurate computation forward model (such as a Finite Element Method on a fine mesh) and because this combination of hardware and software has been used in our clinical studies in collaboration with CHCO [48]. It is not the purpose of this paper to compare the accuracy and performance of the reconstruction algorithms.
The governing equation for EIT is the generalized Laplace equation
| (11) |
where u is the electric potential potential, Ω denotes the 2-D bounded domain, and γ = σ+iωϵ is the admittivity, with real part σ, the conductivity, imaginary part ωϵ, the susceptivity, ϵ the permittivity, and ω the angular frequency of the applied currents. It is also assumed that the applied current satisfies Kirchhoff’s Law, and the measured voltage distribution on the boundary corresponds to the Dirichlet boundary condition u|∂Ω = f. The data for the inverse problem of determining γ is the voltage-to-current density, or Dirichlet-to-Neumann (DN) map Λγ defined by . Further details on mathematical aspects of the inverse conductivity problem can be found in [3], for example.
A. Experimental Tank Data
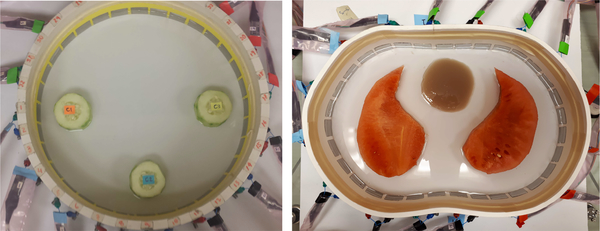
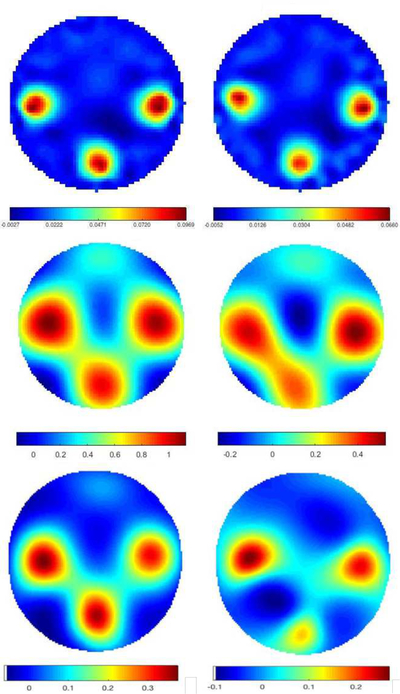
Data was collected on two experimental tank configurations. The first was a 30 cm diameter circular tank filled with 0.18 S/m conductive saline to a height of 1.6 cm with 32 electrodes of width 2.54 cm. The skip 0, or adjacent, current patterns were applied at 125 kHz with a current amplitude of 3.3 mA. Peeled cucumber slices 5 cm in diameter, chosen for their nonzero permittivity properties were placed in the tank in a triangular configuration (see Figure 8). Difference images of conductivity and susceptivity with the saline-filled tank with no targets as a reference were computed using a Gauss-Newton (GN) iterative method with the approximation error method [49], [50] and two direct methods: Calderón’s method [51] as implemented in [47], and the D-bar method for complex conductivities [52], [18]. Plots of the reconstructions are found in Figure 9. While all three methods clearly identify the positions of the cucumbers in both the real and imaginary parts of the reconstructions, the direct methods overestimate the size of the cucumber, and a conductive artifact is present at the twelve o’clock position in the tank.
Fig. 8.
Photos of the cucumber targets in the saline-filled tank. Left: Triangle configuration of cucumber targets. Right: Watermelon “lungs” and agar “heart” in a saline bath.
Fig. 9.
Difference images of cucumber targets. Top row: computed with 5 iterations of the Gauss-Newton method. Center row: computed with Calderón’s method. Bottom row: computed with the D-bar method for complex conductivities. Left: conductivity σ, Right: susceptivity ωϵ. Units are in S/m.
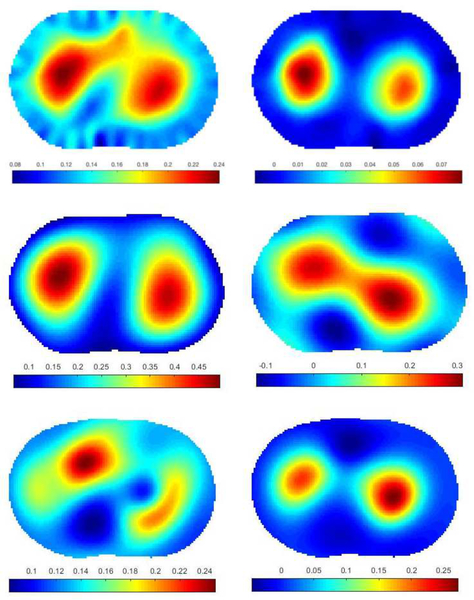
The second experimental data set was collected on a chestshaped tank with a 103 cm perimeter filled with conductive saline to a height of 1.7 cm with 32 electrodes of width 2.54 cm and the adjacent current patterns applied at 125 kHz with a current amplitude of 3 mA. The phantom heart was made from agar, and watermelon slices were used as phantom lungs. The conductivity of the saline and agar were measured using an Omega CDH221 conductivimeter and found to be 0.125 S/m for the saline and 0.26 S/m for the agar. The susceptivity of the melon and cucumber are known to be positive but their specific values are unknown since an independent measurement device for permittivity was not available. Conductivity values for the cucumber and watermelon are also unknown since the conductivimeter is not meant for use with fruit. See Figure 8 for a photo of the experimental configuration.
The absolute images of conductivity and susceptivity reconstructed by the Gauss-Newton method, Calderón’s method, and the D-bar method for complex conductivities are presented in Figure 10. The agar heart is clearly visible in the conductivity image, but blurs with the left watermelon lung slice. The agar heart is not visible in the susceptivity image since the agar has the same permittivity as the saline, which is nearly 0. The positive permittivity of the watermelon lungs is also correct for these targets.
Fig. 10.
Absolute images of melon and agar targets. Top row: computed with the Gauss-Newton method for complex admittivities. Center row: computed with Calderón’s method. Bottom row: computed with the the D-bar method for complex conductivities. Left: conductivity σ, Right: susceptivity ωϵ. Units are in S/m.
B. Human Subject Data
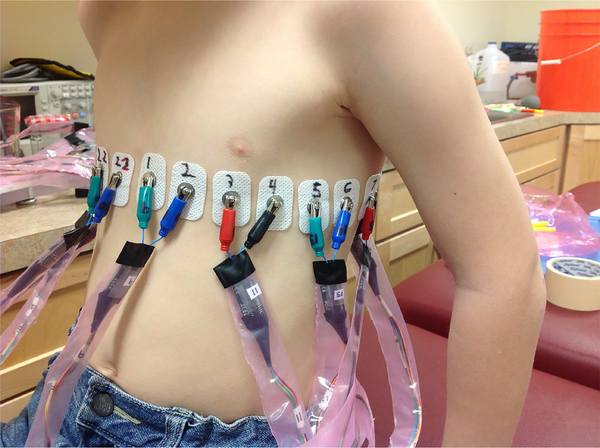
Data were collected in the EIT lab at Colorado State University (CSU) and at Children’s Hospital Colorado (CHCO), Aurora, CO under the approval of the COMIRB (approval number COMIRB 14–0652) with CHCO and the University of Colorado Denver and the IRB of Colorado State University. Figure 11 shows a photo of a healthy 8 year old human subject being imaged in the lab at CSU with 22 electrodes around the chest circumference. The electrodes used in all human data collection in this paper were Philips 13951C rectangular neonatal-pediatric solid gel snap electrodes, of width 2.22 cm and height 3.33 cm. For human data reconstructions, direct methods, such as the D-bar method and Calderón’s method, are used due to their ability to reconstruct images in realtime [46], [47].
Fig. 11.
Data collection on a healthy eight-year old subject at CSU.
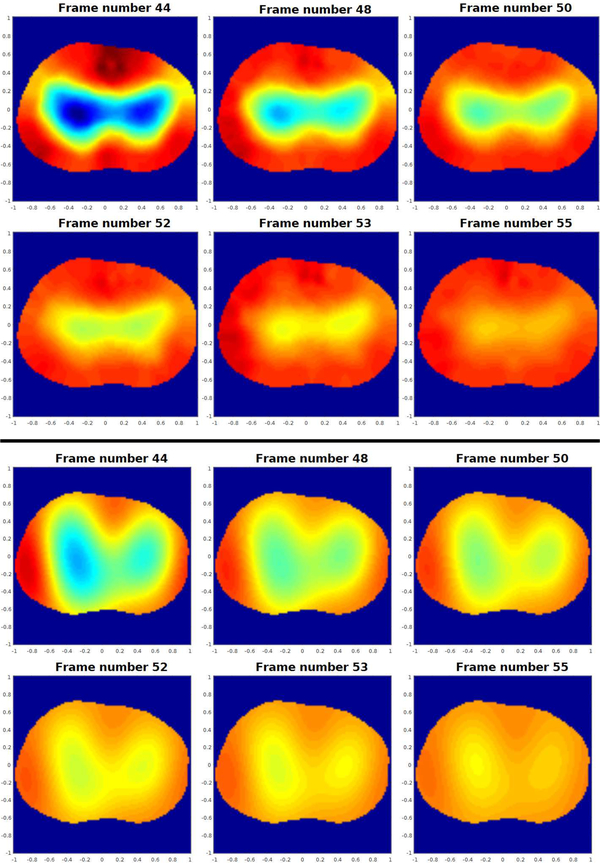
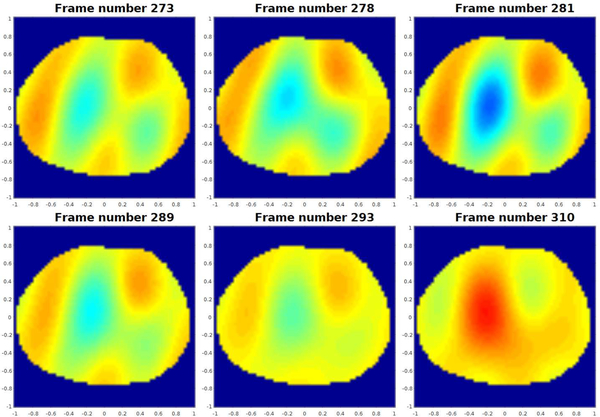
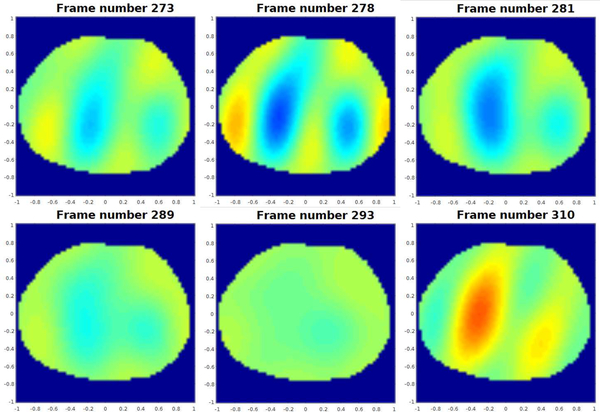
Figure 12 contains reconstructions using the Gauss-Newton (GN) and the D-bar method for real-valued conductivities based on the global uniqueness proof [53] with the texp approximation. Six frames are shown from a sequence of 500 conductivity difference images collected on an adult male subject during tidal breathing depicting changes due to ventilation in the human chest. The data was collected using the skip 0 current pattern with a current amplitude of 3 mA at 125 kHz with 1024 samples, corresponding to 16 frames/s on the 32 electrodes placed around the chest of the adult male subject who had a chest perimeter of 87.63 cm. The shape of the chest at the level of the electrodes was estimated for the reconstruction using flexible rulers wrapped around the chest while the electrodes were still attached and the center of each electrode was marked. The sequence in Figure 12 depicts exhalation. The subject took 10 breaths over the 500 frames, corresponding to approximately 50 frames per breath, or 3.125 s/breath, which is relatively rapid breathing. The reference image was a frame at the end of exhalation. While the GN and D-bar methods yield different shapes for the lungs in the reconstructions, the changes due to ventilation are clearly visible and consistent with each other. Since there is no ground truth available, an evaluation of the accuracy of these reconstructions is not possible. The reader is referred to [3], [54], [55], [56] for further details on this D-bar algorithm.
Fig. 12.
Sequence of conductivity difference images reconstructed from data collected during exhalation depicting changes due to ventilation in the human chest. Top set of images: computed with the Gauss-Newton method. Bottom set of images: computed with the D-bar method for real-valued conductivities. Here red corresponds to high conductivity and blue to low conductivity. The images are displayed in DICOM orientation.
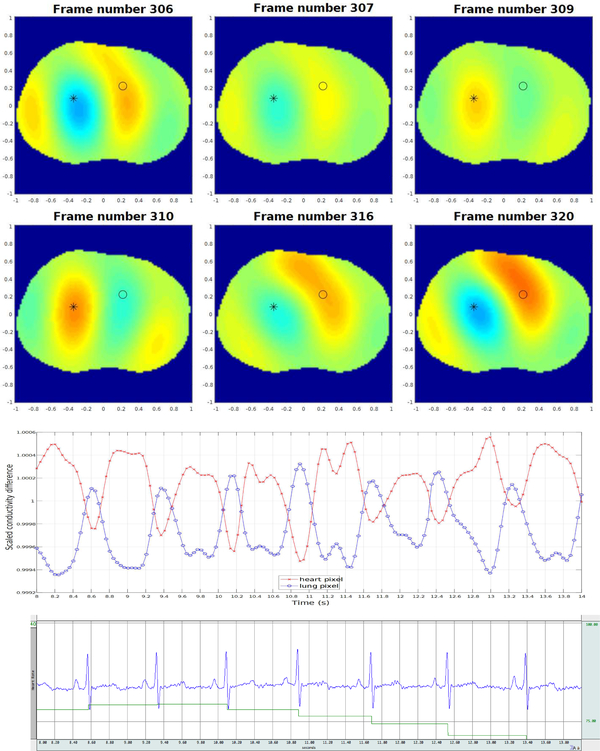
Figure 13 contains six frames in a sequence of 500 conductivity difference images collected during breath-holding depicting changes due to pulsatile perfusion in the human chest. The data was collected using the skip 2 current pattern with a current amplitude of 3 mA at 125 kHz with 512 samples, corresponding to 25 frames/s on the 32 electrodes placed around the chest of the same male subject. The heart and lungs are more blurred than they are in the ventilation sequence, which may be due to the movement of the heart during systole. Since the reference image was chosen to be mid-systole, the heart is only in the position of the reference image for a very brief time, and so it is to be expected that all relative images show a difference in conductivity over a greater region. Also in Figure 13, the time trace of the reconstructed conductivity value in a pixel from the heart region and in a pixel from the lung region are plotted on the same set of axes, and the ECG data measured simultaneously with Biopac is plotted below. The pixels for the heart and lung regions were chosen empirically, and the choice of heart pixel was confirmed by verifying the correlation of the periodic changes in conductivity of that pixel with the heart rate from the ECG. In addition, each R-wave in the ECG, which signifies the onset of the contraction of the ventricles, corresponds to a minimum value of conductivity in the time trace of the heart pixel within 0.08s (2 frames). The rapid decrease in conductivity in the heart pixel is accompanied by a rapid increase in the lung pixel, corresponding to the contraction of the ventricles. Similar plots indicating conductivity changes corresponding to pixels from the heart and lung regions can be found in [57], [58], [59], [60]. Reconstructions were computed with the same texp implementation of the D-bar algorithm as used for the ventilation images in Figure 12.
Fig. 13.
Top: Sequence of conductivity difference images from the D-bar method for real-valued conductivities collected during breath-holding depicting changes due to perfusion in the human chest. Here red corresponds to high conductivity and blue to low conductivity. The images are displayed in DICOM orientation. Center: Time trace (in number of frames) of the reconstructed conductivity value in a pixel from the heart region (designated by a black * in the sequence of images above and plotted in the time trace in red), and the reconstructed conductivity value in a pixel from the lung region (designated by a black o in the sequence of images above and plotted in the time trace in blue). The rapid decrease in conductivity in the heart pixel is accompanied by a rapid increase in the lung pixel, corresponding to the contraction of the ventricles. Bottom: ECG data collected using Biopac simultaneously with the EIT data in this figure. The blue line is the output of the three-lead EKG and the green line is the average heart rate from the Biopac output.
Data was collected on a 12-year-old male patient with cystic fibrosis at CHCO during tidal breathing on 22 electrodes with adjacent current patterns of amplitude 3.3 mA. The shape of the chest at the level of the electrodes was estimated for the reconstruction from a CT scan that the subject received as part of his standard care immediately following the EIT data collection. The locations of the electrodes were marked using fiducial markers. Difference images of conductivity and susceptivity were computed using the implementation of Calderón’s method [51] presented in [47] are presented in Figures 14 and 15 for six frames from the sequence. The reference frame for these difference images was midway between the subject’s full exhalation and full inhalation.
Fig. 14.
Time snapshots of conductivity difference images in the ventilator sequence computed using Calderón’s method. Here red corresponds to high conductivity and blue to low conductivity. The images are displayed in DICOM orientation.
Fig. 15.
Time snapshots of susceptivity difference images in the ventilatory sequence computed using Calderón’s method. Here red corresponds to high susceptivity and blue to low susceptivity. The images are displayed in DICOM orientation.
C. Transfer impedances of data
To illustrate the sensitivity of ACE1 measurements to physiological changes, the transfer impedance TI was calculated for the sequences of perfusion images in Figure 13 and the sequence of ventilation images in Figure 15. The transfer impedance on the lth electrode for current pattern k was calculated by , where Ae is the area of the electrode at the electrode-skin interface.
We present the real component TIr, the imaginary component TIi, the magnitude TIm, and the phase TIθ of the transfer impedance. The real and imaginary components are of interest since they are the components used to reconstruct conductivity and susceptivity, respectively. In this sense, TIr and TIi are more readily understood in the context of changes in regional ventilation and perfusion depicted in the reconstructed images. However, in the system performance sense, TIm and TIθ may be more natural representations. In this section, the mean TI on non-injection electrodes is compared to the TI on the leading injection electrode during a single current pattern. All of the TI representations capture the higher contact impedance on injection electrodes, and allow us to illustrate the very valuable physiological information contained in these measurements.
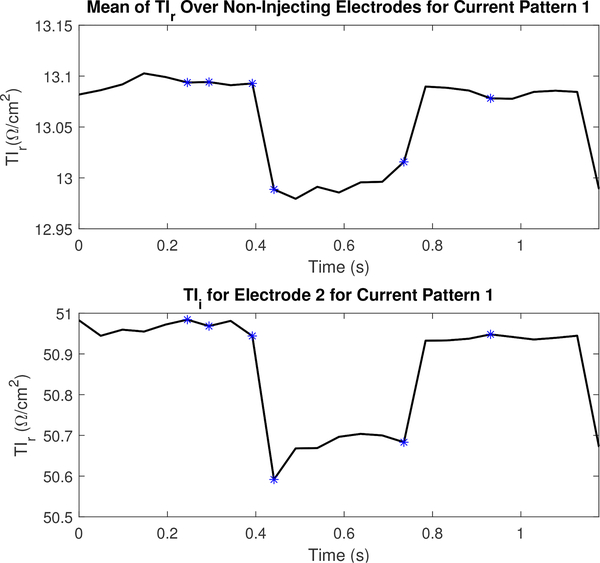
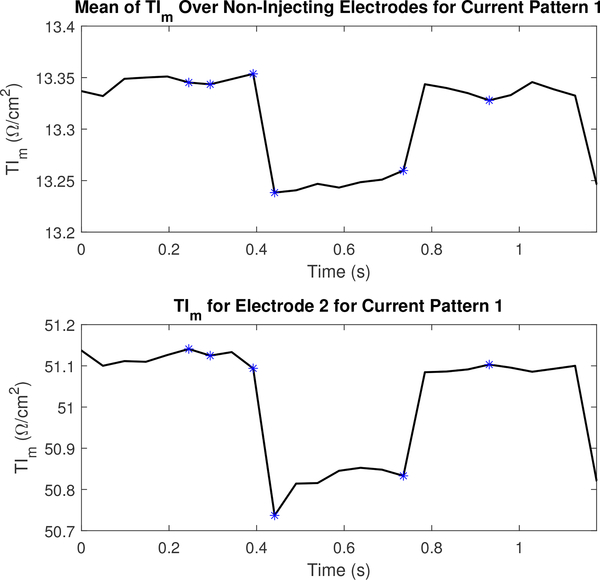
Figures 16 and 17 display the mean values TIr and TIm for a portion of the dataset collected to reconstruct the images in Figure 13 and their values on electrode 2. The figures include the 5 frames preceding and following the images shown in Figure 13. The TI corresponding to the frames shown in Figure 13 are marked using an asterisk. Transfer impedances are shown for current pattern 1 and electrode 2 since electrode 2 is located just to the subject’s left of the sternum (where electrode 1 is located), and is therefore anatomically positioned so that it is sensitive to perfusion-related changes in the heart. Additional TI figures are located in appendix B to illustrate the difference across several other electrodes in a single current pattern.
Fig. 16.
The real component of the transfer impedance (TIr) for non-injecting electrodes and the leading injecting electrode or l = 2 for the first current pattern (k =1). Each asterisk corresponds to the sequential series of images shown in Figure 13.
Fig. 17.
The magnitude component of the transfer impedance (TIm) for non-injecting electrodes and the leading injecting electrode or l =2 for the first current pattern (k =1). Each asterisk corresponds to the sequential series of images shown in Figure 13.
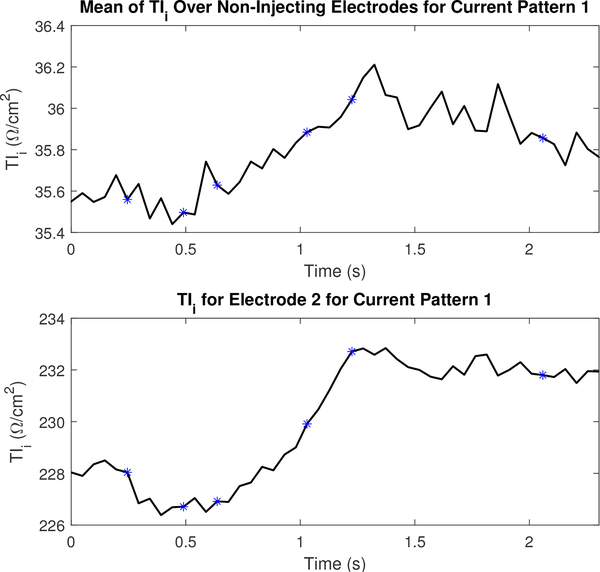
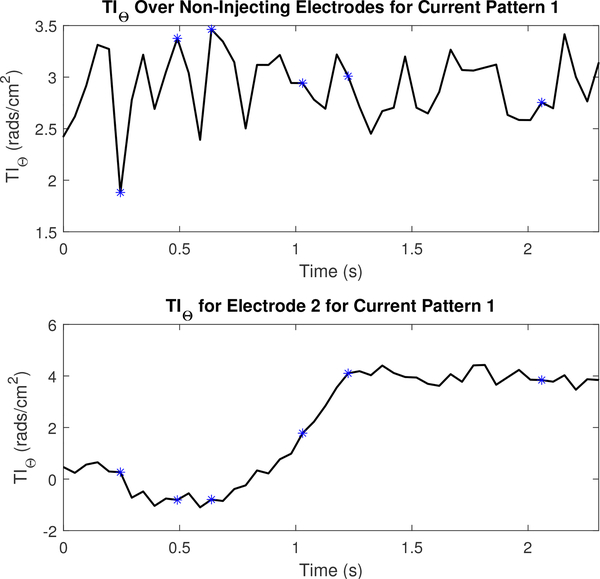
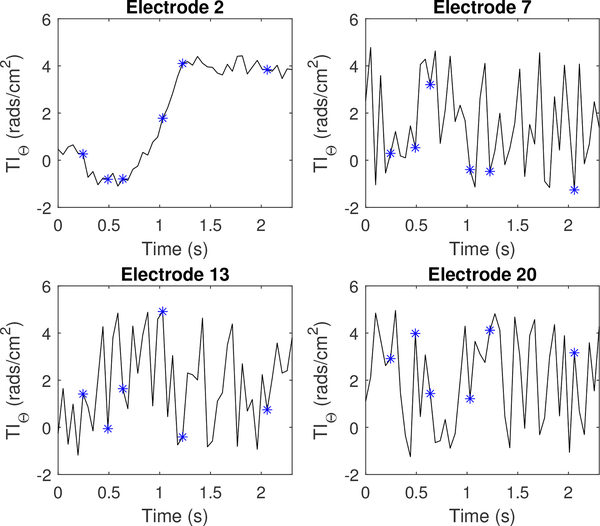
Figures 18 and 19 display the mean values TIi and TIθ for a portion of the dataset collected to reconstruct the images in Figure 15 and their values on electrode 2. The figures include the 5 frames preceding and following the images shown in Figure 15. An increase in the TI at the electrode-skin interface is consistent with the increase in lung tissue impedance that occurs during inspiration. For both the TIi and the TIθ, the leading injection electrode strongly tracks this physiological change. However, on non-injection electrodes, the ventilation signal as observed through changes in the TI is most clearly observed using the TIi component rather than TIθ. The plot of the phase on electrode 2 in Figure 19 especially is consistent with the increase in permittivity per unit volume in a small region of the lung as the subject exhales since the amount of lung tissue per unit volume, which is capacitive, increases during exhalation. Additional TI figures for this dataset are located in appendix B.
Fig. 18.
The imaginary component of the transfer impedance (TIi) for non-injecting electrodes and the leading injecting electrode or l =2 for the first current pattern (k =1). Each asterisk corresponds to the sequential series of images shown in Figure 15.
Fig. 19.
The phase component of the transfer impedance (TIθ) for non-injecting electrodes and the leading injecting electrode or l =2 for the first current pattern (k =1). Each asterisk corresponds to the sequential series of images shown in Figure 15.
V. Conclusions
The ACE1 system applies pairwise current patterns on up to 32 electrodes at a user-specified frequency up to 200 kHz. The use of the active electrode design reduces the need for a high output impedance of the current source, since the current is measured at the electrode. Phasic single-ended voltages are measured on all electrodes for the reconstruction of conductivity and permittivity. The optimal operating frequency when considering SNR, precision, accuracy, and reproducibility is 125 kHz, and the sample rate of 1024 samples per frame maximizes precision and accuracy while maintaining a fast data acquisition speed of 16 frames/s on 32 electrodes. At 125 kHz and the 1024 samples, the ACE1 system has a percent mean amplitude precision of 0.0076%, or 25 μV, and a percent mean amplitude accuracy of 96.9%. The percent precision for phase is 0.658%. At 125 kHz, voltage amplitudes were reproducible to within 60 μV, and most voltage phase measurements were reproducible to within 0.05 to 0.1 radians. Distinguishability experiments confirmed that copper and plastic targets 1 cm in diameter can be detected in the center of a saline-filled tank in the voltage measurements. Reconstructions of conductivity and susceptivity of targets in the tank and ventilation and perfusion in human subjects demonstrate the utility of the system for imaging ventilation and perfusion in the human torso.
Acknowledgments
This project described was supported by Award Numbers R21EB016869 and R21EB009508 from the National Institute Of Biomedical Imaging And Bioengineering. The content is solely the responsibility of the authors and does not necessarily represent the official view of the National Institute Of Biomedical Imaging And Bioengineering or the National Institutes of Health. Thanks are also extended to the Institute of International Education Whitaker International Program which provided partial support for M. Mellenthin during the initial development of ACE1. The authors thank the anonymous reviewers for their suggestions, which have resulted in many improvements in the paper.
Appendix A
Explanation of Current Patterns
The skip pattern used by ACE1 can be easily modified, but is typically chosen so that the maximum number of linear independent current patterns (N) is used. The skip pattern is determined by the number of electrodes in between injecting electrodes (α). For pairwise injection with L electrodes, N = L−gcd(L, α+1), where gcd is the greatest common divisor [46]. Table III lists the injecting electrodes for the bipolar current source during each current pattern for several different skip patterns.
TABLE III.
In a single frame, the number of current patterns is the same as the number of electrodes used. A list of injecting electrodes for each current pattern for skip patterns 0, 1, 2, 3, and 4 is provided. In this example, we assume only 20 electrodes are in use.
| Current Pattern | Skip 0 | Skip 1 | Skip 2 | Skip 3 | Skip 4 |
|---|---|---|---|---|---|
| 1 | 1,2 | 1,3 | 1,4 | 1,5 | 1,6 |
| 2 | 2,3 | 2,4 | 2,5 | 2,6 | 2,7 |
| 3 | 3,4 | 3,5 | 3,6 | 3,7 | 3,8 |
| 4 | 4,5 | 4,6 | 4,7 | 4,8 | 4,9 |
| 5 | 5,6 | 5,7 | 5,8 | 5,9 | 5,10 |
| 6 | 6,7 | 6,8 | 6,9 | 6,10 | 6,11 |
| 7 | 7,8 | 7,9 | 7,10 | 7,11 | 7,12 |
| 8 | 8,9 | 8,10 | 8,11 | 8,12 | 8,13 |
| 9 | 9,10 | 9,11 | 9,12 | 9,13 | 9,14 |
| 10 | 10,11 | 10,12 | 10,13 | 10,14 | 10,15 |
| 11 | 11,12 | 11,13 | 11,14 | 11,15 | 11,16 |
| 12 | 12,13 | 12,14 | 12,15 | 12,16 | 12,17 |
| 13 | 13,14 | 13,15 | 13,16 | 13,17 | 13,18 |
| 14 | 14,15 | 14,16 | 14,17 | 14,18 | 14,19 |
| 15 | 15,16 | 15,17 | 15,18 | 15,19 | 15,20 |
| 16 | 16,17 | 16,18 | 16,19 | 16,20 | 16,1 |
| 17 | 17,18 | 17,19 | 17,20 | 17,1 | 17,2 |
| 18 | 18,19 | 18,20 | 18,1 | 18,2 | 18,3 |
| 19 | 19,20 | 19,1 | 19,2 | 19,3 | 19,4 |
| 20 | 20,1 | 20,2 | 20,3 | 20,4 | 20,5 |
Appendix B
Additional Transfer Impedance Information
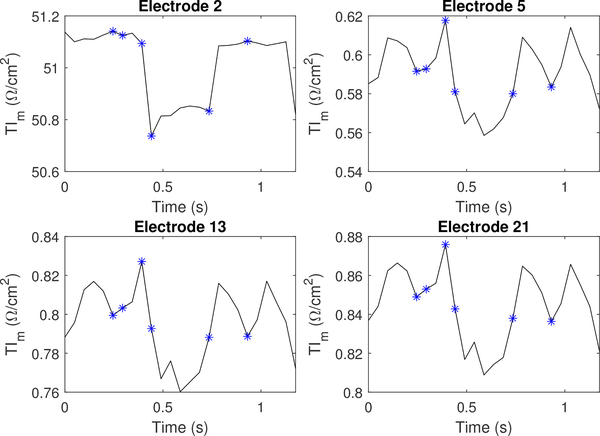
This appendix shows alternative plots of transfer impedance (TI), which include plots on individual electrodes during a single current pattern. Figure 20 and Figure 21 show randomly selected electrodes for a perfusion and ventilation dataset, respectively.
Fig. 20.
The magnitude component of the transfer impedance (TIm) for injection electrode l =2, as well as 3 non-injecting electrodes. Each asterisk corresponds to the sequential series of images shown in Figure 15.
Fig. 21.
The phase component of the transfer impedance (TIθ) for injection electrode l = 2, as well as 3 non-injecting electrodes. Each asterisk corresponds to the sequential series of images shown in Figure 15.
Contributor Information
Michelle M. Mellenthin, School of Biomedical Engineering, Colorado State University, CO 80523 USA.; Department of Bioengineering at the University of Colorado, CO 80045 USA.
Jennifer L. Mueller, Department of Mathematics and School of Biomedical Engineering and the Department of Electrical and Computer Engineering, Colorado State University, CO 80523 USA.
Erick Dario León Bueno de Camargo, Center for Engineering, Modeling and Applied Social Sciences, Federal University of ABC, São Paulo, Brazil.
Fernando Silva de Moura, Center for Engineering, Modeling and Applied Social Sciences, Federal University of ABC, São Paulo, Brazil.
Talles Batista Rattis Santos, Mechanical Engineering Department, University of São Paulo, São Paulo, Brazil.
Raul Gonzalez Lima, Mechanical Engineering Department, University of São Paulo, São Paulo, Brazil.
Sarah J. Hamilton, Department of Mathematics, Statistics, and Computer Science; Marquette University, Milwaukee, WI, 53233 USA
Peter A. Muller, Department of Mathematics, Colorado State University, CO 80523 USA.; Mathematics Department, Rowan University, Glassboro, NJ, USA
Melody Alsaker, Department of Mathematics, Colorado State University, Fort Collins, C0, 80523 USA.; Department of Mathematics; Gonzaga University, Spokane, WA 99258
References
- [1].Holder D, Ed., Electrical impedance tomography; methods, history, and applications. IOP publishing Ltd., 2005. [Google Scholar]
- [2].Costa E, Lima R, and Amato M, “Electrical impedance tomography,” Current Opinion in Critical Care, vol. 15, pp. 18–24, 2009. [DOI] [PubMed] [Google Scholar]
- [3].Mueller J and Siltanen S, Linear and Nonlinear Inverse Problems with Practical Applications. SIAM, 2012. [Google Scholar]
- [4].Blankman P and Gommers D, “Lung monitoring at the bedside in mechanically ventilated patients,” Current Opinion in Critical Care, vol. 18, no. 3, pp. 261–266, 2012. [DOI] [PubMed] [Google Scholar]
- [5].Pham T, Yuill M, Dakin C, and Schibler A, “Regional ventilation distribution in the first 6 months of life,” European Respiratory Journal, vol. 37, no. 4, pp. 919–924, 2011. [DOI] [PubMed] [Google Scholar]
- [6].Frerichs I, Hinz J, Herrmann P, Weisser G, Hahn G, Dudykevych T, Quintel M, and Hellige G, “Detection of local lung air content by electrical impedance tomography compared with electron beam ct,” Journal of Applied Physiology, vol. 93, no. 2, pp. 660–666, 2002. [DOI] [PubMed] [Google Scholar]
- [7].Frerichs I, Schmitz G, Pulletz S, Schdler D, Zick G, Scholz J, and Weiler N, “Reproducibility of regional lung ventilation distribution determined by electrical impedance tomography during mechanical ventilation,” Physiological Measurement, vol. 28, no. 7, pp. S261–S267, 2007. [DOI] [PubMed] [Google Scholar]
- [8].Lowhagen K, Lundin S, and Stenqvist O, “Regional intratidal gas distribution in acute lung injury and acute respiratory distress syndrome assessed by electric impedance tomography,” Minerva Anestesiol, vol. 76, no. 12, pp. 1024–1035, 2010. [PubMed] [Google Scholar]
- [9].Kunst P, Bohm S, Vazquez de Anda G, Amato M, Lachmann B, Postmus P, and de Vries PM, “Regional pressure volume curves by electrical impedance tomography in a model of acute lung injury,” Critical care medicine, vol. 28, pp. 178–83, 01 2000. [DOI] [PubMed] [Google Scholar]
- [10].Costa E, Chaves C, Gomes S, Beraldo M, Volpe M, Tucci M, Schettino I, Bohm S, Carvalho C, Tanaka H, L RG, and Amato M, “Real-time detection of pneumothorax using electrical impedance tomography,” Critical Care Medicine, vol. 36, no. 4, pp. 1230–1238, 2008. [DOI] [PubMed] [Google Scholar]
- [11].Putensen C, Wrigge H, and Zinserling J, “Electrical impedance tomography guided ventilation therapy,” Current Opinion in Critical Care, vol. 13, pp. 344–350, 2007. [DOI] [PubMed] [Google Scholar]
- [12].Meier T, Luepschen H, Karsten J, Leibecke T, Großherr M, Gehring H, and Leonhardt S, “Assessment of regional lung recruitment and derecruitment during a peep trial based on electrical impedance tomography,” Intensive Care Medicine, vol. 34, no. 3, pp. 543–550, March 2008. [DOI] [PubMed] [Google Scholar]
- [13].Pulletz S, Kott M, Elke G, Schadler D, Vogt B, Weiler N, and Frerichs I, “Dynamics of regional lung aeration determined by electrical impedance tomography in patients with acute respiratory distress syndrome,” Multidisciplinary Respiratory Medicine, vol. 7, p. 44, 2012. [DOI] [PMC free article] [PubMed] [Google Scholar]
- [14].Victorino J, Borges J, Okamoto V, Matos G, Tucci M, Caramez M, Tanaka H, Sipmann F, Santos D, Barbas C et al. , “Imbalances in regional lung ventilation: a validation study on electrical impedance tomography,” American journal of respiratory and critical care medicine, vol. 169, no. 7, pp. 791–800, 2004. [DOI] [PubMed] [Google Scholar]
- [15].Kunst P, Noordegraaf A, Hoekstra O, Postmus P, and Vries P, “Ventilation and perfusion imaging by electrical impedance tomography: a comparison with radionuclide scanning,” Physiological measurement, vol. 19, no. 4, pp. 481–490, 1998. [DOI] [PubMed] [Google Scholar]
- [16].Cheney M, Isaacson D, Newell J, Simske S, and Goble J, “Noser: An algorithm for solving the inverse conductivity problem,” International Journal of Imaging Systems and Technology, vol. 2, no. 2, pp. 66–75, 1990. [DOI] [PMC free article] [PubMed] [Google Scholar]
- [17].Fuks L, Cheney M, Isaacson D, Gisser D, and Newell J, “Detection and imaging of electric conductivity and permittivity at low frequency,” IEEE Transactions on Biomedical Engineering, vol. 38, pp. 1106–1110, 1991. [DOI] [PubMed] [Google Scholar]
- [18].Herrera C, Vallejo M, Mueller J, and Lima R, “Direct 2-D reconstructions of conductivity and permittivity from EIT data on a human chest,” Medical Imaging, IEEE Transactions on, vol. 34, no. 1, pp. 267–274, January 2015. [DOI] [PMC free article] [PubMed] [Google Scholar]
- [19].“Timpel enlight: technology,” http://www.timpel.com.br/technology, 2010, timpel Company Website. [Google Scholar]
- [20].Gaggero PO, “Miniaturization and distinguishability limits of electrical impedance tomography for biomedical application,” Ph.D. dissertation, University of Neuchatel, Neuchatel, Switzerland, June 2011. [Google Scholar]
- [21].“Technical datasheet: Dräger pulmovista 500,” http://www.draeger.com/sites/assets/PublishingImages/Products/rsp pulmovista500/Attachments/rsp_pulmovista_500_pi_9066475_en.pdf, 2010, dräger Manufacturer Brochure. [Google Scholar]
- [22].“Swisstom BB2 product information 2st100–112, rev. 000,” http://www.swisstom.com/wp-content/uploads/BB2_Brochure_2ST100-112_Rev.000_EIT_inside.pdf, swisstom AG Manufacturer Brochure. [Google Scholar]
- [23].“Maltron sheffield mk 3.5,” http://www.maltronint.com/eit/msmk35.php, 2014, maltron Company Website. [Google Scholar]
- [24].Wilson AJ, Milnes P, Waterworth AR, Smallwood RH, and Brown BH, “Mk3.5l a modular, multi-frequency successor to the mk3a eis/eit system,” Physiological Measurement, vol. 22, pp. 49–54, 2001. [DOI] [PubMed] [Google Scholar]
- [25].Adler A, Amato MB, Arnold JH, Bayford R, Bodenstein M, Böhm SH, Brown BH, Frerichs I, Stenqvist O, Weiler N, and Wolf GK, “Whither lung eit: Where are we, where do we want to go and what do we need to get there?” Physiological Measurement, vol. 33, pp. 679–694, 2012. [DOI] [PubMed] [Google Scholar]
- [26].Hahn G, Just A, Dittmar J, Fromm KH, and Quitel M, “Synchronous absolute eit in three thoracic plances at different gravity levels,” in Journal of Physics: Conference Series, vol. 434, XV International Conference on Electrical Bio-Impedance & XIV Conference on Electrical Impedance Tomography Institute of Physics Publishing, 2013. [Google Scholar]
- [27].Pulletz S, Elke G, Zick G, Schädler D, Scholz J, Weiler N, and Frerichs I, “Performance of electrical impedance tomography in detecting regional tidal volumes during one-lung ventilation,” Acta Anaesthesiologica Scandinavica, vol. 52, pp. 1131–1139, 2008. [DOI] [PubMed] [Google Scholar]
- [28].Ashe J, Shoudy D, Boverman G, Sabatini J, Kao T, and Amm B, “A high precision parallel current drive experimental eit system,” in 15th International Conference on Biomedical Application of EIT, vol. 14. IEEE, 2014, pp. 24–26. [Google Scholar]
- [29].Cook RD, “Act3: A high-speed, high-precision electrical impedance tomograph,” Ph.D. dissertation, Rensselaer Polytechnic Institute, Troy, New York, July 1992. [Google Scholar]
- [30].“High-speed electrical impedance tomography system,” http://engineering.dartmouth.edu/bioimpedance/high-speed-EIT.html, November 2014, thayer School of Engineering at Dartmouth Technology Research Projects. [Google Scholar]
- [31].Saulnier GJ, “Eit instrumentation,” in Electrical Impedance Tomography: Methods, History and Applications, 2005, pp. 67–103. [Google Scholar]
- [32].Liu N, Saulnier G, Newell J, Isaacson D, and Kao T-J, “Act4: a highprecision, multi-frequency electrical impedance tomograph,” Presented at 6th Conference on Biomedical Applications of Electrical Impedance Tomography, June 2005, london, U.K. [Google Scholar]
- [33].Oh T, Woo E, and Holder D, “Multi-frequency EIT system with radially symmetric architecture: Khu mark1,” Physiological measurement, vol. 28, pp. S183–S196, 2007. [DOI] [PubMed] [Google Scholar]
- [34].Halter R, Hartov A, and Paulsen KD, “Design and implementation of a high frequency electrical impedance tomography system,” Physiological Measurement, vol. 25, no. 1, p. 379, 2004. [Online]. Available: http://stacks.iop.org/0967-3334/25/i=1/a=041 [DOI] [PubMed] [Google Scholar]
- [35].Halter RJ, Hartov A, and Paulsen KD, “A broadband high-frequency electrical impedance tomography system for breast imaging,” IEEE Transactions on Biomedical Engineering, vol. 55, pp. 650–659, 2008. [DOI] [PubMed] [Google Scholar]
- [36].Yerworth RJ, Bayford RH, Cusick G, Conway M, and Holder DS, “Design and performance of the uclh mark 1b 64 channel electrical impedance tomography (eit) system, optimized for imaging brain function,” Physiological Measurement, vol. 23, no. 1, p. 149, 2002. [Online]. Available: http://stacks.iop.org/0967-3334/23/i=1/a=314 [DOI] [PubMed] [Google Scholar]
- [37].McEwan A, Romsauerova A, Yerworth R, Horesh L, Bayford R, and Holder D, “Design and calibration of a compact multi-frequency eit system for acute stroke imaging,” Physiological Measurement, vol. 27, no. 5, p. S199, 2006. [DOI] [PubMed] [Google Scholar]
- [38].Gaggero PO, Adler A, Brunner J, and Seitz P, “Electrical impedance tomography system based on active electrodes,” Physiological Measurement, vol. 33, pp. 831–847, 2012. [DOI] [PubMed] [Google Scholar]
- [39].Rigaud B, Shi Y, Chauveau N, and Morucci JP, “Experimental acquisition system for impedance tomography with active electrode approach,” Medical and Biological Engineering and Computing, vol. 31, no. 6, pp. 593–599, 1993. [DOI] [PubMed] [Google Scholar]
- [40].Bertemes-Filho P, Brown BH, and Wilson AJ, “A comparison of modified howland circuits as current generators with current mirror type circuits,” Physiological Measurement, vol. 21, pp. 1–6, 2000. [DOI] [PubMed] [Google Scholar]
- [41].Franco S, Design with Operational Amplifiers and Analog Integrated Circuits, 1st ed. McGraw-Hill, 1988. [Google Scholar]
- [42].Avery J, Dowrick T, Faulkner M, Goren N, and Holder D, “A versatile and reproducible multi-frequency electrical impedance tomography system,” Sensors, vol. 17, no. 2, 2017. [DOI] [PMC free article] [PubMed] [Google Scholar]
- [43].Webster JG, Medical Instrumentation: Application and Design, 4th ed. John Wiley & Sons, Inc., 2010. [Google Scholar]
- [44].Isaacson D, “Distinguishability of conductivities by electric current computed tomography,” IEEE Transactions on Medical Imaging, vol. 5, no. 2, pp. 91–95, 1986. [DOI] [PubMed] [Google Scholar]
- [45].Cheney M and Isaacson D, “Distinguishability in impedance imaging,” IEEE Transactions on Biomedical Engineering, vol. 39, no. 8, pp. 852–860, 1992. [DOI] [PubMed] [Google Scholar]
- [46].Dodd M and Mueller JL, “A real-time D-bar algorithm for 2-D electrical impedance tomography data,” Inverse Problems and Imaging, vol. 8, no. 4, pp. 1013–1031, 2014. [DOI] [PMC free article] [PubMed] [Google Scholar]
- [47].Muller PA, Mueller JL, and Mellenthin MM, “Real-Time Implementation of Calderòns Method on Subject-Specific Domains,” IEEE TMI, vol. 36, no. 9, pp. 1868–1875, September 2017. [DOI] [PubMed] [Google Scholar]
- [48].Muller PA, Mueller JL, Mellenthin M, Murthy R, Capps M, Wagner B, Alsaker M, Deterding R, Sagel SD, and Hoppe J, “Evaluation of surrogate measures of pulmonary function derived from electrical impedance tomography data in children with cystic fibrosis,” Physiological Measurement, 2018. [Online]. Available: http://iopscience.iop.org/10.1088/1361-6579/aab8c4 [DOI] [PMC free article] [PubMed] [Google Scholar]
- [49].Camargo E, “Development of an absolute electrical impedance imaging algorithm for clinical use,” Ph.D. dissertation, University of São Paulo, 2013. [Google Scholar]
- [50].Moura FS, “Nonlinear state estimation with unscented Kalman filter in electrical impedance tomography,” Ph.D. dissertation, University of São Paulo, 2013. [Google Scholar]
- [51].Calderón A-P, “On an inverse boundary value problem,” in Seminar on Numerical Analysis and its Applications to Continuum Physics (Rio de Janeiro, 1980). Rio de Janeiro: Sãc. Brasil. Mat, 1980, pp. 65–73. [Google Scholar]
- [52].Hamilton S, Herrera C, Mueller JL, and VonHerrmann A, “A direct D-bar reconstruction algorithm for recovering a complex conductivity in 2-D,” Inverse Problems, vol. 28:(095005), 2012. [DOI] [PMC free article] [PubMed] [Google Scholar]
- [53].Nachman AI, “Global uniqueness for a two-dimensional inverse boundary value problem,” Annals of Mathematics, vol. 143, pp. 71–96, 1996. [Google Scholar]
- [54].Siltanen S, Mueller J, and Isaacson D, “An implementation of the reconstruction algorithm of A. Nachman for the 2-D inverse conductivity problem,” Inverse Problems, vol. 16, pp. 681–699, 2000. [Google Scholar]
- [55].Isaacson D, Mueller JL, Newell JC, and Siltanen S, “Reconstructions of chest phantoms by the D-bar method for electrical impedance tomography,” IEEE Transactions on Medical Imaging, vol. 23, pp. 821–828, 2004. [DOI] [PubMed] [Google Scholar]
- [56].Knudsen K, Lassas M, Mueller J, and Siltanen S, “Regularized D-bar method for the inverse conductivity problem,” Inverse Problems and Imaging, vol. 3, no. 4, pp. 599–624, 2009. [Google Scholar]
- [57].Cheney M, Isaacson D, and Newell JC, “Electrical impedance tomography,” SIAM Review, vol. 41, no. 1, pp. 85–101, 1999. [Google Scholar]
- [58].Leathard A, Brown B, Zhang F, Morice A, and Tayler D, “A comparison of ventilatory and cardiac related changes in eit images of normal human lungs and of lungs with pulmonary emboli,,” Physiological Measurement, vol. 15, pp. A137–A146, 1994. [DOI] [PubMed] [Google Scholar]
- [59].Mueller J, Isaacson D, and Newell JC, “Reconstruction of conductivity changes due to ventilation and perfusion from EIT data collected on a rectangular electrode array,” Physiological Measurement, vol. 22, pp. 97–106, 1999. [DOI] [PubMed] [Google Scholar]
- [60].Muller P, Li T, Isaacson D, Newell J, Saulnier G, Kao T, and Ashe J, “Estimating a regional ventilation-perfusion index,” Physiological Measurement, vol. 36, no. 6, pp. 1283–1295, 2015. [DOI] [PMC free article] [PubMed] [Google Scholar]


