Abstract
Objective:
To assess the performance of deep learning convolutional neural networks (CNNs) in segmenting gadolinium-enhancing lesions using a large cohort of multiple sclerosis (MS) patients.
Methods:
A 3D CNN model was trained for segmentation of gadolinium-enhancing lesions using multispectral magnetic resonance imaging data from 1006 relapsing-remitting MS patients. The network performance was evaluated for three combinations of multispectral MRI used as input: (U5) FLAIR, T2-weighted, proton density-weighted, and pre- and post-contrast T1-weighted images; (U2) pre- and post-contrast T1-weighted images; and (U1) only post-contrast T1-weighted images. Segmentation performance was evaluated using the Dice similarity coefficient (DSC) and lesion-wise true positive (TPR) and false positive (FPR) rates. Performance was also evaluated as a function of the enhancing lesion volume.
Results:
The DSC/TPR/FPR values averaged over all the enhancing lesion sizes were 0.77/0.90/0.23 using the U5 model. These values for the largest enhancement volumes (>500 mm3) were 0.81/0.97/0.04. For U2, the average DSC/TPR/FPR were 0.72/0.86/0.31. Comparable performance was observed with U1. For all types of input, the network performance degraded with decreased enhancement size.
Conclusion:
Excellent segmentation of enhancing lesions was observed for enhancement volume ≥70 mm3. The best performance was achieved when the input included all five multispectral image sets.
Keywords: convolutional neural networks, active lesions, MRI, false positive, white matter lesions, artificial intelligence
Introduction
Multiple sclerosis (MS) affects nearly 2.5 million people worldwide with best estimated prevalence of 265.1–309.2 per 100,000 in the USA alone.1,2 Magnetic resonance imaging (MRI) is an exquisite modality for visualizing MS lesions in the central nervous system. However, not all lesions seen on MRI are active. Identification of enhancing lesions, generally thought to represent active disease, is critical for patient management.3 Therefore, nearly all MS patients are routinely administered gadolinium (Gd)-based contrast agents (GBCAs) during the MRI scan, as part of patient management. Gd enhancement is shown to correlate with the occurrence of clinical relapses in MS4, and the number or volume of Gd-enhancing lesions may be important in evaluating treatment efficacy.5
Manual segmentation of Gd enhancement is perhaps the simplest to implement.6 However, manual methods to identify and delineate enhancement are prone to error and operator bias and are impractical when dealing with large amounts of data that are typically acquired in multi-center studies. Computer-assisted methods overcome some of these problems, but are also prone to operator bias and are tedious to apply to large amounts of data.7–9 Therefore, fully automated techniques for segmenting enhancing lesions are desirable. There are a few publications which reported automatic segmentation of enhancing lesions10–13. The automatic segmentation technique reported by Bedell et al10 requires a special MRI pulse sequence that includes both static and marching saturation bands for suppressing non-lesional enhancements. This special sequence is not generally available on all scanners. The segmentation method by He and Narayana relies on adaptive local segmentation using gray scale morphological operations, topological features, and fuzzy connectivity and uses conventional T1-weighted spin echo sequence.11 However, intensity normalization is critical for this method’s success. Intensity normalization performs poorly in the presence of large lesion load and significant brain atrophy. Improper intensity normalization could lead to false classifications of enhancements. The automatic segmentation proposed by Datta et al relies on conventional MRI sequences that are routinely used in scanning MS patients.12 The non-lesional enhancements were minimized by using binary masks derived from the intensity ratios of pre- and post-contrast T1-weighted images, and fuzzy connectivity was used for lesion delineation. Both the methods proposed by He and Narayana and Datta et al require prior segmentation of T2 hyperintense lesions for minimizing false classification.11,12 The automated technique proposed by Karimaghaloo et al is based on a probabilistic framework and conditional random fields.13 However, the focus of this technique was on the identification, and not delineation, of enhancements. While identification provides information of the number of enhancements, equal weight was given to all the enhancements irrespective of the enhancing volume that may not be appropriate.
Based on this brief description it is clear that the automated segmentation methods described above have certain limitations. Here we present a method based on multilayer neural networks (or deep learning; DL) for automated detection and delineation of Gd enhancements. The DL model was trained using multispectral MRI data that were acquired on a large cohort of MS patients who participated in a multicenter clinical trial.
Methods and Materials
Image Dataset
MRI data used in this study were acquired as part of the phase 3, double-blinded, randomized clinical trial CombiRx (clinical trial identifier: NCT00211887). CombiRx enrolled 1008 relapsing remitting MS patients at baseline. All the sixty-eight participating sites had IRB approval for scanning patients and informed written consent was obtained from the patients. Data were acquired on multiple platforms at 1.5 T (85%) and 3 T (15%) field strengths (General Electric, Milwaukee, Wisconsin, USA; Philips, Best, Netherlands; Siemens, Erlangen, Germany). All data were anonymized.
In the CombiRx trial, the imaging protocol included 2D FLAIR (echo time / repetition time / inversion (TE/TR/TI) = 80–100/10,000/2500–2700 msec) and 2D dual echo turbo spin echo (TSE) images (TE1/TE2/TR = 12–18/80–110/6800 msec; echo train length 8–16), and pre- and post-contrast T1 weighted (T1w) (TE/TR = 12–18/700–800 msec) images, all with identical geometry and voxel dimension of 0.94 × 0.94 × 3 mm3. All images were evaluated for quality using the procedure described elsewhere.14 All images were preprocessed using the Magnetic Resonance Imaging Automatic Processing (MRIAP) pipeline.14 Preprocessing included anisotropic diffusion filtering, co-registration, skull stripping, bias field correction, and intensity normalization, and as described elsewhere.14–16 Of the 1008 scans available, 2 were discarded due to artifacts and poor signal-to-noise ratio.
Brain tissue segmentation, including all neural tissues (white matter (WM), gray matter (GM), cerebrospinal fluid (CSF)), in addition to T2-hyperintense lesions (T2 lesions), and Gd-enhancing lesions, was performed using MRIAP.12,14 The segmentation of Gd enhancements was described in detail elsewhere.12 Briefly, this technique consists of four major steps to identify Gd enhancements: (i) image preprocessing (rigid body image registration of all images with dual echo images, skull stripping, and bias field correction). (ii) Enhancing lesions on post-contrast images were identified as regional maxima by the application of gray scale morphological reconstruction by iterative application of geodesic dilation. This procedure also classifies enhancing vasculature and structure without blood-brain-barrier. (iii) These false positives were minimized by assuming that each enhancing lesion is associated with a T2-hyper-intense lesion. (iv) Since the boundaries of enhancements are not always well defined, for complete delineation of the lesions, the fuzzy connectedness algorithm was applied. To reduce false positives from isolated voxels, lesions smaller than 20 mm3 (0.02 ml) were excluded from the MRIAP segmentation.
The lesion segmentation results were further validated by two experts; an MS neurologist with 30+ yeas experience and an MRI scientist with 35+ years of experience in neuro-MRI. For validation, an in-house developed software package was developed. This software can display multiple images simultaneously in different orientations. The software also includes various editing tools such as eraser, paintbrush etc. for editing the MRIAP delineated enhancements. Any discrepancy between the two raters was resolved by consensus.
Three DL models were trained to segment Gd-enhancing lesions using multispectral MR images. The first model used all five images as input (denoted as U5 model). Two additional models were developed using as input only pre- and post-Gd T1w images (denoted as U2 model) and only post-Gd T1w images (denoted as U1 model). All networks were trained to segment all the neural tissues (WM, GM, CSF), in addition to T2 lesions and Gd-enhancing lesions.
Network Architecture
Multiple reports have shown successful application of DL for segmenting MS T2 lesions17–19. Gd lesions, however, are more difficult to segment compared to T2 lesions because Gd lesions are smaller in size and less abundant. In this work, segmentation of Gd-enhancing lesions was performed using a multi-class 3D U-net.20 This specific model incorporates recent advances in fully convolutional neural networks (FCNNs) with residual connections and dropout layers for improved segmentation performance. In general, U-net uses contracting and expanding paths to learn image features at different levels of abstraction. Corresponding layers are connected at similar resolution to preserve features lost along the contracting path. Image contraction was done by a max-pooling operation of size 2 along all axes, while expansion was performed with 3D deconvolutions. Additionally, this architecture included residual connections to alleviate the vanishing gradient problem which can stop network weights from updating.21 These connections also improve network training by reducing the number of epochs necessary to reach optimal minima.
The input layer had either 5 input channels for the five image contrasts (U5 mode inputs: FLAIR, PDw, T2w, and pre- and post-Gd T1w images), 2 input channels (U2 mode inputs: pre- and post-Gd T1w images), or a single channel (U1 mode input: post-Gd T1w images). The input layer accepted image patches of size 128×128×8 (sampled from the image volume). Based on our data, such resolution allows good segmentation of enhancements spanning several slices without exceeding the computational memory constrains. Leaky rectified linear unit activation was used at all convolutional layers. Context modules contained 3×3×3 convolutional layers along with dropout to reduce overfitting of data. Because of the large data size and to increase the network capacity, we doubled the number of convolutional layers for all modules relative to the architecture proposed by Isensee et al.20 The network architecture for the U5 model is shown in Figure 1. In this network, the context modules manage feature extraction from images at multiple abstraction levels. The localization modules are composed of a 3×3×3 convolutional layer followed by a 1×1×1 convolutional layer. Localization modules recombine features extracted from the contracting path with up-sampled features from the previous level of abstraction. Segmentation layers aggregate network segmentation at multiple abstractions, smoothing the final output segmentation.22 The output layer is set to the same resolution as the input layer with softmax activation. For final classification, each voxel was assigned the tissue class with the highest score. We made the assumption that all enhancing lesions have corresponding T2 hyperintense lesions. Thus, voxels labelled by the network either as enhancing lesions or T2 lesions were combined to create the final T2 lesion map.
Figure 1.
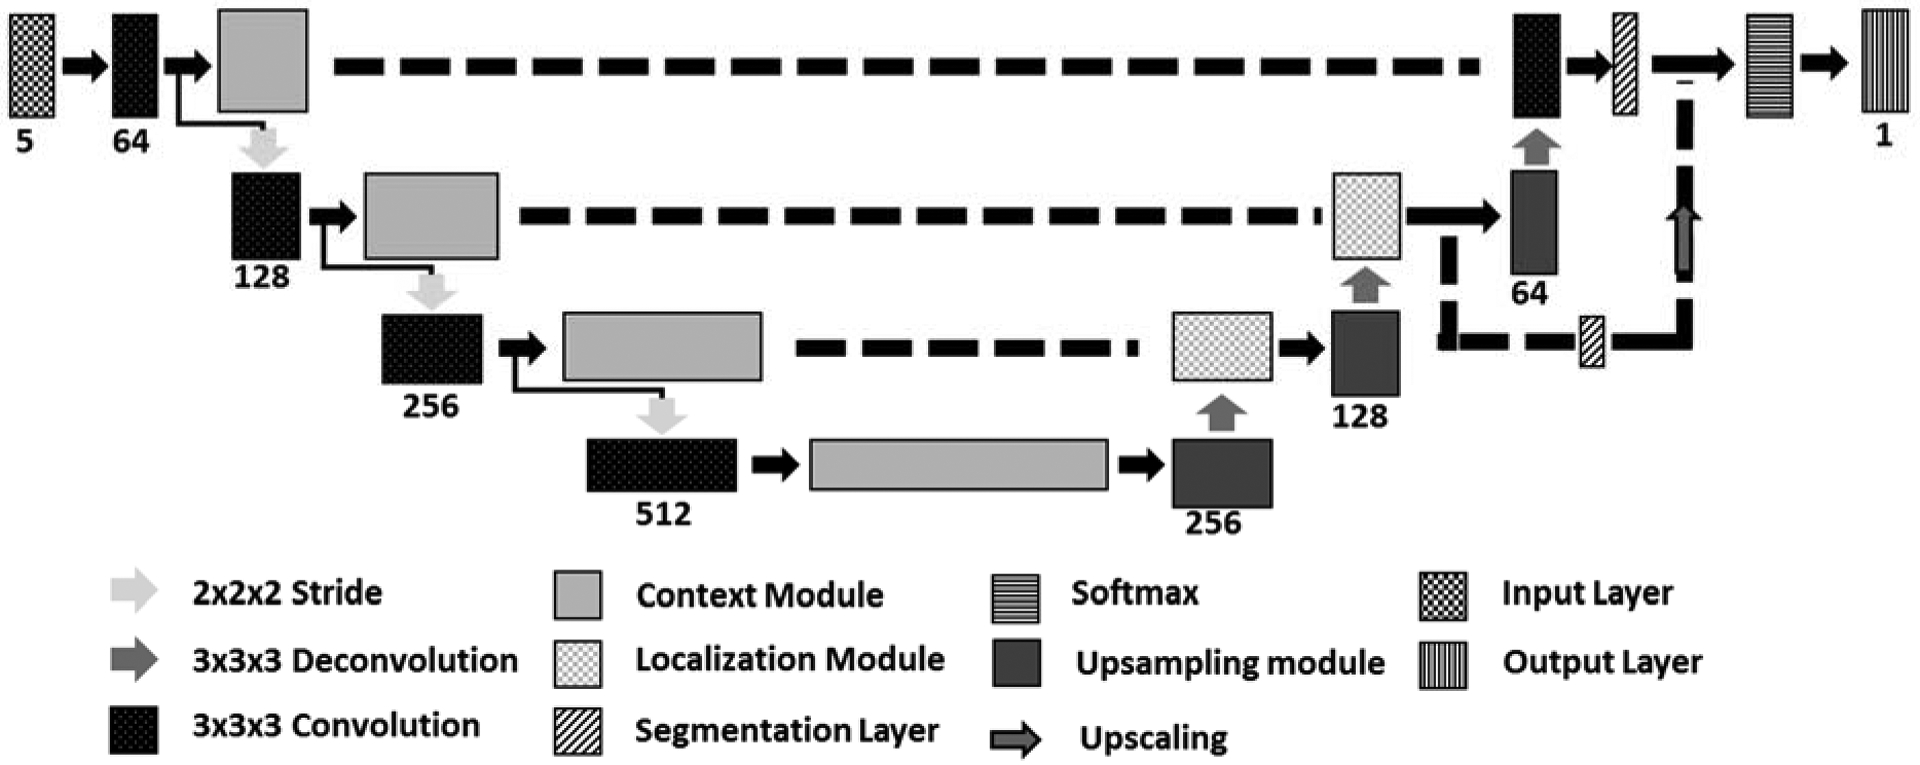
Network Architecture for the U5 model.
Network Training
Out of 1006, 398 patients had at least one Gd-enhancing lesion, based on the ground truth segmentation. During DL model development, the data were divided into 3 sets: 60% (604 scans) for training, 20% (201) for validation, and 20% (201) for testing, with random stratified sampling. Network weights were initialized using the Xavier algorithm23. The loss function was the multiclass weighted Dice to account for the dissimilarity in the tissue class sizes.20 Adam24 was used as the optimizer due to its adaptive learning rate, initially setting the learning rate at 0.001. Adam performs exponential reduction of the learning rate as training progresses.24 Adam convergence was improved by including AMSGrad variation.25
Computations were performed using the Texas Advanced Computing Center (TACC) Maverick2 server, which hosts nodes containing NVIDIA GTX 1080Ti GPU. To speed up network training, simultaneous computations were performed simultaneously on 4 GPUs. We used a “best model” algorithm by keeping the network weights that yielded the lowest error on validation data26.
Evaluation
Class-specific accuracy was calculated using the Dice similarity coefficient (DSC) for all segmented tissues,
where M and A denote the ground truth and automated segmentation masks. DSC was computed over all subjects in the test set, including both Gd+ and Gd- subjects. True-positive, false positive, and false negative volumes were computed for each subject. These numbers were subsequently summed over all subjects to compute the DSC. This approach avoids DSC ambiguity in Gd- cases. In addition to DSC, lesion-wise true positive rate (TPR), and false positive rate (FPR) were calculated for each category,
Dependence of the accuracy of enhancement segmentation on the enhancement size was also investigated. Lesions were divided, somewhat arbitrarily, into six groups: 20–34 mm3; 35–69 mm3; 70–137 mm3; 138–276 mm3; 277–499 mm3; and >500 mm3. The segmentation accuracy metrics (DSC, TPR, FPR) of Gd-enhancing lesions were computed for each group. As was done with MRIAP segmentation, lesions smaller than 7 voxels were also excluded from the neural network segmentation.
Results
The segmentation results using the three network models are summarized in Table 1. With the U5 model, high DSC values were obtained for all tissues: GM, 0.95; WM, 0.94; CSF, 0.98; T2 lesions, 0.88; and Gd-enhancing lesions, 0.77. Gd-enhancing lesion TPR and FPR were 0.90 and 0.23, respectively (Table 2). Figure 2 shows examples of network segmentation with the U5 model and the corresponding ground truth. Good agreement, at least visually, can be observed between the ground truth and the network segmented images. Quantitatively, the relatively high DSC and TPR and low FPR confirm the visual observation. The high segmentation accuracy is also evident in the observed good agreement between the volumes of Gd-enhancing lesions estimated from DL segmentation and those from the ground truth segmentation as shown in the correlation and Bland-Altman plots in Fig. 3.
Table 1.
Segmentation and lesion detection accuracy for networks using different MRI inputs.
| DSC | |||||
|---|---|---|---|---|---|
| Model | GM | WM | CSF | T2 Lesions | Gd-enhancing Lesions |
| U5 | 0.95 | 0.94 | 0.98 | 0.89 | 0.77 |
| U2 | 0.80 | 0.82 | 0.83 | 0.42 | 0.72 |
| U1 | 0.78 | 0.78 | 0.8 | 0.40 | 0.72 |
Network model U5 uses as input FLAIR, T2w, PDw, pre- and post- Gd T1w. Network U2 uses pre- and post-Gd T1w. Network U1 uses post-Gd T1w.
Table 2.
DSC, TPR, and FPR for different lesion sizes.
| U5 | U2 | U1 | |||||||||||||
|---|---|---|---|---|---|---|---|---|---|---|---|---|---|---|---|
| Lesion Size (mm3) | Nref | N | TPR | FPR | DSC | N | TPR | FPR | DSC | N | TPR | FPR | DSC | ||
| 20–34 | 36 | 56 | 0.75 | 0.64 | 0.55 | 81 | 0.72 | 0.64 | 0.55 | 71 | 0.69 | 0.70 | 0.60 | ||
| 35–69 | 83 | 93 | 0.86 | 0.32 | 0.63 | 99 | 0.76 | 0.43 | 0.62 | 116 | 0.80 | 0.53 | 0.67 | ||
| 70–137 | 102 | 108 | 0.86 | 0.18 | 0.73 | 102 | 0.86 | 0.24 | 0.71 | 119 | 0.89 | 0.25 | 0.76 | ||
| 138–276 | 71 | 75 | 0.99 | 0.05 | 0.82 | 66 | 0.92 | 0.08 | 0.78 | 85 | 0.93 | 0.14 | 0.79 | ||
| 277–499 | 30 | 35 | 1.00 | 0.03 | 0.84 | 42 | 1.00 | 0.07 | 0.84 | 32 | 1.00 | 0.03 | 0.82 | ||
| ≥500 | 32 | 27 | 0.97 | 0.04 | 0.81 | 22 | 0.97 | 0.05 | 0.74 | 24 | 0.94 | 0.00 | 0.74 | ||
| All | 354 | 394 | 0.90 | 0.23 | 0.77 | 412 | 0.86 | 0.31 | 0.72 | 447 | 0.87 | 0.34 | 0.72 | ||
Network U5 use as input FLAIR, T2-weighted, PD-weighted, Pre- and post Gd,T1-weighted.
Network U2 uses pre- and post-Gd T1w.
Network U1 uses post-Gd T1w.
N denotes the number of lesions segmented by the neural networks.
Nref is the number of lesions in the ground truth segmentation.
Figure 2.
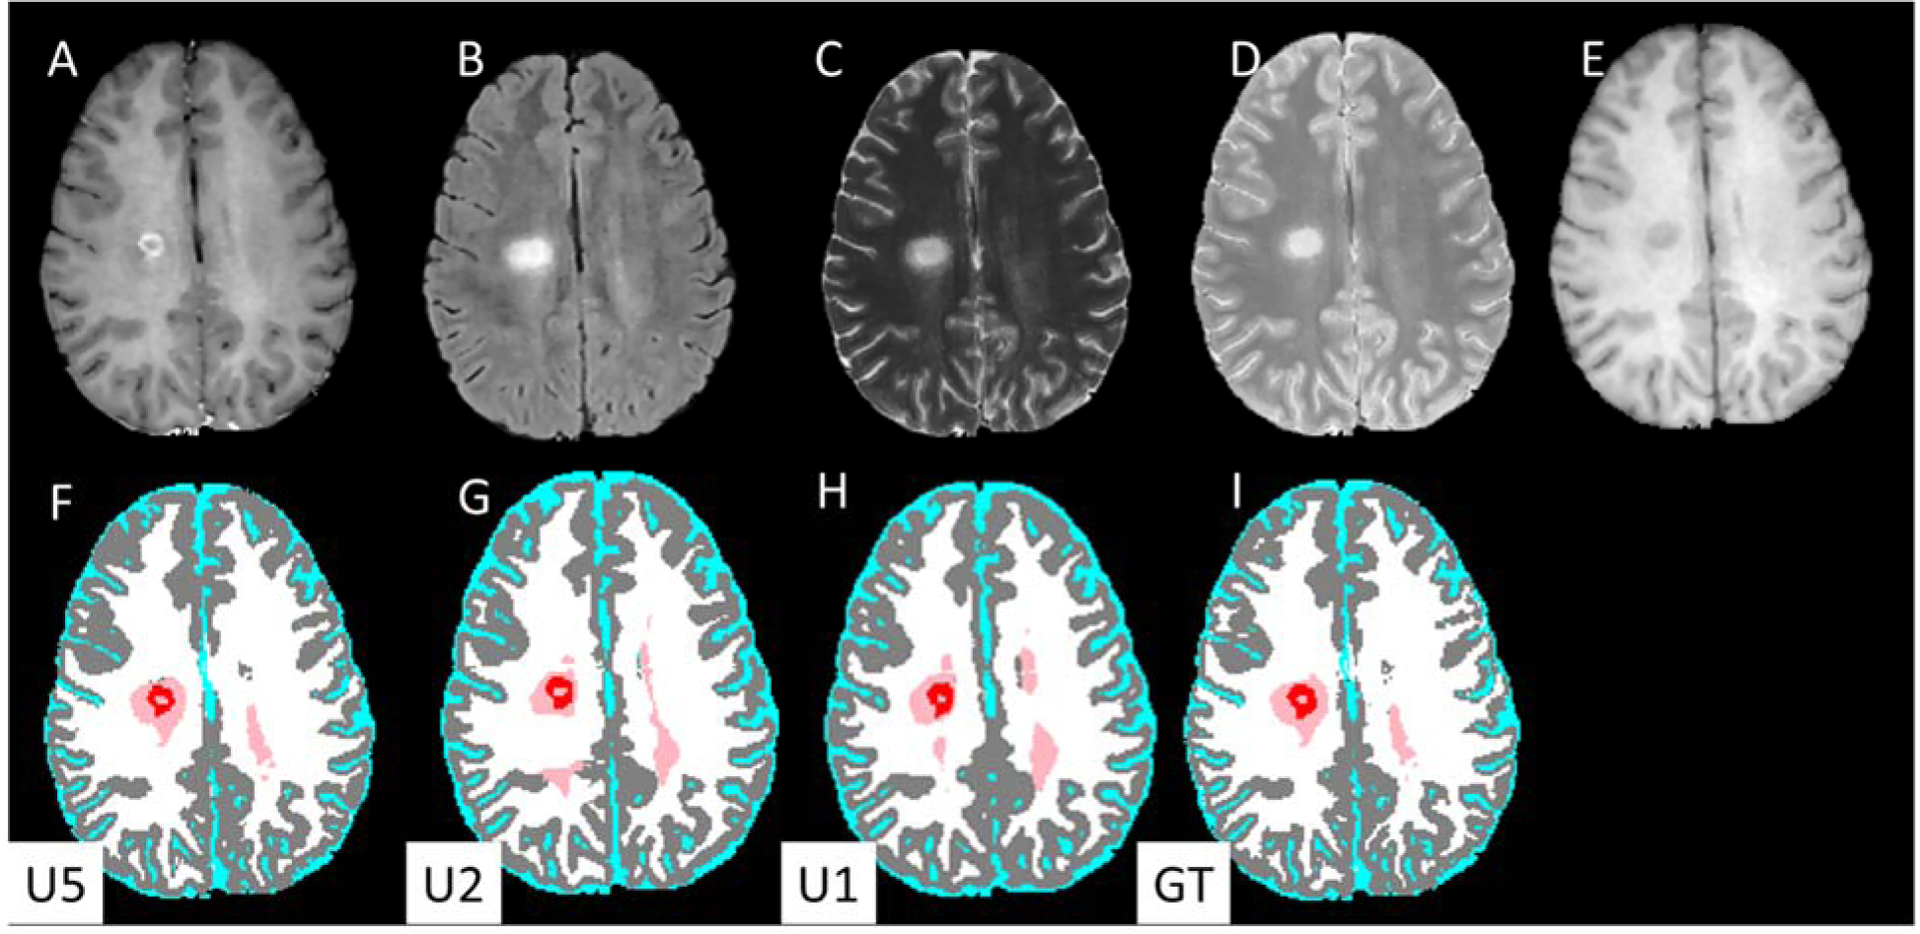
Input MR images (upper row) and DL segmented images (lower row). (A) post-Gd T1w, (B) FLAIR, (C) T2-weighted, (D) PD-weighted, (E) T1-weighted images. Segmentation maps with (F) U5 (G) U2, (H) U1 models, and (I) ground truth. The segmentation maps are color-coded as: white, WM; gray, GM, cyan, CSF; pink, T2 lesions; red, Gd-enhancing lesions.
Figure 3.
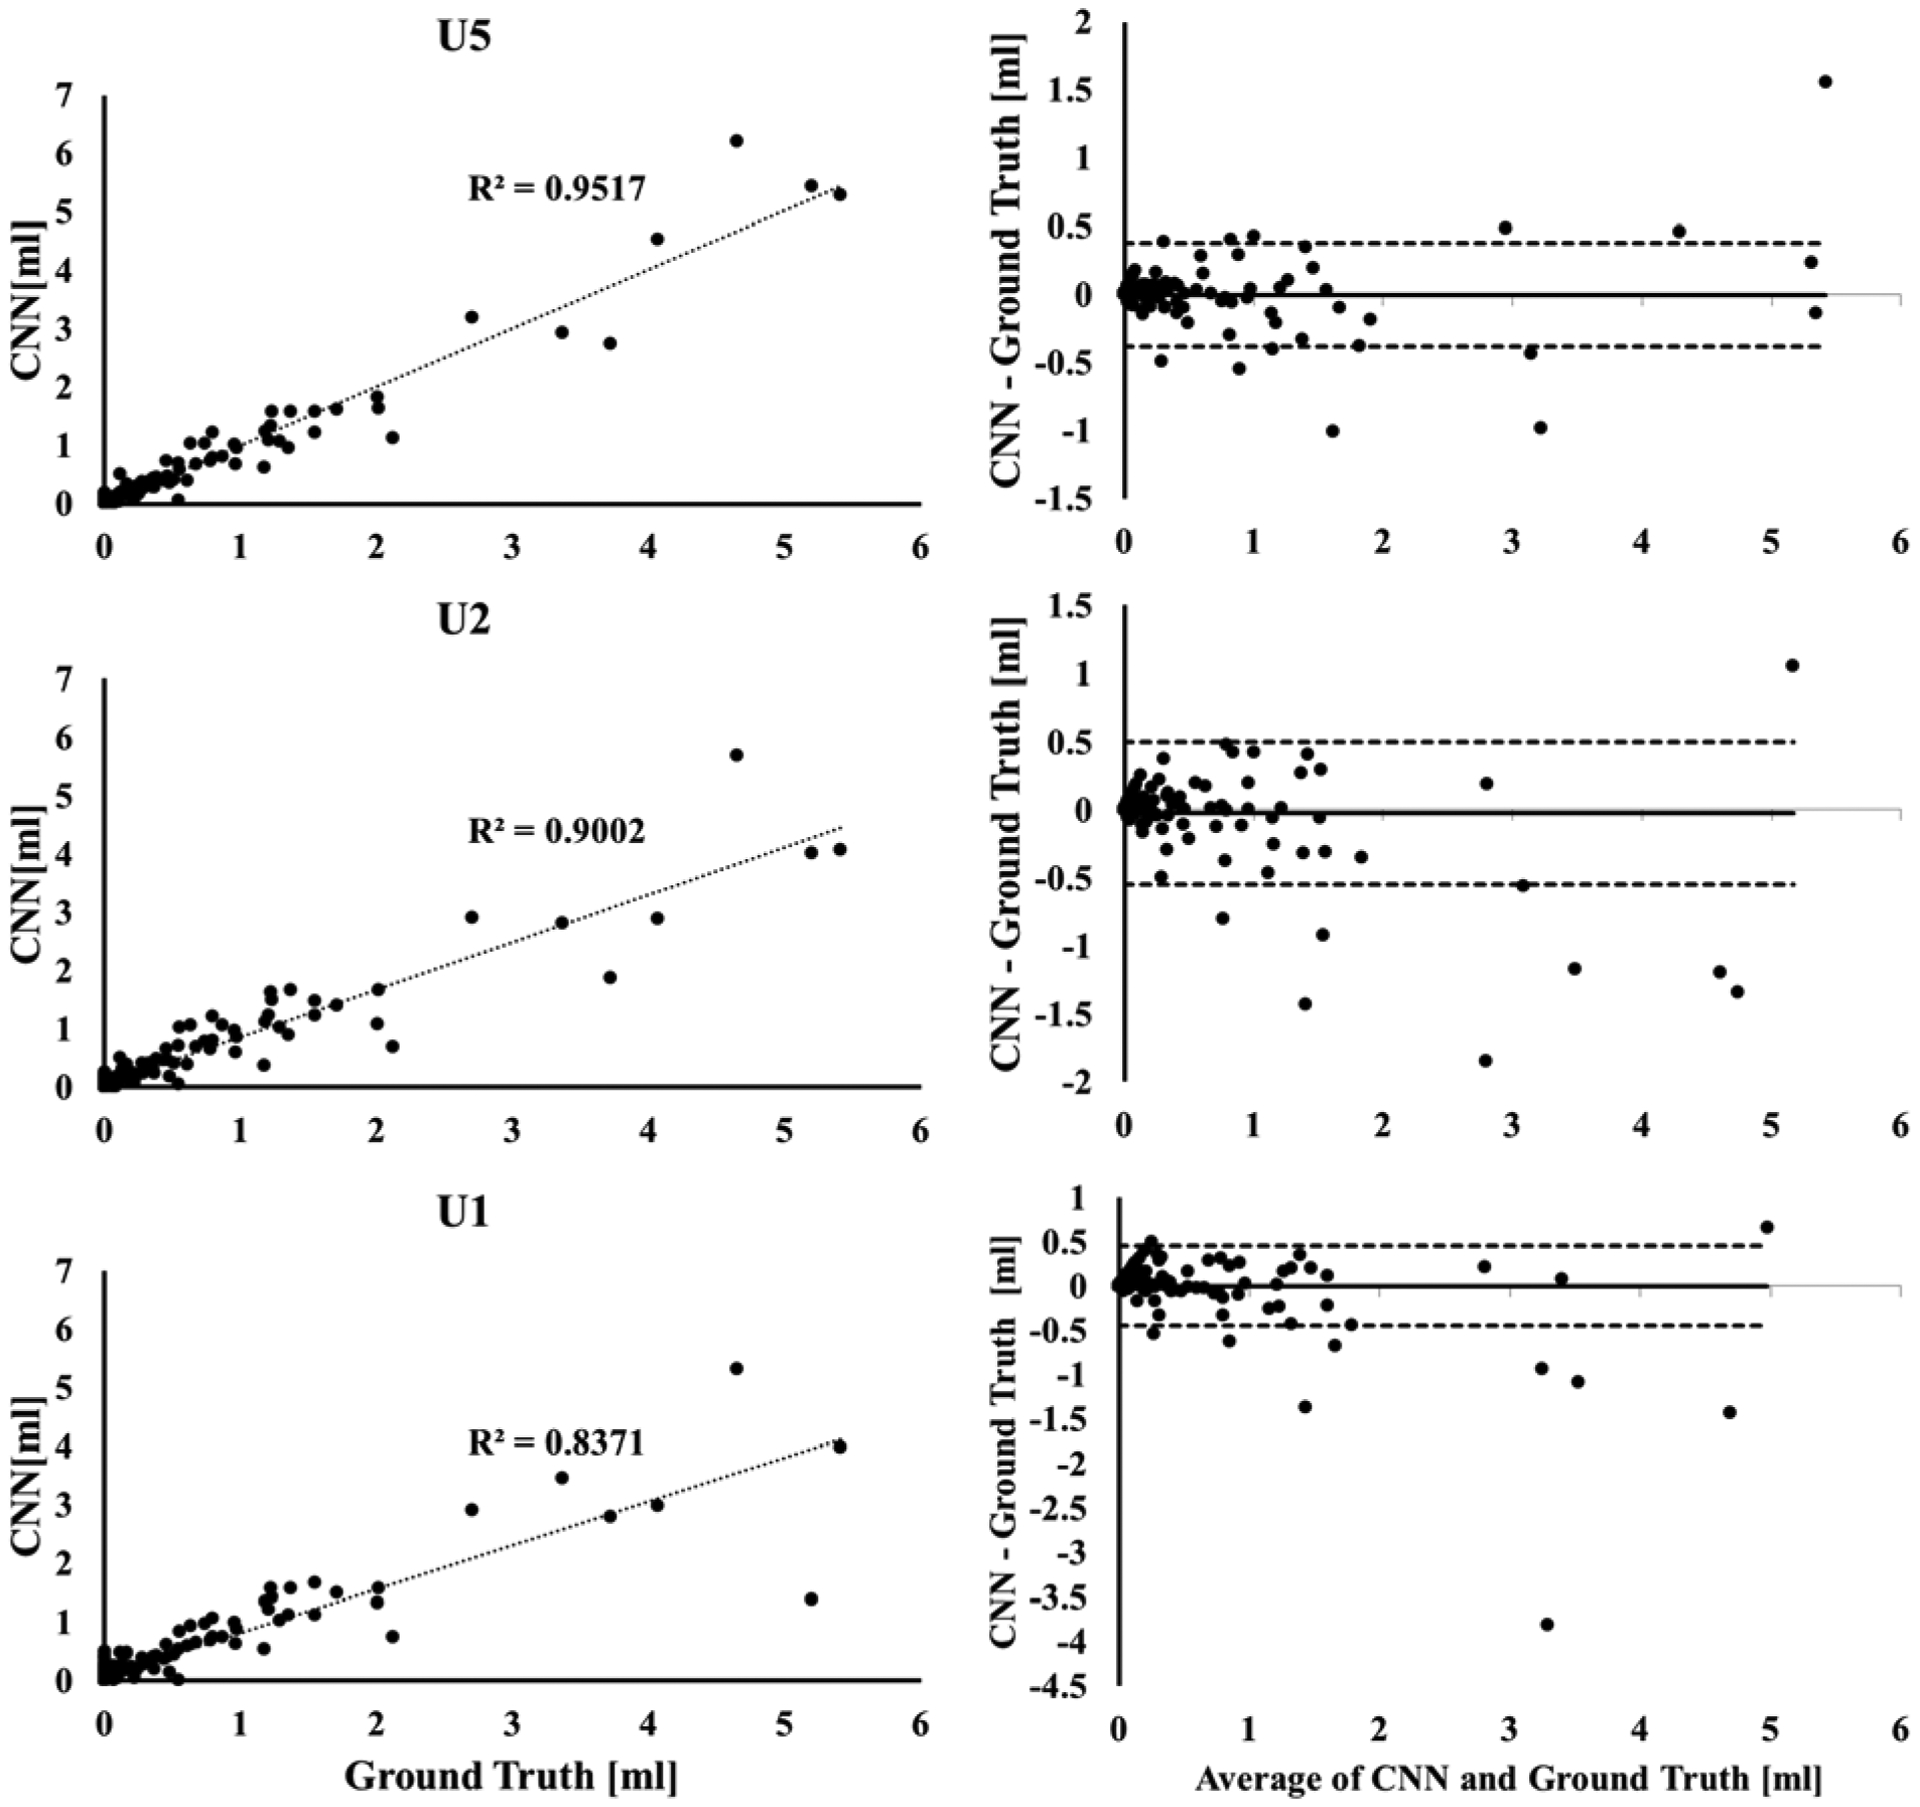
(Left) Correlation between the volumes of Gd-enhancing lesions segmented by the U5 (top), U2 (middle) and U1 (bottom) models and the ground truth segmentation from expert-validated MRIAP. (Right) the corresponding Bland-Altman plots for the agreement between the lesion volumes.
The U2 model resulted in reduced average DSC values for all tissues and lesions: GM, 0.80; WM, 0.82; CSF, 0.83; T2 lesions, 0.41; and Gd-enhancing lesions, 0.72. The Gd-enhancing lesion TPR/FPR were 0.86/0.31. The U1 model resulted in DSC of: GM, 0.78; WM, 0.78; CSF, 0.80; T2 lesions, 0.39; and Gd-enhancing lesion, 0.72. Gd-enhancing lesion TPR/FPR were 0.87/0.34. The correlations between the Gd-enhancing volumes from DL and that in the ground truth consistently declined from U5 (R2 = 0.95) to U2 (R2 = 0.90) to U1 (R2 = 0.84), which was also reflected in data scatter in the Bland-Altman plots (Fig. 3).
The segmentation results using the three network models for different enhancement volumes are summarized in Table 2. As can be seen from this table, the accuracy of segmentation for lesions <70 mm3 was low. More importantly, for these small lesions the FPR was relatively high and the TPR was low. However, TPR ⩾ 0.86 and FPR ⩽ 0.18 were achieved for all lesions larger than 70 mm3 using the U5 model. Reducing the number of input channels or images reduced the segmentation accuracy for the enhancing lesions. Using U2, TPR ⩾ 0.86 and FPR ⩽0.24 was observed for all lesions with size ˃ 70 mm3 (0.07mL), and for the same range of lesion size, U1 achieved TPR ⩾ 0.89 and FPR ⩽0.25 (Table 2).
Figure 4 shows, as an example, a case from the test set in which a ‘Gd-enhancing lesion’ was segmented by U1 based only on the hyperintensity on post-Gd T1w image, even though no corresponding T2 hyperintense lesion was observed on the FLAIR image. The T1w hyperintensity was still seen as a lesion on the U2 segmentation which uses both pre- and post-Gd T1w images. However, this T1w hyperintensity was not labelled as a lesion on U5 segmentation, consistent with the ground truth. Overall, all three networks performed well in most cases, as is shown in Fig. 5.
Figure 4.
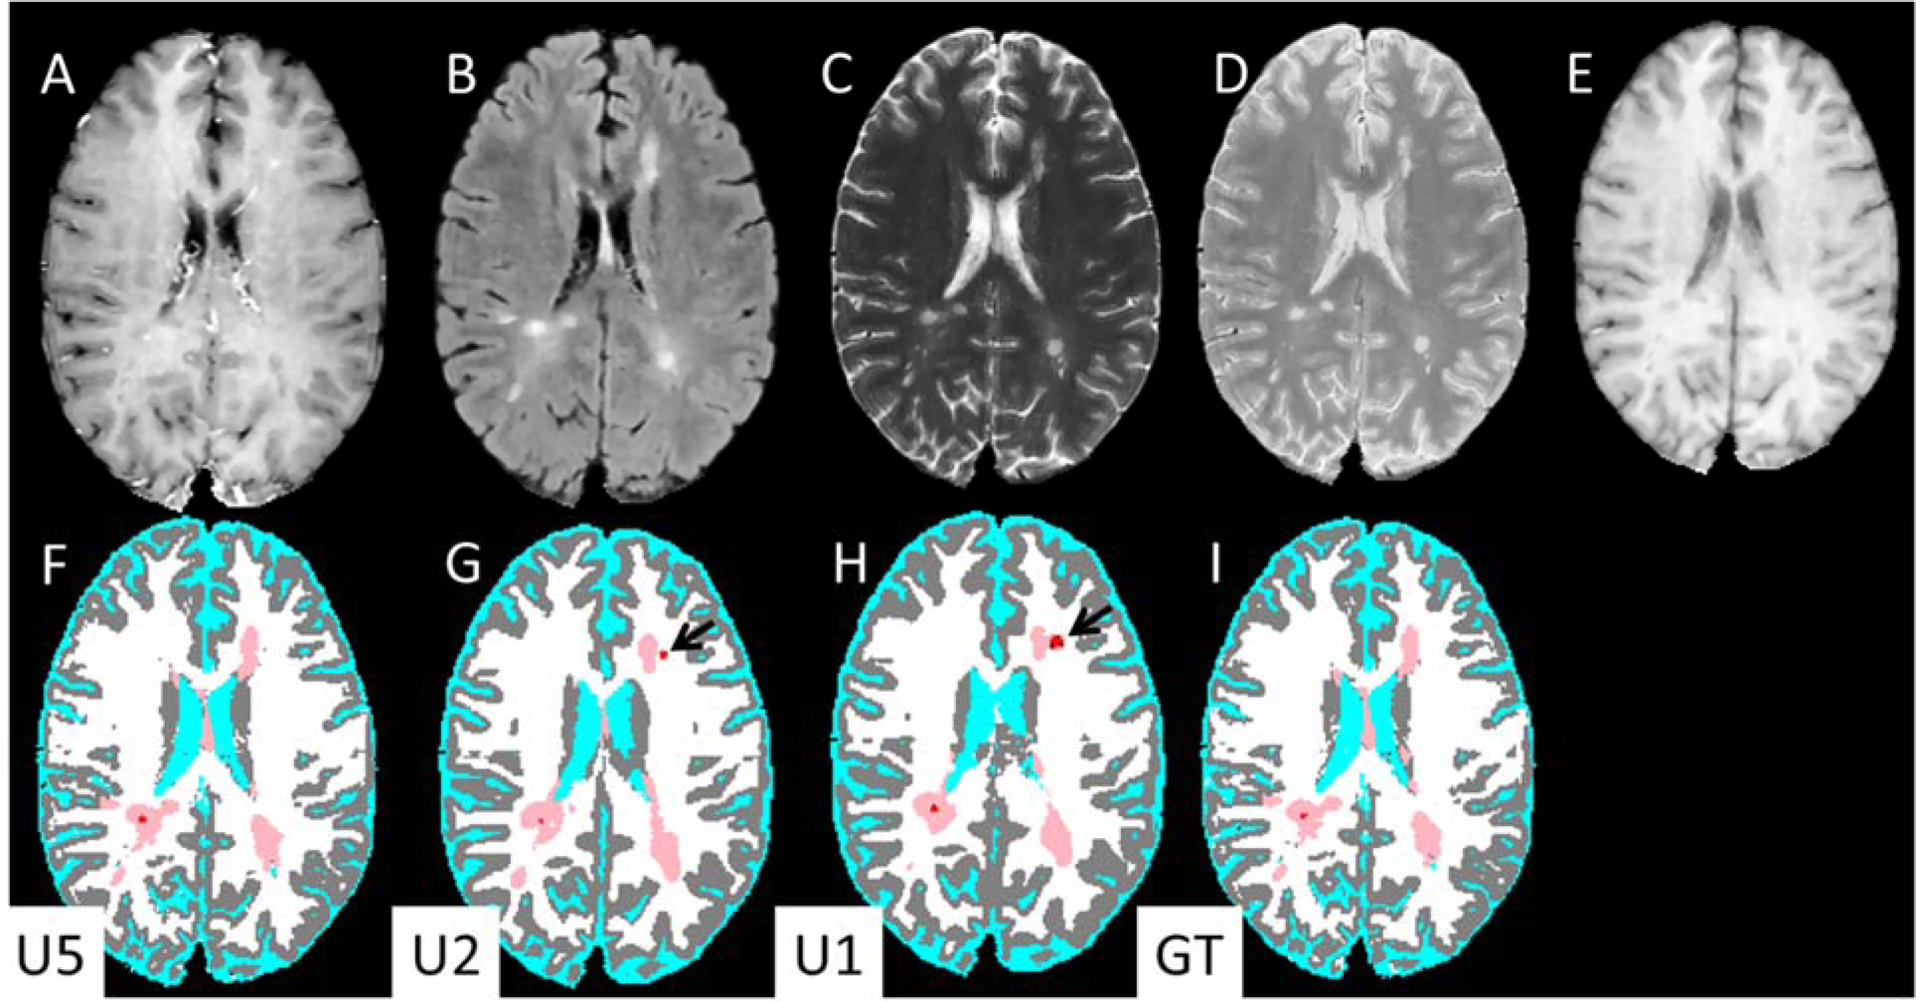
Input MR images (upper row) and DL segmentation (lower row). (A) post-Gd T1-weighted, (B) FLAIR, (C) T2-weighted, (D) PD-weighted, (E) pre-contrastT1-weighted images. Bottom row: segmentation maps based on: (F) U5, (G) U2, (H) U1, and (I) Ground truth. The segmentation maps are color-coded as in Fig. 2. Note the Gd-enhancing lesions segmented by U1 and U2 (black arrows) are absent from U5.
Figure 5.
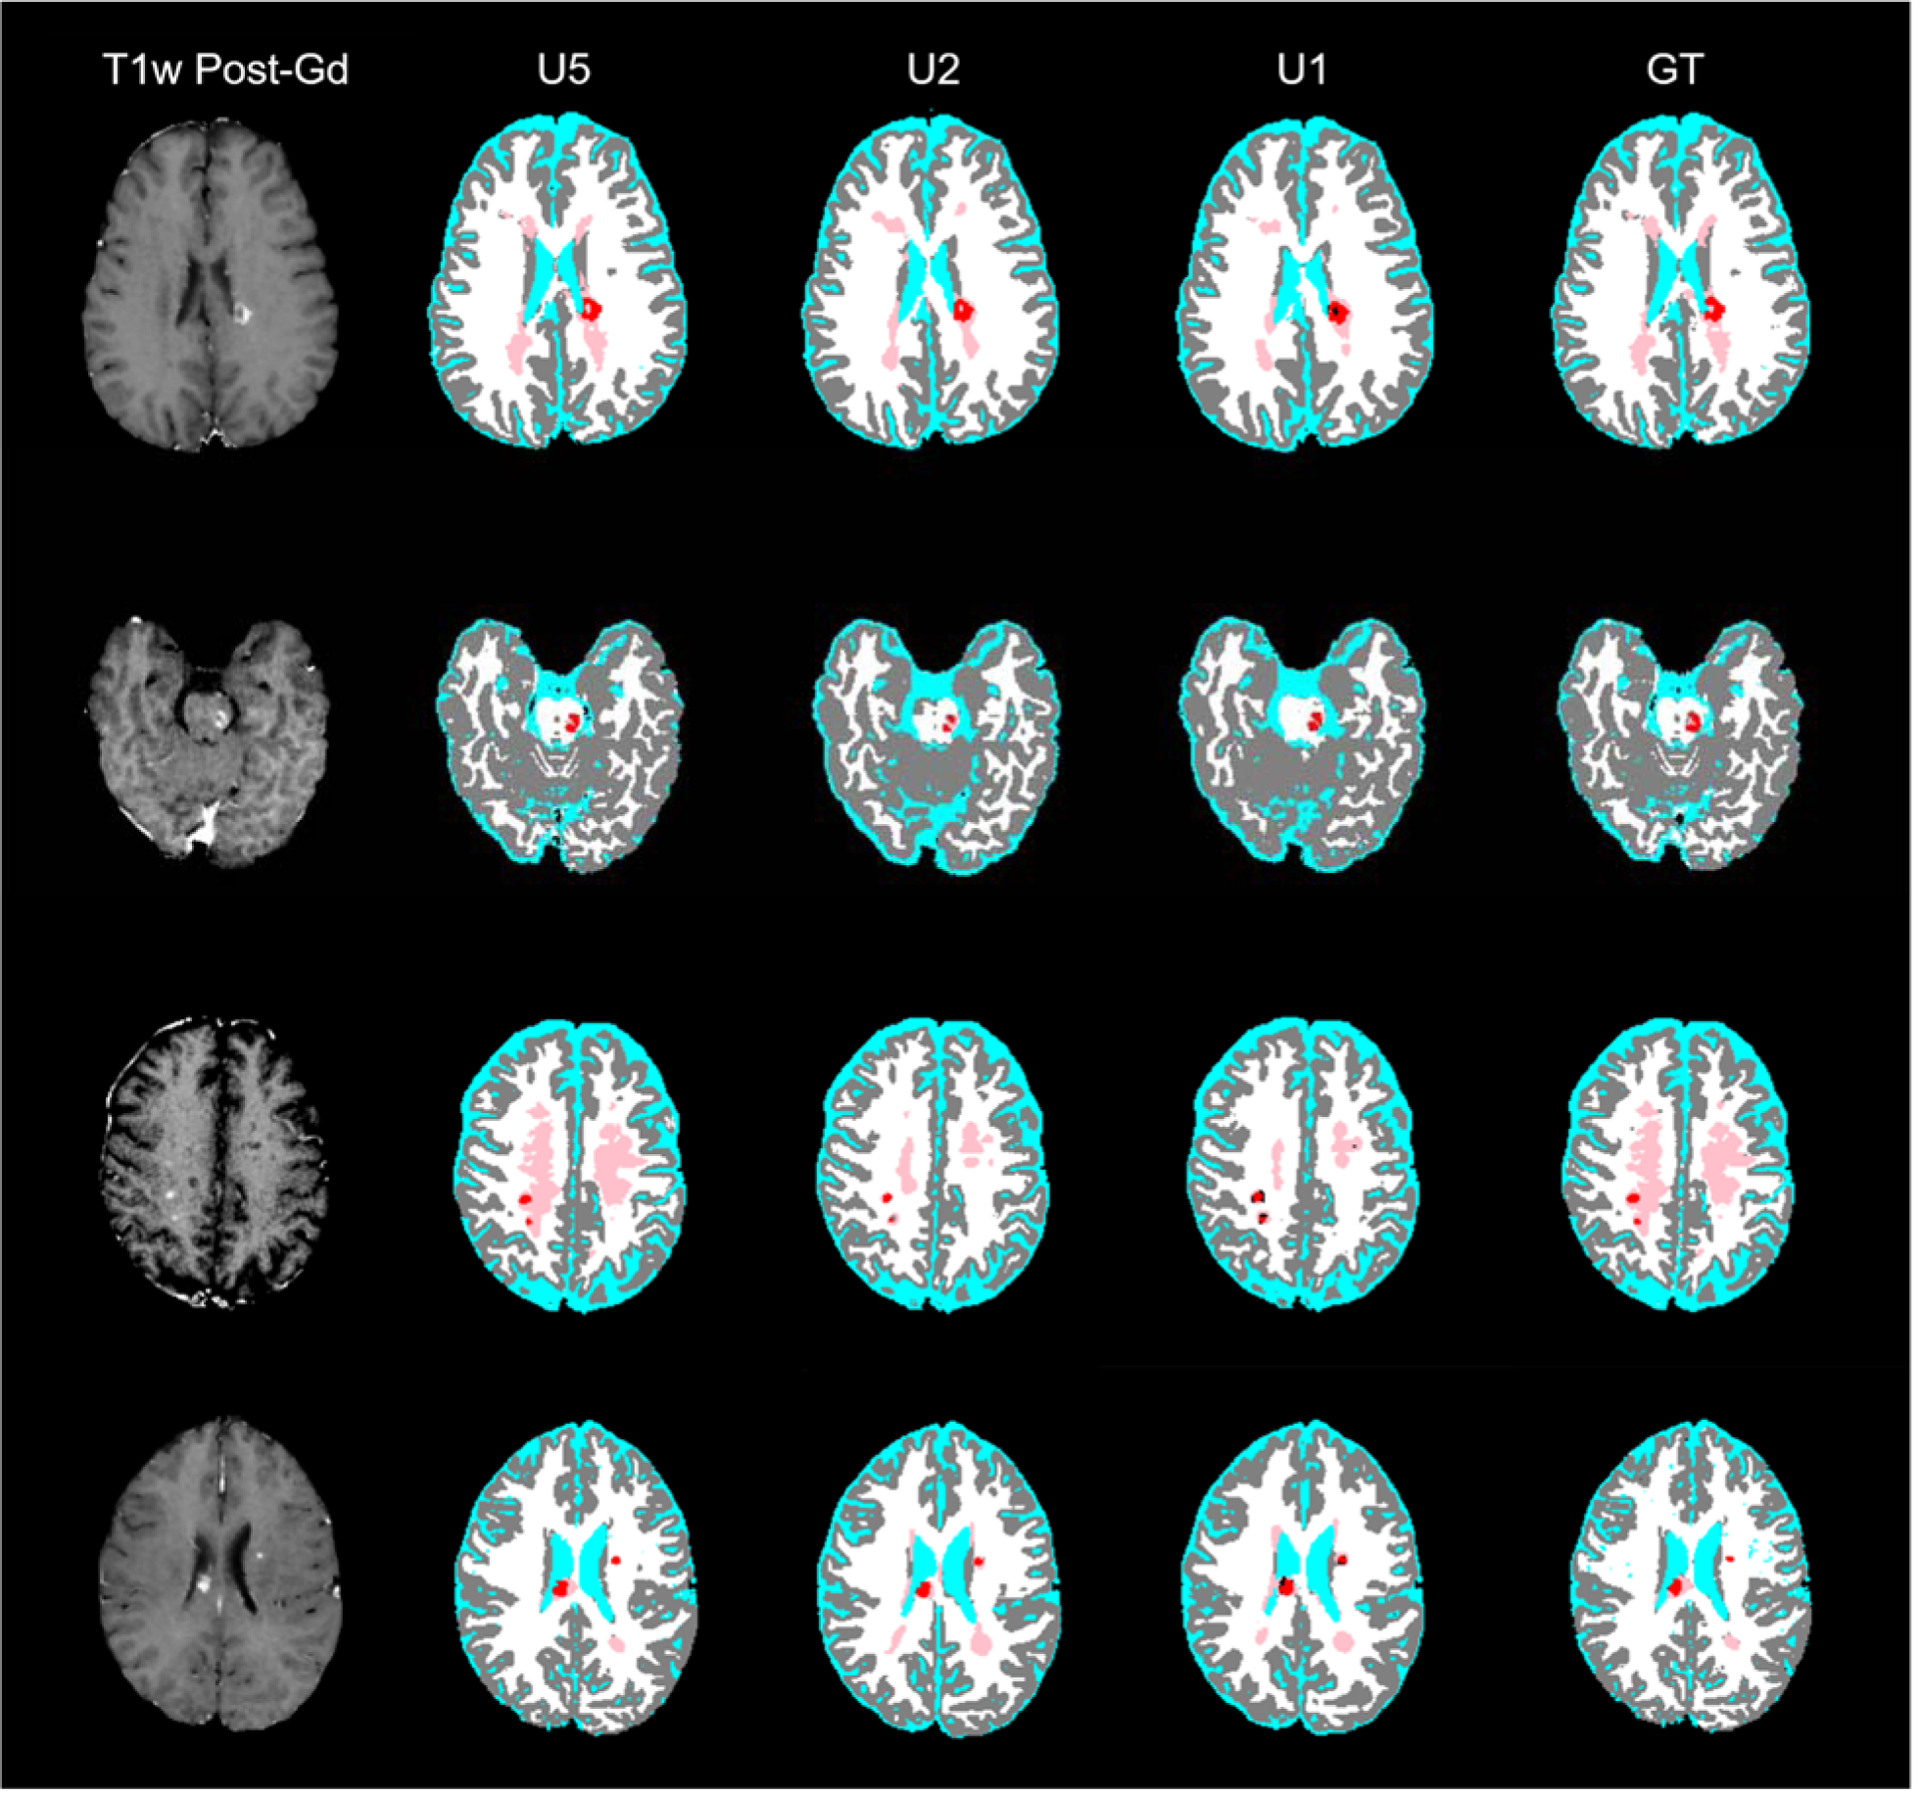
Post-Gd T1w images (left column) and DL model segmentation (columns 2–4) and ground-truth segmentation (right column) from four MS patients (rows). The segmentation maps are color-coded as in Fig. 2.
Discussion
In this study, we evaluated deep neural networks for fully-automated detection and segmentation of Gd-enhancing lesions on MR images. Evaluation on a large dataset shows excellent performance, achieving TPR of 0.90 and FPR of 0.23 and a high segmentation accuracy, as assessed by Dice similarity score of 0.77. In addition, the model simultaneously segmented all brain tissues. The proposed model is suitable for analyzing large amounts of data acquired as a part of multi-center studies. In addition, objective segmentation by DL reduces operator bias and inter-rater variability.
In contrast to T2-hyperintense lesion segmentation (see recent review by Danelakis et al.27), the literature on segmentation of Gd-enhancing lesions is sparse for a variety of reasons that include small lesion volumes, presence of non-lesional enhancements, etc. As indicated in the introduction, there are only 4 publications that addressed automatic segmentation of Gd enhancements. Bedell et al.10 mainly focused on the reduction of false positives by using stationary and marching saturation bands, but did not report the accuracy of their segmentation technique. He et al11 have analyzed data on 5 MS patients. They only reported bias between manual delineation and their technique, but did not explicitly report the actual performance metrics. Datta et al12 analyzed data on 22 patients and reported an average DSC of 0.76 that is similar to 0.77 obtained in this study, even though our sample size is much larger. The focus of Karimaghaloo13 was on detection of enhancing lesions and did not report the DSC values. They reported FPR and NPR per patient that makes it very difficult to directly compare their results with ours.
Enforcing the constraint that Gd-enhancing lesions also show as hyperintense lesions on PD- and T2-weighted and FLAIR images can substantially reduce the false positive rate12. Unlike previous work12, explicit masking of Gd-enhancing lesions by a T2 lesion mask was not needed as the network implicitly learned the masking operation. This was further confirmed by inspecting the overlap of Gd-enhancing lesions from the develop models with T2 lesions in the ground truth, which showed that 92% of the Gd-enhancing lesions detected by U5 actually overlapped with T2 lesions in the ground truth segmentation. In addition, the effect of contrast material in the vasculature and structures such as choroid plexus was also minimized in the current models by training the networks for segmentation of all brain tissues using four other non-contrast enhanced images. The improved performance is evidenced in the relatively small FPR of 0.23, averaged over all the enhancement volumes.
The U5 model uses 5 multispectral image sets to segment all brain tissues in addition to T2 lesions and Gd-enhancing lesions. While these images are routinely acquired in clinical MRI protocols of MS, it is also desirable to assess the segmentation quality when using one or two multispectral image inputs. Therefore, we tested two additional models where the input consisted of both pre- and post-Gd T1w images (U2), or only the post-Gd T1w image (U1). These networks resulted in similar average DSC/TPR/FPR of 0.72/0.86/0.31 and 0.72/0.87/0.34, respectively, but both were inferior to using all 5 MR images (U5 average DSC/TPR/FPR = 0.77/0.90/0.23). This reduced performance for U1 and U2 is perhaps due to loss of contextual and texture information about T2 hyperintense lesions and potential contrast enhancement features existing in non-Gd-enhanced images28. The developed models and Python scripts used in this study are available to the community in a public repository (https://github.com/uthmri).
A limitation of the current study was the lack of high-resolution 3D images which could provide better accuracy in the detection of small enhancing lesions. However, the dataset in this study is typical of clinical-grade MRI scans, which provide a realistic test of the proposed methods.
CombiRx MRI data included only conventional MRI sequences. Inclusion of advanced MRI such as diffusion-weighted and susceptibility-weighted images could have helped improve the segmentation results. Another limitation of this study is that the ground truth was arrived at by validating the MRIAP segmentation results by two experts. This may introduce some bias. It would have been more desirable to manually delineate enhancements on post-contrast T1-images, using other images as a guide. However, this is impractical, given the large data size. Finally, this study focused on developing the DL model and future studies will investigate correlations between the network segmentation and clinical outcomes.
In conclusion, we have shown the feasibility of accurately and automatically segmenting Gd-enhancing lesions from conventional multispectral MRI using DL. Assessment on a large cohort of 1006 MS patients yielded excellent results, confirming the potential role of DL techniques for routine automated analysis in MS, and for processing of large and heterogeneous data typically encountered in multi-center clinical trials.
References
- 1.Tullman MJ. Overview of the epidemiology, diagnosis, and disease progression associated with multiple sclerosis. Am J Manag Care. 2013;19(2 Suppl):S15–20. [PubMed] [Google Scholar]
- 2.Briggs FBS, Hill E. Estimating the prevalence of multiple sclerosis using 56.6 million electronic health records from the United States. Mult Scler J 2019. doi: 10.1177/1352458519864681 [DOI] [PubMed] [Google Scholar]
- 3.Lublin FD, Reingold SC, Cohen JA, et al. Defining the clinical course of multiple sclerosis: The 2013 revisions. Neurology. 2014;83(3):278–286. doi: 10.1212/WNL.0000000000000560 [DOI] [PMC free article] [PubMed] [Google Scholar]
- 4.Kappos L, Moeri D, Radue EW, et al. Predictive value of gadolinium-enhanced magnetic resonance imaging for relapse rate and changes in disability or impairment in multiple sclerosis: A meta-analysis. Lancet. 1999;353(9157):964–969. doi: 10.1016/S0140-6736(98)03053-0 [DOI] [PubMed] [Google Scholar]
- 5.Barkhof F, Held U, Simon JH, et al. Predicting gadolinium, enhancement status in MS patients eligible for randomized clinical trials. Neurology. 2005;65(9):1447–1454. doi: 10.1212/01.wnl.0000183149.87975.32 [DOI] [PubMed] [Google Scholar]
- 6.Cotton F, Weiner HL, Jolesz FA, Guttmann CRG. MRI contrast uptake in new lesions in relapsing-remitting MS followed at weekly intervals. Neurology. 2003;60(4):640–646. doi: 10.1212/01.WNL.0000046587.83503.1E [DOI] [PubMed] [Google Scholar]
- 7.Samarasekera S, Udupa JK, Miki Y, Wei L, Grossman RI. A new computer-assisted method for the quantification of enhancing lesions in multiple sclerosis. J Comput Assist Tomogr. 21(1):145–151. doi: 10.1097/00004728-199701000-00028 [DOI] [PubMed] [Google Scholar]
- 8.Miki Y, Grossman RI, Udupa JK, et al. Computer-assisted quantitation of enhancing lesions in multiple sclerosis: Correlation with clinical classification. Am J Neuroradiol. 1997;18(4):705–710. doi: 10.1097/00041327-199906000-00031 [DOI] [PMC free article] [PubMed] [Google Scholar]
- 9.Wolinsky JS, Narayana PA, Johnson KP. United States open-label glatiramer acetate extension trial for relapsing multiple sclerosis: MRI and clinical correlates. Mult Scler J 2001;7(1):33–41. doi: 10.1177/135245850100700107 [DOI] [PubMed] [Google Scholar]
- 10.Bedell BJ, Narayana PA. Automatic segmentation of gadolinium-enhanced multiple sclerosis lesions. Magn Reson Med. 1998;39(6):935–940. doi: 10.1002/mrm.1910390611 [DOI] [PubMed] [Google Scholar]
- 11.He R, Narayana PA. Automatic delineation of Gd enhancements on magnetic resonance images in multiple sclerosis. Med Phys. 2002;29(7):1536–1546. doi: 10.1118/1.1487422 [DOI] [PubMed] [Google Scholar]
- 12.Datta S, Sajja BR, He R, Gupta RK, Wolinsky JS, Narayana PA. Segmentation of gadolinium-enhanced lesions on MRI in multiple sclerosis. J Magn Reson Imaging. 2007;25(5):932–937. doi: 10.1002/jmri.20896 [DOI] [PubMed] [Google Scholar]
- 13.Karimaghaloo Z, Shah M, Francis SJ, Arnold DL, Collins DL, Arbel T. Automatic Detection of Gadolinium-Enhancing Multiple Sclerosis Lesions in Brain MRI Using Conditional Random Fields. IEEE Trans Med Imaging. 2012;31:1181–1194. doi: 10.1109/TMI.2012.2186639 [DOI] [PubMed] [Google Scholar]
- 14.Datta S, Narayana PA. A comprehensive approach to the segmentation of multichannel three-dimensional MR brain images in multiple sclerosis. NeuroImage Clin. 2013;2:184–196. doi: 10.1016/j.nicl.2012.12.007 [DOI] [PMC free article] [PubMed] [Google Scholar]
- 15.Datta S, Sajja BR, He R, Wolinsky JS, Gupta RK, Narayana PA. Segmentation and quantification of black holes in multiple sclerosis. Neuroimage. 2006;29(2):467–474. doi: 10.1016/j.neuroimage.2005.07.042 [DOI] [PMC free article] [PubMed] [Google Scholar]
- 16.Sajja BR, Datta S, He R, et al. Unified approach for multiple sclerosis lesion segmentation on brain MRI. Ann Biomed Eng. 2006;34(1):142–151. doi: 10.1007/s10439-005-9009-0 [DOI] [PMC free article] [PubMed] [Google Scholar]
- 17.Roy S, Butman JA, Reich DS, Calabresi PA, Pham DL. Multiple sclerosis lesion segmentation from brain MRI via fully convolutional neural networks. arXiv Prepr arXiv180309172. 2018. [Google Scholar]
- 18.Valverde S, Salem M, Cabezas M, et al. One-shot domain adaptation in multiple sclerosis lesion segmentation using convolutional neural networks. NeuroImage Clin. 2019;21:101638. doi: 10.1016/j.nicl.2018.101638 [DOI] [PMC free article] [PubMed] [Google Scholar]
- 19.Gabr RE, Coronado I, Robinson M, et al. Brain and lesion segmentation in multiple sclerosis using fully convolutional neural networks: A large-scale study. Mult Scler J. 2019. doi: 10.1177/1352458519856843 [DOI] [PMC free article] [PubMed] [Google Scholar]
- 20.Isensee F, Kickingereder P, Wick W, Bendszus M, Maier-Hein KH. Brain Tumor Segmentation and Radiomics Survival Prediction: Contribution to the BRATS 2017 Challenge. In: BrainLes 2017. Springer, Cham; 2018:287–297. doi: 10.1007/978-3-319-75238-9_25 [DOI] [Google Scholar]
- 21.He K, Zhang X, Ren S, Sun J. Deep Residual Learning for Image Recognition. In: 2016 IEEE Conference on Computer Vision and Pattern Recognition (CVPR) ; 2016:770–778. doi: 10.1109/CVPR.2016.90 [DOI] [Google Scholar]
- 22.Long J, Shelhamer E, Darrell T. Fully Convolutional Networks for Semantic Segmentation. CoRR. 2014;abs/1411.4. [DOI] [PubMed] [Google Scholar]
- 23.Glorot X, Bengio Y. Understanding the difficulty of training deep feedforward neural networks. In: Proceedings of the Thirteenth International Conference on Artificial Intelligence and Statistics. ; 2010:249–256. doi:10.1.1.207.2059 [Google Scholar]
- 24.Kingma DP, Ba J. Adam: A Method for Stochastic Optimization. In: 3rd International Conference for Learning Representations ; 2014. [Google Scholar]
- 25.Reddi Sashank, Satyen Kale SK. On the Convergence of Adam and Beyond. In: International Conference on Learning Representations. ; 2018. [Google Scholar]
- 26.Goodfellow I, Bengio Y, Courville A, Bengio Y. Deep Learning. Vol 1. MIT press Cambridge; 2016. [Google Scholar]
- 27.Danelakis A, Theoharis T, Verganelakis DA. Survey of automated multiple sclerosis lesion segmentation techniques on magnetic resonance imaging. Comput Med Imaging Graph. 2018;70:83–100. [DOI] [PubMed] [Google Scholar]
- 28.Narayana PA, Coronado I, Sujit SJ, Wolinsky JS, Lublin FD, Gabr RE. Deep Learning for Predicting Enhancing Lesions in Multiple Sclerosis from Noncontrast MRI. Radiology. 2019;In Press. [DOI] [PMC free article] [PubMed] [Google Scholar]


