Abstract
Patients with chronic myeloid leukemia (CML) who are treated with tyrosine kinase inhibitors (TKIs) experience significant heterogeneity regarding depth and speed of responses. Factors intrinsic and extrinsic to CML cells contribute to response heterogeneity and TKI-resistance. Among extrinsic factors, cytokine-mediated TKI-resistance has been demonstrated in CML progenitors, but the underlying mechanisms remain obscure. Using RNA-sequencing, we identified differentially expressed splicing factors in primary CD34+ chronic phase (CP) CML progenitors and controls. We found SRSF1 expression to be increased as a result of both BCR-ABL1- and cytokine-mediated signaling. SRSF1 overexpression conferred cytokine-independence to untransformed hematopoietic cells and impaired imatinib sensitivity in CML cells, while SRSF1 depletion in CD34+ CP CML cells prevented the ability of extrinsic cytokines to decrease imatinib sensitivity. Mechanistically, PRKCH and PLCH1, were upregulated by elevated SRSF1 levels, and contributed to impaired imatinib sensitivity. Importantly, very high SRSF1 levels in the bone marrow of CML patients at presentation correlated with poorer clinical TKI responses. In summary, we find SRSF1 levels to be maintained in CD34+ CP CML progenitors by cytokines despite effective BCR-ABL1 inhibition, and that elevated levels promote impaired imatinib responses. Together, our data supports an SRSF1/PRKCH/PLCH1 axis in contributing to cytokine-induced impaired imatinib sensitivity in CML.
Introduction
The bone marrow microenvironment has emerged as an important factor in leukemia stem and progenitor cell (LSPC) persistence and therapy resistance in CML, and is thought to contribute to the significant response heterogeneity observed among uniformly treated patients (1). For example, LSPC persistence is particularly striking in chronic phase (CP) chronic myeloid leukemia (CML), where approximately 60% of patients who achieve a stable deep molecular response with BCR-ABL1 tyrosine kinase inhibitors (TKIs) will relapse upon TKI cessation (2, 3). These observations have led to the search for microenvironmental factors that confer BCR-ABL1-independence to CML LSPCs (4-6), and several reports have since highlighted extrinsic cytokine signaling from bone marrow stromal cells (7), autocrine signaling from CML LSPCs, and physiologic hypoxia as potential mediators of LSPC persistence (6, 8-11). However, the actual intracellular intermediates that convey these extrinsic pro-survival signals within LSPCs, and which may represent therapeutic targets, have not been identified.
RNA-binding proteins, including splicing factors, have been reported to be altered in CML, but their contributions to CML LSPC persistence have not been thoroughly investigated (12-15). To address this gap, we performed an RNA-sequencing screen to identify CML-specific splicing factors that led to the identification of serine and arginine rich splicing factor 1 (SRSF1), which is a known proto-oncogene and is upregulated in various cancers (16-19). Increased SRSF1 is thought to contribute to transformation through various mechanisms, including effects on alternative splicing by increasing oncogenic and decreasing tumor suppressive spliced isoforms, respectively (18, 20). However, since SRSF1 is also involved in several other aspects of mRNA metabolism (16), other mechanisms by which SRSF1 contribute to transformation likely exist. Aside from tumorigenesis, elevated SRSF1 levels confer drug resistance to chemotherapy in several cancers (21-24), and correlates with disease relapse in hematological malignancies such as pediatric acute lymphoblastic leukemia (25). Importantly, these effects appear to be clinically meaningful, since increased SRSF1 levels also correlate with poorer patient survival (23, 25, 26).
In this study, we demonstrate that SRSF1 levels are elevated in CP CML CD34+ cells compared to normal CD34+ cells, and that increased SRSF1 expression in CML cells occurs via both intrinsic BCR-ABL1 signaling and extrinsic cytokine signaling. We find that increased SRSF1 confers cytokine-independence in untransformed Ba/F3 cells, while in CML cells it impairs imatinib sensitivity. In the latter, SRSF1 expression maintains PLC signaling in the presence of imatinib, which is required for cytokine-mediated impaired imatinib responses. Importantly, we also observe that high SRSF1 levels in CP CML patient bone marrow at presentation is associated with poorer clinical responses to imatinib.
Materials and Methods
Patient samples
Primary CML samples were obtained from patients at the Singapore General Hospital, cord blood samples were obtained from the Singapore Cord Blood Bank, and normal bone marrow cells were obtained commercially from AllCells (Alameda, CA, USA). The use of human-related protocols were approved by the Centralised Institutional Review Board from SingHealth (CIRB reference no. 2008/072/F). Informed consent was obtained from all subjects.
Statistical analysis
Statistical analyses for experiments were performed using Student’s t-test unless otherwise stated in the methods section. Experimental replicates are indicated in the figure legends.
Isolation of human stem and progenitor cells
Mononuclear cells (MNCs) were isolated from whole blood by density gradient centrifugation using Ficoll–Paque (Sigma, MO, USA). CD34+ cells were subsequently isolated from total MNCs using a CD34 MicroBead kit (Miltenyi Biotec, Germany). To determine the percentage of malignant CD34+ cells post-CD34+ isolation, two CP CML samples were sent for fluorescence in-situ hybridization with BCR-ABL1 probes (location 9q34/ 22q11.2) at the Singapore General Hospital Cytogenetics Laboratory. Both samples contained >90% BCR-ABL+ cells (out of 200 cells examined) as expected (4), and we assumed similar percentages for the rest of the samples used.
Culture conditions for primary human hematological cells
Prior to collection of CD34+ cells for RNA-sequencing, primary CP and normal bone marrow control cells were cultured in low cytokines for 96 h at 37°C in 21% O2. The standard cytokine cocktail for human CD34+ cells grown in Stempro media (Gibco, Waltham, MA USA) comprised 200pg/ml GM-CSF, 1ng/ml G-CSF, 200pg/ml SCF, 50pg/ml LIF, 200pg/ml MIP-1α, 1ng/ml IL-6 (Peprotech, Rocky Hill, NJ, USA), 200mM L-glutamine as described in (27). The high cytokine cocktail used is 25x the standard cytokine cocktail, as described (28).
Culture conditions for cell lines
K562 and KYO-1cells were maintained in Roswell Park Memorial Institute (RPMI) 1640 medium supplemented with 10% fetal bovine serum and final concentrations of 100 IU/mL penicillin, 100 μg/mL streptomycin and 2mM L-glutamine. Ba/F3 cells were maintained in RPMI 1640 Medium supplemented with 10% fetal bovine serum and final concentrations of 100 IU/mL penicillin, 100 μg/mL streptomycin, 2mM L-glutamine and 10ng/ml recombinant murine IL-3 (Peprotech, Rocky Hill, NJ, USA). Cell lines were sourced from the American Type Culture Collection (Manassas, VA, USA) and authenticated by short tandem repeat profiling. All cell lines used tested negative for mycoplasma contamination.
Plasmids for stable integration and viral production
To create retroviral vectors for the stable expression of wild-type N-terminal tagged T7 SRSF1, the T7SRSF1 ORF was cut out of pWZL constructs (20) by restriction enzyme digestion and cloned into a pMSCV construct containing an IRES followed by GFP as a positive selection marker. Lentiviral constructs for short hairpins targeting SRSF1 (Supplementary Table 1) were cloned into the pLVX IRES GFP vector backbone.
Transfection and transient silencing of genes
Cell lines were transfected with siRNAs using the AMAXA Nucleofection system (Lonza, Basel, Switzerland) while primary CD34+ cells were transfected using the NEPA21 electroporation system (Nepa Gene, Ichikawa-City, Chiba, Japan). Individual siRNAs targeting SRSF1 (#143030, #18970) and non-targeting control (#4390843) were purchased from Ambion, Austin, Texas, USA. siRNAs pools targeting PRKCH (#LQ-004655-00-005), PLCH1 (LQ-010279-01-005), PLCG2 (LQ-008339-02-005) and non-targeting control (D-001810-10-50) were purchased from Dharmacon, Lafayette, Colorado, USA.
Colony formation assay
Human primary CD34+ cells and CML cell lines were plated in semi-solid methylcellulose-based media, MethoCult™ H4434 (STEMCELL Technologies, Vancouver, Canada). Primary murine Lin− and Ba/F3 cells were grown in MethoCult™ M3434 or M3234 (with or without supplementation of 10ng/ml recombinant murine IL-3). Colonies originating from cell lines and primary cells were scored at either 10 or 14-18 days respectively after plating.
RNA extraction, reverse transcription, qPCR and RNA quality checks
Total RNA for primary cells was extracted using the Allprep DNA/RNA/miRNA Universal kit while total RNA from cell lines was extracted using the RNeasy mini kit. An on-column DNase I digest (Qiagen, Manchester, UK) was performed prior to preparation of cDNA with Superscript III Reverse Transcriptase (Thermo Fisher Scientific, Waltham, MA USA). qPCR reactions were prepared using iQ SYBR mix (Biorad, Hercules, CA, USA) following the manufacturer’s instructions, primer sequences can be found in Supplementary Table 2. RNA quality was measured using the Bioanalyzer 2100 (Agilent, Santa Clara, CA, USA). Only RNA samples which met our quality threshold of RIN≥7 were used for sequencing.
Library preparation and RNA-sequencing
The sequencing library was prepared after ribosomal RNA depletion followed by random-primed and stranded cDNA preparation using the Truseq Stranded Total RNA kit with Ribozero Gold kit (Illumina, San Diego, CA, USA). Sequencing was performed on an Illumina HiSeq2000, at a depth of 200 million and 50 million paired-end reads for the primary human cells and K562 cells respectively. GEO accession numbers are GSE140385 and GSE140322 for the primary CD34+ cells and K562 overexpressing SRSF1 respectively.
Gene expression analysis
Detection of gene expression changes was done by first computing gene counts using HTSeq (29) followed by differential gene expression analysis using DESeq2 (30), with known batch effect corrected for by limma (31). To identify candidate splicing factors that are differentially expressed, we set a cutoff criterion at a false discovery rate of 0.05 and a fold change of 1.5 in either direction. Functional analysis of differential gene expression was done with the Ingenuity Pathway Analysis platform (IPA, Qiagen, Manchester, UK). Significant associations with functional categories were identified using Fisher’s exact test at a p-value threshold of <0.05.
Alternative splicing analysis
For detecting alternatively spliced events, we first mapped the raw fastq files to the human genome 19 (hg19) with the UCSC Refseq annotation by STAR (32). We had >30% improper mapping which affected the splicing analysis. As such, we filtered mapping reads with insertion, deletion, and soft clip in the analysis. By using exon/intron junction spanning reads, we classified all discovered splicing events to either annotated or de novo splicing isoforms, based on annotation in the UCSC Refseq library. We used a Splice Index (SI) value to estimate the splicing level with specific splicing events with the number of case junction reads dividing the surrounding annotated reads. We also classified all discovered events based on the type of splicing event, i.e., intron retention, alternative 5’/3’ splice site, and exon skipping. For any two samples, we used ΔSI to evaluate the splicing difference between samples and Fisher’s exact test to determine statistical significance. A ∣ΔSI∣ > 20% and p-value<0.01 were defined as significant and differentially spliced. Functional analysis of differential ASEs was done with the IPA platform (Qiagen, Manchester, UK). Significant associations with functional categories were identified using Fisher’s exact test at a p-value threshold of <0.05.
Western blotting
Total cell lysates were prepared using RIPA lysis buffer supplemented with phosphatase and protease inhibitors (#04906837001 and #11836153001 respectively, Roche, Mannheim, Germany). Primary antibodies for SRSF1 phospho-PKC (#14902 and #9379 respectively, Cell Signalling Technology Inc, Danvers, MA, USA)
Immunohistochemistry
A total of 20 archival formalin-fixed paraffin-embedded (FFPE) specimens from patients diagnosed with CML between 2003 and 2013 at the Department of Anatomical Pathology, Division of Pathology, Singapore General Hospital were analyzed. Two cases of poor responders were excluded due to insufficient tissue. The cases were stratified based on the European LeukemiaNet criteria (33). These patients had been treated with imatinib; good and poor imatinib responders were categorized based on optimal response or failure to respond respectively. Clinical data for the cases are in Table 3. IHC staining was performed using whole tissue sections of 4 μM thickness and were incubated with antibodies specific for SRSF1 (Abcam 133689, 1:100, Epitope Retrieval 1, pH 5.9-6.1) and stained using Leica Bondmax Max autostainer (Leica Biosystems, Wetzlar, Germany). Appropriate positive and negative controls were included. IHC scoring was carried out based on images of labeled slides captured on an IntelliSite Pathology Ultra-Fast Scanner (Philips, Amsterdam, Netherlands) by two observers (CO and JI) blinded to the clinicopathological and survival information. To define SRSF1-positivity in the patient IHC samples, we located the area with the highest proportion of SRSF1-positive cells staining at 100x magnification. This area was further magnified to 400x and scored based on the presence of any cells in the viewing field with 3+ staining intensity.
For statistical analysis, the median, together with IQR (Interquantile range), was reported for continuous variable. Frequency, together with proportion, was reported for categorical data. Mann-Whitney U test was performed to compare continuous variables between good responders and poor responders, while Fisher’s exact test was carried out to compare categorical data between good responders and poor responders. All analyses were carried out using R 3.4.2 at 2 sided significance level of 0.05 (Supplementary Table 4).
Results
SRSF1 is upregulated in CD34+ CML progenitors compared to normal progenitors.
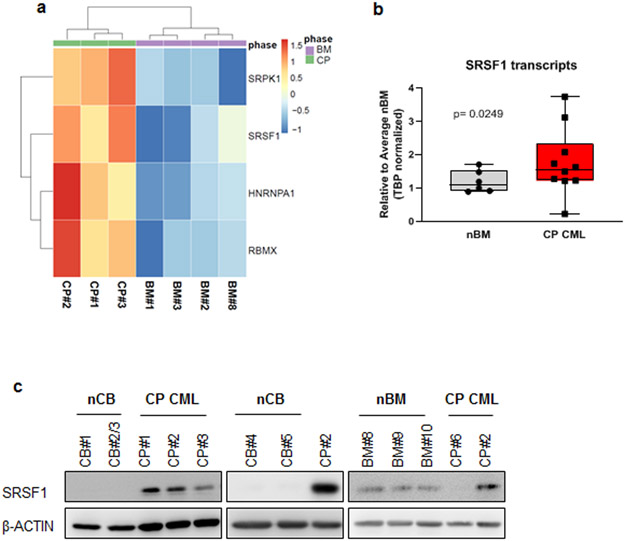
To identify splicing factors that are dysregulated in CML progenitors compared to normal progenitors, we performed RNA-sequencing on primary CD34+ human cells obtained from three CP CML patients at presentation and four normal bone marrow controls. Using SpliceAid-F (34), a database of 71 RNA-binding splicing regulators, we identified and validated the upregulation of four such factors in CP CML compared to normal progenitors (Fig 1a and Supplementary Fig 1, Supplementary Table 5). We then focused on SRSF1, where total transcripts were upregulated approximately 1.5-fold on average in CP CML compared to normal controls (Fig 1b). Importantly, we also observed a similar upregulation of SRSF1 protein expression in CD34+ CP CML progenitors compared to normal cord blood and bone marrow CD34+ progenitors (Fig 1c).
Fig 1.
SRSF1 is upregulated in CD34+ CML progenitors. a. Heatmap indicating the expression of RNA-binding proteins that were differentially expressed in CD34+ cells from four normal bone marrow (nBM) and three CP CML (CP) samples as determined from RNA-sequencing. Bar scale refers to the Z-scores. b. SRSF1 transcript levels in nBM and CP CML samples were measured by qPCR (nBM=6, CP CML=10). Whiskers represent minimum and maximum values, lines within the boxes represent median values, p-values are determined by Student’s t-test. c. Western blot of SRSF1 levels in whole cell lysates obtained from CD34+ normal cord blood (nCB), normal bone marrow (nBM) or CP CML samples. CP#2 has been used across all three blots to show relative protein levels.
SRSF1 is induced by BCR-ABL1 and cytokine signaling in CML cells.
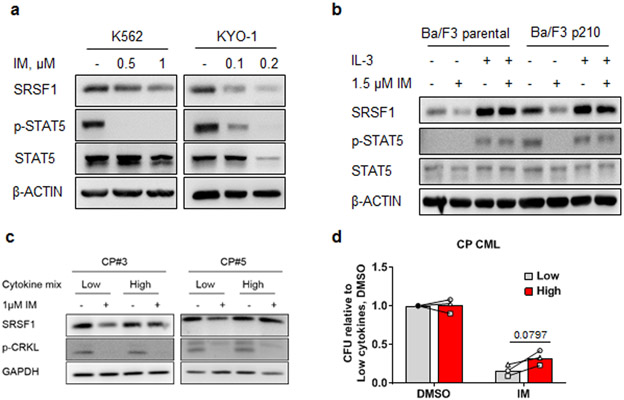
To determine if BCR-ABL1 signaling was inducing SRSF1, and thereby account for the differential expression of SRSF1 between CML and normal CD34+ progenitors (Fig 1c), we treated CML cell lines with imatinib, a relatively specific BCR-ABL1 kinase inhibitor. We found that SRSF1 protein expression was downregulated by TKIs in a dose-dependent manner (Fig 2a, Supplementary Fig 2a). We next employed an isogenic cell line system (murine Ba/F3 pro-B cells) to confirm these results. In parental Ba/F3 cells (which lack BCR-ABL1 and are IL-3-dependent), we found that SRSF1 was upregulated by IL-3, while in BCR-ABL1-containing Ba/F3 cells (Ba/F3 p210), SRSF1 could be induced by either BCR-ABL1 or IL-3 (Fig 2b and Supplementary Fig 2b), and IL-3 signaling could restore SRSF1 expression during BCR-ABL1 inhibition.
Fig 2.
SRSF1 is upregulated by BCR-ABL1 and extrinsic cytokine signaling. a. Western blots were performed on cell lysates from K562 and KYO-1 cells treated with increasing doses of IM for 48 h, (n=3). b. Western blots from isogenic cell lines, Ba/F3 parental and Ba/F3 p210, cultured in 10 ng/ml recombinant murine IL-3 and/or 1.5 μM IM for 24 h, (n=3). c. Western blots from CP CML CD34+ cells from two different patients treated with 1 μM imatinib (IM) for 16 h and supplemented with either ‘low’ or ‘high’ cytokines. d. Colony forming assays were performed using cells from CP CML CD34+ cells from 3 individual patients. CD34+ cells were cultured in either low or high cytokine levels and treated with 1 μM IM for 96 h. Following treatment, cells were plated in methylcellulose, and colony forming units (CFU) scored 14-18 days later. Colony numbers are represented relative to the low cytokine control in DMSO. Samples under low and high cytokine conditions from the same individual are connected by lines, p-values are determined by Student’s t-test.
To delineate how BCR-ABL1 and IL-3 signaling induce SRSF1 expression, we used pharmacological inhibitors to target signaling pathways downstream of both BCR-ABL1 and IL-3 signaling cascades (35-37). Consistent with a previous study, we found that inhibiting ERK1/2 downregulated SRSF1 (38), and additionally, that inhibiting PI3K/AKT signaling also downregulated SRSF1 protein levels in the K562 CML cell line (Supplementary Fig 2c, d).
Because exogenous cytokine signaling is known to confer impaired TKI sensitivity in CML cells (6, 11, 39, 40), we hypothesized that SRSF1 expression is required for cytokine-induced imatinib responsiveness. To test this, we incubated CD34+ CP CML progenitors under cytokine culture conditions previously shown to reduce TKI sensitivity (28), and found that SRSF1 levels are maintained by the presence of high cytokines in the culture media despite BCR-ABL1 kinase inhibition (Fig 2c). Consistent with our hypothesis and previous studies (41), culturing primary CD34+ CP CML patient cells in high cytokine conditions resulted in partial reduction in imatinib sensitivity, as determined by colony formation (Fig 2d).
SRSF1 confers cytokine independence and impaired imatinib sensitivity in hematopoietic and CML cells respectively.
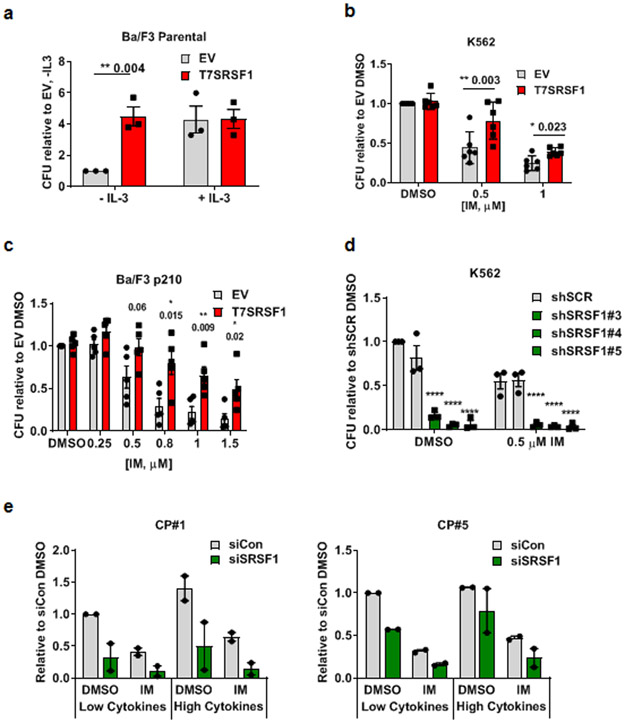
We next determined the function of SRSF1 in normal hematopoietic and CML cells. We found that the overexpression of SRSF1 in Ba/F3 cells resulted in IL-3-independence, relinquishing the need for supplemental IL-3 in proliferation assays in liquid media over 72 h (Supplementary Fig 3a), and colony formation in soft agar assays (Fig 3a).
Fig 3.
Elevated SRSF1 levels confer cytokine independence in hematopoietic cells and impaired imatinib sensitivity in CML cells. Colony forming units in a. Ba/F3 cells overexpressing T7SRSF1, with or without supplementation with 10 ng/ml IL-3 (n=3). CFUs are represented relative to empty vector control without IL-3. b. K562 empty vector control and T7SRSF1 overexpressing cells, treated with IM for 48 h (n=6). c. Ba/F3 p210 empty vector control and T7SRSF1 overexpressing cells, treated with IM for 48 h (n=5). d. K562 cells expressing either non-targeting controls, or shSRSF1, treated with 0.5 μM IM for 48 h (n=3). e. CFU from CD34+ CP CML cells expressing non-targeting control or siSRSF1 (n=2, per independent sample), cultured in the presence of low or high cytokines in combination with 2μM IM for 48h. p-values are determined by 2 way ANOVA, *p < 0.05; **p < 0.01; ***p < 0.001. Error bars represent ±SEM. All CFU numbers are represented relative to their respective controls and were scored 10-14 days after plating.
To test if SRSF1 expression is sufficient for impaired imatinib responses in CML cells, we exogenously expressed SRSF1 in K562, LAMA84-s and Ba/F3 p210 cells. Compared to vector controls, increased SRSF1 expression resulted in decreased imatinib sensitivity in both human and mouse CML cells, as determined by colony forming assays (Fig 3b, c, Supplementary Fig 3b). Additionally, we performed similar colony forming assays in nilotinib and ponatinib treated K562 cells (Supplementary Fig 3c, d), and determined that there was a trend for SRSF1 overexpression to enable the survival of more colonies, following nilotinib and ponatinib treatment, compared to controls, although the differences were small and not statistically significant. In the converse experiments, when we depleted SRSF1 in K562 cells, we observed a dramatic decrease in colony formation, which further decreased with imatinib treatment (Fig 3d). We also found that depleting SRSF1 led to reduced proliferation (Supplementary Fig 4a) over 96 h, while SRSF1 overexpression did not increase proliferation rates in K562 cells (Supplementary Fig 4b).
To further test our hypothesis in primary progenitor cells, we depleted SRSF1 levels in CP CML CD34+ progenitor cells from 2 independent patients and cultured them in either low or high cytokine culture conditions, and observed that, as for K562 cells, SRSF1 depletion not only decreased the colony forming abilities of these cells under non-drug treatment in either cytokine condition, but also further decreased colony numbers with imatinib treatment (Fig 3e). Congruent with our hypothesis that high SRSF1 levels confer cytokine-mediated impaired imatinib responses in CP CML, we observed a decrease in colony numbers in high cytokine/imatinib-treated cells to levels comparable to those in low cytokine/imatinib-treated conditions (Figure 3e), indicating that SRSF1 contributes to decreased imatinib sensitivity in CP CML CD34+ under high cytokine growth conditions.
SRSF1 overexpression antagonizes gene expression changes caused by imatinib treatment.
Since SRSF1 is mainly known as a splicing regulator, we sought to determine how SRSF1 alters alternative splicing and gene expression. Accordingly, we performed RNA-sequencing on SRSF1-overexpressing K562, in combination with imatinib treatment to determine differential alternative splicing and gene expression changes.
Although SRSF1 is a known splicing factor, our analysis of alternative splicing events (ASEs) revealed only 96 and 67 differential ASEs when comparing SRSF1 overexpression to vector controls in DMSO or imatinib treated conditions respectively (Supplementary Fig 5, Supplementary Tables 6-8). Amongst these ASEs, we observed changes in transcripts involved in cell cycle (CDC25A, SKP2), cell death (CASP8) and cell signaling (AKT1, TGFBR3, RARA, LEF1). We validated correct directionality in approximately two-thirds the splicing isoforms (Supplementary Fig 6, Supplementary Table 9).
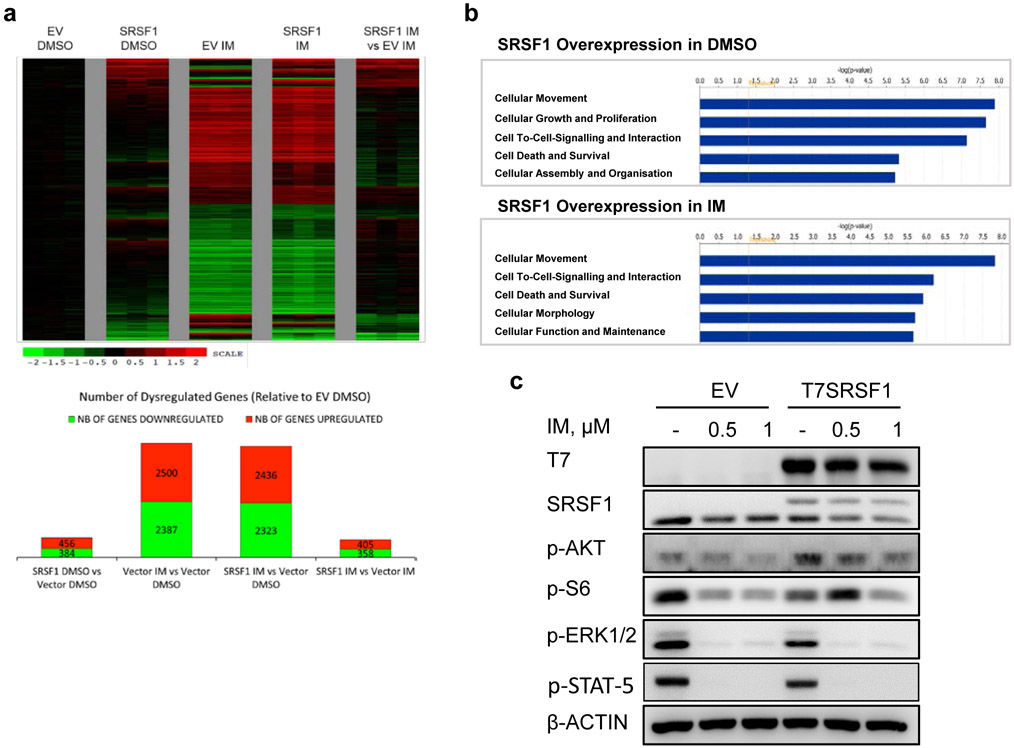
Gene expression profiling revealed that subsets of genes which were deregulated by SRSF1 overexpression alone remained deregulated despite BCR-ABL1 inhibition (Fig 4a, Supplementary Tables 10-12). This suggested that increased SRSF1 levels antagonized a subset of BCR-ABL1-regulated genes, which we attributed by IPA to be involved in cell proliferation and signaling (Fig 4b, Supplementary Tables 13-14). Consistently, despite inhibition of BCR-ABL1 with imatinib, the re-expression of SRSF1 maintained or reactivated multiple pro-survival signaling pathways, such as MAPK, PI3K/AKT and mTOR, at the protein level (Fig 4c, Supplementary Figs 7) which have likewise been shown in other cancers to be activated upon SRSF1 overexpression (42-46). Taken together, our comparison between SRSF1-mediated gene expression and alternative splicing suggests that they can both alter similar and overlapping processes, including cell signaling and proliferation.
Fig 4.
Upregulated SRSF1 levels antagonize imatinib-related gene expression via a non-splicing function of SRSF1. a. Top panel: Heatmap of gene expression changes from T7SRSF1 overexpressing K562 cells treated with 0.5 μM IM for 48 h. Differential gene expression is initially normalized to the average log counts from the three replicates in the empty vector (EV) DMSO condition, and analyzed relative to the EV control in either DMSO or IM-treated conditions. Thresholds used to determine deregulated genes are ≥1.5 fold change and p-values ≤0.05. Bottom panel: Number of genes differentially expressed relative to EV DMSO condition. b. The top five enriched pathways identified by IPA analysis on differentially expressed genes in cells overexpressing SRSF1 with DMSO (top) or 0.5 μM IM (bottom) treatment. c. Western blot from K562 cells overexpressing SRSF1, treated with 0.5 or 1μM IM for 48 h (n=3).
SRSF1 mediates impaired imatinib sensitivity by upregulating genes involved in the phospholipase C and protein kinase C signaling cascades
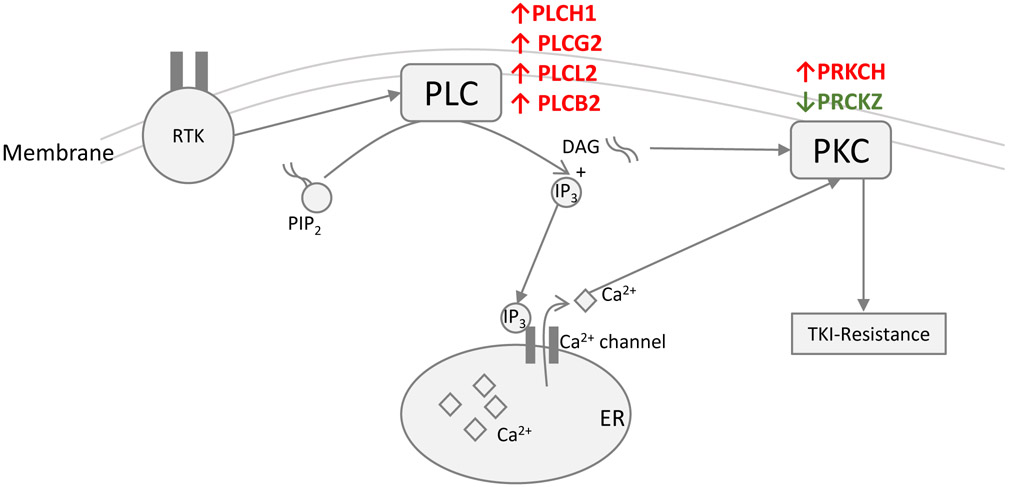
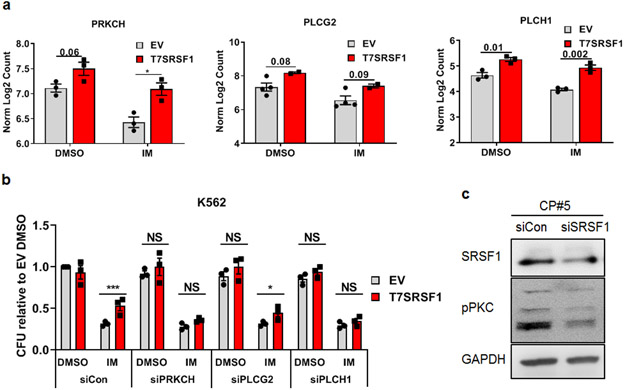
To refine our understanding of SRSF1-mediated impaired imatinib responses, we next focused on signaling pathways that have been associated with TKI resistance but have not previously been linked to SRSF1. Specifically, we noted the deregulation of several genes in the phospholipase C (PLC) pathway (47) upon SRSF1 overexpression (Fig 5). These genes included members of the PLC pathway itself (PLCH1, PLCG2, PLCB2, and PLCL2), and protein kinase C (PKC) pathway (PRKCH, and PRKCZ) (48). Five out of six of these genes were differentially upregulated in SRSF1-overexpressing cells, and their expression persisted despite BCR-ABL1 kinase inhibition (Fig 6a, Supplementary Fig 8).
Fig 5.
Schematic depicting genes in the PLC signalling pathway. Red and green arrows represent up and down-regulated genes respectively based on RNA-sequencing analysis of T7SRSF1 (SRSF1 overexpressing) compared to EV K562 (vector control) cells after 48 h 0.5 μM IM treatment.
Fig 6.
Targeting PKC signaling rescues SRSF1-mediated impaired imatinib responses a. Levels of PRC and PLC genes determined by RNA-sequencing of K562 cells overexpressing SRSF1. Transcript levels have been determined by normalizing Log2 counts. b. CFU from SRSF1-overexpressing K562 cells transfected with non-targeting control or siPRCKH/ PLCG2/ PLCH1 (n=3), treated with 0.5μM IM for 48h. IM treatment was started 48 h after transfection with the respective siRNA pools. Error bars represent ±SEM. p-values are determined by 2 way ANOVA, *p < 0.05; **p < 0.01; ***p < 0.001 All CFU numbers are represented relative to their respective controls and were scored 10-14 days after plating. c. Western blots from CD34+ CP CML progenitor cells following SRSF1 depletion with either a non-targeting siRNA control or siSRSF1. Cells were cultured in low cytokines and harvested for protein lysates 48h post-transfection.
To determine if these genes are involved in SRSF1-mediated impaired imatinib responses, we used siRNA to deplete three of these genes (PRKCH, PLCG2 and PLCH1) in SRSF1-overexpressing cells. We found that depletion of any of the three genes did not affect the colony forming ability of untreated cells, indicating that they did not affect colony formation per se (Fig 6b). However, depletion of PRKCH and PLCH1, but not PLCG2, prevented SRSF1 from conferring decreased imatinib sensitivity (Fig 6b), demonstrating that PRKCH and PLCH1, but not PLCG2, are important for mediating impaired imatinib sensitivity in SRSF1-overexpressing cells.
We next confirmed that SRSF1 contributes to PKC signaling in CD34+ CP CML progenitors. The depletion of SRSF1 led to a decrease in the overall levels of PKC signaling, as measured by the pan-phosphorylation of PKC isozymes (Fig 6c).
High in situ SRSF1 levels in patient bone marrow correlate with poor imatinib responses
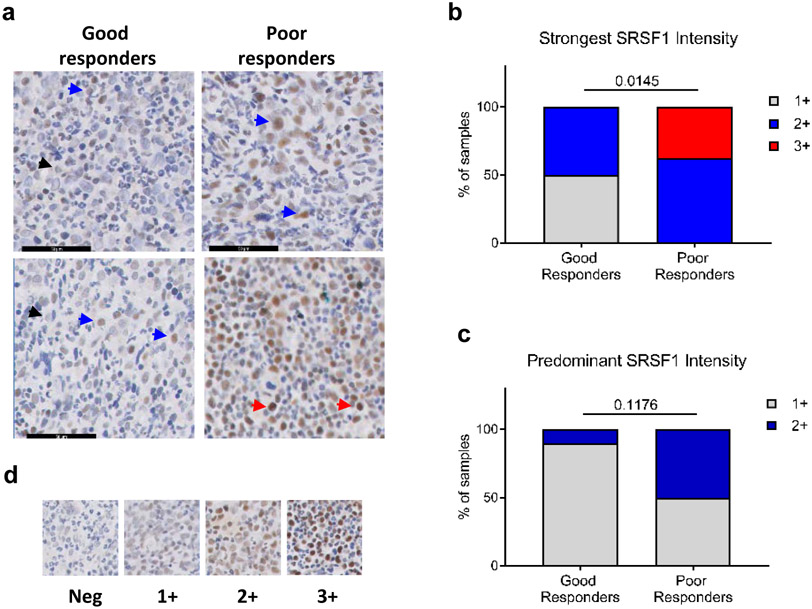
As increased SRSF1 levels promote decrease imatinib sensitivity in CML cells in vitro, we determined if SRSF1 expression levels in the bone marrow of CML patients at presentation correlated with their clinical response to imatinib. For this, we categorized patients into poor (failure to respond) or good (optimal response) responders based on European LeukemiaNet criteria (33), and used immunohistochemistry to quantitate SRSF1 levels in diagnostic bone marrow biopsies (Fig 7a, Supplementary Fig 9). We observed and scored two patterns of SRSF1 expression based on either the strongest SRSF1 intensity level in any given cell per patient FFPE section, or the predominant staining intensity across all stained cells per FFPE section. (Fig 7d, Supplementary Fig 9). Among ten good and eight poor responders, we found a higher proportion of poor imatinib responders having both strongest intensity (p=0.0145) and predominant SRSF1 (p=0.1176) staining (Fig 7b, c). Notably, the highest level of staining intensity (3+) was found only among poor responders, and comprised 32% of such samples (Fig 7b).
Fig 7.
SRSF1 levels correlate to imatinib response in CP CML patients. a. Representative IHC staining for SRSF1 in bone marrow sections from patients with good (left panels) and poor (right panels) imatinib responses. Arrows indicate 1+ (black), 2+ (blue) and 3+ (red) SRSF1 intensity levels in stained cells. b. Percentage of patients categorized by the strongest SRSF1 intensity levels in any given cell per FFPE section from (a), regardless of predominant intensity. c. Percentage of patients from (a), categorized according to the predominant SRSF1 levels across all SRSF1-positive cells. p-values are determined by a Fisher’s exact test. d. Scoring scale of the staining intensities in (b, c).
Discussion
CML patients exhibit significant heterogeneity with regards to the speed and depth of their TKI-responses, as well as likelihood of achieving deep molecular responses and treatment-free responses. This clinical heterogeneity likely reflects an underlying biological heterogeneity in TKI-resistance factors both within the tumor population and its associated microenvironment (49). While microenvironmental factors mediating TKI-resistance have been identified in CML (1, 50), specific factors have not been shown to predict or correlate with actual quality of clinical responses to TKIs in patients with CML. Here, we used an unbiased approach to define one such molecular pathway. We find that a novel SRSF1-PLC-PKC pathway, activated by a combination of intrinsic (BCR-ABL1) and extrinsic (cytokine) signaling contributes to imatinib sensitivity in CML cell lines and primary CD34+ progenitors. Moreoever, we determine that SRSF1 is required for decreased imatinib responses induced by the presence of high cytokine levels in CP progenitors (Fig 3e). Importantly, in presentation bone marrows of CP patients, we also show that very high (3+) SRSF1 levels correlate with poorer clinical responses (Fig 7). While we are unable to determine whether the increased SRSF1 levels in the bone marrow are due to increased BCR-ABL1 activity, the presence of increased extrinsic cytokine signaling, or both, we nevertheless identify SRSF1 as an important prognostic factor at diagnosis. Moreover, given the smaller differences in decreased sensitivity to nilotinib and ponatinib compared to imatinib (Fig 3, and Supplementary Figs 3c, 3d), it would be interesting to determine if bone marrow SRSF1 levels continue to predict TKI responses in cohorts of patients treated with second and third generation TKIs. Further studies will also need to be conducted to determine if SRSF1 levels impact either deep molecular responses, or treatment-free responses, and correspondingly, if SRSF1 levels affect TKI-responses in CP leukemia stem cells.
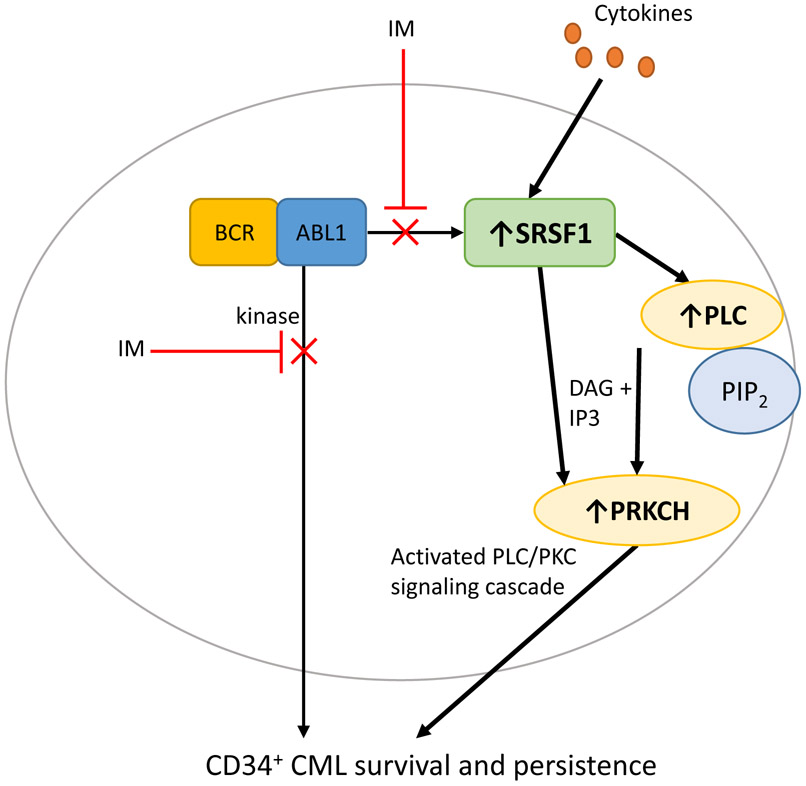
Our work also uncovers the mechanism by which SRSF1 mediates impaired imatinib sensitivity in CML cells. We find that while SRSF1 activates a range of signaling pathways, including AKT and MAPK, it is the activation of PKC and PLC signaling, via PRKCH and PLCH1 respectively that confers sensitivity to imatinib. In this respect, while our data confirm the ability of PRKCH to mediate imatinib sensitivity in CML cells (51), they extend these observations in novel and important ways. First, we identify SRSF1 as a novel upstream regulator of PRKCH, and second, we show how cytokine-mediated signaling can activate the SRSF1-PRKCH axis, thereby demonstrating a specific mechanism via which extrinsic signaling contributes to imatinib response in CP progenitors. We also show that inactivation of this pathway, by gene silencing of SRSF1, prevents high cytokine growth conditions from inducing imatinib sensitivity in CP progenitors. Thus our findings fill several knowledge gaps, and provide a molecular route by which microenvironmental signals contribute to heterogeneous clinical responses (Fig 8). Because SRSF1 has both canonical roles in pre-mRNA splicing as well as non-canonical roles (in mRNA translation, nuclear-cytoplasmic export of mRNAs, and miRNA biogenesis), it remains possible that any one or combination of these downstream processes contribute to SRSF1-mediated decreased imatinib sensitivity (16).
Fig 8.
Model depicting the role of cytokine-mediated SRSF1 upregulation as a BCR-ABL1-independent mechanism that impairs imatinib sensitivity in CP progenitor cells, and enables enhanced survival and persistence.
Our results also suggest therapeutic approaches by which the SRSF1-PRKCH axis might be targeted to overcome poor imatinib sensitivity, and include the use of PKC inhibitors. However, to our knowledge, highly selective inhibitors for PKCη (the protein isoform encoded by the PRKCH gene) remain unavailable (52), and the use of existing inhibitors may be confounded by off-target effects. Consistent with these concerns, we found that a commonly used PKC inhibitor, rottlerin (53), was able to overcome SRSF1-mediated decrease in imatinib sensitivity, but also had non-specific effects on colony formation (Supplementary Fig 10). Although we documented the finding that SRSF1 also activated the mTOR and ERK1/2 pathways, we found that inhibitors to these pathways were not able to overcome the decreased imatinib responses mediated by SRSF1 (Supplementary Fig 10). These results suggest that additional pathways downstream of SRSF1 mediate its effects, e.g. PKC.
In summary, using an unbiased approach, we have identified SRSF1 as an important factor in mediating BCR-ABL1-independent, impaired imatinib responses. SRSF1 activates pleiotropic signaling pathways, but in particular PRKCH appears to be required for SRSF1’s ability to decrease imatinib sensitivity, and may be amenable to therapeutic targeting when specific PKCη inhibitors become available. Given that SRSF1 expression levels in bone marrow also identifies patients at risk of inferior TKI-responses, it may also be used as a biomarker to identify such patients for additional therapeutic approaches.
Supplementary Material
Acknowledgements
This work was supported by grants from the National Medical Council Singapore (NMRC/CSA/0051/2013 and NMRC/CIRG/1404/2014).
Footnotes
Conflicts of Interest
The authors have declared that no conflict of interest exists.
References
- 1.Arrigoni E, Del Re M, Galimberti S, Restante G, Rofi E, Crucitta S, et al. Concise Review: Chronic Myeloid Leukemia: Stem Cell Niche and Response to Pharmacologic Treatment. Stem Cells Transl Med. 2018;7(3):305–14. [DOI] [PMC free article] [PubMed] [Google Scholar]
- 2.Mahon F-X, Réa D, Guilhot J, Guilhot F, Huguet F, Nicolini F, et al. Discontinuation of imatinib in patients with chronic myeloid leukaemia who have maintained complete molecular remission for at least 2 years: the prospective, multicentre Stop Imatinib (STIM) trial. The Lancet Oncology. 2010;11(11):1029–35. [DOI] [PubMed] [Google Scholar]
- 3.Rea D, Nicolini FE, Tulliez M, Guilhot F, Guilhot J, Guerci-Bresler A, et al. Discontinuation of dasatinib or nilotinib in chronic myeloid leukemia: interim analysis of the STOP 2G-TKI study. Blood. 2017;129(7):846–54. [DOI] [PubMed] [Google Scholar]
- 4.Copland M, Hamilton A, Elrick LJ, Baird JW, Allan EK, Jordanides N, et al. Dasatinib (BMS-354825) targets an earlier progenitor population than imatinib in primary CML but does not eliminate the quiescent fraction. Blood. 2006;107(11):4532–9. [DOI] [PubMed] [Google Scholar]
- 5.Graham SM, Jørgensen HG, Allan E, Pearson C, Alcorn MJ, Richmond L, et al. Primitive, quiescent, Philadelphia-positive stem cells from patients with chronic myeloid leukemia are insensitive to STI571 in vitro. Blood. 2002;99(1):319–25. [DOI] [PubMed] [Google Scholar]
- 6.Corbin AS, Agarwal A, Loriaux M, Cortes J, Deininger MW, Druker BJ. Human chronic myeloid leukemia stem cells are insensitive to imatinib despite inhibition of BCR-ABL activity. J Clin Invest. 2011;121(1):396–409. [DOI] [PMC free article] [PubMed] [Google Scholar]
- 7.Graf L, Iwata M, Torok-Storb B. Gene expression profiling of the functionally distinct human bone marrow stromal cell lines HS-5 and HS-27a. Blood. 2002;100(4):1509–11. [DOI] [PubMed] [Google Scholar]
- 8.Jiang X, Lopez A, Holyoake T, Eaves A, Eaves C. Autocrine production and action of IL-3 and granulocyte colony-stimulating factor in chronic myeloid leukemia. Proceedings of the National Academy of Sciences. 1999;96(22):12804–9. [DOI] [PMC free article] [PubMed] [Google Scholar]
- 9.Traer E, MacKenzie R, Snead J, Agarwal A, Eiring AM, O'Hare T, et al. Blockade of JAK2-mediated extrinsic survival signals restores sensitivity of CML cells to ABL inhibitors. Leukemia. 2012;26(5):1140. [DOI] [PMC free article] [PubMed] [Google Scholar]
- 10.Bewry NN, Nair RR, Emmons MF, Boulware D, Pinilla-Ibarz J, Hazlehurst LA. Stat3 contributes to resistance toward BCR-ABL inhibitors in a bone marrow microenvironment model of drug resistance. Molecular cancer therapeutics. 2008;7(10):3169–75. [DOI] [PMC free article] [PubMed] [Google Scholar]
- 11.Wang Y, Cai D, Brendel C, Barett C, Erben P, Manley PW, et al. Adaptive secretion of granulocyte-macrophage colony-stimulating factor (GM-CSF) mediates imatinib and nilotinib resistance in BCR/ABL+ progenitors via JAK-2/STAT-5 pathway activation. Blood. 2007;109(5):2147–55. [DOI] [PubMed] [Google Scholar]
- 12.Chang JS, Santhanam R, Trotta R, Neviani P, Eiring AM, Briercheck E, et al. High levels of the BCR/ABL oncoprotein are required for the MAPK-hnRNP-E2–dependent suppression of C/EBPα-driven myeloid differentiation. Blood. 2007;110(3):994–1003. [DOI] [PMC free article] [PubMed] [Google Scholar]
- 13.Holm F, Hellqvist E, Mason CN, Ali SA, Delos-Santos N, Barrett CL, et al. Reversion to an embryonic alternative splicing program enhances leukemia stem cell self-renewal. Proceedings of the National Academy of Sciences. 2015;112(50):15444–9. [DOI] [PMC free article] [PubMed] [Google Scholar]
- 14.Salesse S, Dylla SJ, Verfaillie CM. p210BCR/ABL-induced alteration of pre-mRNA splicing in primary human CD34+ hematopoietic progenitor cells. Leukemia. 2004;18(4):727–33. [DOI] [PubMed] [Google Scholar]
- 15.Iervolino A, Santilli G, Trotta R, Guerzoni C, Cesi V, Bergamaschi A, et al. hnRNP A1 nucleocytoplasmic shuttling activity is required for normal myelopoiesis and BCR/ABL leukemogenesis. Molecular and cellular biology. 2002;22(7):2255–66. [DOI] [PMC free article] [PubMed] [Google Scholar]
- 16.Das S, Krainer AR. Emerging functions of SRSF1, splicing factor and oncoprotein, in RNA metabolism and cancer. Mol Cancer Res. 2014;12(9):1195–204. [DOI] [PMC free article] [PubMed] [Google Scholar]
- 17.de Miguel FJ, Sharma RD, Pajares MJ, Montuenga LM, Rubio A, Pio R. Identification of alternative splicing events regulated by the oncogenic factor SRSF1 in lung cancer. Cancer research. 2014;74(4):1105–15. [DOI] [PubMed] [Google Scholar]
- 18.Anczukow O, Rosenberg AZ, Akerman M, Das S, Zhan L, Karni R, et al. The splicing factor SRSF1 regulates apoptosis and proliferation to promote mammary epithelial cell transformation. Nat Struct Mol Biol. 2012;19(2):220–8. [DOI] [PMC free article] [PubMed] [Google Scholar]
- 19.Sheng J, Zhao J, Xu Q, Wang L, Zhang W, Zhang Y. Bioinformatics analysis of SRSF1-controlled gene networks in colorectal cancer. Oncology letters. 2017;14(5):5393–9. [DOI] [PMC free article] [PubMed] [Google Scholar]
- 20.Karni R, Hippo Y, Lowe SW, Krainer AR. The splicing-factor oncoprotein SF2/ASF activates mTORC1. Proc Natl Acad Sci U S A. 2008;105(40):15323–7. [DOI] [PMC free article] [PubMed] [Google Scholar]
- 21.Shultz JC, Goehe RW, Murudkar CS, Wijesinghe DS, Mayton EK, Massiello A, et al. SRSF1 regulates the alternative splicing of caspase 9 via a novel intronic splicing enhancer affecting the chemotherapeutic sensitivity of non-small cell lung cancer cells. Mol Cancer Res. 2011;9(7):889–900. [DOI] [PMC free article] [PubMed] [Google Scholar]
- 22.Adesso L, Calabretta S, Barbagallo F, Capurso G, Pilozzi E, Geremia R, et al. Gemcitabine triggers a pro-survival response in pancreatic cancer cells through activation of the MNK2/eIF4E pathway. Oncogene. 2013;32(23):2848–57. [DOI] [PubMed] [Google Scholar]
- 23.Gout S, Brambilla E, Boudria A, Drissi R, Lantuejoul S, Gazzeri S, et al. Abnormal expression of the pre-mRNA splicing regulators SRSF1, SRSF2, SRPK1 and SRPK2 in non small cell lung carcinoma. PloS one. 2012;7(10):e46539. [DOI] [PMC free article] [PubMed] [Google Scholar]
- 24.van der Werf I, Cloos J. Involvement of SRSF1 in Alternative Splicing of FPGS and Methotrexate Resistance in Children with Acute Lymphoblastic Leukemia. Student Undergraduate Research E-journal! 2015;1. [Google Scholar]
- 25.Zou L, Zhang H, Du C, Liu X, Zhu S, Zhang W, et al. Correlation of SRSF1 and PRMT1 expression with clinical status of pediatric acute lymphoblastic leukemia. Journal of hematology & oncology. 2012;5(1):42. [DOI] [PMC free article] [PubMed] [Google Scholar]
- 26.Jiang L, Huang J, Higgs BW, Hu Z, Xiao Z, Yao X, et al. Genomic Landscape Survey Identifies SRSF1 as a Key Oncodriver in Small Cell Lung Cancer. PLoS Genet. 2016;12(4):e1005895. [DOI] [PMC free article] [PubMed] [Google Scholar]
- 27.Bhatia R, McGlave PB, Dewald GW, Blazar B, Verfaillie C. Abnormal function of the bone marrow microenvironment in chronic myelogenous leukemia: role of malignant stromal macrophages. Blood. 1995;85(12):3636–45. [PubMed] [Google Scholar]
- 28.Chu S, Holtz M, Gupta M, Bhatia R. BCR/ABL kinase inhibition by imatinib mesylate enhances MAP kinase activity in chronic myelogenous leukemia CD34+ cells. Blood. 2004;103(8):3167–74. [DOI] [PubMed] [Google Scholar]
- 29.Anders S, Pyl PT, Huber W. HTSeq—a Python framework to work with high-throughput sequencing data. Bioinformatics. 2015;31(2):166–9. [DOI] [PMC free article] [PubMed] [Google Scholar]
- 30.Love MI, Huber W, Anders S. Moderated estimation of fold change and dispersion for RNA-seq data with DESeq2. Genome biology. 2014;15(12):550. [DOI] [PMC free article] [PubMed] [Google Scholar]
- 31.Ritchie ME, Phipson B, Wu D, Hu Y, Law CW, Shi W, et al. limma powers differential expression analyses for RNA-sequencing and microarray studies. Nucleic acids research. 2015;43(7):e47–e. [DOI] [PMC free article] [PubMed] [Google Scholar]
- 32.Dobin A, Davis CA, Schlesinger F, Drenkow J, Zaleski C, Jha S, et al. STAR: ultrafast universal RNA-seq aligner. Bioinformatics. 2013;29(1):15–21. [DOI] [PMC free article] [PubMed] [Google Scholar]
- 33.Baccarani M, Deininger MW, Rosti G, Hochhaus A, Soverini S, Apperley JF, et al. European LeukemiaNet recommendations for the management of chronic myeloid leukemia: 2013. Blood. 2013;122(6):872–84. [DOI] [PMC free article] [PubMed] [Google Scholar]
- 34.Giulietti M, Piva F, D’Antonio M, D’Onorio De Meo P, Paoletti D, Castrignano T, et al. SpliceAid-F: a database of human splicing factors and their RNA-binding sites. Nucleic acids research. 2012;41(D1):D125–D31. [DOI] [PMC free article] [PubMed] [Google Scholar]
- 35.Skorski T, Kanakaraj P, Nieborowska-Skorska M, Ratajczak M, Wen S-C, Zon G, et al. Phosphatidylinositol-3 kinase activity is regulated by BCR/ABL and is required for the growth of Philadelphia chromosome-positive cells. Blood. 1995;86(2):726–36. [PubMed] [Google Scholar]
- 36.Cortez D, Reuther G, Pendergast AM. The Bcr-Abl tyrosine kinase activates mitogenic signaling pathways and stimulates G1-to-S phase transition in hematopoietic cells. Oncogene. 1997;15(19):2333. [DOI] [PubMed] [Google Scholar]
- 37.Tago K, Kaziro Y, Satoh T. Functional involvement of mSos in interleukin-3 and thrombin stimulation of the Ras, mitogen-activated protein kinase pathway in BaF3 murine hematopoietic cells. The Journal of Biochemistry. 1998;123(4):659–67. [DOI] [PubMed] [Google Scholar]
- 38.Valacca C, Bonomi S, Buratti E, Pedrotti S, Baralle FE, Sette C, et al. Sam68 regulates EMT through alternative splicing–activated nonsense-mediated mRNA decay of the SF2/ASF proto-oncogene. The Journal of cell biology. 2010:jcb. 201001073. [DOI] [PMC free article] [PubMed] [Google Scholar]
- 39.Lee CR, Kang JA, Kim HE, Choi Y, Yang T, Park SG. Secretion of IL-1β from imatinib-resistant chronic myeloid leukemia cells contributes to BCR–ABL mutation-independent imatinib resistance. FEBS letters. 2016;590(3):358–68. [DOI] [PubMed] [Google Scholar]
- 40.Levescot A, Flamant S, Basbous S, Jacomet F, Féraud O, Bourgeois EA, et al. BCR-ABL–Induced Deregulation of the IL-33/ST2 Pathway in CD34 (+) Progenitors from Chronic Myeloid Leukemia Patients. Cancer research. 2014;74(10):2669–76. [DOI] [PubMed] [Google Scholar]
- 41.Zhang B, Ho YW, Huang Q, Maeda T, Lin A, Lee SU, et al. Altered microenvironmental regulation of leukemic and normal stem cells in chronic myelogenous leukemia. Cancer Cell. 2012;21(4):577–92. [DOI] [PMC free article] [PubMed] [Google Scholar]
- 42.Quentmeier H, Eberth S, Romani J, Zaborski M, Drexler HG. BCR-ABL1-independent PI3Kinase activation causing imatinib-resistance. Journal of Hematology & Oncology. 2011;4(1):6. [DOI] [PMC free article] [PubMed] [Google Scholar]
- 43.Wöhrle FU, Halbach S, Aumann K, Schwemmers S, Braun S, Auberger P, et al. Gab2 signaling in chronic myeloid leukemia cells confers resistance to multiple Bcr-Abl inhibitors. Leukemia. 2013;27(1):118. [DOI] [PubMed] [Google Scholar]
- 44.Wagle M, Eiring A, Wongchenko M, Lu S, Guan Y, Wang Y, et al. A role for FOXO1 in BCR–ABL1-independent tyrosine kinase inhibitor resistance in chronic myeloid leukemia. Leukemia. 2016;30(7):1493. [DOI] [PMC free article] [PubMed] [Google Scholar]
- 45.Mitchell R, Hopcroft LE, Baquero P, Allan EK, Hewit K, James D, et al. Targeting BCR-ABL-Independent TKI Resistance in Chronic Myeloid Leukemia by mTOR and Autophagy Inhibition. JNCI: Journal of the National Cancer Institute. 2017;110(5):467–78. [DOI] [PMC free article] [PubMed] [Google Scholar]
- 46.Ly C, Arechiga AF, Melo JV, Walsh CM, Ong ST. Bcr-Abl kinase modulates the translation regulators ribosomal protein S6 and 4E-BP1 in chronic myelogenous leukemia cells via the mammalian target of rapamycin. Cancer research. 2003;63(18):5716–22. [PubMed] [Google Scholar]
- 47.Nakamura Y, Fukami K. Regulation and physiological functions of mammalian phospholipase C. The Journal of Biochemistry. 2017;161(4):315–21. [DOI] [PubMed] [Google Scholar]
- 48.Deka SJ, Trivedi V. Potentials of PKC in cancer progression and anticancer drug development. Current drug discovery technologies. 2019;16(2):135–47. [DOI] [PubMed] [Google Scholar]
- 49.Holyoake TL, Vetrie D. The chronic myeloid leukemia stem cell: stemming the tide of persistence. Blood. 2017;129(12):1595–606. [DOI] [PubMed] [Google Scholar]
- 50.Shah M, Bhatia R. Preservation of quiescent chronic myelogenous leukemia stem cells by the bone marrow microenvironment Biological Mechanisms of Minimal Residual Disease and Systemic Cancer: Springer; 2018. p. 97–110. [DOI] [PubMed] [Google Scholar]
- 51.Ma L, Shan Y, Bai R, Xue L, Eide CA, Ou J, et al. A therapeutically targetable mechanism of BCR-ABL–independent imatinib resistance in chronic myeloid leukemia. Science translational medicine. 2014;6(252):252ra121–252ra121. [DOI] [PMC free article] [PubMed] [Google Scholar]
- 52.Wilkinson SE, Parker P, Nixon J. Isoenzyme specificity of bisindolylmaleimides, selective inhibitors of protein kinase C. Biochemical Journal. 1993;294(2):335–7. [DOI] [PMC free article] [PubMed] [Google Scholar]
- 53.Gschwendt M, Muller H, Kielbassa K, Zang R, Kittstein W, Rincke G, et al. Rottlerin, a novel protein kinase inhibitor. Biochemical and biophysical research communications. 1994;199(1):93–8. [DOI] [PubMed] [Google Scholar]
Associated Data
This section collects any data citations, data availability statements, or supplementary materials included in this article.


