

Supplemental Digital Content is available in the text.
Keywords: biomarkers, cardiovascular disease, coronavirus, growth differentiation factor 15, risk
Abstract
Background:
Growth differentiation factor 15 (GDF-15) is a strong prognostic marker in sepsis and cardiovascular disease (CVD). The prognostic value of GDF-15 in coronavirus disease 2019 (COVID-19) is unknown.
Methods:
Consecutive, hospitalized patients with laboratory-confirmed infection with severe acute respiratory syndrome coronavirus 2 (SARS-CoV-2) and symptoms of COVID-19 were enrolled in the prospective, observational COVID Mechanisms Study. Biobank samples were collected at baseline, day 3 and day 9. The primary end point was admission to the intensive care unit or death during hospitalization, and the prognostic performance of baseline and serial GDF-15 concentrations were compared with that of established infectious disease and cardiovascular biomarkers.
Results:
Of the 123 patients enrolled, 35 (28%) reached the primary end point; these patients were older, more often had diabetes, and had lower oxygen saturations and higher National Early Warning Scores on baseline. Baseline GDF-15 concentrations were elevated (>95th percentile in age-stratified healthy individuals) in 97 (79%), and higher concentrations were associated with detectable SARS-CoV-2 viremia and hypoxemia (both P<0.001). Patients reaching the primary end point had higher concentrations of GDF-15 (median, 4225 [IQR, 3197–5972] pg/mL versus median, 2187 [IQR, 1344–3620] pg/mL, P<0.001). The area under the receiver operating curve was 0.78 (95% CI, 0.70–0.86). The association between GDF-15 and the primary end point persisted after adjusting for age, sex, race, body mass index, estimated glomerular filtration rate, previous myocardial infarction, heart failure, and atrial fibrillation (P<0.001) and was superior and incremental to interleukin-6, C-reactive protein, procalcitonin, ferritin, D-dimer, cardiac troponin T, and N-terminal pro-B-type natriuretic peptide. Increase in GDF-15 from baseline to day 3 was also greater in patients reaching the primary end point (median, 1208 [IQR, 0–4305] pg/mL versus median, –86 [IQR, –322 to 491] pg/mL, P<0.001).
Conclusions:
GDF-15 is elevated in the majority of patients hospitalized with COVID-19, and higher concentrations are associated with SARS-CoV-2 viremia, hypoxemia, and worse outcome. The prognostic value of GDF-15 was additional and superior to established cardiovascular and inflammatory biomarkers.
Registration:
URL: https://www.clinicaltrials.gov; Unique identifier: NCT04314232.
Clinical Perspective.
What Is New?
Growth differentiation factor 15 (GDF-15) is elevated in patients hospitalized for coronavirus disease 2019 (COVID-19) and higher concentrations are associated with severe acute respiratory syndrome coronavirus 2 (SARS-CoV-2) viremia and hypoxemia.
Higher concentrations of GDF-15, and increasing concentrations during the hospital stay, are associated with poor outcome.
The prognostic importance of GDF-15 is superior to, and independent of, established cardiovascular and inflammatory biomarkers.
What Are the Clinical Implications?
Serial measurement of GDF-15 concentrations may provide valuable prognostic information in patients hospitalized for COVID-19.
GDF-15 may reflect underlying pathophysiology related to COVID-19, such as SARS-CoV-2 viremia and hypoxemia.
GDF-15 measurements may potentially improve resource allocation in hospitals through early discharge of low-risk patients and intensified care to high-risk patients.
Coronavirus disease 2019 (COVID-19) is caused by severe acute respiratory syndrome coronavirus 2 (SARS-CoV-2). The morbidity and mortality associated with the disease is high, and individuals with underlying cardiovascular disease (CVD) are disproportionately affected.1,2 Several studies have also noted higher incidences of cardiac arrhythmias, acute coronary syndromes and heart failure–related events among patients hospitalized with COVID-19, and cardiac injury has been reported to contribute to cause of death in 40% of nonsurvivors.1–5 Also, among survivors a substantial proportion (20% to 30%) of hospitalized patients show evidence of myocardial injury during infection.1,3,4 The mechanisms linking SARS-CoV-2 to cardiac disease are yet unknown, though proposed hypotheses include cytokine storm, arterial hypoxia, hypoperfusion, coagulopathy, adrenergic stimulation, and angiotensin-converting enzyme 2–mediated injury.6,7
Growth differentiation factor 15 (GDF-15) is a member of the transforming growth factor β superfamily and is widely distributed in low concentrations in most organs.8 Physiological GDF-15 concentrations increase with age, while the expression in pathological states is highly regulated through several pathways including inflammation, oxidative stress, and hypoxia.9 Elevated concentrations of circulating GDF-15 have been identified in multiple disease entities (ie, CVD,10 sepsis,11 cancer12 and diabetes13), and circulating GDF-15 seems to be a robust predictor of disease progression. The pathophyslogical correlates and prognostic value of GDF-15 in COVID-19 is unknown.
Retrospective studies published from China early in the pandemic identified high interleukin-6 (IL-6), ferritin, cardiac troponin, and D-dimer to be associated with worse outcome in patients with COVID-19.2–5 We aimed to investigate the associations between GDF-15, established cardiovascular and inflammatory biomarkers and outcome in a prospective study of unselected, consecutive patients hospitalized for COVID-19.
Methods
Patient Population
The Coronavirus Disease 2019 Mechanisms Study (COVID MECH) is a prospective, observational study with a dedicated biobank enrolling consecutive patients hospitalized with COVID-19. All patients ≥18 years of age who were hospitalized with laboratory-confirmed COVID-19 at Akershus University Hospital (Lørenskog, Norway) were invited to participate in the study. Our institution is the academic hospital in Norway with the largest primary hospital catchment area, encompassing ≈560,000 individuals in the metropolitan Oslo area (ie, 11% of the population of the country). COVID-19 was defined by a positive SARS-CoV-2 real-time polymerase chain reaction nasopharyngeal swab and COVID-19 symptoms (ie, cough, fever, dyspnea or flu-like symptoms) as the main reason for admission. The enrolment period was between March 18, 2020, and May 4, 2020, covering the majority of the first wave of the pandemic in Norway.14 The study was registered (ClinicalTrials.gov. Unique identifier: NCT04314232) before inclusion of patients. Study-specific consent forms were signed by all participants, or by the next-of-kin if the patient was unable to consent (ie, on invasive mechanical ventilation). The study was approved by the Regional Ethics Committee of Norway (REK South-East C, reference no. 117589) and by the institutional data protection officer (reference no. 20/02873). Data from the COVID MECH study cannot be publicly shared because of the risk of violating privacy, as regulated by the institutional data protection officer.
Clinical Data Collection
Information on clinical characteristics, medical history, detailed COVID-19 presentation, treatments, complications, and outcomes were extracted from electronic medical records by the investigators. The primary end point in the COVID MECH study was the composite of admission to the intensive care unit (ICU), in-hospital mortality, or both. Participants were classified as ICU patients if they were admitted to the ICU ward at any point during their admission and received intensive care treatment for >24 hours. Thus, patients briefly evaluated in the ICU (<24 hours) were not counted as achieving the primary end point. Complete follow-up of the index hospital admission, including in-hospital mortality, was available in all patients.
History of CVD (ie, previous myocardial infarction, heart failure, or atrial fibrillation), arterial hypertension, and diabetes were defined and recorded in the electronic medical records at the discretion of the treating physicians after interviewing the patients and accessing previous medical history. Obesity was defined as body mass index (BMI) ≥30 kg/m2. Estimated glomerular filtration rate (eGFR) was calculated from creatinine concentrations by the Modification of Diet in Renal Disease formula. Acute kidney injury was defined at discretion of the treating physician or if the patient had an eGFR <60 mL/min/1.73 m2 and no known chronic kidney disease. National Early Warning Scores (NEWS) is a validated tool used for detection and response to clinical deterioration in adult patients. It is calculated from 6 vital signs, with low-risk measurements yielding 0 points, and abnormal values giving up to 3 points per item.15 The range of vital signs assigned 0 points is as follows: respiratory rate 9 to 20 breaths/min, oxygen saturation >92% and no supplemental oxygen, systolic blood pressure 100 to 199 mm Hg, pulse rate 50 to 99 beats per min, temperature 36 to 37.9°C, and level of consciousness alert.
Blood Sampling Procedures and Laboratory Analysis
Blood samples were drawn by venipuncture at 3 prespecified time points: at baseline (in the emergency department or early in the ICU stay for 9 patients admitted directly to the ICU), day 2 to 5 (target day 3) and day 6 to 12 (target day 9). Collection of blood samples was performed by trained nurses at the individual clinical departments. Samples obtained in clinical routine were analyzed immediately at the central laboratory. Biobank samples were temporarily stored a 4°C, centrifuged at 2000 G for 10 minutes and then transferred into aliquots that were frozen and stored at –80°C at Akershus University Hospital.
The following biomarkers were systematically measured by the central laboratory at Akershus University Hospital in blood samples from all patients admitted with COVID-19: hemoglobin, white blood cell count, lymphocyte count, thrombocyte count, D-dimer, C-reactive protein (CRP), sodium, potassium, creatinine, alanine transaminase, bilirubin, lactate dehydrogenase, and lactate.
Serum samples from the biobank that had not previously been thawed were used to measure IL-6, procalcitonin, ferritin, cardiac troponin T (cTnT), N-terminal pro-B-type natriuretic peptide (NT-proBNP), and GDF-15. These biomarkers were analyzed by the electrochemiluminescence immunoassay Elecsys on the Cobas e 801 platform (Roche Diagnostics, Rotkreuz, Switzerland). For GDF-15, the coefficients of variation reported by the manufacturer were 1.3% at 472 pg/mL and 1.1% at 19368 pg/mL. For IL-6 the coefficients of variation reported by the manufacturer were 4.9% at 6.4 pg/mL and 1.4% at 189 pg/mL. For procalcitonin, the reported values by the manufacturer were 6.9% at 0.12 ng/mL and 1.8% at 43.3 ng/mL. For ferritin, the values reported by the manufacturer were 1.5% at 414 ng/mL and 2.8% at 1406 ng/mL. For cTnT, the values reported by the manufacturer were 3.5% at 9.7 ng/L and 2.1% at 19.8 ng/L. For NT-proBNP, the values reported by the manufacturer were 2.5% at 127 ng/L and 1.3% at 1706 ng/L.
We used the 95th percentile concentration of GDF-15 in healthy volunteers (reported from the manufacturer) to define the age-specific upper reference limit: 831 pg/mL for <30 years, 852 pg/mL for 30 to 40 years, 1229 pg/mL for 40 to 50 years, 1466 pg/mL for 50 to 60 years, 1476 pg/mL for 60 to 70 years and 2199 pg/mL for ≥70 years.
For SARS-CoV-2 viremia analyses, total nucleic acids were extracted from 200 µL plasma on the MagNA Pure 96 system (Roche, Penzberg, Germany), with an elution volume of 50 µL. SARS-CoV-2 RNA was detected by real-time polymerase chain reaction on a QuantStudio 7 polymerase chain reaction system (Thermo Fisher Scientific, Waltham, MA), according to the protocol of Corman et al targeting the viral E-gene.16 Patients were classified with viremia if SARS-CoV-2 RNA was detected.
Statistical Analysis
Values are reported as n (%) and median (quartiles 1 through 3) for skewed and mean±SD for normally distributed variables, if not stated otherwise. Categorical and continuous variables were compared using the χ2 test for binary variables, analysis of variance for parametric continuous variables, and the Kruskal-Wallis test for nonparametric continuous variables. All the biomarkers investigated (IL-6, CRP, procalcitonin, ferritin, D-dimer, cTnT, and NT-proBNP) had a non-normal distribution according to the Shapiro-Wilk normality test, and log-transformed values were therefore used in all regression analyses. Clinical factors associated with log-transformed baseline GDF-15 levels were determined using linear regression analysis. Covariates included age, sex, race, CVD, BMI, systolic blood pressure, heart rate, body temperature, respiratory rate, eGFR, and log-transformed IL-6, CRP, procalcitonin, ferritin, D-dimer, cTnT, and NT-proBNP.
Correlations between biomarkers were assessed using Spearman rank correlation. Linear regression models were used to determine the association between SARS-CoV-2 viremia and log-transformed levels of GDF-15 and other biomarkers on baseline. The association between log-transformed baseline biomarker concentrations and the primary end point was examined in unadjusted and 3 adjusted logistic regression models: model 1 was adjusted for age, sex, race, CVD, BMI, and eGFR, which were selected a priori as potential confounder variables on the basis of the existing literature. Model 2 was adjusted for all variables in model 1 in addition to log-transformed values of all the other biomarkers investigated. Model 3 was adjusted for all variables in model 2 in addition to diabetes, hypertension, and NEWS.
The area under the receiver operating curves was calculated to assess the performance of each biomarker to discriminate between patients reaching and patients not-reaching the end point. To assess the incremental value of GDF-15 added to established biomarkers (IL-6, CRP, procalcitonin, ferritin, D-dimer, cTnT, and NT-proBNP), we used continuous net reclassification index with log transformed biomarker concentrations. The statistically optimal cutoff of GDF-15 for discrimination of the primary end point was determined by the Youden index. Changes in biomarkers from baseline to day 3 were assessed by the Wilcoxon matched-pairs signed-rank test. Association between changes in biomarkers from baseline to day 3 and the primary end point was assessed using the same models as for baseline values, described earlier, with additional adjustment for baseline values to account for potential regression to the mean. All delta values used in regression models were calculated from log-transformed baseline and day 3 concentrations.
All statistical analyses were performed using Stata Software (version 16, Stata Corp., College Station, TX). A 2-sided P value of <0.05 was considered statistically significant.
Results
Baseline Characteristics
In total, 123 of 136 consecutive patients hospitalized with COVID-19 in the study period had blood samples collected in the COVID MECH biobank (Figure I in the Data Supplement). The mean age was 59.6±15.2 (range, 25–87) years, 71 (58%) were men and 68 (55%) were white (the non-White group comprised 78% Asian, 19% Black, and 3% Latin American). Overall, 74 (60%) had 1 or more comorbidity, including 39 (32%) with arterial hypertension, 32 (27%) with obesity, 18 (15%) with CVD, 21 (17%) with diabetes, 9 (7%) with chronic kidney disease, and 6 (5%) with chronic obstructive pulmonary disease. Time from symptom start to hospitalization was 9.3±4.6 days; 100 (81%) had fever, 98 (80%) had cough, and 86 (70%) had dyspnea. On admission, mean body temperature was 38.1±0.9°C, respiratory rate 27±9 per min, systolic blood pressure 132±19 mm Hg, oxygen saturation 93±6%, and NEWS 5±3 points.
Outcome During Hospital Stay
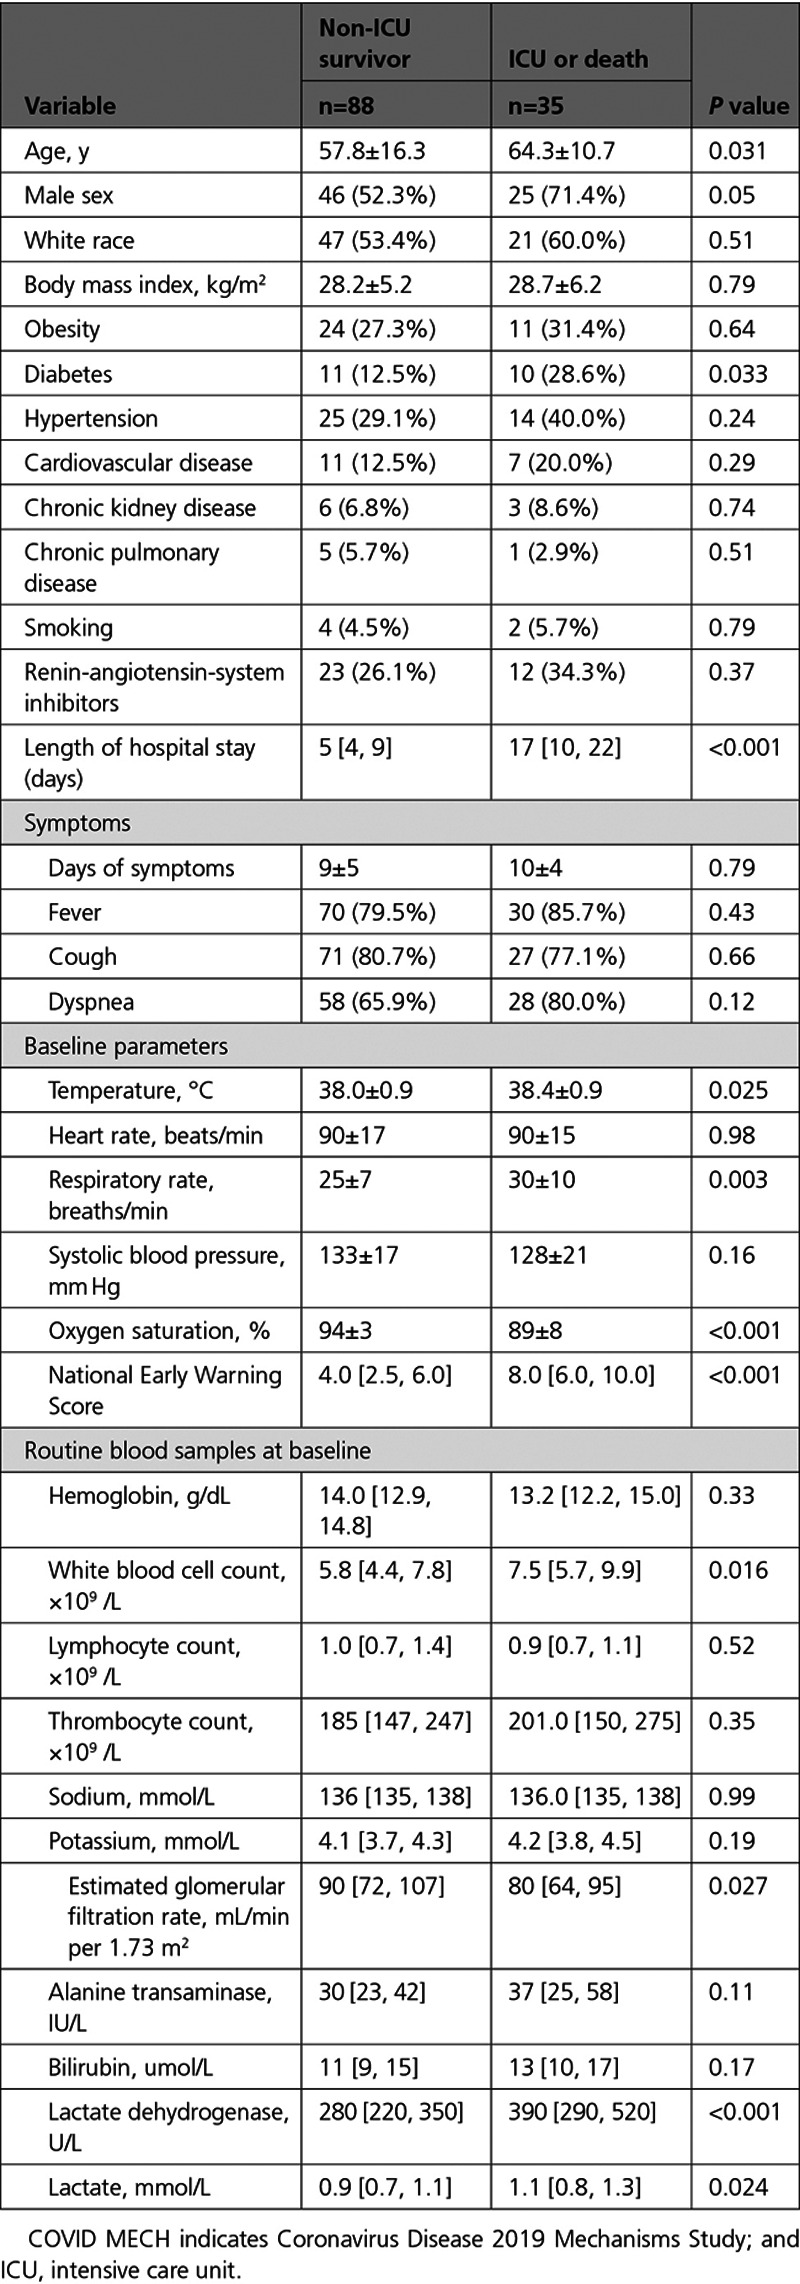
During hospitalization, 31 patients were admitted to the ICU. Among these, 27 patients were treated with invasive mechanical ventilation and 4 patients died. The remaining 92 patients were treated in medical wards, and among these 4 patients with treatment restrictions (ie, do not resuscitate orders) died. Patients who were admitted to the ICU or died (primary study end point, n=35) were older, more often had diabetes mellitus, and presented with higher baseline temperature, respiratory rate, NEWS score and lower oxygen saturations compared with non-ICU survivors (n=88; Table 1). Patients who were admitted to the ICU or died also had higher white blood cell count, lactate dehydrogenase and lactate on admission. The presence of acute kidney injury on admission (n=20) was comparable in patients reaching the primary end point and not (27% versus 14%, P=0.10), but eGFR was lower in of patients reaching the primary end point (median, 80 [IQR, 64–95] versus median, 90 [IQR, 72–107] ml/min/1.73 m,2 P=0.027). There was no difference in sex, race, BMI, hypertension, CVD, chronic obstructive pulmonary disease, smoking, duration of symptoms, symptoms, or use of renin-angiotensin-system inhibitors with regard to the primary end point.
Table 1.
Baseline Characteristics of COVID MECH Study Participants, by Primary Study End Point (N=123)
GDF-15 and Clinical Characteristics and Oxygen Saturation
The median (IQR) baseline concentration of GDF-15 was 2798 (1667–4528) pg/mL, and 97 (79%) had GDF-15 concentrations above the age-specific upper reference limit. Patients with higher baseline GDF-15 concentrations were older; were more frequently men; more often had diabetes, hypertension, CVD, and chronic kidney disease; had higher levels of IL-6, CRP, procalcitonin, ferritin, D-dimer, cTnT, NT-proBNP, lactate dehydrogenase, and white blood cell count; and had lower levels of hemoglobin, lymphocyte count, and eGFR (Table I in the Data Supplement).
Except for oxygen saturation, there were no differences in duration of symptoms or clinical variables by baseline GDF-15 concentrations. There was a significant association between lower oxygen saturation and higher GDF-15 concentrations (P<0.001, Figure II in the Data Supplement), and this association persisted also after adjusting for demographics, BMI, CVD, eGFR and oxygen therapy (P=0.004). Concentrations of GDF-15 were higher in patients with hypoxemia (SpO2≤90%; n=29 [24%]) versus without hypoxemia: median (IQR) 4049 pg/mL versus 2331 (1471–4166) pg/mL, P<0.001 (P=0.003 after adjusting for oxygen therapy at baseline), with a corresponding C-statistics value of 0.72 (95% CI, 0.63–0.81). Thirty-seven (30%) of patients did not report dyspnea, and among these patients GDF-15 was higher in patients with hypoxemia (n=9) compared with those without hypoxemia (n=28): median (IQR) 3781 (2547–7562) pg/mL versus 1902 (1165–3438) pg/mL, P=0.007 (P=0.002 after adjusting for oxygen therapy at baseline). In hypoxemic patients, GDF-15 concentrations were elevated irrespective of self-reported dyspnea: median (IQR) 4058 (IQR, 3315–4649) pg/mL in dyspneic versus 3781 (IQR, 2547–7562) pg/mL in nondyspneic patients, P=0.92.
GDF-15 and Other Cardiovascular and Inflammatory Biomarkers
GDF-15 correlated with all the other inflammatory and cardiovascular biomarkers; with correlation coefficients ranging from 0.45 (ferritin) to 0.64 (procalcitonin; Table II in the Data Supplement). In multivariable regression models with biomarkers and baseline characteristics as independent variables, older age, non-White race, lower eGFR and higher CRP, procalcitonin, and D-dimer concentrations were associated with higher GDF-15 concentrations (Table III in the Data Supplement).
GDF-15 and SARS-CoV-2 Viremia
SARS-CoV-2 viremia was present in 48 (39%) of patients at baseline. Viremia was associated with higher concentrations of GDF-15 (P<0.001 for GDF-15 as a continuous variable and by quartiles; Figure 1). Viremia ranged from 13% in the lowest GDF-15 quartile to 60% in the highest GDF-15 quartile. Viremia remained associated with GDF-15, also after adjusting for age, sex, race, BMI, CVD, eGFR: β 0.59 (95% CI, 0.24–0.94) per doubling of GDF-15, P=0.001. Only GDF-15 was associated with viremia at baseline in regression models including all inflammatory and cardiovascular biomarkers investigated (Table IV in the Data Supplement).
Figure 1.
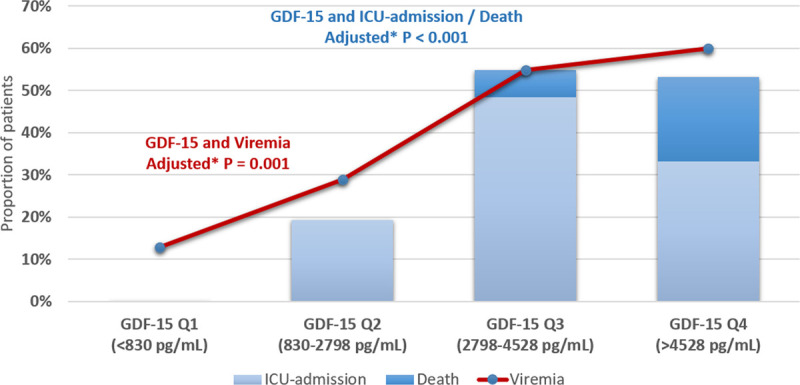
GDF-15 concentrations, ICU admission or death, and SARS-CoV-2 viremia. Proportion of patients hospitalized for COVID-19 with SARS-CoV-2 viremia at baseline and proportion of patients reaching the primary end point by quartiles of GDF-15 concentrations. P values are for trend in viremia across quartiles of GDF-15. *Adjusted for age, sex, race, body mass index, cardiovascular disease, and eGFR. COVID-19 indicates coronavirus disease 2019; eGFR, estimated glomerular filtration rate; GDF-15, growth differentiation factor 15; ICU, intensive care unit; and SARS-CoV-2, severe acute respiratory syndrome coronavirus 2.
GDF-15 and Other Cardiovascular and Inflammatory Biomarkers at Baseline in Association With Outcome
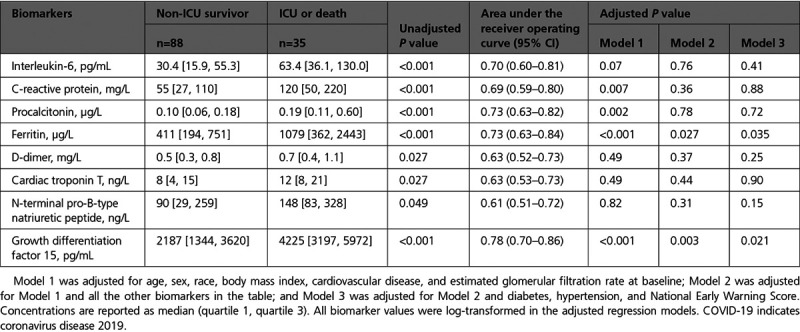
Higher baseline concentrations of IL-6, CRP, procalcitonin, ferritin, NT-proBNP, and GDF-15 were associated with the primary end point (Table 2). IL-6, CRP, procalcitonin, ferritin, and GDF-15 remained associated with the primary end point after adjusting for baseline characteristics (Model 1; age, sex, race, BMI, CVD, and eGFR). After including all the other biomarkers in the regression model (Model 2), only ferritin (P=0.027) and GDF-15 (P=0.003) remained associated with the primary end point. The associations for ferritin (P=0.035) and GDF-15 (P=0.021) persisted after additional adjustment for NEWS, diabetes, and hypertension (Model 3). The area under the receiver operating curves for GDF-15 to discriminate between patients with and without the primary end point was 0.78 (95% CI, 0.70–0.86; Table 2). Distributions of biomarker concentrations by the primary end point are presented in Figure III in the Data Supplement, showing limited overlap for GDF-15. GDF-15 reclassified patients to a more correct risk stratum, when compared with a basic model including established inflammatory and cardiovascular biomarkers (ie, IL-6, CRP, procalcitonin, ferritin, D-dimer, cTnT, and NT-proBNP): net reclassification index, 0.85 (SE, 0.20), P<0.001. The optimal cutoff for GDF-15 to discriminate for the primary end point was 2252 pg/mL according to the Youden index (Youden index, 0.52; SE, 0.05) with sensitivity of 1.00, specificity of 0.52, and area under the receiver operating curves of 0.76.
Table 2.
Concentrations of Baseline Cardiovascular and Inflammatory Biomarkers and the Association With the Primary End Point Among Patients Hospitalized With COVID-19 (N=123)
Nonsurvivors had higher IL-6, D-dimer, cTnT, NT-proBNP, and GDF-15 concentrations in unadjusted models (Table V in the Data Supplement). After adjusting for age, sex, race, BMI, CVD, and eGFR, only GDF-15 remained associated with in-hospital mortality. Median (IQR) GDF-15 concentration was 7789 (4716–9317) pg/mL in nonsurvivors and 2583 (1512–4225) pg/mL in survivors. The area under the receiver operating curves for GDF-15 as a discriminator for in-hospital mortality was 0.87 (95% CI, 0.79–0.94; Table V in the Data Supplement). Distributions of biomarker concentrations of survivors versus nonsurvivors are presented in Figure IV in the Data Supplement. All 8 nonsurvivors and 25 of 31 (81%) patients admitted to the ICU had GDF-15 concentrations above the median.
Changes in GDF-15 and Other Cardiovascular and Inflammatory Biomarkers During Hospitalization in Association With Outcome
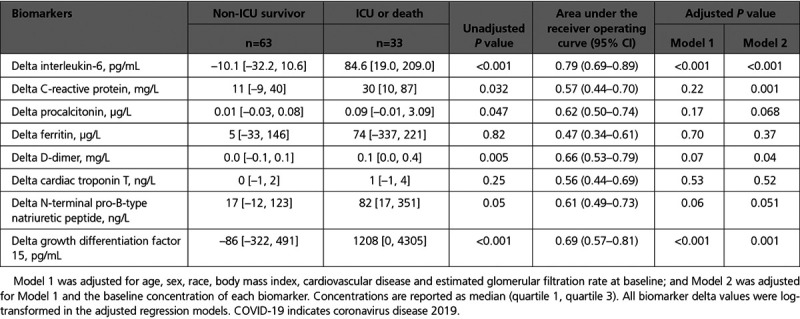
Serial samples from baseline and day 3 were available in 96 (78%) of patients, and there was a significant increase in CRP, procalcitonin, NT-proBNP, GDF-15, and D-dimer levels from baseline to day 3 in the total population. The primary outcome occurred in 33 (34%) of these patients. GDF-15 increased by median 1208 pg/mL (IQR, 0 to 4305] in patients reaching the primary end point and decreased by median 85 [IQR, –322 to 491] pg/mL in non-ICU survivors. In unadjusted models, greater increases in IL-6, CRP, procalcitonin, D-dimer, and GDF-15 from baseline to day 3 were associated with the primary end point (Table 3). IL-6 and GDF-15 were still associated with the primary end point after adjusting for age, sex, race, BMI, CVD, and eGFR at baseline. These associations remained significant when adjusting for the baseline concentration of each biomarker. The area under the receiver operating curves for delta value of GDF-15 was 0.69 (95% CI, 0.57–0.81; Table 3). Distributions of delta concentrations by the primary end point for delta GDF-15 and delta IL-6 are presented in Figure V in the Data Supplement.
Table 3.
Changes in Concentrations From Baseline to Day 3 in Cardiovascular and Inflammatory Biomarkers, by Primary Study End Point Among Patients Hospitalized With COVID-19 (N=96)
Data on changes in biomarker concentrations from baseline to day 9 were available in 49 (40%) of the patients. Twenty-three (47%) of these were ICU patients, and 6 (12%) died (3 ICU patients and 3 non-ICU patients; ie, the primary end point occurred in 26 [53%] of these participants). GDF-15 continued to increase to day 9: median, 8031 (IQR, 3589–16003) pg/mL in patients reaching the primary end point, while remaining stable in non-ICU survivors (median, 2238 [IQR, 1540–3118] pg/mL; Figure 2).
Figure 2.
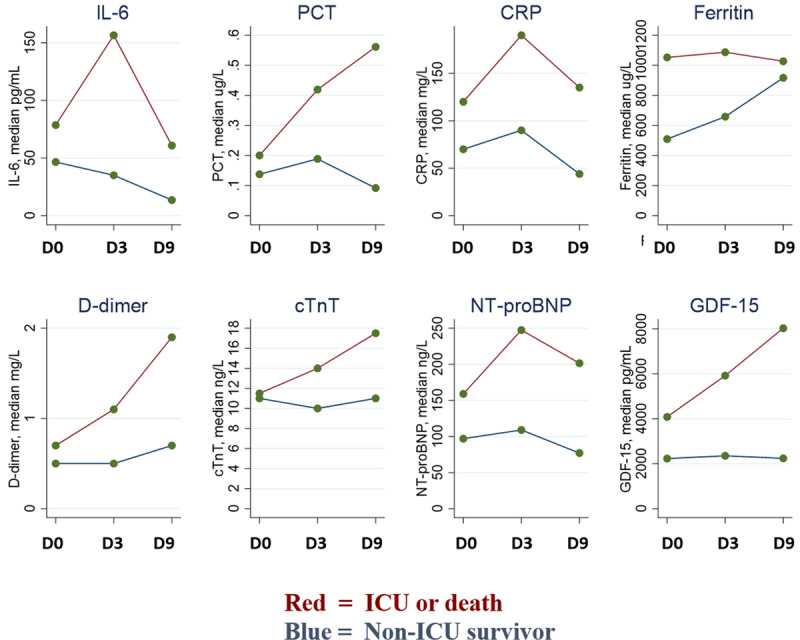
Changes in cardiovascular and inflammatory biomarkers during hospitalization for COVID-19. Changes in IL-6, PCT, CRP, ferritin, D-dimer, cTnT, NT-proBNP, and GDF-15 concentrations among patients hospitalized for COVID-19. Data shown are for 49 patients with samples available at baseline, day 3, and day 9 (ie, those hospitalized for ≥9 day). Values are median concentrations; groups are stratified by the composite primary end point: ICU admission or death. COVID-19 indicates coronavirus disease 2019; CRP, C-reactive protein; cTnT, cardiac troponin T; NT-proBNP, N-terminal pro-B-type natriuretic peptide; GDF-15, growth differentiaion factor 15; ICU, intensive care unit; IL-6, interleukin-6; and PCT, procalcitonin.
Discussion
In this prospective study of consecutive patients hospitalized with COVID-19, we found elevated concentrations of GDF-15 in 4 out of 5 patients. Hypoxemia and SARS-CoV-2 viremia were associated with higher concentrations of GDF-15. Moreover, concentrations of GDF-15 were associated with death or the need for intensive care during the hospitalization. The association between GDF-15 and outcomes was stronger than, and independent of, that of established cardiovascular and inflammatory biomarkers. Increases in GDF-15 concentrations from baseline to day 3 were also associated with worse outcome.
To our knowledge, this is the first study to investigate the determinants and prognostic value of GDF-15 in patients with COVID-19. We found GDF-15 concentrations not only to be independently associated with risk but also to identify key pathophysiological features of the disease, including hypoxemia and provide prognostic information superior to that provided by the established risk markers in COVID-19. Biomarkers of importance in COVID-19 were first identified in Chinese case series of patients hospitalized with COVID-19 in the early phase of the pandemic.2–4 These studies reported clinical characteristics and laboratory findings from selected patients (ie, results were from clinically indicated blood samples in a convenience sample). Numerous biomarkers were assessed in association with outcome, and a handful of inflammatory and cardiovascular biomarkers were identified as particularly strong prognostic markers, including cardiac troponins, ferritin, and D-dimer. Our prospective biobank study of unselected, consecutive patients hospitalized with COVID-19 provides important insights to these associations, given that our design alleviates the risk of selection bias. Confirming data from previous case series, we found that IL-6, CRP, procalcitonin, ferritin, D-dimer, cTnT, and NT-proBNP were associated with worse outcome. However, after adjusting for demographics, BMI, CVD, and eGFR, these associations were attenuated for IL-6, D-dimer, cTnT, and NT-proBNP. Moreover, in models including GDF-15 as well as these biomarkers, only GDF-15 and ferritin remained associated with the composite end point of ICU admission or death. This association also persisted when adjusting for NEWS, an aggregate scoring system designed to determine the degree of illness of a patient on the basis of physiological measurements. In-hospital mortality was infrequent in our study, but all nonsurvivors demonstrated very high levels of GDF-15, with nonoverlapping interquartile range with survivors (4716–9317 and 1512–4225, respectively) and an area under the receiver operating curves of 0.87. On the basis of these findings, GDF-15, which is easily available by commercial assays on large automated analytic platforms, may represent a clinically useful risk stratification tool that provides important pathophysiological insights in patients hospitalized with COVID-19. Thus, in real-life situations with hospitalized COVID-19 patients, serial measurements of GDF-15 can be an aid in patient triage and follow disease progression more efficiently. Future studies should assess whether GDF-15 concentrations may potentially improve resource allocation in hospitals through early discharge of low-risk patients and intensified care to high-risk patients.
There were significant changes in inflammatory and cardiovascular biomarkers during hospitalization for COVID-19, with distinct trajectories between patients who were admitted to the ICU or who died and those who did not. From baseline to day 3 there were greater increases in IL-6, D-dimer and GDF-15 concentrations in patients with poor outcome, also after adjusting for possible confounders. GDF-15 increased from baseline to day 3 by median 1208 pg/mL in patients who were admitted to the ICU or died, while there was a median reduction of 86 pg/mL in non–ICU-admitted survivors.
GDF-15 is known to be a robust predictor of poor outcome in critically ill patients.11 In animal models, GDF-15 deficiency is known to augment the inflammatory response and to exacerbate renal and cardiac injury induced by lipopolysaccharide, while overexpression of GDF-15 protects from these endotoxin-induced mechanisms.17 GDF-15 expression is induced by lung injury and is suggested to be a hallmark for tissue injury in many organs.18 In our study, we found SARS-CoV-2 viremia to be associated with higher levels of GDF-15. In models including all the cardiovascular and inflammatory biomarkers, only GDF-15 remained associated with viremia. This novel finding may suggest a direct link between SARS-CoV-2 cytopathic effects and the expression of GDF-15 in multiple tissues. GDF-15 correlated moderately (rho, 0.45–0.64) with all the investigated inflammatory and cardiovascular biomarkers but provided prognostic information beyond these. In agreement with previous findings, we found higher GDF-15 concentrations in non-White patients.19 Whether this can partially explain the increased risk among blacks with COVID-1920 should be investigated in larger studies.
We also found an independent inverse association between GDF-15 and oxygen saturation, and GDF-15 was elevated in hypoxemic patients irrespective of dyspnea. This suggest that GDF-15 can potentially identify silent hypoxemic patients, a condition characteristic of COVID-19 that has been associated with considerably increased risk. GDF-15 is predominantly located in endothelial cells and upregulated by hypoxia and laminar shear stress in pulmonary arterial hypertension.21 GDF-15 is a known marker of mitochondrial dysfunction22 and being a cytokine it is closely linked to inflammation. Thus GDF-15 may integrate information on cellular oxygenation, inflammatory response, and cardiovascular dysfunction, all key mechanisms in COVID-19 pathophysiology.10,23
Limitations
The sample size of patients hospitalized with COVID-19 in our study is modest compared with published cohorts from clinical case series and hospital registries. We believe the findings from our prospective study still provides important knowledge relating to pathophysiology and risk stratification in COVID-19. Our findings should be validated in larger and more diverse populations and settings before being implemented in clinical practice. Specifically, there is a need to assess the association between GDF-15 and outcome in the prehospital setting (eg, by the World Health Organization Clinical Progression Scale) and assess the association with organ damage after long-term follow-up. Patients discharged directly from the emergency department were not included, but in Norway the screening for hospitalization is performed typically by primary care general practitioners, and the percentage discharged directly from the emergency department is comparatively low. However, our findings cannot be extrapolated to COVID-19 patients who do not require hospitalization, and the prognostic value of GDF-15 in the out-of-hospital setting should be evaluated in future studies. Mortality among patients hospitalized with COVID-19 was low in our hospital, and this may limit the generalizability to centers with higher mortality rates. However, clinical characteristics, biomarker concentrations, and proportion of patients admitted to the ICU were comparable to other COVID-19 cohorts. The multivariable regression models may be overfitted given the limited number of events compared with the number of covariates. However, we believe the consistent results with the unadjusted analysis strengthen these findings. The changes in biomarkers must be interpreted with caution given obvious caveats relating to missing follow-up samples, particularly day 9 samples; these were primarily because of patients being discharged from the hospital.
Conclusions
GDF-15 is elevated in ≈80% of patients hospitalized with COVID-19, and higher concentrations are associated with SARS-CoV-2 viremia, hypoxemia, and worse clinical outcome. Viremia and hypoxemia are associated with higher concentrations of GDF-15. Moreover, GDF-15 concentrations are more closely associated with outcomes than known risk markers in COVID-19, including cTnT, NT-proBNP, CRP, and D-dimer. Greater increases in GDF-15 during hospitalization are also independently associated with worse outcome.
Acknowledgments
The authors are grateful for the invaluable contributions by study biochemists Subaitha Navaruban and Ahmed Meklif and study nurses Jannicke Dokken and Amyla Abueg. The authors also thank Haldor Husby and the Unit of Data Analysis at Akershus University Hospital, Lørenskog, Norway, for help with clinical data acquisition from the data warehouse at Akershus University Hospital.
Sources of Funding
Dr Myhre is supported by grants from the South-Eastern Norway Regional Health Authority. The COVID MECH Study received assays for measuring interleukin-6, procalcitonin, ferritin, cardiac troponin T, N-terminal pro-B-type natriuretic peptide, and growth differentiation factor 15 free of charge from Roche Diagnostics.
Disclosures
Dr Myhre has served on advisory boards for Novartis and Novo Nordisk and has received consulting honoraria from Novartis, AmGen, and Novo Nordisk. Dr Røsjø has received personal fees from Novartis and Thermo Fischer BRAHMS, CardiNor, and SpinChip Diagnostics. Dr Omland has served on advisory boards for Abbott Diagnostics, Roche Diagnostics and Bayer and has received research support from Abbott Diagnostics, Novartis, Roche Diagnostics, Singulex, and SomaLogic through Akershus University Hospital and speaker’s or consulting honoraria from Roche Diagnostics, Siemens Healthineers, and CardiNor. Dr Omland is also listed as an inventor on a patent application titled, “GDF-15 for Predicting the Disease Severity of a Patient With COVID-19.” The other authors report no conflicts.
Supplemental Materials
Data Supplement Figures I–V
Data Supplement Tables I–V
Supplementary Material
Footnotes
Sources of Funding, see page 2137
This manuscript was sent to Allan Jaffe, MD, Guest Editor, for review by expert referees, editorial decision, and final disposition.
The Data Supplement is available with this article at https://www.ahajournals.org/doi/suppl/10.1161/CIRCULATIONAHA.120.050360.
Contributor Information
Peder L. Myhre, Email: p.l.myhre@medisin.uio.no.
Christian Prebensen, Email: christian.prebensen@gmail.com.
Heidi Strand, Email: Heidi.Strand@ahus.no.
Ragnhild Røysland, Email: ragnhiro@medisin.uio.no.
Christine M. Jonassen, Email: chrjon@so-hf.no.
Anbjørg Rangberg, Email: Anbjorg.Rangberg@so-hf.no.
Vibecke Sørensen, Email: Vibecke.Sorensen@ahus.no.
Signe Søvik, Email: signe.sovik@medisin.uio.no.
Helge Røsjø, Email: helge.rosjo@medisin.uio.no.
My Svensson, Email: m.h.s.svensson@medisin.uio.no.
Jan Erik Berdal, Email: jan-erik.berdal@hotmail.com.
References
- 1.Guo T, Fan Y, Chen M, Wu X, Zhang L, He T, Wang H, Wan J, Wang X, Lu Z. Cardiovascular implications of fatal outcomes of patients with coronavirus disease 2019 (COVID-19). JAMA Cardiol. 2020;5:811–818. doi: 10.1001/jamacardio.2020.1017 [DOI] [PMC free article] [PubMed] [Google Scholar]
- 2.Guan WJ, Ni ZY, Hu Y, Liang WH, Ou CQ, He JX, Liu L, Shan H, Lei CL, Hui DSC, et al. ; China Medical Treatment Expert Group for Covid-19. Clinical characteristics of coronavirus disease 2019 in China. N Engl J Med. 2020;382:1708–1720. doi: 10.1056/NEJMoa2002032 [DOI] [PMC free article] [PubMed] [Google Scholar]
- 3.Nie SF, Yu M, Xie T, Yang F, Wang HB, Wang ZH, Li M, Gao XL, Lv BJ, Wang SJ, et al. Cardiac troponin I is an independent predictor for mortality in hospitalized patients with COVID-19. Circulation. 2020;142:608–610. doi: 10.1161/CIRCULATIONAHA.120.048789 [DOI] [PMC free article] [PubMed] [Google Scholar]
- 4.Shi S, Qin M, Shen B, Cai Y, Liu T, Yang F, Gong W, Liu X, Liang J, Zhao Q, et al. Association of cardiac injury with mortality in hospitalized patients with COVID-19 in Wuhan, China. JAMA Cardiol. 2020;5:802–810. doi: 10.1001/jamacardio.2020.0950 [DOI] [PMC free article] [PubMed] [Google Scholar]
- 5.Fox SE, Li G, Akmatbekov A, Harbert JL, Lameira FS, Brown JQ, Vander Heide RS. Unexpected features of cardiac pathology in COVID-19 infection. Circulation. 2020;142:1123–1125. doi: 10.1161/CIRCULATIONAHA.120.049465 [DOI] [PubMed] [Google Scholar]
- 6.Chapman AR, Bularga A, Mills NL. High-sensitivity cardiac troponin can be an ally in the fight against COVID-19. Circulation. 2020;141:1733–1735. doi: 10.1161/CIRCULATIONAHA.120.047008 [DOI] [PubMed] [Google Scholar]
- 7.Varga Z, Flammer AJ, Steiger P, Haberecker M, Andermatt R, Zinkernagel AS, Mehra MR, Schuepbach RA, Ruschitzka F, Moch H. Endothelial cell infection and endotheliitis in COVID-19. Lancet. 2020;395:1417–1418. doi: 10.1016/S0140-6736(20)30937-5 [DOI] [PMC free article] [PubMed] [Google Scholar]
- 8.Unsicker K, Spittau B, Krieglstein K. The multiple facets of the TGF-β family cytokine growth/differentiation factor-15/macrophage inhibitory cytokine-1. Cytokine Growth Factor Rev. 2013;24:373–384. doi: 10.1016/j.cytogfr.2013.05.003 [DOI] [PubMed] [Google Scholar]
- 9.Eggers KM, Kempf T, Wallentin L, Wollert KC, Lind L. Change in growth differentiation factor 15 concentrations over time independently predicts mortality in community-dwelling elderly individuals. Clin Chem. 2013;59:1091–1098. doi: 10.1373/clinchem.2012.201210 [DOI] [PubMed] [Google Scholar]
- 10.Wollert KC, Kempf T, Wallentin L. Growth differentiation factor 15 as a biomarker in cardiovascular disease. Clin Chem. 2017;63:140–151. doi: 10.1373/clinchem.2016.255174 [DOI] [PubMed] [Google Scholar]
- 11.Buendgens L, Yagmur E, Bruensing J, Herbers U, Baeck C, Trautwein C, Koch A, Tacke F. Growth differentiation factor-15 is a predictor of mortality in critically ill patients with sepsis. Dis Markers. 2017;2017:5271203.doi: 10.1155/2017/5271203 [DOI] [PMC free article] [PubMed] [Google Scholar]
- 12.Pavo N, Wurm R, Neuhold S, Adlbrecht C, Vila G, Strunk G, Clodi M, Resl M, Brath H, Prager R, et al. GDF-15 is associated with cancer incidence in patients with type 2 diabetes. Clin Chem. 2016;62:1612–1620. doi: 10.1373/clinchem.2016.257212 [DOI] [PubMed] [Google Scholar]
- 13.Bao X, Borné Y, Muhammad IF, Nilsson J, Lind L, Melander O, Niu K, Orho-Melander M, Engström G. Growth differentiation factor 15 is positively associated with incidence of diabetes mellitus: the Malmö diet and cancer-cardiovascular cohort. Diabetologia. 2019;62:78–86. doi: 10.1007/s00125-018-4751-7 [DOI] [PMC free article] [PubMed] [Google Scholar]
- 14.Norwegian Institute of Public Health. Daily report and statistics about coronavirus and COVID-19. https://www.fhi.no/en/id/infectious-diseases/coronavirus/daily-reports/daily-reports-COVID19/. 2020
- 15.Royal College of Physicians. National Early Warning Score (NEWS) 2: Standardising the assessment of acute-illness severity in the NHS. https://www.rcplondon.ac.uk/projects/outputs/national-early-warning-score-news-2.2017 2017
- 16.Corman VM, Landt O, Kaiser M, Molenkamp R, Meijer A, Chu DK, Bleicker T, Brünink S, Schneider J, Schmidt ML, et al. Detection of 2019 novel coronavirus (2019-nCoV) by real-time RT-PCR. Eurosurveillance. 2020;25:2000045. [DOI] [PMC free article] [PubMed] [Google Scholar]
- 17.Abulizi P, Loganathan N, Zhao D, Mele T, Zhang Y, Zwiep T, Liu K, Zheng X. Growth differentiation factor-15 deficiency augments inflammatory response and exacerbates septic heart and renal injury induced by lipopolysaccharide. Sci Rep. 2017;7:1037.doi: 10.1038/s41598-017-00902-5 [DOI] [PMC free article] [PubMed] [Google Scholar]
- 18.Zimmers TA, Jin X, Hsiao EC, McGrath SA, Esquela AF, Koniaris LG. Growth differentiation factor-15/macrophage inhibitory cytokine-1 induction after kidney and lung injury. Shock. 2005;23:543–548 [PubMed] [Google Scholar]
- 19.Rohatgi A, Patel P, Das SR, Ayers CR, Khera A, Martinez-Rumayor A, Berry JD, McGuire DK, de Lemos JA. Association of growth differentiation factor-15 with coronary atherosclerosis and mortality in a young, multiethnic population: observations from the Dallas Heart Study. Clin Chem. 2012;58:172–182. doi: 10.1373/clinchem.2011.171926 [DOI] [PMC free article] [PubMed] [Google Scholar]
- 20.Price-Haywood EG, Burton J, Fort D, Seoane L. Hospitalization and mortality among Black patients and White patients with COVID-19. N Engl J Med. 2020;382:2534–2543. doi: 10.1056/NEJMsa2011686 [DOI] [PMC free article] [PubMed] [Google Scholar]
- 21.Nickel N, Jonigk D, Kempf T, Bockmeyer CL, Maegel L, Rische J, Laenger F, Lehmann U, Sauer C, Greer M, et al. GDF-15 is abundantly expressed in plexiform lesions in patients with pulmonary arterial hypertension and affects proliferation and apoptosis of pulmonary endothelial cells. Respir Res. 2011;12:62.doi: 10.1186/1465-9921-12-62 [DOI] [PMC free article] [PubMed] [Google Scholar]
- 22.Montero R, Yubero D, Villarroya J, Henares D, Jou C, Rodríguez MA, Ramos F, Nascimento A, Ortez CI, Campistol J, et al. GDF-15 is elevated in children with mitochondrial diseases and is induced by mitochondrial dysfunction. PLoS One. 2016;11:e0148709.doi: 10.1371/journal.pone.0148709 [DOI] [PMC free article] [PubMed] [Google Scholar]
- 23.Dominguez-Rodriguez A, Abreu-Gonzalez P, Avanzas P. Relation of growth-differentiation factor 15 to left ventricular remodeling in ST-segment elevation myocardial infarction. Am J Cardiol. 2011;108:955–958. doi: 10.1016/j.amjcard.2011.05.028 [DOI] [PubMed] [Google Scholar]
Associated Data
This section collects any data citations, data availability statements, or supplementary materials included in this article.