Summary
Galactolipids monogalactosyl diacylglycerol (MGDG) and digalactosyl diacylglycerol (DGDG) constitute c. 50% and c. 30% of chloroplast membrane lipids, respectively. They are important for photosynthesis and stress tolerance. Mutations in DGD1, the major DGDG‐synthesizing enzyme, severely reduce DGDG content and induce jasmonic acid (JA) overproduction, resulting in stunted growth. However, how DGDG reduction leads to JA overproduction is unknown.
We introduced an inducible microRNA (ami‐MGD1) into an Arabidopsis dgd1 mutant to reduce MGDG synthesis, thereby further diminishing galactolipid content, but partially restoring the MGDG : DGDG ratio. Galactolipid and Chl contents, expression of JA‐biosynthesis and JA‐responsive genes, photosystem II (PSII) maximum quantum efficiency, and chloroplast shape were investigated.
Expression of JA‐biosynthesis and JA‐responsive genes were reduced in amiR‐MGD1‐transformed dgd1 plants. Stunted growth caused by JA overproduction was also partially rescued, but Chl reduction and PSII impairment remained similar to the original dgd1 mutant. Altered chloroplast shape, which is another defect observed in dgd1 but is not caused by JA overproduction, was also partially rescued.
Our results reveal that an increased MGDG : DGDG ratio is the primary cause of JA overproduction. The ratio is also important for determining chloroplast shapes, whereas reduced Chl and photosynthesis are most likely a direct consequence of insufficient DGDG.
Keywords: chloroplast, dgd1, digalactosyl diacylglycerol (DGDG), galactolipid, jasmonic acid (JA), membranes, monogalactosyl diacylglycerol (MGDG)
Introduction
Monogalactosyl diacylglycerol (MGDG) and digalactosyl diacylglycerol (DGDG) together constitute c. 80% of membrane lipids in chloroplasts (Block et al., 1983). Under normal conditions, MGDG synthase 1 (MGD1) is the major enzyme for MGDG synthesis (Jarvis et al., 2000; Kobayashi et al., 2007). MGD1 transfers a galactose from UDP‐galactose to the sn‐3 position of diacylglycerol to produce MGDG. DGDG synthase 1 (DGD1) further transfers a galactose from UDP‐galactose to MGDG to produce DGDG (Dörmann et al., 1995). The high abundance of galactolipids in chloroplasts and cyanobacteria, and their absence from most nonphotosynthetic organisms suggest that galactolipids have specific functions in photosynthesis (Dörmann & Benning, 2002). Indeed, crystallographic analyses have shown that MGDG is present in photosystems I and II (PSI, PSII), as well as the Cyt b 6 f complex, and that DGDG is present in PSII (Jordan et al., 2001; Stroebel et al., 2003; Loll et al., 2005, 2007; Guskov et al., 2009; Umena et al., 2011). MGD1 knockout mutation (mgd1‐2) causes an albino phenotype, demonstrating that MGDG synthesis is essential for chloroplast development. The mgd1‐2 seedlings are almost devoid of galactolipids, resulting in disrupted chloroplast membranes and complete impairment of photosynthesis (Kobayashi et al., 2007). Knockout mutations in the DGD1 gene result in a > 90% reduction of DGDG content (Dörmann et al., 1995; Lin et al., 2016), indicating that DGD1 encodes the major DGDG synthase under normal conditions. The dgd1 mutant plants exhibit severe dwarf phenotypes, reduced PSII quantum yield and Chl, and altered chloroplast morphology. Compared with the wild‐type, dgd1 mutants present rounded chloroplasts with large thylakoid‐free stromal areas when examined by electron microscopy (Dörmann et al., 1995; Lin et al., 2016).
Jasmonic acid (JA) is a lipid‐derived phytohormone that regulates plant growth, development, secondary metabolism, defense responses and tolerance to abiotic stresses, such as wounding, salt, drought and UV light (Wasternack & Song, 2017). It is generally believed that JA biosynthesis is initiated upon release of fatty acids from the galactolipids of chloroplast membranes. These 18:3 and 16:3 fatty acids are metabolized sequentially by lipoxygenases (LOXs), allene oxide synthase (AOS), and allene oxide cyclase (AOC) to produce 12‐oxo‐phytodienoic acid (OPDA) and dinor‐12‐oxo‐phytodienoic acid (dnOPDA), respectively. OPDA and dnOPDA are then translocated into peroxisomes for further steps of JA biosynthesis (Feussner & Wasternack, 2002; Wasternack & Hause, 2013). Our recent study showed that the dwarf phenotypes of dgd1 mutants are caused by JA overproduction (Lin et al., 2016). Blocking JA biosynthesis or signaling in dgd1 mutants restored a wild‐type appearance without changing their lipid profiles. Our results demonstrated a link between galactolipids and JA biosynthesis. However, the cause of JA overproduction has not been clearly understood. It is not likely to be caused by MGDG accumulation because, although MGDG conversion to DGDG is defective in dgd1 mutants, MGDG does not overaccumulate and the amount of MGDG is actually slightly lower in dgd1 relative to the wild‐type (Kelly et al., 2016). Instead, JA overproduction may be triggered by stresses resulting from reduced galactolipid content. Alternatively, it is possible that JA overproduction is triggered by the extremely unbalanced MGDG : DGDG ratio in dgd1 mutants. In wild‐type Arabidopsis plants, the ratio of MGDG : DGDG is c. 2. This ratio is increased to c. 7 in the dgd1 mutants as a result of the severely reduced DGDG concentration (Kelly et al., 2016).
Although biological membranes are usually organized as a bilayer, many lipids found in biological membranes are known not to form bilayers. For example, MGDG has a galactose headgroup and two highly unsaturated fatty acid chains, resulting in native MGDG assuming a cone shape and tending to pack into the hexagonal (HII) phase (Shipley et al., 1973; Simidjiev et al., 2000). By contrast, the headgroup of DGDG is larger than that of MGDG, so even though it also has two unsaturated fatty acid chains, DGDG adopts a cylindrical shape and only forms bilayers (Lee, 2000). MGDG may stabilize membrane regions of concave curvature, and a high proportion of MGDG in chloroplast membranes is suggested to be important for driving the formation of thylakoid stacks (Murphy, 1982; Sprague & Staehelin, 1984; Giroud & Siegenthaler, 1988; Seiwert et al., 2018). Therefore, the MGDG : DGDG ratio is likely to be an important factor determining the shape of chloroplast membranes. However, whether the increased MGDG : DGDG ratio of dgd1 mutant plants causes their altered chloroplast morphology remains to be investigated.
To establish the cause of JA overproduction in dgd1 mutant plants, we suppressed MGD1 expression in the mutants by transforming into dgd1 an inducible microRNA targeting MGD1 (amiR‐MGD1) (Fujii et al., 2014) to further reduce galactolipid content and to partially restore the MGDG : DGDG ratio. If JA overproduction is a result of insufficient galactolipids, we anticipated that suppressing MGD1 would further increase JA production and exacerbate the dwarf phenotype. If JA overproduction is caused by the abnormally high MGDG : DGDG ratio, then suppressing MGD1 should partially rescue the phenotypes. We show that upon inducing amiR‐MGD1 expression, the expression of JA‐biosynthesis and JA‐responsive genes was reduced and the stunted growth and rounded chloroplast phenotypes of dgd1 were also partially rescued. Our data reveal that a proper MGDG : DGDG ratio is important for JA homeostasis and chloroplast shape.
Materials and Methods
Plant materials and growth conditions
Arabidopsis wild‐type control plants were in the Columbia (Col) ecotype. The dgd1‐1 mutant allele, also in the Col ecotype, was described previously (Dörmann et al., 1995). Arabidopsis seeds were sterilized and plated on MS agar medium containing 2% sucrose with or without 10 μM dexamethasone (DEX), and grown in growth chambers with a light intensity of 90–100 µmol m−2 s−1 (cool‐white fluorescent light bulbs) under conditions of 16 h : 8 h, light : dark at 22°C.
Construction of transgenic lines
The amiR‐MGD1 construct was described previously (Fujii et al., 2014). Wild‐type and dgd1‐1 plants were transformed with the amiR‐MGD1 construct by Agrobacterium tumefaciens‐mediated transformation. Five and 13 T1 transgenic lines were obtained in the Col and dgd1‐1 backgrounds, respectively. T2 seeds were harvested individually from these T1 lines. Lines showing c. 75% Basta (selection marker for the amiR‐MGD1 construct) resistance were considered as having a single‐copy transgene insertion. We then harvested seeds of the T3 generation from individual plants. Lines showing 100% Basta resistance were considered homozygous for the transgene.
Lipid analyses
Total lipids were extracted from 15‐d‐old seedlings. Each sample (c. 100 mg) was ground in a precooled mortar with 6 ml of ice‐cold chloroform : methanol (1 : 2, v/v) until it reached homogeneity. After centrifugation at 2100 g and 4ºC for 5 min, the supernatant was transferred into a new glass tube. Chloroform (2 ml) and 0.45% KCl (1.2 ml) were added and mixed well using a glass pipette. After centrifugation, the total lipid phase (green color, bottom part) was transferred to a new glass tube and the solvent was evaporated by nitrogen stream. For measurements of MGDG and DGDG as shown in Fig. 2, each sample was dissolved in 100 μl chloroform : methanol (2 : 1, v/v) and 10 μl from each sample was separated by one‐dimentional thin‐layer chromatography (TLC) with a solvent system of acetone : toluene : water (45 : 15 : 4, v/v/v) for 2 h. For measurements of phosphatidylglycerol (PG) and sulfoquinovosyl diacylglycerol (SQDG) in addition to MGDG and DGDG as shown in Supporting Information Table S1, samples were dissolved in 50 μl chloroform : methanol (2 : 1, v/v) and 15 μl from each sample was separated by two‐dimensional TLC with a solvent system of chloroform : methanol : aqueous ammonia (120 : 80 : 8, v/v/v) for the first dimension and chloroform : methanol : acetic acid : water (170 : 20 : 15 : 3, v/v/v) for the second dimension. To visualize the lipids on TLC plates, 0.01% (w/v) primuline in 80% acetone was sprayed on the plates and the lipids were detected under UV light. Regions corresponding to individual lipids were marked using a pencil, and the silica gel containing the lipids was scraped into screwcap glass tubes. To perform methyl esterification of fatty acids, 100 μl of 1 mM pentadecanoic acid was used as an internal standard and 250 μl of HCl‐MeOH (Sigma) was added before incubating at 85ºC for 2 h. After cooling down to room temperature, the lipid samples were extracted by hexane, and fatty acid methyl esters were quantified by GC‐MS (GC 7890 A‐MS 5975C; Agilent, Santa Clara, CA, USA).
Fig. 2.
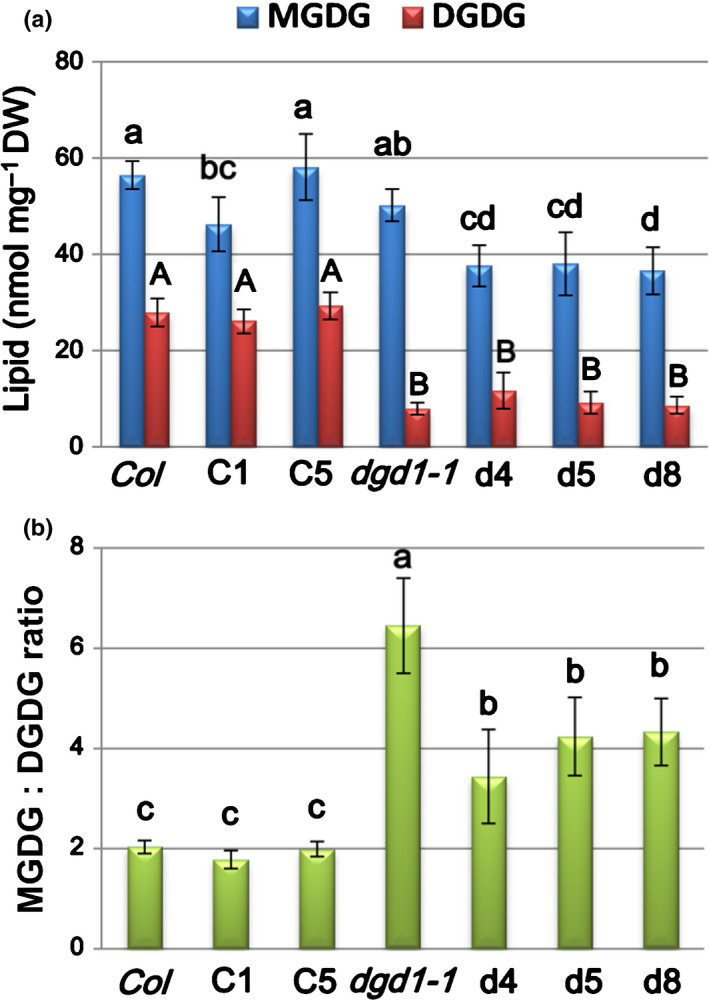
Galactolipid contents in amiR‐MGD1 transgenic lines. (a) Monogalactosyl diacylglycerol (MGDG) and digalactosyl diacylglycerol (DGDG) contents in the Arabidopsis Col, dgd1‐1, and amiR‐MGD1 transgenic lines. (b) MGDG : DGDG ratio of the Col, dgd1‐1, and amiR‐MGD1 transgenic lines. Total lipids were extracted from 15‐d‐old plants grown on 10 μM dexamethasone (DEX)‐MS medium. After separation by one‐dimension thin‐layer chromatography, MGDG and DGDG contents were analyzed by GC‐MS. Values are means ± SD of at least six independent plant batches. Values marked with different letters indicate a statistically significant difference between genotypes (P < 0.05, one‐way ANOVA with Tukey honestly significant difference (HSD) test).
Quantitative RT‐PCR
Total RNA was extracted from 15‐d‐old plants using TriPure Isolation Reagent (Roche Diagnostics, Indianapolis, IN, USA) according to the manufacturer's protocol. Genomic DNA contamination was removed by DNase I (Promega) treatment. To synthesize cDNA, 2 μg of total RNA was used to synthesize first‐strand cDNA with Maxima H Minus Reverse Transcriptase (Thermo Scientific, Vilnius, Lithuania). Quantitative reverse transcription polymerase chain reaction (RT‐PCR) was performed using the Bio‐Rad CFX96 system (Bio‐Rad) and the iQ SYBR Green Supermix solution (Bio‐Rad). The initial denaturing step of 95°C for 3 min was followed by 40 cycles of 95°C for 10 s and 60°C for 25 s. Melting curve analysis was conducted after PCR. Quantification was performed using Bio‐Rad CFX manager v.3.1. Normalization was performed using Ubiquitin 10 (UBQ10) as an internal control. Primers used are listed in Table S2.
Chlorophyll and photosynthesis measurements
To determine Chl content, seedlings were weighted and then crushed in liquid nitrogen, homogenized in 80% (v/v) acetone, and then centrifuged at 12 000 g for 3 min to remove the debris. The extraction procedure was repeated once and the supernatant was pooled. Chl content was measured as described previously (Lichtenthaler, 1987). For comparison based on DW, debris after extractions were dried at 85°C for 2 d and then weighed. Maximum quantum efficiency of PSII was determined using a Chl fluorescence imaging system (Imaging‐Pam Maxi version; Walz, Effeltrich, Germany). All measurements are based on three biological replicates of 15‐d‐old plants grown on 10 μM DEX‐MS agar medium. Seedlings were incubated in the dark for 15 min before measurements.
Fluorescence microscopy
Seedlings were grown on 10 μM DEX‐MS agar medium for 15 d. First and second true leaves were excised and embedded in 5% agarose. Then, 100‐μm‐thick sections were prepared using a vibratome and were used to observe Chl autofluorescence of mesophyll cells using a confocal microscope (LSM 780; Zeiss).
Transmission electron microscopy and shape factor calculation
Chloroplasts of Col, dgd1‐1, C1, d4 and d8 lines grown on 10 μM DEX‐MS medium for 15 d were isolated as described previously (Chu & Li, 2011). The chloroplasts were pelleted down and transferred to a 100‐μm‐deep well with a carrier. The specimen‐carrier sandwich was rapidly frozen using the Leica EM HPM 100 high‐pressure freezing system (Leica Microsystems, Wetzlar, Germany). Frozen samples in the carriers under liquid nitrogen were transferred immediately for automatic freeze‐substitution using the Leica EM AFS2 system (JH Technologies, Fremont, CA, USA). After embedding, ultrathin (75 nm) sections of the samples were stained with uranyl acetate and lead citrate, and observed and imaged using a Tecnai G2 Spirit TWIN electron microscope (FEI, New York, NY, USA). imagej v.1.49 software (National Institutes of Health, Bethesda, MD, USA) was used to calculate the shape factor (roundness) using the formula, 4 × (area)/(π × major axis2).
Results
Suppression of MGD1 in a dgd1 mutant using amiR‐MGD1
We introduced the DEX‐inducible amiR‐MGD1 construct (Fujii et al., 2014) into wild‐type Columbia (Col) and dgd1‐1 mutant Arabidopsis plants. The amiR‐MGD1 construct specifically targets the MGD1 transcript and has no effect on expression of MGD2 or MGD3 (Fujii et al., 2014). We obtained multiple independent transgenic lines and chose lines C1 and C5 (in the Col background) and lines d4, d5 and d8 (in the dgd1‐1 background) for subsequent analyses. In the presence of 10 μM DEX, levels of MGD1 mRNA were reduced to c. 30% and c. 60% of Col in the C1 and C5 lines, respectively, and to c. 30–45% of Col in the d4, d5 and d8 lines (Fig. 1a). The cotyledons of the C1 line were a slightly paler green than Col early in development, and the C5 line appeared indistinguishable from Col (Fig. 1b). True leaves of C1 and C5 lines appeared similar to Col. This outcome is consistent with a previous report showing that Chl content was not reduced when MGD1 expression was decreased to 50% of the wild‐type level, and only when expression was decreased to c. 20–30% of that of the wild‐type was reduction in Chl in cotyledons observed (Fujii et al., 2014). Similarly, true leaves of the d4, d5 and d8 lines appeared indistinguishable from those of the dgd1‐1 mutant and were slightly paler green than those of Col (Fig. 1b). However, cotyledons of some d4, d5 and d8 plants appeared pale or white. It is possible that cotyledons are more sensitive to reduced galactolipid contents, as has been shown previously (Fujii et al., 2014).
Fig. 1.
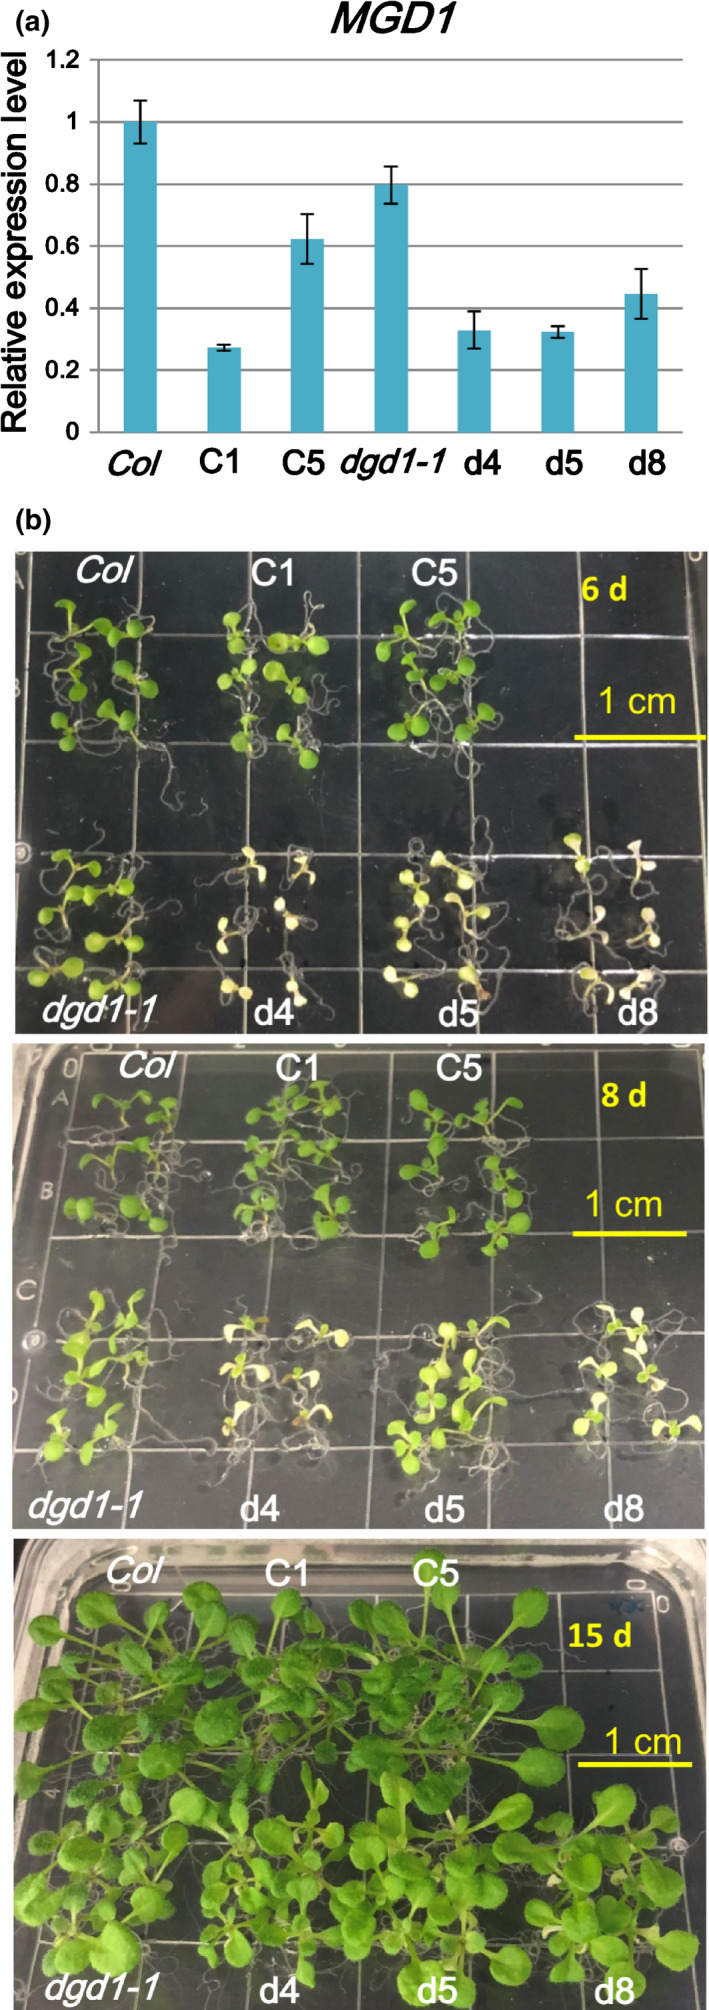
amiR‐MGD1 suppresses MGD1 expression. (a) MGD1 expression levels in amiR‐MGD1 transgenic lines were analyzed by quantitative reverse transcription polymerase chain reaction and normalized to UBQ10. Arabidopsis plants were grown on 10 μM dexamethasone (DEX)‐MS medium for 15 d. Values are means ± SEM of three biological replicates. (b) Seedlings of amiR‐MGD1 transgenic lines grown on 10 μM DEX‐MS medium for 6, 8 and 15 d. C1 and C5 are independent transgenic lines in the wild‐type Col background; d4, d5 and d8 are independent transgenic lines in the dgd1‐1 mutant background.
Reduced MGDG content in amiR‐MGD1 transgenic lines
Next, we analyzed the MGDG and DGDG contents of the amiR‐MGD1 transgenic lines. As shown in Fig. 2, the MGDG concentration was decreased by c. 18% in the C1 line, and by c. 25% in the d4, d5 and d8 lines, compared with Col. We did not observe any reduction in MGDG concentration for the C5 line, consistent with the gene expression results showing a smaller reduction in MGD1 mRNA for the C5 line (Fig. 1a). DGDG contents did not change in the C1 and C5 lines relative to Col. Similarly, DGDG contents in the d4, d5 and d8 lines were not significantly different compared with the dgd1‐1 mutant (Fig. 2a). The reduced MGDG concentration in the d4, d5 and d8 lines results in a reduced MGDG : DGDG ratio. In Col, the MGDG : DGDG ratio was c. 2. Owing to its severely reduced DGDG content, the MGDG : DGDG ratio in the dgd1‐1 mutant was increased to c. 6.5 (Fig. 2b). In the d4, d5 and d8 lines, the MGDG : DGDG ratio was reduced to c. 3.4–4.3 (Fig. 2b). Although the MGDG content was slightly reduced in the C1 line, we did not find a significant difference in its MGDG : DGDG ratio relative to Col (Fig. 2b), perhaps because of a slight, though not significant, reduction in its DGDG content (Fig. 2a).
The stunted growth phenotype is partially rescued in amiR‐MGD1 dgd1 transgenic lines
The most obvious visible phenotype of dgd1 mutant plants is their stunted growth, with very short petioles and inflorescence stems (Fig. 3) (Dörmann et al., 1995). Our previous results revealed that this phenotype is caused by JA overproduction (Lin et al., 2016). Interestingly, suppression of MGD1 in the dgd1‐1 mutants (d4, d5 and d8 lines) partially rescued this phenotype (Fig. 3). In the d4, d5 and d8 lines, inflorescence stems and petioles were longer compared with those of the dgd1‐1 mutant. We analyzed expression of JA‐biosynthesis and JA‐responsive genes by quantitative RT‐PCR. Expression of genes involved in JA biosynthesis (AOS, AOC1, LOX2, LOX3 and LOX4) and JA responses (PDF1.2 and VSP1) were all decreased in the d4, d5 and d8 lines compared with their expression levels in the dgd1‐1 mutant (Fig. 4). These results are consistent with the phenotypes exhibited by the d4, d5 and d8 plants (Fig. 3). Compared with the dgd1‐1 mutant, the d4, d5 and d8 lines had further reduced galactolipid content (Fig. 2a), but had a partially restored MGDG : DGDG ratio (Fig. 2b). Therefore, the partial rescue of the stunted growth phenotype and reduced expression of JA‐biosynthesis and JA‐responsive genes in the d4, d5 and d8 lines suggest that JA overproduction in the dgd1 mutants is caused by the increased MGDG : DGDG ratio.
Fig. 3.
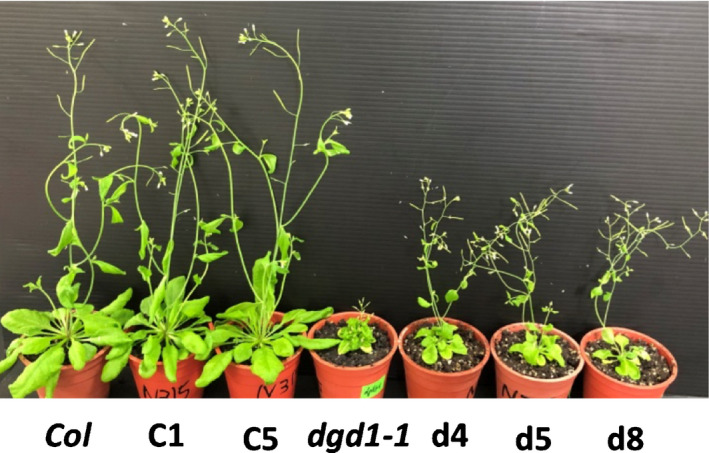
The stunted growth phenotype of dgd1 is partially rescued by amiR‐MGD1. Arabidopsis plants of indicated genotypes were grown in magenta boxes containing 10 μM dexamethasone (DEX)‐MS medium for 26 d and then transferred to soil for another 15 d under 16 h : 8 h, light : dark conditions.
Fig. 4.
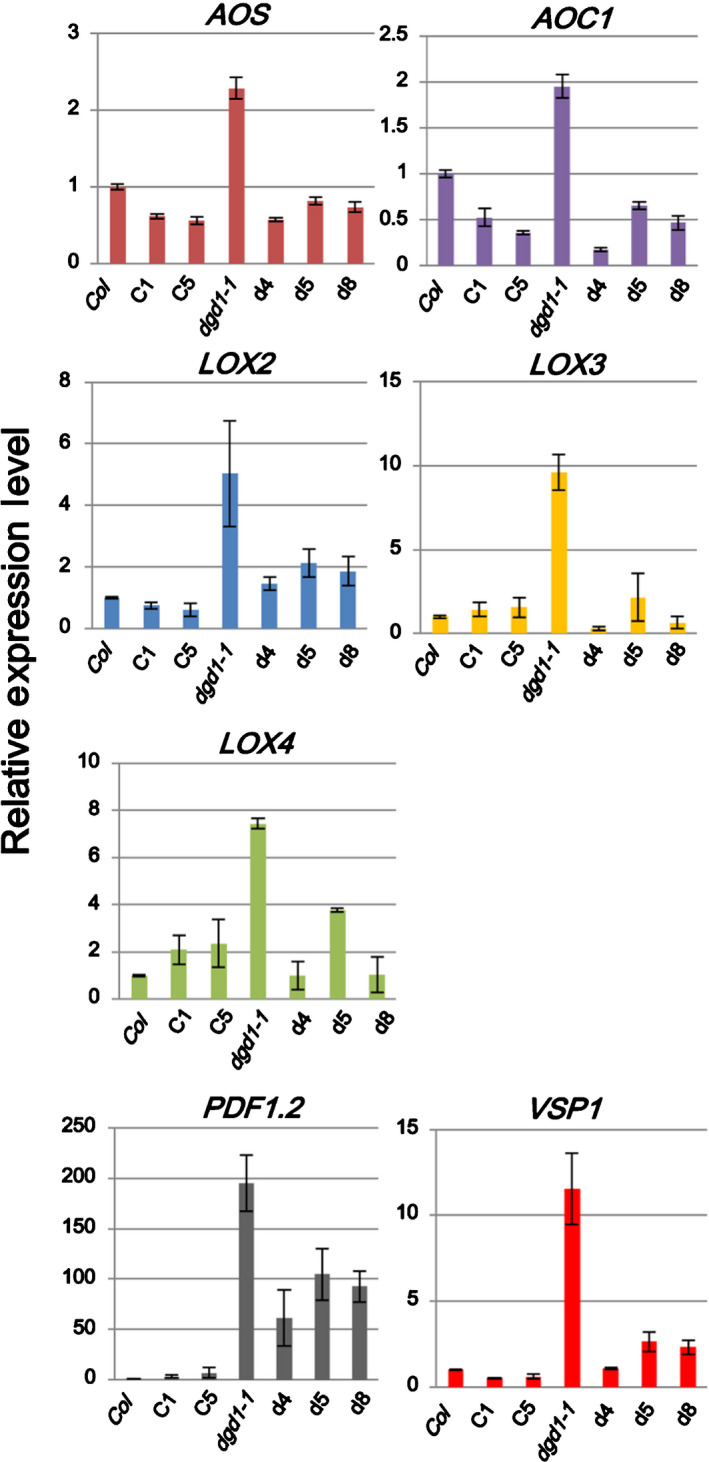
Expression levels of jasmonic acid (JA)‐biosynthesis and JA‐responsive genes in the amiR‐MGD1 transgenic lines. Arabidopsis plants were grown on 10 μM dexamethasone (DEX)‐MS medium for 15 d and harvested for total RNA extraction. Levels of indicated genes were analyzed by quantitative reverse transcription polymerase chain reaction and normalized to expression of UBQ10. Values are means ± SEM of three biological repeats.
We also measured the contents of two other major chloroplast membrane lipids, SQDG and PG, in Col, dgd1‐1 and the C1 and d4 lines. The amounts of these two lipids in the C1 line were slightly lower than those in Col, and their amounts in the d4 line were slightly lower than or similar to those in the dgd1‐1 mutant (Table S1), indicating that reduction of MGDG in the C1 and d4 lines did not increase PG and SQDG contents. Therefore the d4 line indeed had reduced lipid content in terms of either galactolipids or major chloroplast membrane lipids. In addition, to exclude the possibility that the reduced galactolipid content measurements in the amiR‐MGD1 dgd1‐1 transgenic lines resulted from greatly reduced chloroplast numbers so the lipid content per chloroplast might not be changed, we observed chloroplasts in mesophyll cells of Col, dgd1‐1, and the C1 and d4 lines. As shown in Fig. S1, chloroplast numbers in mesophyll cells of all four lines appeared similar.
Reduced MGDG content in the dgd1‐1 mutant does not further affect photosynthesis
In addition to JA overproduction, the dgd1 mutants also exhibit reduced photosynthesis (Dörmann et al., 1995; Lin et al., 2016). To investigate if the reduced photosynthesis is also related to increased MGDG : DGDG ratio, we measured the Chl content and PSII quantum efficiency of the amiR‐MGD1 transgenic lines. As shown in Figs 5(a) and S2, Chl contents in the d4, d5 and d8 lines were similar to those of the untransformed dgd1‐1 mutant when normalized either to FW or DW. The maximum quantum efficiencies of PSII in the d4, d5 and d8 lines were also similar to those of the untransformed dgd1‐1 mutant (Fig. 5b). These data suggest that further reducing MGDG content or partially restoring the MGDG : DGDG ratio in the dgd1 mutant plants neither exacerbates nor rescues the reduced Chl and photosynthesis phenotypes of dgd1. Thus, these dgd1 phenotypes are probably a direct result of insufficient DGDG.
Fig. 5.
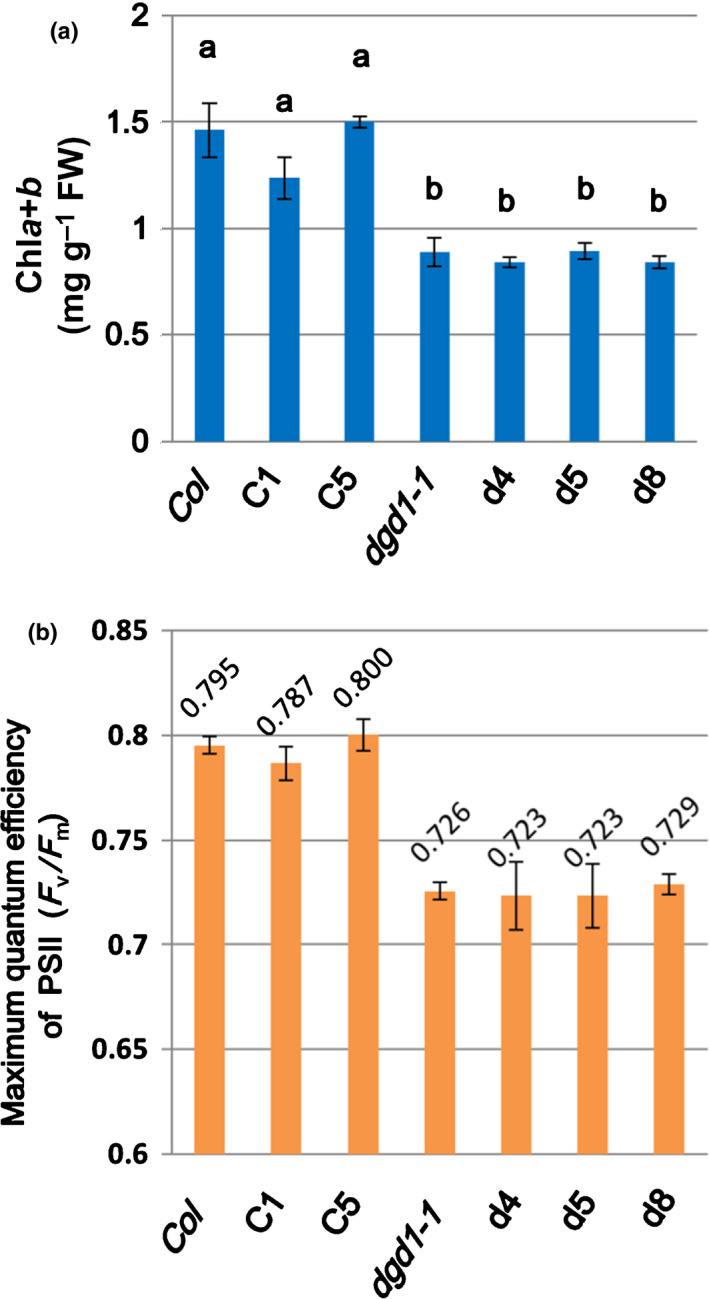
The dgd1‐amiR‐MGD1 transgenic lines exhibit the same reductions in Chl content and maximum quantum efficiency of photosystem II (PSII) as dgd1. (a) Arabidopsis plants were grown on 10 μM dexamethasone (DEX)‐MS medium for 15 d, and leaves were then harvested for Chl determination. Normalizations were based on plant FW. (b) Plants were grown on 10 μM DEX‐MS medium for 15 d before measuring maximum quantum efficiency of PSII. Values are means ± SD of three biological repeats. Values marked with different letters indicate a statistically significant difference between genotypes (P < 0.05, one‐way ANOVA with Tukey honestly significant difference (HSD) test).
The rounded chloroplast phenotype is partially rescued in amiR‐MGD1 dgd1‐1 transgenic lines
Compared with wild‐type plants, dgd1 chloroplasts often have a rounded envelope with bent thylakoids and large thylakoid‐free stromal areas when observed by electron microscopy (Dörmann et al., 1995; Hölzl et al., 2009; Lin et al., 2016) (Fig. 6a). To investigate whether this altered chloroplast morphology is related to insufficient galactolipids or an increased MGDG : DGDG ratio, we isolated intact chloroplasts from the Col, C1, dgd1‐1, d4, and d8 lines grown on 10 μM DEX‐MS medium for 15 d, and then observed them by transmission electron microscopy after high‐pressure freezing fixation. Compared with the dgd1‐1 mutant, a higher proportion of chloroplasts in the d4 and d8 lines were oval‐shaped, that is, more similar in shape to chloroplasts from the Col and C1 lines (Fig. 6a). For quantitative analysis, we measured the shape factor (roundness) of more than 600 chloroplasts (from at least 40 images) from each line using the imagej software. Compared witih the dgd1‐1 mutant, in the d4 and d8 lines proportions of chloroplasts with higher roundness indexes (> 0.75, more rounded) were decreased and proportions with lower roundness indexes (< 0.75, more elongated) were increased (Fig. 6b). These results suggest that, similar to the JA overproduction phenotype, the rounded chloroplast phenotype of the dgd1 mutants is also caused by the increased MGDG : DGDG ratio, and reducing the ratio in dgd1 mutant plants partially rescued the altered chloroplast phenotype.
Fig. 6.
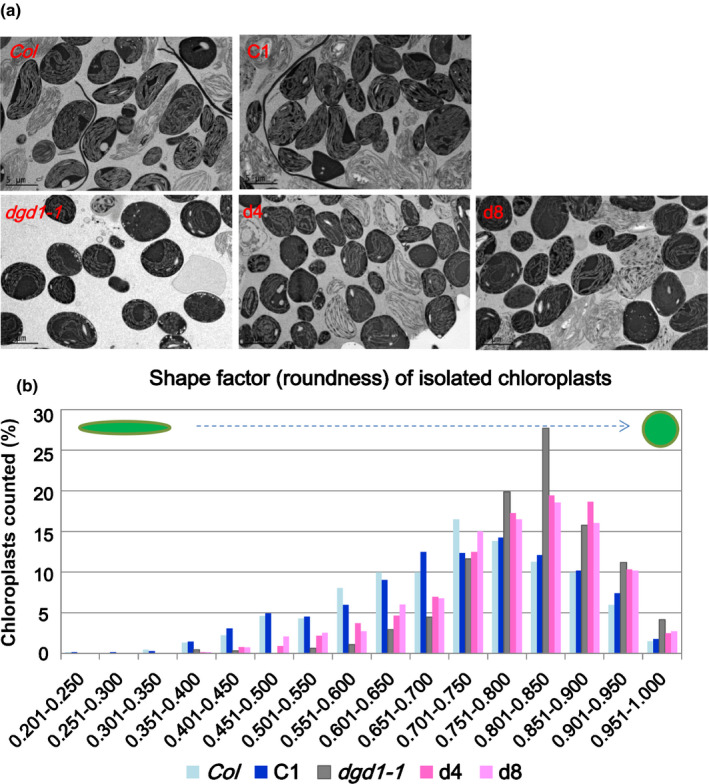
Morphology of chloroplasts isolated from wild‐type and various mutant Arabidopsis plants, as observed by electron microscopy. Chloroplasts were isolated from leaves of plants grown on 10 μM dexamethasone (DEX)‐MS medium for 15 d and processed by high‐pressure freezing and freeze‐substitution fixation. (a) Morphology of chloroplasts from the Col, C1, dgd1‐1, d4 and d8 lines. The lighter‐colored chloroplasts are broken chloroplasts and were not selected for shape factor determination. (b) Shape factor index distribution. The shape factor index (roundness) of more than 600 chloroplasts from each line was assessed using imagej.
Discussion
Our data show that by further reducing the MGDG content of the dgd1 mutant, we could partially rescue its stunted growth phenotype. Expression of JA‐biosynthesis and JA‐responsive genes were also reduced. These data suggest that JA overproduction in the dgd1 mutants is not caused by reduced galactolipid content, but by the abnormally high MGDG : DGDG ratio. dgd1 mutant plants exhibit several major phenotypes: stunted growth, rounded chloroplasts, decreased Chl content and reduced photosynthesis. Our data suggest that these phenotypes have different causes (Fig. 7). The stunted growth phenotype is caused by JA overproduction as a result of an increased MGDG : DGDG ratio. The rounded chloroplast phenotype is not related to JA production but seems also to be caused by the increased MGDG : DGDG ratio. The reduced Chl content and photosynthesis are proably a direct consequence of insufficient DGDG. These results also highlight the multifaceted roles of the two galactolipids in plant development. They participate in photosynthesis and stress adaption, act as substrates and triggers for phytohormone synthesis, and maintain chloroplast shape.
Fig. 7.
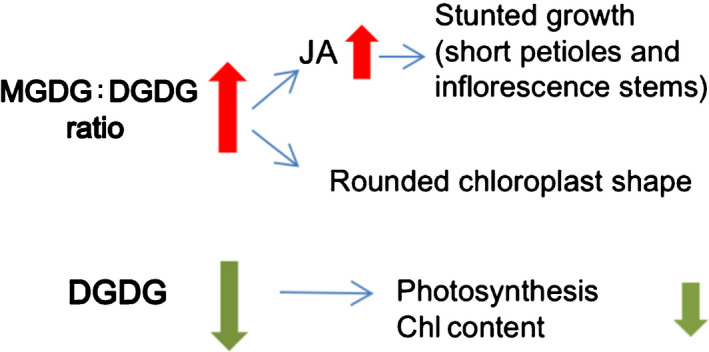
Different causes of various dgd1 phenotypes. In dgd1 mutant plants, reduced digalactosyl diacylglycerol (DGDG) results in a dramatically increased monogalactosyl diacylglycerol (MGDG) : DGDG ratio, leading to jasmonic acid (JA) overproduction and consequently stunted growth characterized by short petioles and inflorescence stems. The rounded chloroplast phenotype may also be a result of the increased MGDG : DGDG ratio. Reduced photosynthesis and Chl content in the dgd1 mutant is most likely a direct consequence of DGDG insufficiency.
Mixtures of MGDG and DGDG start to transit from bilayer to nonbilayer structures in vitro when the MGDG : DGDG ratio is > 2.5 (Sprague & Staehelin, 1984; Giroud & Siegenthaler, 1988). Hence, it is conceivable that the high MGDG : DGDG ratio (c. 6.5) in dgd1 mutant plants may destabilize the lamellar phase of the chloroplast membranes and stabilize regions of concave curvature, resulting in the more rounded chloroplasts. Reducing MGDG content in the dgd1 mutant reduces the MGDG : DGDG ratio and may stabilize more membrane areas in the lamellar phase, thereby partially rescuing the rounded chloroplast morphology phenotype. It has previously been shown that production of glucosylgalactosyl diacylglycerol (GGDG) in the dgd1 mutant by introducing a bacterial glucosyltransferase into the dgd1 mutant can also rescue the rounded chloroplast phenotype (Hölzl et al., 2006, 2009). It is possible that GGDG exhibits a similar bilayer‐forming property to that of DGDG as a result of having a similar headgroup size, so it can replace DGDG in maintaining chloroplast shape. Therefore, having an appropriate ratio of nonbilayer‐forming to bilayer‐forming lipids may be critical not only for thylakoid stacking but also for chloroplast morphology.
Crystallographic analyses have shown that MGDG is present in PSI, PSII and the Cyt b 6 f complex, and that DGDG is present in PSII (Jordan et al., 2001; Stroebel et al., 2003; Guskov et al., 2009; Umena et al., 2011). However, reducing the MGDG content of the dgd1 mutant did not significantly alter the Chl content or maximum quantum efficiency of PSII of that mutant. This result is in agreement with a previous report showing that a small reduction of MGDG content in true leaves by means of amiR‐MGD1 has very limited effects on maximum quantum efficiency of PSII in wild‐type plants (Fujii et al., 2014), so a small reduction of MGDG may not cause a further reduction of photosynthesis in the dgd1 mutant. Our results also support previous findings suggesting that the reduced photosynthesis and Chl content of the dgd1 mutant are directly caused by reduced DGDG concentrations and not by the altered MGDG : DGDG ratio or abnormal JA production (Hölzl et al., 2006, 2009; Lin et al., 2016).
Rearrangement of lipid compositions, in particular decreased MGDG : DGDG ratio, often occurs during various stresses. For example, chloroplast MGDG concentrations are reduced during freezing. The SENSITIVE TO FREEZING2 (SFR2) gene product transfers a galactose from MGDG onto a galactolipid acceptor to produce DGDG or other oligogalactoglycerolipids (Moellering et al., 2010; Moellering & Benning, 2011). Increased contents of bilayer‐forming oligogalactoglycerolipids may facilitate maintenance of the lamellar outer envelope membranes and prevent their damage during freezing stress (Moellering et al., 2010; Rocha et al., 2018). A prominent decrease in MGDG and an increase in DGDG have been observed upon drought stresses (Gigon et al., 2004). The resulting decreased MGDG : DGDG ratio could help to maintain chloroplast membranes in a bilayer conformation (Gigon et al., 2004). Similarly, MGDG was decreased and bilayer‐forming DGDG, SQDG, and PG were increased when the cyanobacterium Synechococcus PCC 6311 was grown under high salt conditions (Huflejt et al., 1990). These results suggest that decreasing the MGDG : DGDG ratio could endow plants with the capacity for stress adaptation, possibly by increasing the ability of maintaining membranes in a bilayer conformation.
Our observation that JA production is induced by an increased MGDG : DGDG ratio suggests that, apart from conferring protection through changes in membrane architecture, changes in lipid ratio may also serve as a signal to induce other stress response or protection mechanisms. Interestingly, under phosphate‐limited conditions, JA‐responsive genes are also upregulated and JA production is increased in the absence of wounding (Khan et al., 2016). How phosphate starvation induces JA production is not clear. Under phosphate starvation, DGDG synthesis is elevated and DGDG is exported to extraplastidic membranes to substitute for digested phospholipids (Härtel et al., 2000; Andersson et al., 2003, 2005; Jouhet et al., 2004; Moellering & Benning, 2011). Therefore the galactolipid : phospholipid ratio at the DGDG receiving sites, like tonoplast and mitochondrial membranes, will be highly altered. As for the MGDG : DGDG ratio, it has been reported that the MGDG : DGDG ratio of the chloroplast fraction, represented by a low‐speed centrifugation pellet from the total cell lysate, was slightly decreased during phosphate starvation (Härtel et al., 2000). However, lipid measurements from the pellet fraction mostly reflect the amounts of lipids in the thylakoid membranes. The envelope membranes would mostly be in the supernatant fraction of the low‐speed centrifugation. Hence how the MGDG : DGDG ratio in the chloroplast outer or inner envelope membrane is changed is not known. It may be decreased as a result of the elevated DGDG synthesis or increased as a result of DGDG export. We hypothesize that JA induction during phosphate starvation may also be induced by lipid ratio changes (Li & Yu, 2018). An altered MGDG : DGDG ratio in the chloroplast envelope membranes may affect the activity of enzymes responsible for some of the initial steps of JA biosynthesis located at the envelope (Wasternack & Song, 2017). Alternatively, an altered MGDG : DGDG ratio at the chloroplast envelope or galactolipid : phospholipid ratio in tonoplast and mitochondrial membranes may trigger a signal to the nucleus to increase the expression of genes encoding JA biosynthesis enzymes. Induction of JA production may help plants to cope better with the stress of phosphate starvation by retarding growth during nutrient limitation and deterring insect predators during slow growth.
Author contributions
C‐WY, Y‐TL and H‐mL designed the research. Y‐TL performed initial trials. C‐WY performed all experiments presented. C‐WY and H‐mL analyzed the data and wrote the article.
Supporting information
Please note: Wiley Blackwell are not responsible for the content or functionality of any Supporting Information supplied by the authors. Any queries (other than missing material) should be directed to the New Phytologist Central Office.
Fig. S1 The C1 and d4 amiR‐MGD1 transgenic lines did not show great reduction in chloroplast numbers.
Fig. S2 Chlorophyll comparison based on DW.
Table S1 The amount of major chloroplast lipids in the wild‐type and various mutants.
Table S2 Primers used for quantitative RT‐PCR.
Acknowledgements
We thank Dr Yuki Nakamura (Institute of Plant and Microbial Biology, Academia Sinica) for the amiR‐MGD1 construct and assistance of lipid analyses. We thank the imaging core of the Institute of Molecular Biology, Academia Sinica, for assistance with electromicroscopy and confocal microscopy, and Dr John O'Brien for language editing. This work was funded by Academia Sinica of Taiwan (to H‐mL).
References
- Andersson MX, Larsson KE, Tjellstrom H, Liljenberg C, Sandelius AS. 2005. Phosphate‐limited oat. The plasma membrane and the tonoplast as major targets for phospholipid‐to‐glycolipid replacement and stimulation of phospholipases in the plasma membrane. Journal of Biological Chemistry 280: 27578–27586. [DOI] [PubMed] [Google Scholar]
- Andersson MX, Stridh MH, Larsson KE, Liljenberg C, Sandelius AS. 2003. Phosphate‐deficient oat replaces a major portion of the plasma membrane phospholipids with the galactolipid digalactosyldiacylglycerol. FEBS Letters 537: 128–132. [DOI] [PubMed] [Google Scholar]
- Block MA, Dorne AJ, Joyard J, Douce R. 1983. Preparation and characterization of membrane fractions enriched in outer and inner envelope membranes from spinach chloroplasts. I. Electrophoretic and immunochemical analyses. Journal of Biological Chemistry 258: 13273–13280. [PubMed] [Google Scholar]
- Chu CC, Li HM. 2011. Determining the location of an Arabidopsis chloroplast protein using in vitro import followed by fractionation and alkaline extraction. Methods in Molecular Biology 774: 339–350. [DOI] [PubMed] [Google Scholar]
- Dörmann P, Benning C. 2002. Galactolipids rule in seed plants. Trends in Plant Science 7: 112–118. [DOI] [PubMed] [Google Scholar]
- Dörmann P, Hoffmann‐Benning S, Balbo I, Benning C. 1995. Isolation and characterization of an Arabidopsis mutant deficient in the thylakoid lipid digalactosyl diacylglycerol. Plant Cell 7: 1801–1810. [DOI] [PMC free article] [PubMed] [Google Scholar]
- Feussner I, Wasternack C. 2002. The lipoxygenase pathway. Annual Review of Plant Biology 53: 275–297. [DOI] [PubMed] [Google Scholar]
- Fujii S, Kobayashi K, Nakamura Y, Wada H. 2014. Inducible knockdown of MONOGALACTOSYLDIACYLGLYCEROL SYNTHASE1 reveals roles of galactolipids in organelle differentiation in Arabidopsis cotyledons. Plant Physiology 166: 1436–1449. [DOI] [PMC free article] [PubMed] [Google Scholar]
- Gigon A, Matos AR, Laffray D, Zuily‐Fodil Y, Pham‐Thi AT. 2004. Effect of drought stress on lipid metabolism in the leaves of Arabidopsis thaliana (ecotype Columbia). Annals of Botany 94: 345–351. [DOI] [PMC free article] [PubMed] [Google Scholar]
- Giroud C, Siegenthaler PA. 1988. Development of oat prothylakoids into thylakoids during greening does not change transmembrane galactolipid asymmetry but preserves the thylakoid bilayer. Plant Physiology 88: 412–417. [DOI] [PMC free article] [PubMed] [Google Scholar]
- Guskov A, Kern J, Gabdulkhakov A, Broser M, Zouni A, Saenger W. 2009. Cyanobacterial photosystem II at 2.9‐Å resolution and the role of quinones, lipids, channels and chloride. Nature Structural & Molecular Biology 16: 334–342. [DOI] [PubMed] [Google Scholar]
- Härtel H, Dörmann P, Benning C. 2000. DGD1‐independent biosynthesis of extraplastidic galactolipids after phosphate deprivation in Arabidopsis . Proceedings of the National Academy of Sciences, USA 97: 10649–10654. [DOI] [PMC free article] [PubMed] [Google Scholar]
- Hölzl G, Witt S, Gaude N, Melzer M, Schöttler MA, Dörmann P. 2009. The role of diglycosyl lipids in photosynthesis and membrane lipid homeostasis in Arabidopsis. Plant Physiology 150: 1147–1159. [DOI] [PMC free article] [PubMed] [Google Scholar]
- Hölzl G, Witt S, Kelly AA, Zahringer U, Warnecke D, Dörmann P, Heinz E. 2006. Functional differences between galactolipids and glucolipids revealed in photosynthesis of higher plants. Proceedings of the National Academy of Sciences, USA 103: 7512–7517. [DOI] [PMC free article] [PubMed] [Google Scholar]
- Huflejt ME, Tremolieres A, Pineau B, Lang JK, Hatheway J, Packer L. 1990. Changes in membrane lipid composition during saline growth of the fresh water cyanobacterium Synechococcus 6311. Plant Physiology 94: 1512–1521. [DOI] [PMC free article] [PubMed] [Google Scholar]
- Jarvis P, Dörmann P, Peto CA, Lutes J, Benning C, Chory J. 2000. Galactolipid deficiency and abnormal chloroplast development in the Arabidopsis MGD synthase 1 mutant. Proceedings of the National Academy of Sciences, USA 97: 8175–8179. [DOI] [PMC free article] [PubMed] [Google Scholar]
- Jordan P, Fromme P, Witt HT, Klukas O, Saenger W, Krauss N. 2001. Three‐dimensional structure of cyanobacterial photosystem I at 2.5 A resolution. Nature 411: 909–917. [DOI] [PubMed] [Google Scholar]
- Jouhet J, Marechal E, Baldan B, Bligny R, Joyard J, Block MA. 2004. Phosphate deprivation induces transfer of DGDG galactolipid from chloroplast to mitochondria. Journal of Cell Biology 167: 863–874. [DOI] [PMC free article] [PubMed] [Google Scholar]
- Kelly AA, Kalisch B, Holzl G, Schulze S, Thiele J, Melzer M, Roston RL, Benning C, Dörmann P. 2016. Synthesis and transfer of galactolipids in the chloroplast envelope membranes of Arabidopsis thaliana . Proceedings of the National Academy of Sciences, USA 113: 10714–10719. [DOI] [PMC free article] [PubMed] [Google Scholar]
- Khan GA, Vogiatzaki E, Glauser G, Poirier Y. 2016. Phosphate deficiency induces the jasmonate pathway and enhances resistance to insect herbivory. Plant Physiology 171: 632–644. [DOI] [PMC free article] [PubMed] [Google Scholar]
- Kobayashi K, Kondo M, Fukuda H, Nishimura M, Ohta H. 2007. Galactolipid synthesis in chloroplast inner envelope is essential for proper thylakoid biogenesis, photosynthesis, and embryogenesis. Proceedings of the National Academy of Sciences, USA 104: 17216–17221. [DOI] [PMC free article] [PubMed] [Google Scholar]
- Lee AG. 2000. Membrane lipids: it's only a phase. Current Biology 10: R377–R380. [DOI] [PubMed] [Google Scholar]
- Li HM, Yu CW. 2018. Chloroplast galactolipids: the link between photosynthesis, chloroplast shape, jasmonates, phosphate starvation and freezing tolerance. Plant and Cell Physiology 59: 1128–1134. [DOI] [PubMed] [Google Scholar]
- Lichtenthaler H. 1987. Chlorophylls and carotenoids: pigments of photosynthetic biomembranes. Methods in Enzymology 148: 350–382. [Google Scholar]
- Lin YT, Chen LJ, Herrfurth C, Feussner I, Hm Li. 2016. Reduced biosynthesis of digalactosyldiacylglycerol, a major chloroplast membrane lipid, leads to oxylipin overproduction and phloem cap lignification in Arabidopsis. Plant Cell 28: 219–232. [DOI] [PMC free article] [PubMed] [Google Scholar]
- Loll B, Kern J, Saenger W, Zouni A, Biesiadka J. 2005. Towards complete cofactor arrangement in the 3.0 Å resolution structure of photosystem II. Nature 438: 1040–1044. [DOI] [PubMed] [Google Scholar]
- Loll B, Kern J, Saenger W, Zouni A, Biesiadka J. 2007. Lipids in photosystem II: interactions with protein and cofactors. Biochimica et Biophysica Acta 1767: 509–519. [DOI] [PubMed] [Google Scholar]
- Moellering ER, Benning C. 2011. Galactoglycerolipid metabolism under stress: a time for remodeling. Trends in Plant Science 16: 98–107. [DOI] [PubMed] [Google Scholar]
- Moellering ER, Muthan B, Benning C. 2010. Freezing tolerance in plants requires lipid remodeling at the outer chloroplast membrane. Science 330: 226–228. [DOI] [PubMed] [Google Scholar]
- Murphy D. 1982. The importance of non‐planar bilayer regions in photosynthetic membranes and their stabilisation by galactolipids. FEBS Letters 150: 19–26. [Google Scholar]
- Rocha J, Nitenberg M, Girard‐Egrot A, Jouhet J, Marechal E, Block MA, Breton C. 2018. Do galactolipid synthases play a key role in the biogenesis of chloroplast membranes of higher plants? Frontiers in Plant Science 9: 126. [DOI] [PMC free article] [PubMed] [Google Scholar]
- Seiwert D, Witt H, Ritz S, Janshoff A, Paulsen H. 2018. The nonbilayer lipid MGDG and the major light‐harvesting complex (LHCII) promote membrane stacking in supported lipid bilayers. Biochemistry 57: 2278–2288. [DOI] [PubMed] [Google Scholar]
- Shipley GG, Green JP, Nichols BW. 1973. The phase behavior of monogalactosyl, digalactosyl, and sulphoquinovosyl diglycerides. Biochimica et Biophysica Acta 311: 531–544. [DOI] [PubMed] [Google Scholar]
- Simidjiev I, Stoylova S, Amenitsch H, Javorfi T, Mustardy L, Laggner P, Holzenburg A, Garab G. 2000. Self‐assembly of large, ordered lamellae from non‐bilayer lipids and integral membrane proteins in vitro . Proceedings of the National Academy of Sciences, USA 97: 1473–1476. [DOI] [PMC free article] [PubMed] [Google Scholar]
- Sprague SG, Staehelin LA. 1984. A rapid reverse phase evaporation method for the reconstitution of uncharged thylakoid membrane lipids that resist hydration. Plant Physiology 75: 502–504. [DOI] [PMC free article] [PubMed] [Google Scholar]
- Stroebel D, Choquet Y, Popot JL, Picot D. 2003. An atypical haem in the cytochrome b 6 f complex. Nature 426: 413–418. [DOI] [PubMed] [Google Scholar]
- Umena Y, Kawakami K, Shen JR, Kamiya N. 2011. Crystal structure of oxygen‐evolving photosystem II at a resolution of 1.9 Å. Nature 473: 55–60. [DOI] [PubMed] [Google Scholar]
- Wasternack C, Hause B. 2013. Jasmonates: biosynthesis, perception, signal transduction and action in plant stress response, growth and development. An update to the 2007 review in Annals of Botany. Annals of Botany 111: 1021–1058. [DOI] [PMC free article] [PubMed] [Google Scholar]
- Wasternack C, Song S. 2017. Jasmonates: biosynthesis, metabolism, and signaling by proteins activating and repressing transcription. Journal of Experimental Botany 68: 1303–1321. [DOI] [PubMed] [Google Scholar]
Associated Data
This section collects any data citations, data availability statements, or supplementary materials included in this article.
Supplementary Materials
Please note: Wiley Blackwell are not responsible for the content or functionality of any Supporting Information supplied by the authors. Any queries (other than missing material) should be directed to the New Phytologist Central Office.
Fig. S1 The C1 and d4 amiR‐MGD1 transgenic lines did not show great reduction in chloroplast numbers.
Fig. S2 Chlorophyll comparison based on DW.
Table S1 The amount of major chloroplast lipids in the wild‐type and various mutants.
Table S2 Primers used for quantitative RT‐PCR.


