Abstract
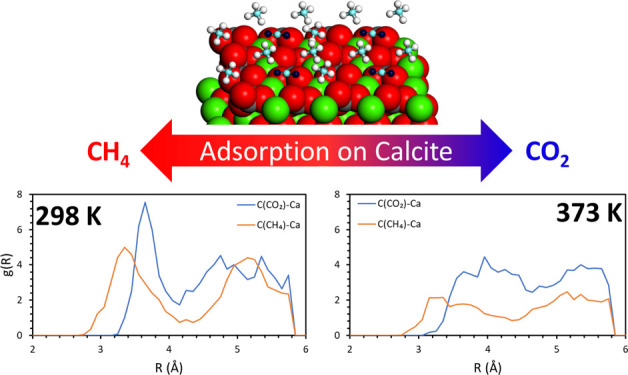
Ab initio molecular dynamics simulations of CH4 and CO2 on the calcite (104) surface have been carried out for the molecular level analysis of CO2-enhanced gas recovery process (EGR). This process takes advantage of the stronger interaction of CO2 with the reservoir walls compared to CH4, therefore can improve the extraction of the latter, while at the same time sequestering the former underground. Pure and mixed gases were considered and the temperature effect on the systems behavior was analyzed. For pure gases, carbon dioxide shows great stability on the surface in the studied temperature range, while methane molecules start leaving the surface at 298 K. For gas mixtures, the reported results confirm that for low to medium concentrations, a temperature of 373 K could determine the best methane extraction efficiency, as CH4 interaction with the surface is quite weak and carbon dioxide binds strongly on the surface. On the other hand, when full coverage is achieved, the best efficiency is reached for the highest temperature. Finally, when considered a 2:2 gas layer, carbon dioxide tends to adsorb preferentially to the surface while methane keeps floating above it, thereby reducing its chance to be adsorbed back. These results reveal nanoscopic details for the design of suitable EGR processes.
Introduction
Despite the noticeable attention at national and international levels toward the reduction of greenhouse gas emissions, CO2 concentration in the atmosphere recently surpassed a threshold of 400 ppm,1 and the increasing trend does not appear to slow down. This has put even more stress on the reduction of carbon dioxide emissions by fossil fuel burning2 and the decommissioning of polluting energy production methods. Therefore, great efforts are being made to develop new green technologies to address this issue.3 Among others, CO2-capturing technologies3,4 have shown huge potential. Under this term, two classes of methodologies can be identified: carbon capture and utilization and storage (CCUS) and carbon capture and storage (CCS) methods.5−7 In particular, CCUS encompasses methods and technologies to remove CO2 from the flue gas and from the atmosphere, followed by recycling CO2 for utilization and determining safe and permanent storage options.
CCS technologies consist of the sequestration of captured CO2 in geological beds,8−10 which has recently attracted large attention, as shown by the available industrial-scale projects.10,11 Unfortunately, risk of severe leakage12 and the high cost13,14 slow down the development of such techniques. To overcome these drawbacks,15,16 CO2 injection is regarded as a highly promising component in processes such as enhanced oil recovery (EOR)17,18 and enhanced gas recovery (EGR).19,20
The basic principle of these methods consists in the injection of large quantities of CO2 in the hydrocarbon reservoirs, with the double advantage of improving the mobility of the fluid, while at the same time sequestering CO2 in the surrounding rock. While both processes have been the subject of extensive investigations,21 EGR understanding and applications still struggle compared to EOR, which is already characterized by large-scale applications.22,23
On a microscopic scale, the EGR process is based on the fact that CO2 adsorbs preferentially on the reservoir rocks compared to CH4, improving the extraction of the latter and thereby increasing the overall productivity of depleted reservoirs.24 As already mentioned, this also results in the sequestration of carbon dioxide in the reservoir itself. To understand the underlying mechanism, a better description of the molecular interactions of the different gases with the reservoir rocks is necessary; these consist mostly in sedimentary rocks,25 in particular carbonates, sandstones, and shales.
The adsorption of the principal components of natural gas mixtures, CH4 and CO2, on calcite has been studied experimentally24,26−28 because calcium carbonate is the most abundant type of rocks and calcite its most stable polymorph.29 Most of these studies are not representative of the reservoir conditions though,27 because they are based on powder samples. Theoretical studies have also been carried out,30 but greatly limited to only one adsorption site31 or a very simple model of the surface32 hindering the insights retrieved on the mechanisms. In order to address this issue, a complete study of all the different adsorption sites of CO2 and CH4 (among other gases) on the (104) surface, the most representative surface of carbonate rocks,33 was carried out by this same group.34 In order to have a complete picture of the process, the temperature effect must be considered. To date, research on this parameter has been limited mostly to pure gases. Among others, Wlazło et al.35 studied the adsorption of pure CO2 on different materials, with calcite being inert up to 1200 K. When dealing with mixed composition, a detailed picture is still missing.
To fill this gap, first-principles molecular dynamics has been employed in this work in order to study the interaction of methane and carbon dioxide on the calcite (104) surface as a function of temperature. Pure and mixed composition gases have been investigated to assess the effect of different concentrations of CO2 on methane adsorption.
Results and Discussion
Pure CO2 and CH4 Full Coverage
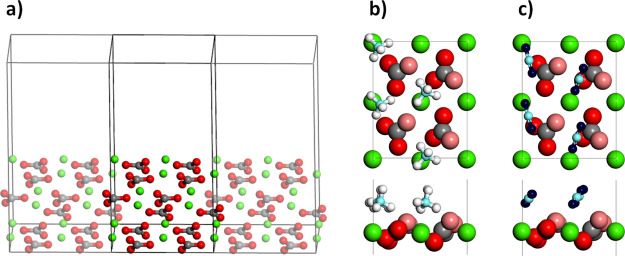
Four molecules of either CO2 or CH4 were adsorbed on the calcite surface (Figure 1a) to achieve full carbon dioxide or methane coverage (Figure 1b,c). Four trajectories were combined, and three different analyses were carried out: the distance of the molecular carbons from the surface, the radial distribution function of the C–Ca pairs, and the interaction energy of the gases with the surface.
Figure 1.
(a) Employed surface, showing the periodic boundary conditions (PBCs) applied. (b,c) Top- and side-views of the surface with a full coverage of CH4 and CO2 are shown, respectively. The color scheme is as follows: red for slab oxygens (light red for the topmost ones), dark blue for CO2 oxygens, white for hydrogens, gray for slab carbons, light blue for CO2/CH4 carbons, and green for calcium.
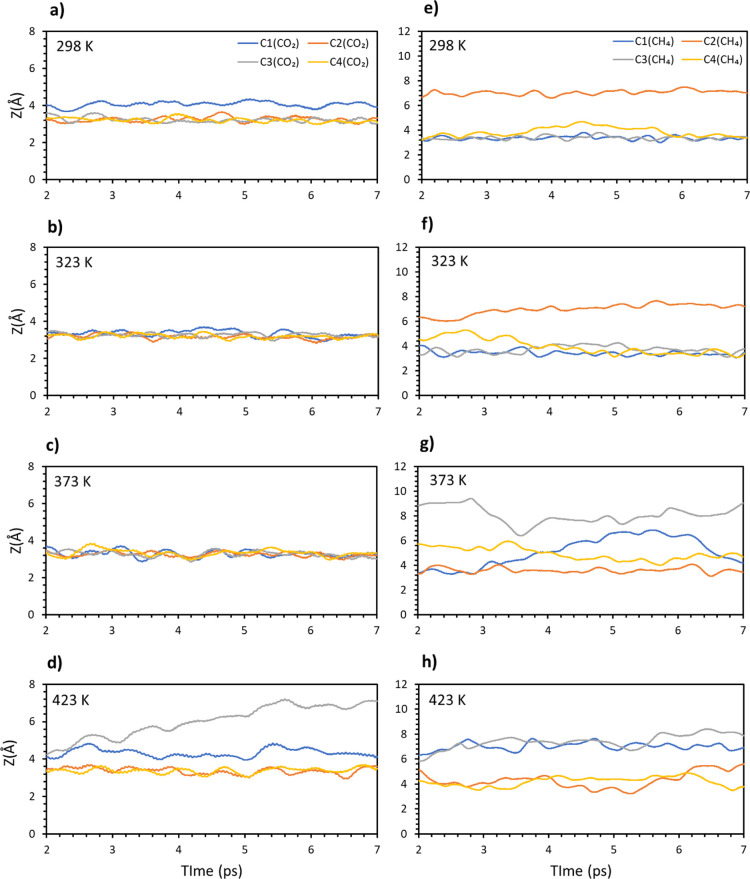
Carbon dioxide was considered first and in Figure 2a–d, the distances of the four molecular carbons from the surface have been reported as a function of time. From the results, carbon dioxide is adsorbed strongly on the surface up to 373 K. At 423 K, one of the dioxide molecules leaves the surface, while a second one shows large movements. The same simulations and analysis were carried out for methane and the distances of the molecular carbons versus time are plotted in Figure 2e–h in a similar fashion to that done for carbon dioxide. If we compare the results with the ones for carbon dioxide, methane is less stable on the surface with the temperature. One molecule already leaves the surface at temperature as low as 298 K, suggesting that a full coverage weakens the interaction of the adsorbates with the surface. Increasing the temperature makes the system more and more unstable, with two molecules leaving the surface between 373 and 423 K.
Figure 2.
Average distances of four carbon from the surface vs time: CO2 (a) 298, (b) 323, (c) 373, (d) 423 K, and CH4 (e–h).
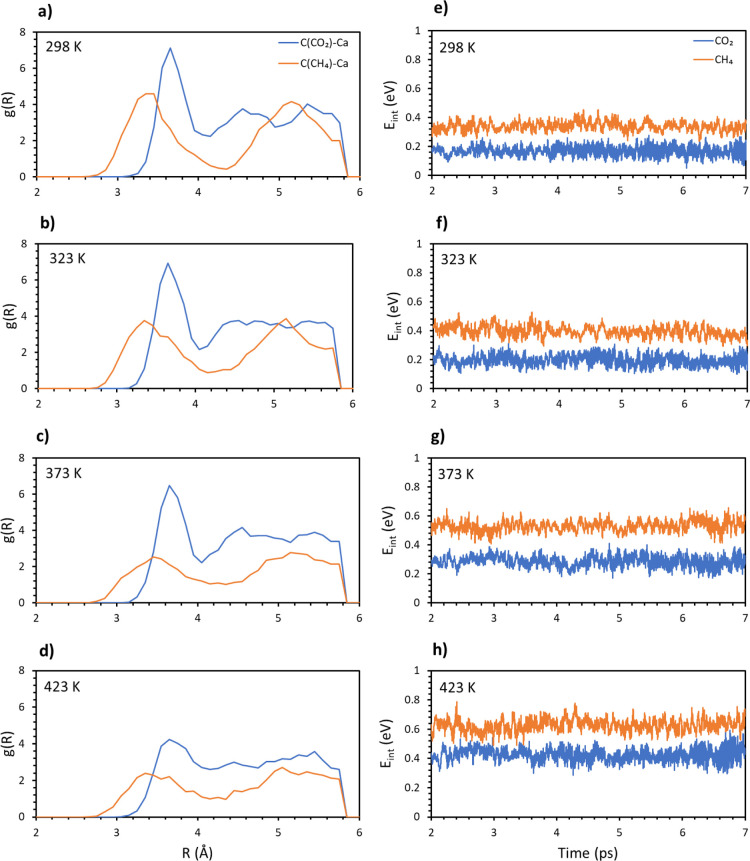
To have a better comparison between the two systems, the radial distribution function was computed between the molecular carbons and the calcium atoms in the top layer. The plots for carbon dioxide and methane are reported in the same panels for the different temperatures in Figure 3a–d. These plots give an estimation on how many C–Ca pairs are formed on average on the whole trajectories, at a certain distance. Therefore, a high and narrow peak is representative of many close contacts in a short range and is directly related to the strength of the interaction. A wide and low peak is instead representative of a loose contact between the atoms (gas molecule and surface in this case), which means a weaker interaction.
Figure 3.
Radial distribution function g(R) for the pairs C(CO2)/C(CH4) and topmost Ca. (a) 298, (b) 323, (c) 373, and (d) 423 K. Average interaction energy of carbon dioxide (blue) and methane (orange) vs time at different temperatures: (e) 298, (f) 323, (g) 373, and (h) 423 K.
These findings further confirm that CO2 is more stable on the surface at different temperatures. A distinct peak around 3.7 Å is practically unaltered for the three lowest temperatures, only decreasing in intensity and broadening at 423 K. A similar peak (3.3 Å) is present for methane at a lower distance, showing that adsorbed methane gets closer to the surface, but it is important to note that a lower distance does not mean a stronger interaction. In fact, methane peaks are generally less intense and wider compared to dioxide, where electrostatic attraction between molecular oxygens and the calcium atoms in the top layer strengthens the adsorption.34 It is important to note that both the carbon distance and the radial distribution function are averaged on the four trajectories. For this reason, the two plots are not directly comparable, as the peaks in the latter can be found at different distances compared to the former. Nonetheless, they both yield important details of the examined system.
This conclusion is consistent with the measurement of the interaction energy as a function of time. It must be noted that all the quantities involved in the computation are negative, while the final value for Eint is positive. This means that the higher the value, the smaller the interaction of the adsorbate with the surface. In Figure 3e–h, this quantity is plotted as an average along the different trajectories, and the values for carbon dioxide and methane are put one against the other over the whole range of temperatures. Clearly, carbon dioxide always interacts stronger with the surface, independent of the temperature. Moreover, it is possible to observe that the energy gradually increases (lower interaction) for methane, while it is quite stable for carbon dioxide until 423 K, when there is a sudden increase of the values. This agrees with our previous analysis because methane is not stably adsorbed on the surface even at the lowest temperature, with the interaction getting weaker as the temperature increases. On the other hand, carbon dioxide is quite stable on the surface up to 373 K. After this temperature, the interaction is absent, and the molecules easily leave the surface.
Mixed CO2/CH4 System
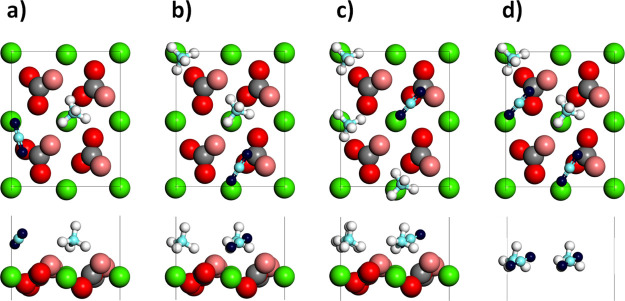
After the pure gas, mixed compositions were considered, and simulations were carried out with different numbers of carbon dioxide and methane present at the same time. In particular, the CO2/CH4 relative numbers were: 1:1, 1:2, and 1:3. The molecules adsorbed directly to the surface and the system was then let free to evolve. A representation of one of the starting configurations for the studied system is shown in Figure 4a–c. For completeness, a gas layer of 2CO2 and 2CH4 was also considered. This case is represented in Figure 4d and will be treated in the next section.
Figure 4.
Top- and side-views of one of the starting configurations for the mixed composition systems with different numbers of CO2 and CH4 molecules adsorbed at the same time: (a) 1:1, (b) 1:2, and (c) 1:3. (d) Gas layer with 2CO2 and 2CH4 molecules. The molecules are positioned at ∼6 Å from the surface, to study the adsorption pattern of a gas layer. For the color scheme, see Figure 1.
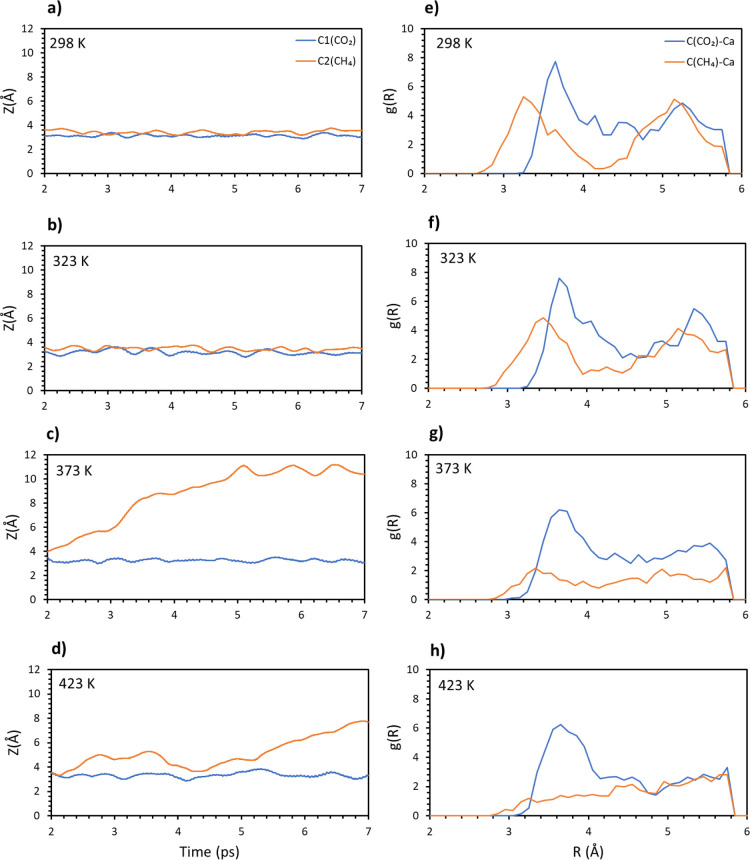
The first case considered was a single carbon dioxide molecule adsorbed together with a methane molecule. The averaged coordinates of the molecular carbons have been plotted versus the time of the simulations along the whole range of temperatures, from 298 to 423 K. The results of this analysis are reported in Figure 5a–d. From the plots, both molecules adsorb strongly on the surface up to 323 K. At higher temperatures, on the other hand, methane immediately leaves the surface. This result is not surprising because it has been already confirmed that high temperature affects the adsorption of carbon dioxide to a less extent compared to the hydrocarbon. After the distance, the radial distribution has been analyzed. The average result from the different trajectories is plotted in Figure 5e–h. Very similar plots are retrieved for both 298 and 323 K, with the curve for carbon dioxide slightly broadening around the lowest peak and narrowing around the highest peak. A general broadening is instead found for methane. For temperatures higher than 323 K, all the peaks get lower and broader, but the effect is especially dramatic for methane, for which the peaks’ heights are reduced to half their values and the whole curve is almost flat. At 423 K, the carbon dioxide plot gets broader around the lowest peak, while methane presents a very similar profile to the one obtained at 373 K. These results hint to the fact that while temperatures higher than 373 K have little effect on methane extraction, they could negatively affect carbon dioxide adsorption.
Figure 5.
Carbon (CO2 and CH4) distances from the surface vs time for the 1:1 composition at different temperatures: (a) 298, (b) 323, (c) 373, and (d) 423 K. Radial distribution function of the molecular carbon–topmost calcium pair for the 1:1 composition. Different temperatures have been considered: (e) 298, (f) 323, (g) 373, and (h) 423 K.
Finally, the interaction energy has been computed (see Supporting Information Figure S1). Consistent with the radial distribution function, the energy is very similar for both 298 and 323 K, around 0.7–0.8 eV. After this temperature, there is a neat increase of this value, showing a dramatic reduction of the interaction of the adsorbates with the surface, up to ∼1.2 eV.
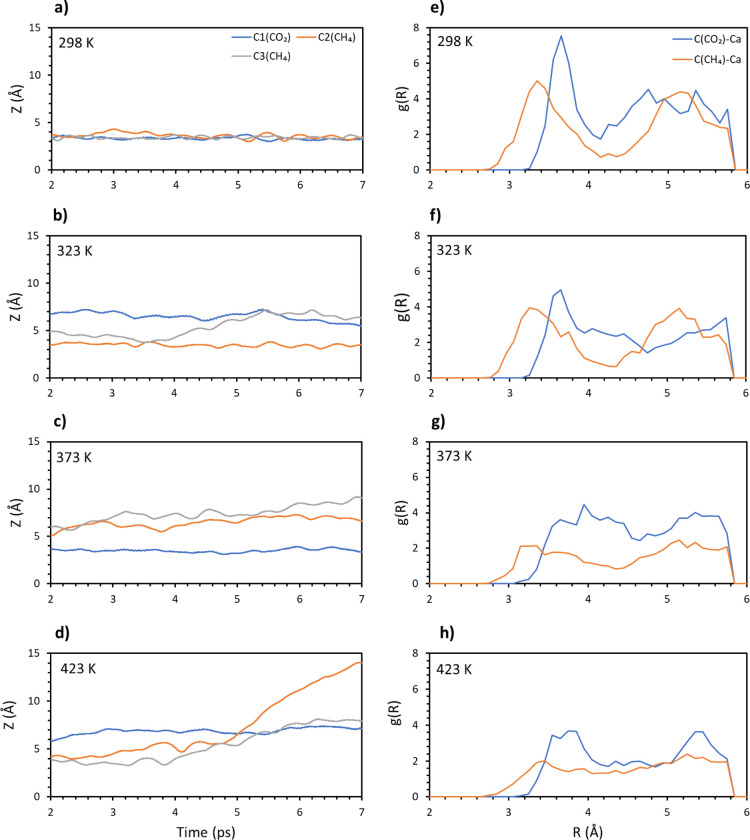
A second methane molecule was added to the system, to a composition of 1CO2/2CH4. Again, the distance of the carbon atoms in the gas molecule from the surface was analyzed versus time. The results are shown in Figure 6a–d. The addition of the second methane renders the system quite unstable compared to the previous case. In fact, at 323 K, carbon dioxide appears to be in competition with one of the methane molecules, with both molecules keeping a certain distance from the surface. On the other hand, the second methane molecule appears to be adsorbed stably on the surface and overall, no molecule is found at a distance larger than 5 Å. Once we reach 373 K, carbon dioxide strongly binds to the surface and both methane molecules leave the surface. Finally, at 423 K, all the molecules are quite far from the surface. After the analysis of the distance, the radial distribution function has been computed and the results are reported in Figure 6e–h. Raising the temperature to 323 K negatively affects the adsorption of carbon dioxide while on average it has little effect on methane. On the other hand, increasing the temperature past this value completely destabilizes methane, the plot of which is characterized by a low intensity and a broad profile. Once 423 K has been reached, carbon dioxide interaction with the surface gets weaker, while methane is not affected in a meaningful way.
Figure 6.
Carbon (CO2 and CH4) distances from the surface vs time for the 1:2 composition at different temperatures: (a) 298, (b) 323, (c) 373, and (d) 423 K. Radial distribution function of the molecular carbon–topmost calcium pair for the 1:2 composition. Different temperatures have been considered: (e) 298, (f) 323, (g) 373, and (h) 423 K.
The results obtained are also in agreement with the interaction energy (Supporting Information Figure S2), where a net increase in the values is registered with the increase of temperature, starting from 0.4 eV for 298 K, up to 0.8 eV for 423 K. This is consistent with the previous analysis, where each new temperature dramatically changes the shape and area of the plots.
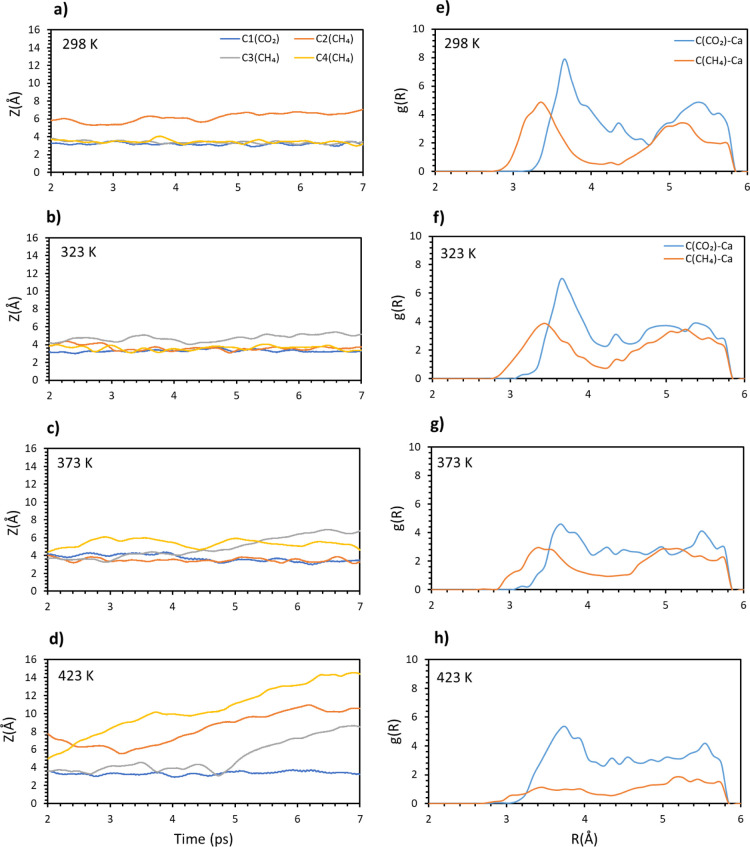
Next, a third methane molecule was added to obtain a 1(CO2)/3(CH4) composition. In Figure 7a–d, the distance of the molecular carbons is plotted versus time at different temperatures. The full coverage somewhat stabilizes the adsorbates because no molecule gets too far from the surface. At 298 K, one methane is quite distant while the other gas molecules are quite stable, while at 323 K, all molecules are closer to the surface, but the downside is that the whole system looks quite unstable. Methane interaction is overall weaker than carbon dioxide interaction, up until 423 K. Once the maximum temperature is reached, all the methane leaves while carbon dioxide is bound stably on the surface.
Figure 7.
Carbon (CO2 and CH4) distances from the surface vs time for the 1:3 composition at different temperatures: (a) 298, (b) 323, (c) 373, and (d) 423 K. Radial distribution function of the molecular carbon–topmost calcium pair for the 1:3 composition. Different temperatures have been considered: (e) 298, (f) 323, (g) 373, and (h) 423 K.
Once again, the radial distribution function has been analyzed and plotted in Figure 7e–h. Carbon dioxide is characterized by higher peaks compared to methane, but these are negatively affected once the temperature reaches 323 K, as for the previous cases. This time around, the higher temperature affects carbon dioxide much more compared to methane, as shown by the plot at 373 K (Figure 7g), while methane looks little affected. Opposite behavior is found instead for 423 K, where the methane plot is quite broad and is characterized by a much lower intensity; on the other hand, carbon dioxide radial distribution looks unaffected by the increased temperature.
As for the previous cases, the interaction energy has been also investigated (see Supporting Information Figure S3). The energy profile looks mostly unaltered up to 323 K. An increase in temperature dramatically increases the energy, with the effect especially evident for 423 K, where the obtained value is double compared to 298 K.
Overall, a positive effect is obtained in all the analyzed cases. In fact, not only carbon dioxide always interacts stronger with the surface compared to methane, but also increasing the temperature generally improves this effect. This is true up to 375 K. Once this threshold is reached, different results can be obtained depending on the concentration. For low to mid concentrations, the maximum efficiency has been already reached, and further increasing the temperature negligibly affects methane desorption, while carbon dioxide drastically decreases its interaction with the surface (e.g., g and h panels of Figure 6). On the other hand, efficiency can be still improved for the full coverage system, where the maximum productivity is achieved at 423 K.
Gas Layer
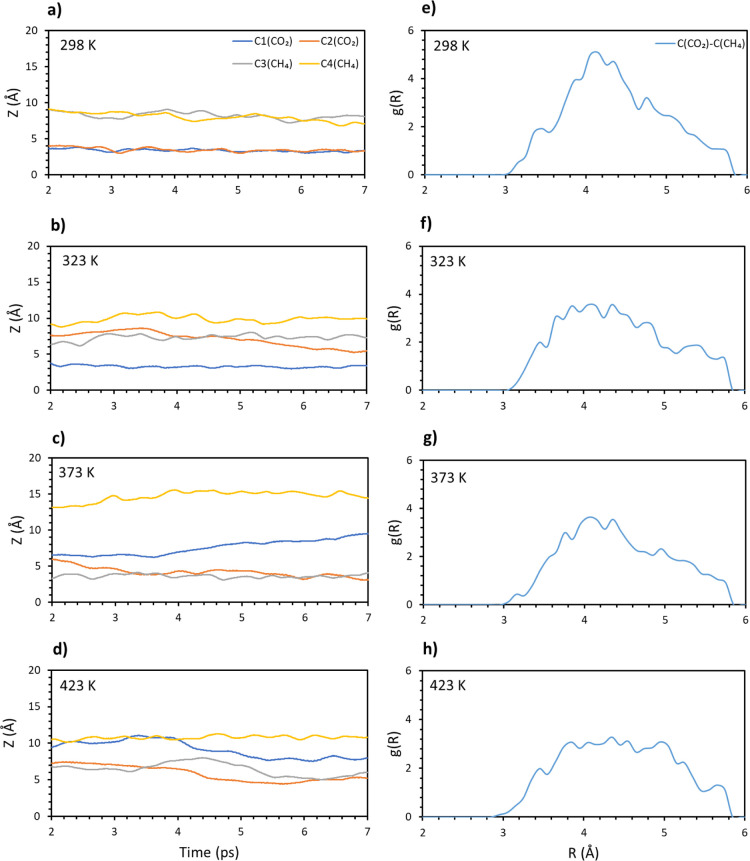
To have a more complete picture, the presence of a mixed gas layer was also studied. To do so, two methane and two carbon dioxide molecules have been positioned at ∼6 Å from the surface (see Figure 4d). In this way, they are not directly adsorbed to the surface, but they are still affected by it. This setting was studied in the whole temperature range and the distance of the molecular carbon from the surface has been plotted versus the time. The results are shown in Figure 8a–d. At the lowest temperature, both CO2 molecules are stably adsorbed on the surface, while both methane molecules are found at a large distance from the surface. However, methane showed a certain stability on the surface at low temperature. For 323 K, all the molecules but one dioxide tend to leave the surface, while at 373 K, methane and dioxide are equally divided between the surface and the gas layer. Finally, at 423 K, all the molecules tend to be quite far from the surface.
Figure 8.
Carbon (CO2 and CH4) distances from the surface vs time for the 2:2 gas layer composition at different temperatures: (a) 298, (b) 323, (c) 373, and (d) 423 K. Radial distribution function of the molecular C(CO2)/C(CH4) pair for the 2:2 gas layer composition. Different temperatures have been considered: (e) 298, (f) 323, (g) 373, and (h) 423 K.
The radial distribution function has been computed for the pair C(CO2) and C(CH4), and reported in Figure 8e–h. The results show a triangular shape with a broad peak around 4 Å, which gives an idea of the equilibrium distance between the gas molecules. This shape gets broader as the temperature increases, while the peak is still noticeable at 373 K. On the other hand, once 423 K is reached, no peak is present, and a plateau is reached.
Finally, the interaction energy has been investigated, where a step-like increase in values has been retrieved (see Supporting Information Figure S4). In fact, at 298 K, the interaction energy is around 0.3 eV, followed by 0.4 eV (323 K), 0.5 eV (373 K), and 0.6 eV (423 K). This result is consistent with the results of previous analysis, where each increase in temperature greatly affects the system.
Conclusions
Ab initio molecular dynamics simulations of CH4 and CO2 have been carried out on the calcite (104) surface. Pure and mixed compositions have been addressed, as well as different temperatures ranging from 298 to 423 K. When considering pure compositions, carbon dioxide shows great stability to the point that only one molecule leaves the surface at the highest temperature. On the other hand, one methane molecule already desorbs at temperature as low as 298 K, with a second one detaches from the surface at 423 K. This shows that, overall, the full coverage weakens the stability of methane on the surface. When a mixed composition is considered, and full coverage is not achieved (1:1 and 1:2), the following behavior has been found. Carbon dioxide binds stronger than methane at 298 K, but this effect is hindered at intermediate temperature like 323 K. At 373 K instead, carbon dioxide is bound stronger to the surface, while methane reaches its lowest stability. Finally, at 423 K, carbon dioxide interaction is greatly affected compared to methane. A different result is retrieved for full coverage instead (1CO2/3CH4), where both adsorbates are little affected up to 373 K, with carbon dioxide in a more evident way. At 423 K, methane completely leaves the surface, while carbon dioxide interaction is unaffected. These results hint that for low to medium concentrations, a temperature of 373 K could determine the best efficiency, as methane interaction is quite weak and carbon dioxide binds strong on the surface. Raising the temperature further disrupts carbon dioxide interaction, but no effect on methane adsorption is observed. This is in agreement with the experimental findings of Eliebd et al.,24 where the uptake for methane reaches is the lowest point at 373 K. A further increase in temperature does not affect CH4 uptake in a meaningful way, while it decreases the uptake of carbon dioxide. On the other hand, a full coverage composition takes advantage of the highest temperature; otherwise, the adsorbates tend to stick to the surface. Finally, when considered a 2:2 gas layer, carbon dioxide tends to adsorb preferentially to the surface, while methane keeps floating above it. This is valid over the whole range of temperatures and it is an interesting result because once methane is desorbed from the surface, the chance of it being adsorbed back is quite low. Overall, the present study gives important guidelines to help designing an EGR process. In fact, temperatures higher than 373 K show little effect on the extraction of methane, while they can greatly hinder carbon dioxide adsorption on the surface. On the other hand, for low temperatures, carbon dioxide stabilizes methane on the surface, and possibly weakens its interaction with the surface for intermediate temperatures such as 323 K. Composition also affects the whole process in very different ways: if full coverage is reached, 423 K shows a better efficiency compared to 373 K.
Computational Methods
Ab initio molecular dynamics simulations were carried out with the VASP package version 5.4.4, and PBCs were applied. Projector augmented wave (PAW) pseudopotentials36,37 were used together with the revised version38 of the PBE exchange–correction functional39 for all the elements involved. To simulate the system comprising the clean surface and the different adsorbates, dispersion forces were also included through the semiempirical correction by Grimme, DFT-D3.40
Calcite is characterized by a hexagonal system and a R3̅C space group. From the crystallography data, it is possible to retrieve the dimensions of the bulk lattice: a = b = 4.990 Å and c = 17.061 Å.41 Starting from these values, the structure was optimized with a cut-off of 367.69 eV, and the new lattice parameters were 5.088 × 4.407 × 17.133 Å. After bulk relaxation, a slab was built cleaving the crystal along the (104) direction, as this termination possesses the lowest surface energy.42 This means that this surface is expected to be the most abundant in a real sample, thereby representing the best model for this work. For the thickness, three layers were considered, with the bottom layer fixed to mimic the bulk crystal. A 1 × 2 × 1 supercell was employed and a vacuum of 20 Å was added to avoid interaction with neighboring cells. The final dimensions of the simulation cell turned out to be 8.194 × 10.177 × 27.736 Å.
A different number of molecules were adsorbed on the surface, being CO2, CH4, or both, to mimic pure or mixed gases. A total of four gas molecules was considered because this allowed for reaching the full coverage; in fact, because of the size of the sample, a fifth molecule could not directly interact with the surface and it would end up on a second adsorbate layer. Regarding the k points, all simulations were carried out employing the single GAMMA point. As general parameters, the Nose–Hoover thermostat in the VASP default version was applied. This means that the Q fictional mass is chosen in a way that the period of the thermostat is 40 timesteps.
As for the timestep of the simulations, 0.5 fs was chosen. Because no chemical reactions are expected as confirmed by a previous literature work,34 the mass of hydrogens was increased from 1 to 2u in order to reduce the frequency of the vibrations, so that the chosen timestep can be considered large enough to obtain reliable results. This method is commonly employed in other studies.43
Before considering the whole system, the temperature of the surface was first gradually increased to 200 K in three steps of 1 ps each (50, 100, and 200 K). This was done to gradually increase the temperature of the system to avoid nonrealistic response. For the length of the simulations, a total of 14 × 103 steps were considered, corresponding to total simulation length of 7 ps. To reach equilibrium, the system is let free to evolve for the first 2 ps; therefore, the analysis will be limited to the final 5 ps of the trajectories.
Four different temperatures were studied: 298, 323, 373, and 423 K. Because the starting configuration affects the evolution of the trajectory, four simulations with different initial atomic coordinates have been carried out for each case, characterized by the same temperature and composition. The combination of the resulting trajectories has been then analyzed in the following way: first, the distance from the surface of the molecular carbons was observed as a function of time. This gives an idea on how strong the adsorbates interact with the surface and how molecules of the same or different types affect such interaction. Second, the radial distribution function was studied considering the pair C(CO2/CH4)–Ca(top layer). This allowed for the study of effects, which are averaged along the whole trajectory. Finally, the interaction energy versus time was computed with the following formula
| 1 |
where Esys is the total energy of the system. ECO2 and ECH4 are the energy of the isolated gas molecules, while Eslab is the energy of the isolated slab of calcite. All the energies of the isolated compounds are computed after geometry optimization, as this procedure is commonly employed for this kind of reference. Finally, n1 and n2 are the total number of the gas molecules, CO2 and CH4, respectively.
Acknowledgments
The authors would like to acknowledge the support of Qatar National Research Fund (a member of Qatar Foundation) through Grant # NPRP10-0125-170235. The findings achieved herein are solely the responsibility of the authors. The authors would like to thank Texas A&M University in Qatar for the use of their computational resources.
Supporting Information Available
The Supporting Information is available free of charge at https://pubs.acs.org/doi/10.1021/acsomega.0c04694.
Interaction energy versus time for the mixed compositions 1CO2/1CH4, 1CO2/2CH4, 1CO2/3CH4, and gas-phase 2CO2/2CH4. Four panels in the pictures represent the different temperatures: (a) 298, (b) 323, (c) 373, and (d) 423 K (PDF)
The authors declare no competing financial interest.
Supplementary Material
References
- Global CO2 levels. https://www.co2levels.org (accessed November, 21, 2020).
- Le Quéré C.; Andrew R. M.; Friedlingstein P.; Sitch S.; Hauck J.; Pongratz J.; Pickers P. A.; Korsbakken J. I.; Peters G. P.; Canadell J. G.; et al. Global Carbon Budget. Earth Syst. Sci. Data 2018, 10, 2141–2194. 10.5194/essd-10-2141-2018. [DOI] [Google Scholar]
- Koytsoumpa E. I.; Bergins C.; Kakaras E. The CO2 economy: Review of CO2 capture and reuse technologies. J. Supercrit. Fluids 2018, 132, 3–16. 10.1016/j.supflu.2017.07.029. [DOI] [Google Scholar]
- Bhattacharyya D.; Miller D. C. Post-combustion CO2 capture technologies — a review of processes for solvent-based and sorbent-based CO2 capturePost-combustion CO 2 capture technologies - a review of processes for solvent-based and sorbent-based CO 2 capture. Curr. Opin. Chem. Eng. 2017, 17, 78–92. 10.1016/j.coche.2017.06.005. [DOI] [Google Scholar]
- Tapia J. F. D.; Lee J.-Y.; Ooi R. E. H.; Foo D. C. Y.; Tan R. R. A review of optimization and decision-making models for the planning of CO2 capture, utilization and storage (CCUS) systems. Sustain. Prod. Consum. 2018, 13, 1–15. 10.1016/j.spc.2017.10.001. [DOI] [Google Scholar]
- Senftle T. P.; Carter E. A. The holy grail: chemistry enabling an economically viable CO2 capture, utilization, and storage strategy. Accounts Chem. Res. 2017, 50, 472–475. 10.1021/acs.accounts.6b00479. [DOI] [PubMed] [Google Scholar]
- Ho H.-J.; Iizuka A.; Shibata E.; Tomita H.; Takano K.; Endo T. CO2 Utilization via Direct Aqueous Carbonation of Synthesized Concrete Fines under Atmospheric Pressure. ACS Omega 2020, 5, 15877–15890. 10.1021/acsomega.0c00985. [DOI] [PMC free article] [PubMed] [Google Scholar]
- Haszeldine R. S. Carbon capture and storage: how green can black be?. Science 2009, 325, 1647–1652. 10.1126/science.1172246. [DOI] [PubMed] [Google Scholar]
- Wee J.-H. A review on carbon dioxide capture and storage technology using coal fly ash. Appl. Energy 2013, 106, 143–151. 10.1016/j.apenergy.2013.01.062. [DOI] [Google Scholar]
- Bui M.; Adjiman C. S.; Bardow A.; Anthony E. J.; Boston A.; Brown S.; Fennell P. S.; Fuss S.; Galindo A.; Hackett L. A.; et al. Carbon capture and storage (CCS): the way forward. Energy Environ. Sci. 2018, 11, 1062–1176. 10.1039/c7ee02342a. [DOI] [Google Scholar]
- de Coninck H.; Benson S. M. Carbon dioxide capture and storage: issues and prospects. Annu. Rev. Environ. Resour. 2014, 39, 243–270. 10.1146/annurev-environ-032112-095222. [DOI] [Google Scholar]
- Zhou X.; Apple M. E.; Dobeck L. M.; Cunningham A. B.; Spangler L. H. Observed response of soil O2 concentration to leaked CO2 from an engineered CO2 leakage experiment. Int. J. Greenhouse Gas Control 2013, 16, 116–128. 10.1016/j.ijggc.2013.03.005. [DOI] [Google Scholar]
- Beckwith R. Carbon capture and storage: a mixed review. J. Petrol. Technol. 2011, 63, 42–45. 10.2118/0511-0042-jpt. [DOI] [Google Scholar]
- Rogelj J.; McCollum D. L.; Reisinger A.; Meinshausen M.; Riahi K. Probabilistic cost estimates for climate change mitigation. Nature 2013, 493, 79–83. 10.1038/nature11787. [DOI] [PubMed] [Google Scholar]
- Class H.; Ebigbo A.; Helmig R.; Dahle H. K.; Nordbotten J. M.; Celia M. A.; Audigane P.; Darcis M.; Ennis-King J.; Fan Y.; et al. A benchmark study on problems related to CO2 storage in geologic formations. Comput. Geosci. 2009, 13, 409. 10.1007/s10596-009-9146-x. [DOI] [Google Scholar]
- Carroll S.; Carey J. W.; Dzombak D.; Huerta N. J.; Li L.; Richard T.; Um W.; Walsh S. D. C.; Zhang L.; et al. Review: Role of chemistry, mechanics, and transport on well integrity in CO2 storage environments. Int. J. Greenhouse Gas Control 2016, 49, 149–160. 10.1016/j.ijggc.2016.01.010. [DOI] [Google Scholar]
- Dai Z.; Middleton R.; Viswanathan H.; Fessenden-Rahn J.; Bauman J.; Pawar R.; Lee S.-Y.; McPherson B. An Integrated framework for optimizing CO2 Sequestration and enhanced oil recovery. Environ. Sci. Technol. Lett. 2014, 1, 49–54. 10.1021/ez4001033. [DOI] [Google Scholar]
- Cooney G.; Littlefield J.; Marriott J.; Skone T. J. Evaluating the climate benefits of CO2-enhanced oil recovery using life cycle analysis. Environ. Sci. Technol. 2015, 49, 7491–7500. 10.1021/acs.est.5b00700. [DOI] [PubMed] [Google Scholar]
- Henni A. Carbon Capture: Harnessing carbon dioxide in the middle east. J. Petrol. Technol. 2014, 66, 66–70. 10.2118/0614-0066-jpt. [DOI] [Google Scholar]
- Oldenburg C. M.; Pruess K.; Benson S. M. Process Modeling of CO2 Injection into natural gas reservoirs for carbon sequestration and enhanced gas recovery. Energy Fuels 2001, 15, 293–298. 10.1021/ef000247h. [DOI] [Google Scholar]
- Bachu S. Sequestration of CO2 in geological media: criteria and approach for site selection in response to climate change. Energy Convers. Manag. 2000, 41, 953–970. 10.1016/s0196-8904(99)00149-1. [DOI] [Google Scholar]
- Mamora D. D.; Seo J. G.. Enhanced gas recovery by carbon dioxide sequestration in depleted gas reservoirs. SPE Annual Technical Conference and Exhibition, San Antonio, Texas, 2002.
- Rani S.; Padmanabhan E.; Prusty B. K. Review of gas adsorption in shales for enhanced methane recovery and CO2 storage. J. Petrol. Sci. Eng. 2019, 175, 634–643. 10.1016/j.petrol.2018.12.081. [DOI] [Google Scholar]
- Eliebid M.; Mahmoud M.; Hussein I.; Elkatatny S.; Shawabkeh R.; Sultan A.; Al-Marri M. J. Impact of Surfactant on the Retention of CO2 and Methane in Carbonate Reservoirs. Energy Fuels 2018, 32, 5355–5363. 10.1021/acs.energyfuels.8b00213. [DOI] [Google Scholar]
- Hitchon B.; Gunter W. D.; Gentzis T.; Bailey R. T. Sedimentary basins and greenhouse gases: a serendipitous association. Energy Convers. Manag. 1999, 40, 825–843. 10.1016/s0196-8904(98)00146-0. [DOI] [Google Scholar]
- Tajnik T.; Bogataj L. K.; Jurač E.; Lasnik C. R.; Likar J.; Debelak B. Investigation of adsorption properties of geological materials for CO2 storage. Int. J. Energy Res. 2012, 37, 952–958. 10.1002/er.2901. [DOI] [Google Scholar]
- Eliebid M.; Mahmoud M.; Shawabkeh R.; Elkatatny S.; Hussein I. A. Effect of CO2 adsorption on enhanced natural gas recovery and sequestration in carbonate reservoirs. J. Nat. Gas Sci. Eng. 2018, 55, 575–584. 10.1016/j.jngse.2017.04.019. [DOI] [Google Scholar]
- Mahmoud M.; Carchini G.; Hussein I. A.; Shawabkeh R.; Eliebid M.; Al-Marri M. J. Effect of rock mineralogy on hot-CO2 injection for enhanced gas recovery. J. Nat. Gas Sci. Eng. 2019, 72, 133030. 10.1016/j.jngse.2019.103030. [DOI] [Google Scholar]
- Morse J. W.; Arvidson R. S.; Lüttge A. Calcium carbonate formation and dissolution. Chem. Rev. 2007, 107, 342–381. 10.1021/cr050358j. [DOI] [PubMed] [Google Scholar]
- Zhang M.; Li J.; Zhao J.; Cui Y.; Luo X. Comparison of CH4 and CO2 Adsorptions onto Calcite(10.4), Aragonite(011)Ca, and Vaterite(010)CO3 Surfaces: An MD and DFT Investigation. ACS Omega 2020, 5, 11369–11377. 10.1021/acsomega.0c00345. [DOI] [PMC free article] [PubMed] [Google Scholar]
- Ataman E.; Andersson M. P.; Ceccato M.; Bovet N.; Stipp S. L. S. Functional group adsorption on calcite: i. oxygen containing and nonpolar organic molecules. J. Phys. Chem. C 2016, 120, 16586–16596. 10.1021/acs.jpcc.6b01349. [DOI] [Google Scholar]
- Luo Q.; Pan Y.; Guo P.; Wang Z.; Wei N.; Sun P.; Liu Y. First-Principles Calculation of adsorption of shale gas on CaCO3 (100) surfaces. J. Appl. Biomater. Funct. Mater. 2017, 15, 45–51. 10.5301/jabfm.5000352. [DOI] [PMC free article] [PubMed] [Google Scholar]
- Hazen R. M.Chiral crystal faces of common rock-forming minerals. In Progress in Biological Chirality; Palyi G., Zucchi C., Caglioti L., Eds.; Elsevier, 2004; pp 137–151. [Google Scholar]
- Carchini G.; Hussein I.; Al-Marri M. J.; Shawabkeh R.; Mahmoud M.; Aparicio S. A theoretical study of gas adsorption on calcite for CO2 enhanced natural gas recovery. Appl. Surf. Sci. 2020, 504, 144575. 10.1016/j.apsusc.2019.144575. [DOI] [Google Scholar]
- Wlazło M.; Siklitskaya A.; Majewski J. A. Ab initio studies of carbon dioxide affinity to carbon compounds and minerals. Energy Procedia 2017, 125, 450–456. 10.1016/j.egypro.2017.08.152. [DOI] [Google Scholar]
- Blöchl P. E. Generalized separable potentials for electronic-structure calculations. Phys. Rev. B: Condens. Matter Mater. Phys. 1990, 41, 5414–5416. 10.1103/physrevb.41.5414. [DOI] [PubMed] [Google Scholar]
- Kresse G.; Joubert D. From ultrasoft pseudopotentials to the projector augmented-wave method. Phys. Rev. B: Condens. Matter Mater. Phys. 1999, 59, 1758–1775. 10.1103/physrevb.59.1758. [DOI] [Google Scholar]
- Zhang Y.; Yang W. Comment on generalized gradient approximation made simple. Phys. Rev. Lett. 1998, 80, 890. 10.1103/physrevlett.80.890. [DOI] [Google Scholar]
- Perdew J. P.; Burke K.; Ernzerhof M. Generalized gradient approximation made simple. Phys. Rev. Lett. 1996, 77, 3865–3868. 10.1103/physrevlett.77.3865. [DOI] [PubMed] [Google Scholar]
- Grimme S.; Antony J.; Ehrlich S.; Krieg H. A consistent and accurate ab initio parametrization of density functional dispersion correction (DFT-D) for the 94 elements H-Pu. J. Chem. Phys. 2010, 132, 154104. 10.1063/1.3382344. [DOI] [PubMed] [Google Scholar]
- Anthony J. W.; Bideaux R. A.; Bladh K. W.; Nichols M. C.. Handbook of Mineralogy V (Borates, Carbonates, Sulfates); Mineralogy Society of America: Chantilly, VA, US, 2003. [Google Scholar]
- de Leeuw N. H.; Parker S. C. Surface structure and morphology of calcium carbonate polymorphs calcite, aragonite, and vaterite: an atomistic approach. J. Phys. Chem. B 1998, 102, 2914–2922. 10.1021/jp973210f. [DOI] [Google Scholar]
- Lardge J. S.; Duffy D. M.; Gillan M. J. Investigation of the Interaction of water with the calcite (10.4) surface using ab initio simulation. J. Phys. Chem. C 2009, 113, 7207–7212. 10.1021/jp806109y. [DOI] [Google Scholar]
Associated Data
This section collects any data citations, data availability statements, or supplementary materials included in this article.


