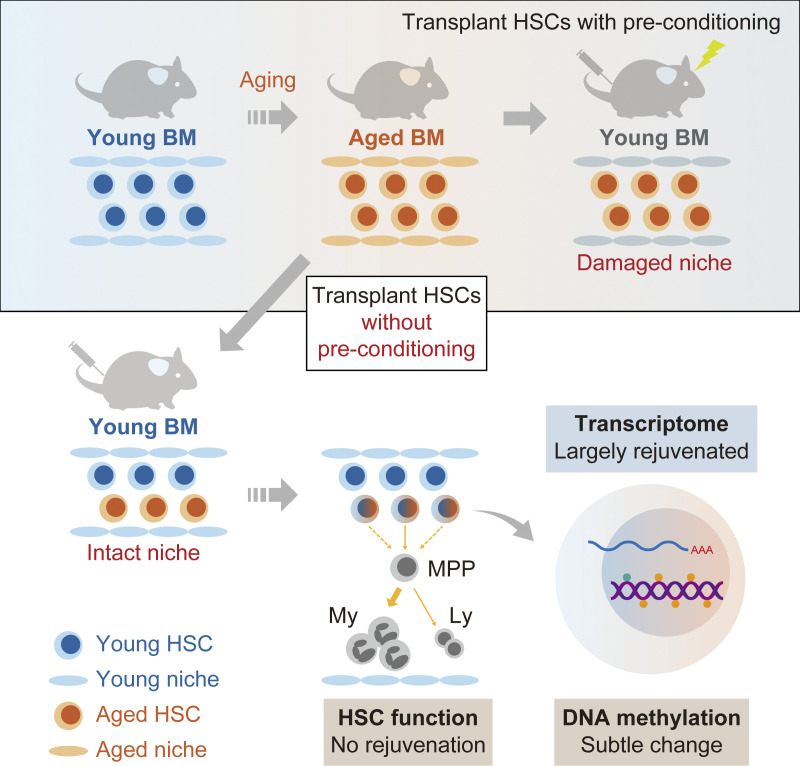
Kuribayashi et al. demonstrate that the engraftment of aged hematopoietic stem cells into intact young niche largely rejuvenates their transcriptional profile but does not restore their function, highlighting a key role for age-associated cell-intrinsic defects in HSC aging.
Abstract
Hematopoietic stem cells (HSCs) exhibit functional alterations, such as reduced regenerative capacity and myeloid-biased differentiation, with age. The HSC niche, which is essential for the maintenance of HSCs, also undergoes marked changes with aging. However, it has been technically challenging to directly evaluate the contribution of niche aging to age-associated HSC alterations without niche-damaging myeloablation in HSC transplantation assays. We herein transplanted an excess of aged HSCs into young mice without preconditioning. Although aged HSCs successfully engrafted in the intact young bone marrow niche, they poorly regenerated downstream progenitors and exhibited persistent myeloid-biased differentiation, resulting in no significant functional rejuvenation. Transcriptome and methylome analyses revealed that the young niche largely restored the transcriptional profile of aged HSCs, but not their DNA methylation profiles. Therefore, the restoration of the young niche is insufficient for rejuvenating HSC functions, highlighting a key role for age-associated cell-intrinsic defects in HSC aging.
Graphical Abstract
Introduction
Hematopoietic stem cells (HSCs) give rise to all lineages of blood cells throughout life. However, the capabilities of HSCs are markedly altered with aging, such as impaired regeneration, myeloid- and platelet-biased differentiation at the expense of functional lymphocyte production, and a higher propensity for myeloid malignancies (Oshima and Iwama, 2014; Akunuru and Geiger, 2016; Verovskaya et al., 2019). These changes are the consequence of time-dependent cell-intrinsic changes in HSCs and continuous exposure to cell-extrinsic stresses; however, the extent to which these factors contribute to HSC aging has not yet been clarified (de Haan and Lazare, 2018; Verovskaya et al., 2019). Aged HSCs are considered to harbor cell-intrinsic molecular changes that cannot be restored by young niche, as suggested by a previous study showing that aged HSCs transplanted into lethally irradiated young recipient mice showed functional impairments relative to young HSCs transplanted into young recipients (Dykstra et al., 2011). Conversely, young HSCs transplanted into lethally irradiated aged recipients engrafted worse than when transplanted into young recipients, indicating that age-associated cell-extrinsic changes affect the function of HSCs (Rossi et al., 2005; de Haan and Lazare, 2018). These findings highlight critical roles for cell-intrinsic and -extrinsic factors in the process of HSC aging. Nevertheless, irradiation-based preconditioning significantly alters the structure and functions of the bone marrow (BM) microenvironment (Hooper et al., 2009; Tikhonova et al., 2019), which preclude the possibility to precisely evaluate the direct contribution of age-related cell-extrinsic changes to HSC functions.
Specialized BM microenvironments, termed HSC niches, maintain HSC numbers and function through cellular interactions and secreted factors (Morrison and Scadden, 2014). The space for HSCs to occupy in BM is considered to be limited due to the small number of available niches, and since most of these niches are already occupied by endogenous HSCs, myeloablative preconditioning, such as irradiation and chemotherapy, is needed to vacate niches for transplanted HSCs (Nilsson et al., 1997; Shiozawa et al., 2008). However, irradiation and chemotherapy damages intact BM niches, as previously demonstrated (Hooper et al., 2009; Tikhonova et al., 2019). Irradiation triggers vessel dilation, permeability, and endothelial cell proliferation (Chen et al., 2019). We demonstrated that p53 was activated in BM endothelial cells following irradiation and chemotherapy, resulting in the dilation and collapse of vascular endothelial cells as well as reductions in perivascular mesenchymal stromal cell numbers (Si et al., 2018). Although these changes are transient, long-term defects in the BM vasculature after irradiation have not yet been clarified. Furthermore, lethal irradiation leaves persistent damages to the BM stroma. Multipotent BM stromal progenitor cells were lost and failed to spontaneously recover after irradiation. Compared with age-matched untreated controls, their levels were found to remain below 10% for at least 4 mo after irradiation (Abbuehl et al., 2017). Thus, it has been technically challenging to directly investigate the relationship between transplanted HSCs and intact niches. To overcome this limitation, previous studies employed anti–c-Kit monoclonal antibodies, which deplete HSCs from BM niches, thereby allowing donor HSC engraftment in immunodeficient mice (Czechowicz et al., 2007). Enhancements in Fc-mediated antibody effector activity through the blockade of CD47, a myeloid-specific immune checkpoint, further extended anti–c-Kit conditioning to fully immunocompetent mice (Chhabra et al., 2016). In contrast, Shimoto et al. (2017) recently reported that upon the transplantation of large numbers of HSCs into recipient mice without myeloablation, donor HSCs engrafted niches that had not been preoccupied by host HSCs and subsequently regenerated BM, which is consistent with previous findings (Bhattacharya et al., 2006; Westerhuis et al., 2011). Therefore, numerous empty HSC niches appear to be available for donor HSC engraftment and proliferation.
In the present study, we transplant an excess of aged HSCs into young recipient mice without preconditioning and evaluated the impact of the intact young niche on the functions, transcriptomes, and epigenome of aged HSCs.
Results and discussion
Characteristics of aged HSCs engrafted in the intact young niche
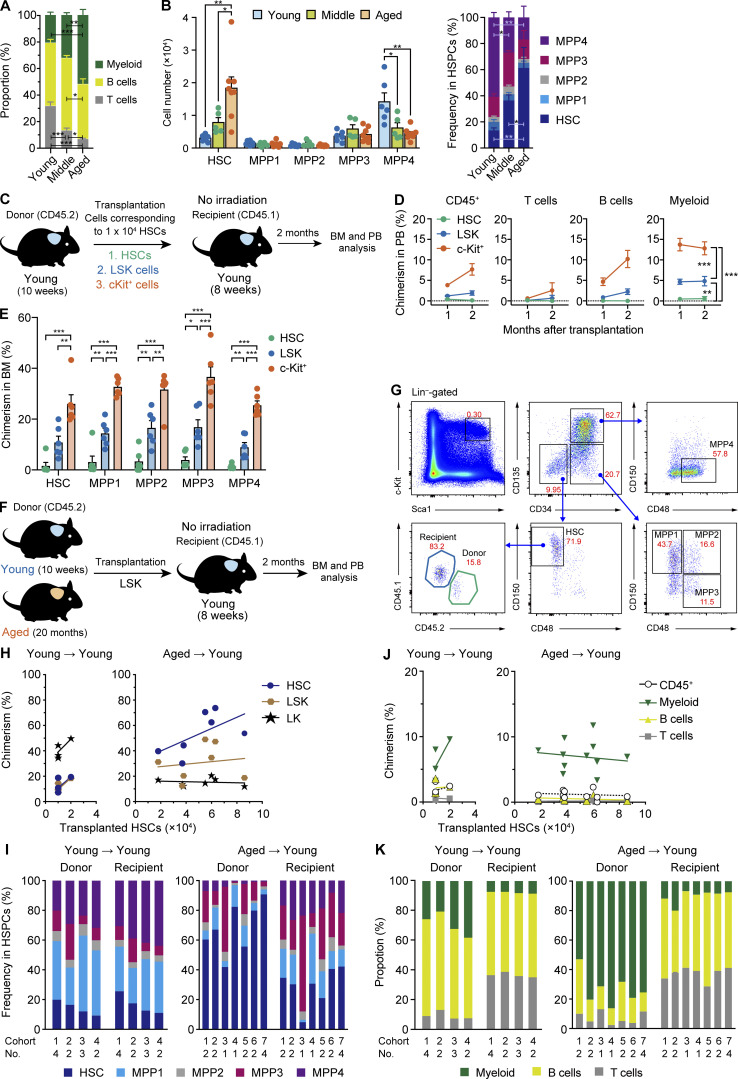
We initially assessed hematopoiesis in 8–10-wk-old (Young), 12-mo-old (middle aged; Middle), and 20–21-mo-old (Aged) mice and confirmed that the frequency of myeloid cells (Mac-1+ and/or Gr1+) significantly increased in peripheral blood (PB), while those of T cells (CD4+ or CD8+) and B cells (B220+) decreased with age (Fig. 1 A). We then investigated the following components of hematopoietic stem and progenitor cells (HSPCs) in BM: HSCs (CD150+ CD48− CD135− CD34− lineage− Sca-1+ c-Kit+ [LSK]), multipotent progenitor 1 (MPP1; CD150+ CD48− CD135− CD34+ LSK), MPP2 (CD150+ CD48+ CD135− CD34+ LSK), MPP3 (CD150− CD48+ CD135− CD34+ LSK), and MPP4 (CD150− CD48+ CD135+ CD34+ LSK; Cabezas-Wallscheid et al., 2014). As reported previously (Sudo et al., 2000; Geiger et al., 2013; Young et al., 2016; Elias et al., 2017), both the absolute number and frequency of HSCs significantly increased with age, whereas those of MPP4, which is lymphoid biased in differentiation, significantly decreased (Fig. 1 B).
Figure 1.
Hematopoiesis by aged HSCs engrafted in an unconditioned young niche. (A) The frequencies of myeloid (Mac-1+ and/or Gr-1+), B (B220+), and T (CD4+ or CD8+) cells in PB of Young, Middle, and Aged mice. (B) Cell numbers (left) and frequencies (right) of BM HSPCs. Data are shown as the mean ± SEM (n = 5–7, representative of two independent experiments). (C) Experimental strategy for the evaluation of engraftment efficiencies of HSPC fractions in the young niche. Purified 1 × 10⁴ HSCs and LSK and c-Kit+ cells that contained 1 × 10⁴ HSCs from 10-wk-old mice were transplanted into 8-wk-old mice without irradiation. (D) Chimerism of donor-derived hematopoietic cells in CD45+ (CD45.1+CD45.2) hematopoietic cells, myeloid, B, and T cells in PB of recipient mice (n = 6). (E) Chimerism of donor-derived cells in the BM HSCs and MPPs of recipient mice at 2 mo after transplantation (n = 6, pooled from three independent experiments). (F) Experimental strategy for the functional evaluation of aged HSCs in the young niche. Different numbers of LSK cells that contained 1–2 × 10⁴ HSCs from Young mice (Young HSCs) or LSK cells that contained 1.8–8.6 × 10⁴ HSCs from Aged HSCs were transplanted into 8-wk-old mice without irradiation. We used pooled donor HSCs collected from several mice. (G) Gating strategies to identify Young and Aged/Y HSCs and MPP1-4. The frequencies in total BM cells are indicated. (H) Chimerism of donor-derived cells in BM HSCs, LSK cells, and LK cells at 2 mo after transplantation. Each dot represents the average value of a single cohort consisting of one to four mice. The x axes indicate the numbers of HSCs that were contained in transplanted LSK cells. (I) Frequencies of donor- and recipient-derived HSCs and MPPs in BM cells, respectively. Data on the average value of each cohort consisting of one to four mice are shown in individual bars. (J) Chimerism of donor-derived hematopoietic cells in CD45+ (CD45.1+CD45.2) hematopoietic, myeloid, B, and T cells in PB of recipient mice. Each dot represents the average value of a single cohort consisting of one to four mice. The x axes indicate the numbers of HSCs that were contained in transplanted LSK cells. (K) Frequencies of donor- and recipient-derived myeloid, B, and T cells in PB cells, respectively. Data on the average value of each cohort consisting of one to four mice are shown in individual bars. Error bars represent SEM. *, P < 0.05; **, P < 0.01; ***, P < 0.001 by one-way ANOVA.
To evaluate the impact of the aged BM niche on phenotypic alterations in HSCs during aging, we attempted to switch the aged niche to the intact young niche by transplanting an excess of Aged HSCs into Young recipient mice without any preconditioning using a previously described method (Shimoto et al., 2017). We initially purified 1 × 10⁴ HSCs and LSK and c-Kit+ cells that contained 1 × 10⁴ HSCs from 10-wk-old mice and transplanted them into 8-wk-old mice without irradiation (Fig. 1 C). Two months after transplantation, we assessed the engraftment of donor cells in PB and BM. c-Kit+ cells established the highest chimerism in PB, followed by LSK cells. In contrast, HSCs were inefficient at repopulating hematopoiesis in nonconditioned recipient mice (Fig. 1, D and E). These results clearly demonstrated that the efficiencies of engraftment and repopulation significantly differed depending on the HSPC fractions in transplantation without preconditioning. The presence of hematopoietic progenitor cells may facilitate the engraftment of HSCs or the inclusion of various antibodies for purification may hamper the engraftment of HSCs. Based on these results, we subsequently performed following transplantation assays without preconditioning using Aged LSK or c-Kit+ cells.
We purified LSK cells from 10-wk-old and 20-mo-old mice and transplanted them at doses corresponding to 1–2 × 10⁴ and 1.8–8.6 × 10⁴ HSCs (CD150+ CD48− CD135− CD34− LSK), respectively, into Young recipient mice without myeloablation. We then allowed donor Young and Aged HSCs to repopulate in the Young recipients for 2 mo (hereafter referred to as Young/Y and Aged/Y HSCs, respectively; Fig. 1 F). Consistent with previous findings, we observed the successful engraftment of donor HSCs in Young recipient mice at 2 mo after transplantation (Fig. 1, G–K). In BM, Aged/Y HSCs showed higher chimerism in the HSC compartment than in the downstream LSK and lineage−c-Kit+ (LK) compartments, in contrast to Young/Y HSCs for which chimerism was higher in the LK compartments (Fig. 1 H). Donor-derived HSPCs were relatively balanced by the HSC and MPP1 to MPP4 compartments in Young/Y HSC recipients, indicating that transplantation without preconditioning does not affect the HSC differentiation capacity (Fig. 1 I). In contrast, donor-derived HSPCs were dominated by mostly immature HSCs in Aged/Y HSC recipients, indicating that Aged HSCs poorly differentiated into the MPP stage (Fig. 1 I). Correspondingly, Young/Y HSCs established higher chimerism in PB than Aged HSCs (Fig. 1 J). In comparisons with recipient HSCs, Aged/Y HSCs predominantly showed markedly myeloid-biased differentiation in PB, whereas Young/Y HSCs showed lymphoid-dominant repopulation (Fig. 1 K). These results revealed that long-term aging processes impair the differentiation potential of HSCs to MPPs, which may underlie the accumulation of HSCs in Aged mice. Furthermore, the age-related differentiation defect in HSCs did not appear to be restored, even after transfer to the young BM niche.
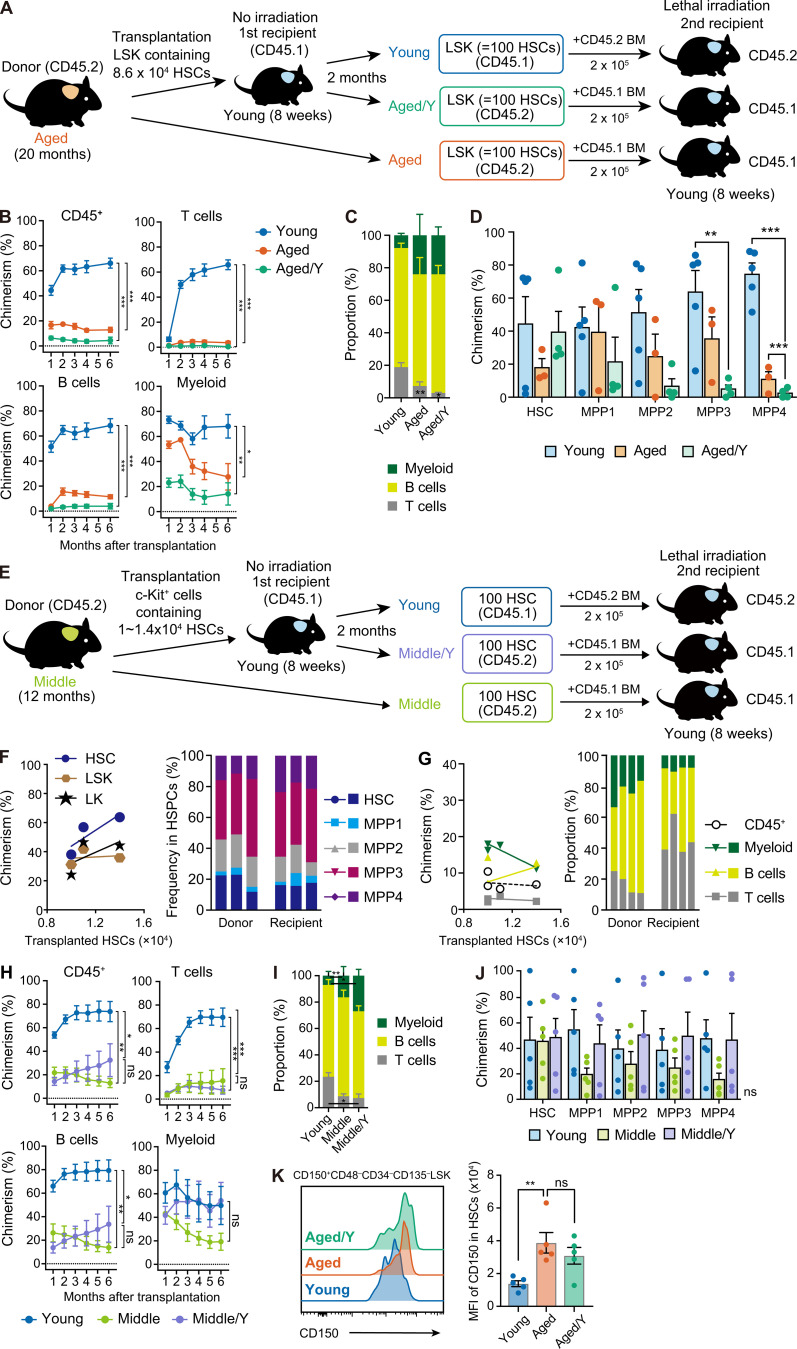
To examine the repopulating capacity of Aged/Y HSCs in more detail, we performed secondary BM transplantation (Fig. 2 A). We harvested donor-derived Aged/Y and recipient-derived host Young LSK cells containing 100 HSCs from primary recipient mice and transplanted them into lethally irradiated secondary recipients with 2 × 10⁵ competitor BM cells. We also transplanted Aged LSK cells containing 100 HSCs as controls. The repopulating capacity of Aged/Y HSCs was significantly weaker than that of host Young HSCs. The contribution of Aged/Y HSCs to PB cells was not greater than that of Aged HSCs (Fig. 2, B and C), indicating that Aged HSCs were not functionally rejuvenated by the young niche in primary recipients. A BM analysis also revealed that the defective differentiation of Aged HSCs to MPPs observed in primary Young recipients was maintained after secondary transplantation (Fig. 2 D). We repeated the secondary BM transplantation following the BM transplantation without preconditioning using 100 Young, Aged/Y, and Aged HSCs per recipient and obtained the same results (data not shown). In contrast, 12-mo-old HSCs that engrafted in the young niche (Middle/Y HSCs) showed differentiation profiles of HSPCs between Young/Y and Aged/Y HSCs in BM (Fig. 2, E and F) and moderate myeloid-biased repopulation in PB (Fig. 2 G). Middle/Y HSCs showed the moderate recovery of repopulating capacity, but not of biased differentiation, in secondary recipients from that of control Middle HSCs (Fig. 2, H–J). These results demonstrate that the intact young BM niche tended to partially rejuvenate the repopulating capacity of Middle but not Aged HSCs.
Figure 2.
Persistent functional defects in Aged HSCs in the young niche. (A) Experimental strategy for the functional evaluation of Aged HSCs in the young niche. Aged LSK cells containing 8.6 × 10⁴ HSCs were transplanted into Young recipient mice without irradiation. Donor-derived (Aged/Y) and host (Young) LSK cells containing 100 HSCs were purified from primary recipients at 2 mo after transplantation and then transplanted into lethally irradiated 8-wk-old secondary recipient mice along with 2 × 10⁵ BM competitor cells. Freshly isolated Aged LSK cells containing 100 HSCs were also transplanted as controls. (B) Chimerism of donor-derived hematopoietic cells in CD45+ (CD45.1+CD45.2) hematopoietic, myeloid, B, and T cells in PB of recipient mice receiving Young, Aged, or Aged/Y LSK cells (n = 3–5). (C) Frequencies of myeloid, B, and T cells in donor-derived PB cells 6 mo after transplantation (n = 3–5). (D) Chimerism of donor-derived HSPCs in BM HSCs and MPPs in recipient mice 6 mo after transplantation (n = 3–5, representative of three independent experiments). (E) Experimental strategy for the functional evaluation of Middle HSCs in the young niche. c-Kit+ cells that contained ∼1.0–1.4 × 10⁴ HSCs from 12-mo-old mice were transplanted into 8-wk-old mice without irradiation. 2 mo after transplantation, hematopoietic cells derived from engrafted Middle HSCs (Middle/Y HSCs) and host HSCs (Young HSCs) were analyzed (F and G; data were pooled from four independent experiments). At the same time, 100 Middle/Y and host (Young) HSCs purified from primary recipients were transplanted into lethally irradiated 8-wk-old secondary recipient mice along with 2 × 10⁵ BM competitor cells. Freshly isolated HSCs from 12-mo-old mice (Middle HSCs) were also transplanted as controls (H–J; representative data from two independent experiments are shown). (F) Chimerism of Middle HSC-derived cells in BM HSCs, LSK cells, and LK cells at 2 mo after transplantation (n = 4). The x axes indicate the numbers of HSCs that were contained in transplanted c-Kit+ cells (left panel). Frequencies of Middle HSCs-derived and recipient HSCs and MPPs in the HSCs/MPPs fraction are shown (right panel). Data from each recipient mouse are shown in individual bars. (G) Chimerism of Middle HSC–derived hematopoietic cells in CD45+ (CD45.1+CD45.2) hematopoietic cells, myeloid, B, and T cells in PB of recipient mice (n = 4). The x axes indicate the numbers of HSCs that were contained in transplanted c-Kit+ cells (left panel). Frequencies of donor- (Middle HSCs) and recipient-derived myeloid, B, and T cells in PB (right panel). Data from each recipient mouse are shown in individual bars. (H) Chimerism of donor-derived hematopoietic cells in CD45+ (CD45.1+CD45.2) hematopoietic, myeloid, B, and T cells in PB of recipient mice receiving Young, Middle/Y, and Middle HSCs (n = 5). (I) Frequencies of myeloid, B, and T cells in donor-derived PB cells 6 mo after transplantation in H (n = 5). (J) Chimerism of donor-derived cells in BM HSCs and MPPs in recipient mice 6 mo after transplantation in H (n = 5). (K) CD150 expression in Aged/Y HSCs in recipient mice 2 mo after transplantation in D. Representative histograms showing CD150 expression in the HSC gate (left panel) and mean fluorescence intensity (MFI) of CD150 shown as mean ± SEM (n = 5) are depicted. *, P < 0.05; **, P < 0.01; ***, P < 0.001 by one-way ANOVA. Data are shown as the mean ± SEM. *, P < 0.05; **, P < 0.01; ***, P < 0.001; ns, not significant by a one-way ANOVA.
One of the major phenotypes of Aged HSCs that was not resolved in the young niche was the myeloid bias in differentiation. Previous studies reported a significant increase in the frequency of myeloid-biased HSCs with age (Muller-Sieburg et al., 2004; Beerman et al., 2010; Challen et al., 2010; Dykstra et al., 2011). Aging is associated with progressive increases in CD150high myeloid-biased HSCs (Beerman et al., 2010). Aged HSCs showed higher expression levels of CD150 than Young HSCs, indicating that the majority of Aged HSCs transplanted were intrinsically myeloid biased. Aged/Y HSCs at 2 mo after transplantation tended to decrease their expression levels but still retained higher levels than Young HSCs (Fig. 2 K). These results suggest that Aged HSCs underwent limited rejuvenation in terms of CD150 expression and retained myeloid-biased differentiation properties even after engraftment in an unconditioned young niche. Since myeloid-biased HSCs were also present in Young mice, the young niche may not have markedly altered the lineage output of Aged HSCs.
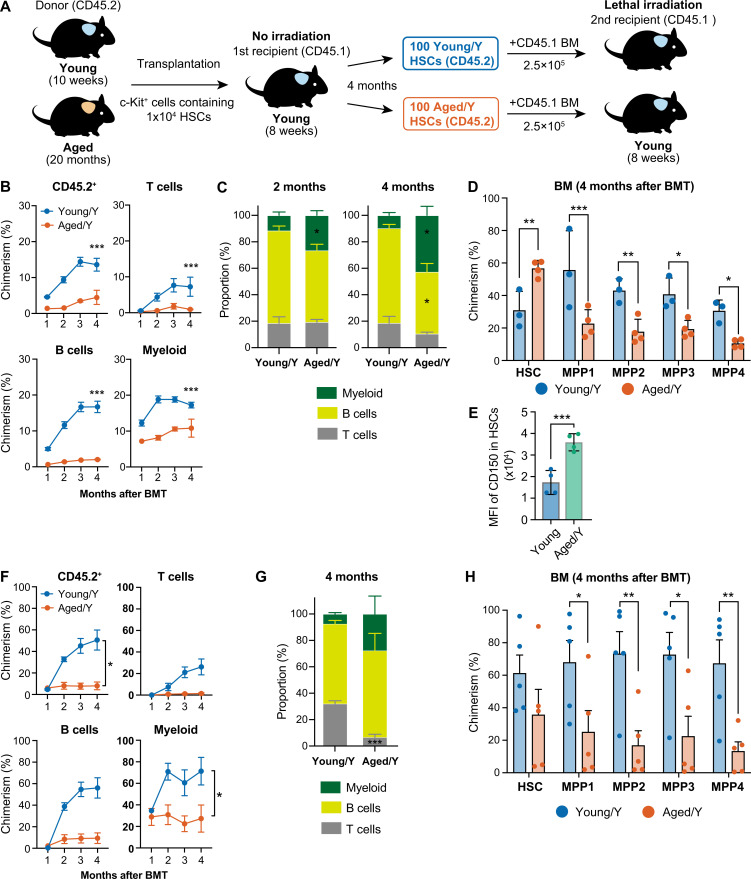
A 2-mo incubation in the young niche may be insufficient for Aged HSCs to undergo rejuvenation. Therefore, we transplanted Young and Aged c-Kit+ cells containing 1 × 10⁴ HSCs into nonconditioned recipient mice and conducted long-term follow-up studies (Fig. S1 A). Hematopoiesis derived from Young and Aged HSPCs engrafted in the young niche (Young/Y and Aged/Y HSPCs, respectively) was assessed at 4 mo after transplantation. Aged/Y HSPCs established markedly lower chimerism than Young/Y HSPCs in PB (Fig. S1 B). Aged/Y HSPCs showed more advanced myeloid-biased repopulation than Young/Y HSPCs, which was more apparent at 4 mo than at 2 mo after transplantation (Fig. S1, B and C). In BM, Aged/Y HSPCs poorly differentiated into the MPP stage even at 4 mo after transplantation (Fig. S1 D). CD150 expression levels were significantly higher in Aged/Y HSCs than in Young host HSCs (Fig. S1 E). We then purified 100 Young/Y and Aged/Y HSCs from primary recipients and transplanted them into lethally irradiated mice with 2 × 10⁵ competitor cells. Aged/Y HSCs again showed inefficient and myeloid-biased repopulation in PB and the compromised differentiation of HSCs into MPPs in BM (Fig. S1, F–H). These results indicated that the young BM niche did not functionally rejuvenate Aged HSCs even with a longer engraftment period.
Figure S1.
Long-term hematopoiesis by Aged HSCs engrafted in the unconditioned young niche. (A) Experimental strategy. c-Kit+ cells that contained 1.0 × 10⁴ HSCs from 10-wk-old mice and 20-mo-old mice were transplanted into 8-wk-old CD45.1 Young mice without irradiation (B–D). 4 mo after transplantation, 100 Young and Aged HSCs engrafted in Young recipient mice were purified and then transplanted into lethally irradiated 8-wk-old secondary recipient mice along with 2.5 × 10⁵ CD45.1+ BM competitor cells (F–H). (B) Chimerism of donor-derived hematopoietic cells in CD45+ (CD45.1+CD45.2) hematopoietic, myeloid, B, and T cells in PB of primary recipient mice receiving Young or Aged HSCs (n = 3–4). (C) Frequencies of myeloid, B, and T cells in donor-derived PB cells 2 and 4 mo after primary transplantation (n = 5). (D) Chimerism of donor-derived cells in BM HSCs and MPPs (CD45.1+CD45.2) in primary recipient mice 4 mo after transplantation (n = 3–4). (E) CD150 expression in Aged/Y HSCs and Young recipient HSCs in recipient mice 4 mo after primary transplantation (n = 4). (F) Chimerism of donor-derived hematopoietic cells in CD45+ (CD45.1+CD45.2) hematopoietic, myeloid, B, and T cells in PB of secondary recipient mice receiving Young/Y or Aged/Y HSCs (n = 3–4). (G) Frequencies of myeloid, B, and T cells in donor-derived PB cells 4 mo after secondary transplantation (n = 5). (H) Chimerism of donor-derived cells in BM HSCs and MPPs (CD45.1+CD45.2) in secondary recipient mice 4 mo after transplantation (n = 5). Data are shown as mean ± SEM. *, P < 0.05; **, P < 0.01; ***, P < 0.001; ns, not significant by one-way ANOVA.
The young niche largely rejuvenates transcriptome profiles of Aged HSCs
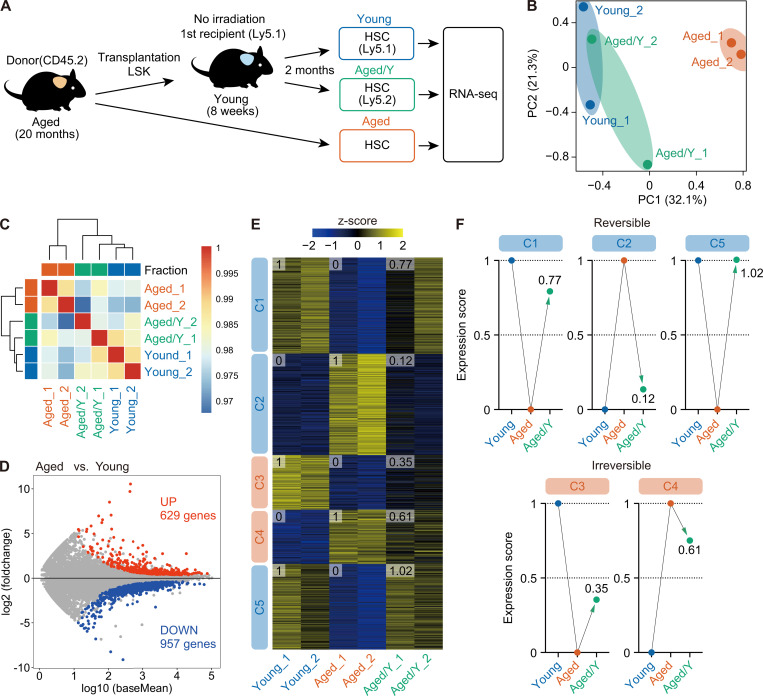
To obtain a more detailed understanding of the impact of the aged niche on HSC transcriptomes, we performed RNA-sequencing analyses of Aged, Young, and Aged/Y HSCs (Fig. 3 A). Principal-component (PC) analyses with the first two components (PC1, 32.1%; PC2, 21.3%) revealed that Aged/Y HSCs were transcriptionally distinct from Aged HSCs and close to Young HSCs (Fig. 3 B). Moreover, hierarchical clustering showed that Aged/Y HSCs were categorized in the same cluster as Young HSCs (Fig. 3 C), indicating that Aged HSCs were transcriptionally reprogrammed toward Young HSCs.
Figure 3.
The young niche largely rejuvenates the transcriptome profile of Aged HSCs. (A) Experimental strategy. 3,000 donor-derived Aged/Y and host Young HSCs purified from primary recipients at 2 mo after transplantation of Aged HSCs without irradiation, together with 3,000 HSCs from 20-mo-old mice, were subjected to RNA-sequencing analysis. (B) PC analysis based on the row Z scores of the expression value (DESeq2 normalized counts) in Young, Aged, and Aged/Y HSCs (n = 2 each, pooled from two independent experiments). (C) Hierarchical clustering based on the Pearson’s correlation coefficient of DESeq2 normalized counts in Young, Aged, and Aged/Y HSCs (n = 2). (D) MA plot showing log10 normalized read counts and log2 fold changes in Aged versus Young HSCs. The red and blue dots represent 629 up-regulated (UP) and 957 down-regulated (DOWN) DEGs during aging. The cutoff q < 0.05 was used to define DEGs. (E) K-means clustering of DEGs defined in D. Heatmap represents the Z scores of normalized read counts in Young, Aged, and Aged/Y HSCs. The cluster numbers (C1–C5) and average gene expression scores of each HSC group are indicated. (F) Reversible and irreversible changes in average gene expression in Aged/Y HSCs. The average expression scores of DEGs in Young or Aged HSCs were scaled from 0 to 1, and the scores of DEGs in Aged/Y HSCs were normalized.
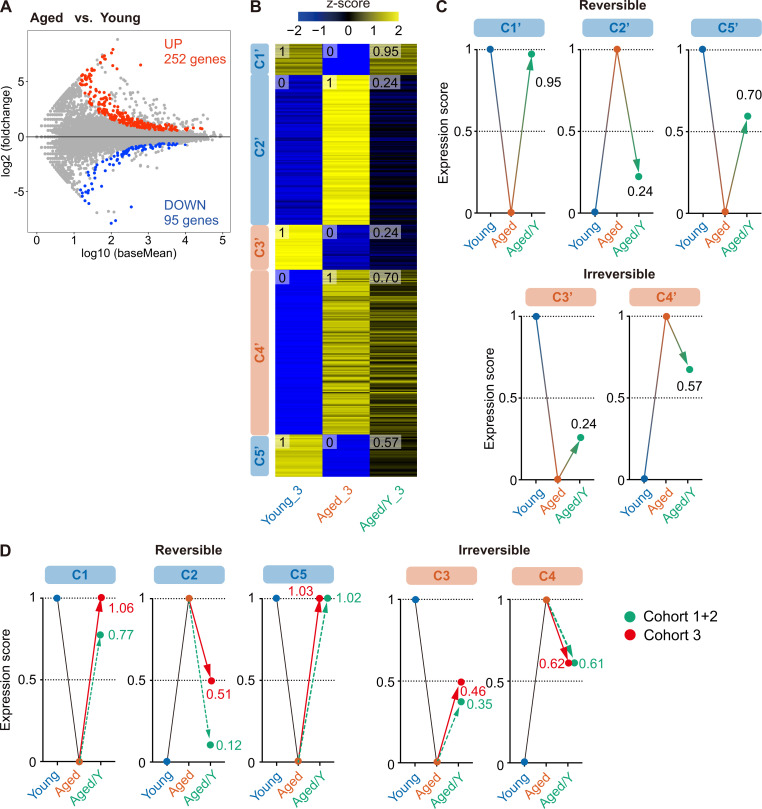
We then defined differentially expressed genes (DEGs) between Young and Aged HSCs using the cutoff value q < 0.05. In total, 629 and 957 genes were up- and down-regulated, respectively, in Aged HSCs as compared with those in Young HSCs, respectively (Fig. 3 D and Table S1). These DEGs were divided into five clusters (C1–C5) by K-means clustering, with DEGs in C1, C3, and C5 being down-regulated and DEGs in C2 and C4 being up-regulated in Aged HSCs as compared with those in Young HSCs (Fig. 3 E). To evaluate the extent to which the transcriptome in Aged/Y HSCs was reversed by the young niche, we arbitrarily set the average expression levels of DEGs in each Young and Aged HSC group to score 0 (HSC groups with lower expression levels) or 1 (HSC groups with higher expression levels) and then calculated the average expression levels of DEGs in Aged/Y HSCs (Fig. 3 E). The scores of Aged/Y HSCs in C1, C2, and C5 were markedly closer to those of Young HSCs than Aged HSCs, indicating that DEGs in these clusters largely underwent niche-dependent reprogramming to Young HSCs. In contrast, the scores of Aged/Y HSCs in C3 and C4 were markedly closer to those of Aged HSCs, indicating that DEGs in these clusters largely represent niche-resistant, HSC-intrinsic changes (Fig. 3, E and F). We obtained similar results in another cohort (cohort 3; Fig. S2, A–C), in which DEGs identified in cohorts 1 and 2 (C1–C5 in Fig. 3 D) showed similar expression changes (Fig. S2 D). Collectively, these results indicated that many alterations in the transcriptome of Aged HSCs are dependent on niche aging and thus are reversible upon transfer to a young niche.
Figure S2.
The young niche largely rejuvenates the transcriptome profile of Aged HSCs (cohort 3). (A) MA plot showing log10 normalized read counts and log2 fold changes in Aged versus Young HSCs. The red and blue dots represent 252 up-regulated and 95 down-regulated DEGs during aging. The cutoff value q < 0.05 was used to define DEGs. (B) K-means clustering of DEGs defined in A. The heatmap represents the Z scores of normalized read counts in Young, Aged, and Aged/Y HSCs. The cluster numbers (C1′–C5′) and average gene expression scores of each HSC group are indicated. (C) Reversible and irreversible changes in average gene expression in Aged/Y HSCs. The average expression scores of DEGs in Young or Aged HSCs were scaled from 0 to 1, and the scores of DEGs in Aged/Y HSCs were normalized. (D) Expression changes of DEGs identified in cohorts 1 and 2 (C1 to C5 in Fig. 3) and cohort 3 (as in Fig. 3). Expression changes of DEGs in cohorts 1 and 2 are shown as controls.
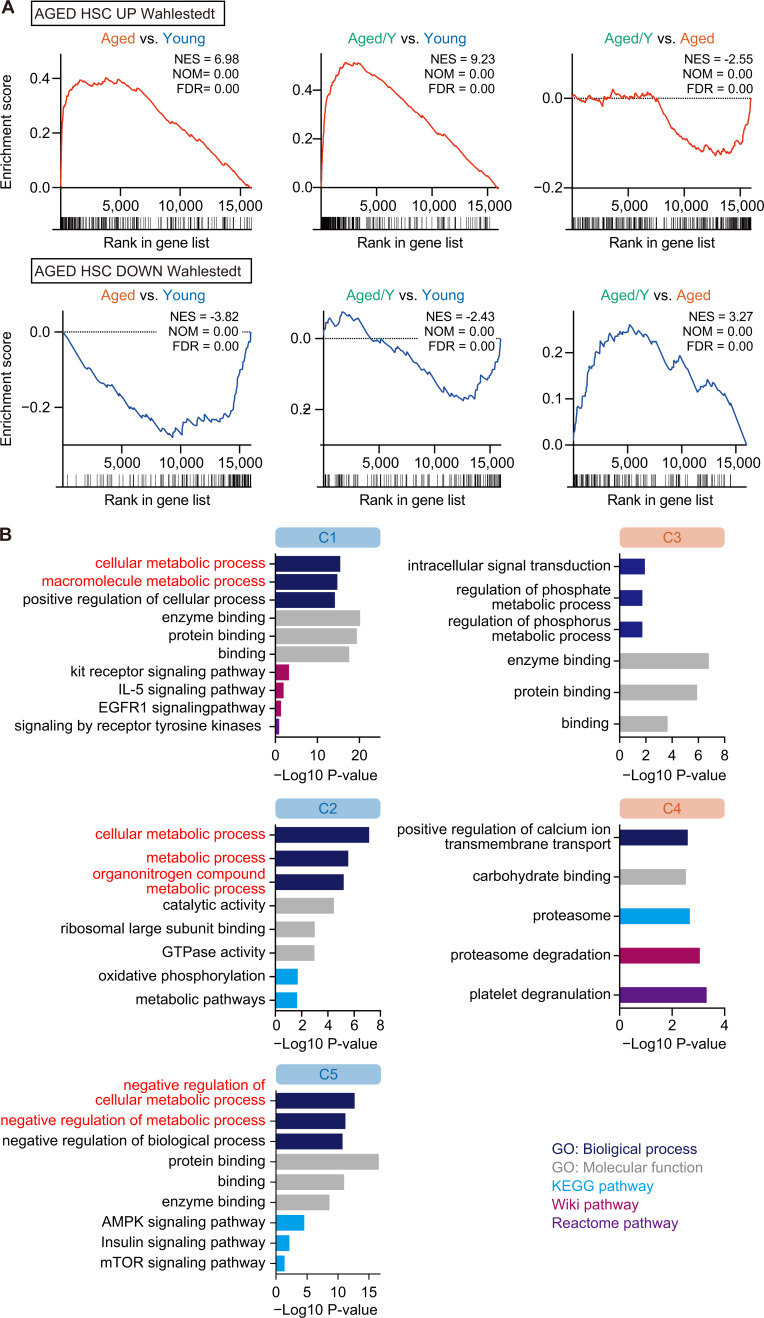
A gene set enrichment analysis (GSEA) confirmed that the Aged/Y HSCs underwent transcriptional reprogramming toward the partial attenuation of the aging signature (Wahlestedt et al., 2013; Fig. 4 A and Table S2 A). Gene ontology (GO) analyses revealed that reversible DEGs in C1, C2, and C5 were associated with cellular metabolic processes (Fig. 4 B and Table S2 B), suggesting a major role for the BM niche in the regulation of HSC metabolism. The relationship between irreversible DEGs (C3 and C4) and specific pathways/processes was not clear due to their small numbers (Fig. 4 B and Table S2 B).
Figure 4.
Niche-dependent partial transcriptional rejuvenation of Aged HSCs. (A) GSEA plots with gene sets that are up-regulated (UP) or down-regulated (DOWN) in Aged HSCs (Wahlestedt et al., 2013). Normalized enrichment score (NES), nominal P value (NOM), and false discovery rate (FDR) are indicated. (B) GO analyses of biological processes and other indicated pathway analyses using DEGs in each cluster. The cutoff value P < 0.05 was used to indicate significant enrichment.
Age-related aberrant DNA methylation is resistant to niche rejuvenation
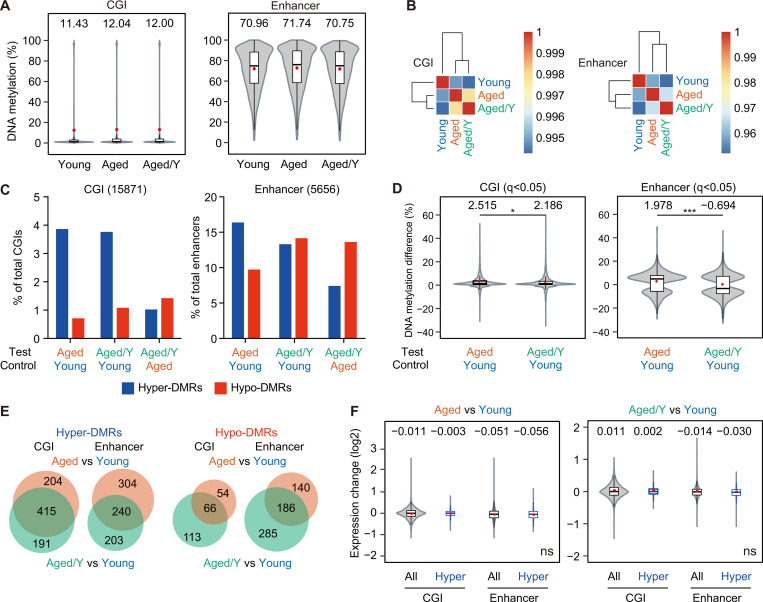
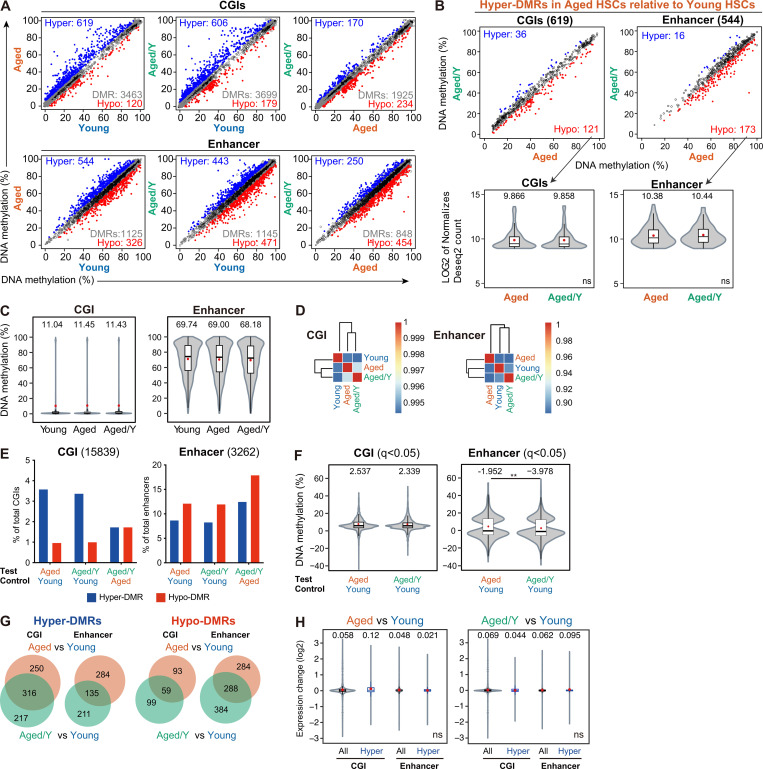
Various epigenetic alterations, including DNA methylation, have been recognized as one of the hallmarks of aging (López-Otín et al., 2013). Epigenetic markers can readily change over time, and this “epigenetic drift,” which depends on both intrinsic and extrinsic factors, may play an important role in HSC aging (Issa, 2014). To assess changes in DNA methylation, we performed whole-genome bisulfite sequencing (WGBS) on Young, Aged, and Aged/Y HSCs (Table S3 A). Globally, low DNA methylation levels were detected in CpG islands (CGIs), which included promoter CGIs, while high DNA methylation levels were observed in enhancer regions (Fig. 5 A). No significant changes were noted in DNA methylation levels among Young, Aged, and Aged/Y HSCs at CGIs or enhancer regions; however, Aged HSCs showed a modest increase (Fig. 5 A). Hierarchical clustering revealed no significant restoration of global DNA methylation in Aged/Y HSCs but rather showed the modest progression of aberrant DNA methylation in Aged/Y HSCs during the repopulation in the young BM niche (Fig. 5 B).
Figure 5.
Age-related aberrant DNA methylation is resistant to niche rejuvenation. (A) Violin plots showing the global DNA methylation levels in Young, Aged, and Aged/Y HSCs at CGIs and enhancers. Mean and median values are indicated as red dots and horizontal bars, respectively. (B) Hierarchical clustering databased on the Pearson’s correlation coefficient of DNA methylation at CGIs and enhancers in Young, Aged, and Aged/Y HSCs. (C) Percentages of hyper- and hypo-DMRs at CGIs and enhancers in Aged and Aged/Y HSCs relative to the indicated HSCs. Among DMRs with significant differences in methylation levels from those in control HSCs (q< 0.05), those showing methylation difference ≥5.0% were defined as hyper- and hypo-DMRs. (D) Violin plots showing the DNA methylation difference (percentage) in DMRs between the test (Aged or Aged/Y HSCs) and control (Young HSCs). Mean and median values are indicated as red dots and horizontal bars, respectively. (E) Venn diagrams showing the overlap of hyper- and hypo-DMRs at CGIs and enhancers between Aged and Aged/Y HSCs. Hyper- and hypo-DMRs were defined in Aged and Aged/Y HSCs using Young HSCs as a control. (F) Violin plots showing expression changes in all genes (All) and genes with hyper-DMRs at CGIs and enhancers (Hyper) between the test (Aged and Aged/Y HSCs) and control (Young HSCs). Mean and median values are indicated as red dots and horizontal bars, respectively. Data are shown as mean ± SD. Data of second cohort are shown in Fig. S3. *, P < 0.05; ***, P < 0.001; ns, not significant by Student’s t test.
We defined differentially methylated regions (DMRs) among Young, Aged and Aged/Y HSCs as those showing the cutoff values q< 0.05. We identified 3,463 and 1,125 DMRs during aging (Aged versus Young), 3,699 and 1,145 DMRs after engraftment in the young niche (Aged/Y versus Young), and 1,925 and 848 DMRs (Aged/Y versus Aged) at CGIs and enhancers, respectively (Fig. S3 A). We defined hyper- and hypo-DMRs as those showing a methylation difference ≥5.0% (Fig. S3 A and Table S3 B). HSCs acquired more hyper- than hypo-DMRs (619 versus 120) at CGIs with aging (Aged versus Young), but showed a very mild shift from hyper- to hypo-DMRs (606 versus 179) after engraftment in the young niche (Aged/Y versus Young). In contrast, HSCs acquired more hypo-DMRs at enhancers than CGIs with aging and after engraftment in the young niche (Fig. 5 C). Consequently, DNA methylation differences in DMRs were slightly lower in Aged/Y HSCs than in Aged HSCs, with reductions being larger at enhancers than at CGIs (Fig. 5 D). Moreover, hyper-DMRs in Aged HSCs and Aged/Y HSCs significantly overlapped in CGIs, while those in enhancer regions were more variable (Fig. 5 E). Consistent with previous findings (Beerman et al., 2013), the relationship between gene expression levels and DNA methylation levels did not appear to be strong in HSCs. Hyper-DMR genes in Aged HSCs showed no significant changes in expression (Fig. 5 F), and the hyper-DMR genes that lost hyper-DMRs in Aged/Y HSCs were not associated with transcriptional activation (Fig. S3 B). We confirmed these results in another cohort using a WGBS analysis (Fig. S3, C–H). Collectively, these results indicate that age-associated alterations in DNA methylation were more stable than in the transcriptome and resistant to niche rejuvenation. Furthermore, niche rejuvenation preferentially induced DNA demethylation at enhancer regions; however, this did not appear to account for transcriptional rejuvenation.
Figure S3.
Comparison of DNA methylation among Young, Aged, and Aged/Y HSCs. (A) DNA methylation values in Young, Aged, and Aged/Y HSCs at CGIs and enhancers. The blue and red dots represent hyper-and hypo-DMRs as those showing significant differences in methylation levels (q < 0.05) and a methylation difference ≥5.0%. Gray dots and white circles represent DMRs with a methylation difference <5.0% and non-DMRs, respectively. (B) DNA methylation values of hyper-DMRs in Aged HSCs relative to Young HSCs in A (619 and 544 DMRs at CGIs and enhancers, respectively) in Aged and Aged/Y HSCs (upper panels). Violin plots showing expression levels of hyper-DMR genes in Aged HSCs that lost hyper-DMRs in Aged/Y HSCs (hypo-DMR genes in Aged/Y HSCs relative to Aged HSCs; lower panels). Mean and median values are indicated as red dots and horizontal bars, respectively. (C–H) GWBS analysis (second cohort). (C) Violin plots showing the global DNA methylation levels in Young, Aged, and Aged/Y HSCs at CGIs and enhancers. Mean and median values are indicated as red dots and horizontal bars, respectively. (D) Hierarchical clustering databased on the Pearson’s correlation coefficient of DNA methylation at CGIs and enhancers in Young, Aged, and Aged/Y HSCs. (E) Percentages of hyper- and hypo-DMRs at CGIs and enhancers in Aged and Aged/Y HSCs relative to indicated HSCs. Among DMRs with significant differences in methylation levels compared with control HSCs (q < 0.05), those showing a methylation difference ≥5.0% were defined as hyper- and hypo-DMRs. (F) Violin plots showing the DNA methylation difference (percentage) in DMRs between the test (Aged or Aged/Y HSCs) and control (Young HSCs). Mean and median values are indicated as red dots and horizontal bars, respectively. (G) Venn diagrams showing the overlap of hyper- and hypo-DMRs at CGIs and enhancers between Aged and Aged/Y HSCs. Hyper- and hypo-DMRs were defined in Aged and Aged/Y HSCs using Young HSCs as a control. (H) Violin plots showing expression changes in all genes (All) and genes with hyper-DMRs at CGIs and enhancers (Hyper) between the test (Aged and Aged/Y HSCs) and control (Young HSCs). Mean and median values are indicated as red dots and horizontal bars, respectively. Data are shown as mean ± SD. **, P < 0.01; ns, not significant by Student’s t test.
In summary, we demonstrated that the transcriptome of Aged HSCs, but not the DNA methylation profile or their functions, may be largely restored to that of Young HSCs upon engraftment in the intact young niche. Previous studies reported alterations in the BM niche with aging (Pinho and Frenette, 2019) and suggested that exposure to differential signals from the aged niche plays a role in HSC functional changes. The expression of genes associated with metabolic processes, the dysregulation of which is one of the hallmarks of Aged HSCs (Chandel et al., 2016), was also reversible by changing the niche, highlighting the key contribution of niche aging to the transcriptional and metabolic dysregulation of Aged HSCs. Nevertheless, Aged HSCs were not functionally rejuvenated in the intact young niche, suggesting that the cell-intrinsic alterations in Aged HSCs persist irrespective of the niche conditions. These alternations include genetic and epigenetic changes and aggravated mitochondria, and we herein observed subtle changes in the DNA methylation status in Aged HSCs upon niche replacement. The age-associated differential DNA methylation of HSCs was previously shown to be largely dependent on the proliferative history of HSCs. The physiological aging and experimentally enforced proliferation of HSCs both led to the DNA hypermethylation of genes regulated by Polycomb repressive complex 2 (Beerman et al., 2013; Sun et al., 2014). Therefore, the enforced repopulation of Aged HSCs in the young niche, even though the young niche is free of damages induced by myeloablative insults, may have propagated the alterations in the DNA methylation landscape of Aged HSCs. Yu et al. (2016) investigated the functional, transcriptional, and epigenetic (DNA methylation and chromatin accessibility) attributes of HSCs at a clonal level using endogenous fluorescent tagging and found that intraclonal behaviors were epigenetically scripted but did not always correspond to the transcriptional state, suggesting that the differences in the epigenome, instead of the niche, are responsible for the cell-autonomous behavior of HSCs. Collectively, these findings and the present results suggest that the epigenome is a more appropriate metric for HSC functions than the transcriptome. We assume that HSC clones with specific epigenetic configurations are selected during aging, leading to functional changes of HSCs as a whole. This notion is challenging, and further studies are needed to clarify the mechanisms that irreversibly affect HSC function during aging.
Materials and methods
Mice
8-wk-old C57BL/6 mice (B6-CD45.2) were purchased from Japan SLC and bred for 16–19 mo in the animal experiment facilities of Chiba University and The Institute of Medical Science, The University of Tokyo. C57BL/6 mice congenic for the Ly5 locus (B6-CD45.1) were purchased from Sankyo-Lab Service. Only female mice were used in the present study. All experiments using mice were performed in accordance with our institutional guidelines for the use of laboratory animals and approved by the Review Board for Animal Experiments of Chiba University (approval ID 30–56) and The Institute of Medical Science, The University of Tokyo (approval ID PS18-02).
Flow cytometry and antibodies
BM cells were isolated by crushing bones from the pelvis, femurs, and tibiae. Flow cytometric analyses and cell sorting were performed using monoclonal antibodies recognizing the following antigens: CD45.2 (104), CD45.1 (A20), Gr-1 (RB6-8C5), CD11b/Mac-1 (M1/70), Ter-119 (TER-119), CD127/IL7Rα (SB/199), CD4 (GK1.5), CD8α (53–6.7), B220 (RA3-6B2), CD117/c-Kit (2B8), Sca-1 (D7), CD135/Flk2 (A2F10), CD34 (RAM34), CD150 (TC15-12F12.2), and CD48 (HM48-1). These antibodies were purchased from BD Biosciences, eBioscience, BioLegend, TOMBO, and R&D Systems. Dead cells were removed by staining with 0.5 µg/ml propidium iodide (Sigma-Aldrich). All flow cytometric analyses and cell sorting were performed on FACS Aria III, FACS Canto II, or FACS Celesta (BD Biosciences).
BM transplantation without preconditioning
Regarding BM transplantation without preconditioning, purified LSK cells from 20-mo-old CD45.2 Aged mice and c-Kit+ HSPCs from 12-mo-old or 8-wk-old CD45.2 mice were transplanted by a tail vein injection into 8-wk-old CD45.1 unconditioned recipient mice. c-Kit+ cells were enriched using an CD117/c-Kit (2B8)–APC antibody (BioLegend) and anti-APC MicroBeads (MACS Miltenyi Biotec), and LSK cells were then sorted on FACS Aria III. HSC numbers in transplanted LSK or c-Kit+ cells were calculated by the proportions of HSCs in the test cells. In the functional assessment of transplanted HSCs without preconditioning, LSK cells or HSCs were purified from the backbone, pelvis, femurs, and tibiae at 2 mo after transplantation and then transplanted into lethally irradiated (9.5 Gy) CD45.1 mice with freshly prepared 2 × 10⁵ CD45.2 BM competitor cells.
RNA sequencing
3,000 HSCs were purified from primary recipient mice (CD45.2+ Aged/Y HSCs and CD45.1+ Young HSCs) and 20-mo-old CD45.2+ mice (Aged HSCs). Total RNA was extracted using an RNeasy Plus Micro Kit (Qiagen) and subjected to reverse transcription and amplification with a SMARTer Ultra Low Input RNA Kit for Sequencing (Clontech). After sonication with an ultrasonicator (Covaris), the libraries for RNA sequencing were generated from fragmented DNA with eight cycles of amplification using a NEB Next Ultra DNA Library Prep Kit (New England Biolabs). After the libraries had been quantified using the Bioanalyzer (Agilent), samples were subjected to sequencing with Hiseq1500 (Illumina) and 61 cycles of the sequencing reaction were performed. TopHat2 (version 2.0.13; with default parameters) and Bowtie2 (version 2.1.0) were used for alignment to the reference mouse genome (mm10 from the University of California, Santa Cruz Genome Browser). Normalization and removing batch effects of the count value and significant expression differences were detected using DESeq2 (version 2.2.1; Love et al., 2014), with raw counts generated from StringTie. The normalized count was log2-transformed and Z-score scaled before performing a PC analysis and heatmap analysis, except for hierarchical clustering. A GSEA was performed across the aging-related genes (Wahlestedt et al., 2013). The pathway analysis of GO biological processes, GO molecular mechanisms, the KEGG pathway, Wiki pathway, and Reactome pathway associated with candidate genes were performed using g:Profiler tool with a P < 0.05.
WGBS
Genomic DNA was extracted from 7,500 purified HSCs using a DNeasy Blood & Tissue Kit (Qiagen). The preparation of sequencing libraries for WGBS was basically performed with an improved after bisulfite adaptor tagging protocol (tPBAT), as described previously (Miura et al., 2019, 2012). To monitor the efficiency of bisulfite conversion, unmethylated lambda DNA (Promega) was spiked-in to each DNA at 1%. The concentration of sequencing libraries was assessed using the Library Quantification Kit from Takara Bio. The tPBAT libraries were mixed with the PhiX control library (Illumina) at a molar ratio of 80:20, and the total concentration of the mixed library was adjusted to 600 pM. The libraries were sent to Macrogen Japan, and sequencing was performed using HiSeq X with the paired-end mode (2 × 150 cycles). Sequence data demultiplexed by Macrogen Japan were used for subsequent analyses. The reads were mapped to the reference genome that is composed of the mouse (mm10) and enterobacterium phage lambda (GenBank accession no. J02459.1) genome using BMap, a bisulfite mapping program, as described previously (Miura et al., 2019). With a series of in-house programs, the alignments were summarized. The results of a basic statistical analysis of methylome data are shown in Table S3 A. WGBS data were mapped to the mouse genome (mm10) using Bismark software (Babraham Institute). Methylation scores were calculated as the number of unconverted reads divided by the number of total reads at each CGI (mm10 University of California, Santa Cruz Genome Browser) and enhancer region active in long-term HSCs defined previously (Lara-Astiaso et al., 2014). DMRs, which showed significant differences in methylation levels (q< 0.05) and a methylation difference ≥5.0%, were identified using methylKit (BioMed Central). AnnotatePeaks was used in addition to associating peaks with nearby genes.
Statistical analysis
Statistical analyses were performed using Graph Pad Prism version 8. An unpaired two-tailed t test or one-way ANOVA was performed as indicated in the figures. In violin plots, boxes represent 25–75th percentile ranges. Vertical lines represent 10–90th percentile ranges. Red dots and horizontal bars indicate mean and median values, respectively. Data are shown as the mean ± SE (SEM) or SD, as indicated. Significance was taken at values of *, P < 0.05; **, P < 0.01; and ***, P < 0.001.
Accession numbers
RNA-sequencing and WGBS data were deposited in the DNA Data Bank of Japan with the accession no. DRA010901.
Online supplemental material
Fig. S1 shows data of long-term hematopoiesis by Aged HSCs engrafted in the unconditioned young niche. Fig. S2 shows a transcriptome profile of Aged HSCs (cohort 3). Fig. S3 shows comparison of DNA methylation among Young, Aged, and Aged/Y HSCs. Table S1 shows DEGs between Young and Aged HSCs. Table S2, A and B, shows GSEA data of Aged HSCs and summary of pathway analysis of five cluster genes. Table S3, A and B, shows basic statistics on methylome data and DMRs in Aged HSCs.
Supplementary Material
lists DEGs between Young and Aged HSCs.
shows GSEA analysis using up-regulated and down-regulated gene sets in Aged HSCs and a summary of pathway analysis data of five cluster genes.
lists basic statistics on methylome data and DMRs in Aged HSCs.
Acknowledgments
We would like to thank Tatsuki Sugiyama and Takashi Nagasawa for technical advice; Atsunori Saraya, Makiko Yui, and Hiroko Tsukui for their kind assistance; and Mikako Kuribayashi for graphic illustrations. The supercomputing resource was provided by the Human Genome Center, the Institute of Medical Science, the University of Tokyo.
This work was supported in part by Ministry of Education, Culture, Sports, Science and Technology Grants-in-Aid for Scientific Research (JP19H05653), Scientific Research on Innovative Areas “Stem Cell Aging and Disease” (JP26115002) and “Replication of Non-Genomic Codes” (JP19H05746), and the Japan Agency for Medical Research and Development Platform Project for Supporting Drug Discovery and Life Science Research (Basis for Supporting Innovative Drug Discovery and Life Science Research) under grant JP20am0101103 (support number 1803).
Author contributions: W. Kuribayashi performed the experiments, analyzed results, made the figures, and actively wrote the manuscript; M. Oshima, N. Itokawa, S. Koide, Y. Nakajima-Takagi, S. Yamazaki, M. Yamashita, B. Rahmutulla, F. Miura, and T. Ito assisted with the experiments; M. Yamashita edited the manuscript; A. Kaneda conceptualized the research and edited the manuscript; A. Iwama conceived of and directed the project, secured funding, and actively wrote the manuscript.
References
- Abbuehl, J.P., Tatarova Z., Held W., and Huelsken J.. 2017. Long-term engraftment of primary bone marrow stromal cells repairs niche damage and improves hematopoietic stem cell transplantation. Cell Stem Cell. 21:241–255.e6. 10.1016/j.stem.2017.07.004 [DOI] [PubMed] [Google Scholar]
- Akunuru, S., and Geiger H.. 2016. Rejuvenation of hematopoietic stem cells. Trends Mol. Med. 22:701–712. 10.1016/j.molmed.2016.06.003 [DOI] [PMC free article] [PubMed] [Google Scholar]
- Beerman, I., Bhattacharya D., Zandi S., Sigvardsson M., Weissman I.L., Bryder D., and Rossi D.J.. 2010. Functionally distinct hematopoietic stem cells modulate hematopoietic lineage potential during aging by a mechanism of clonal expansion. Proc. Natl. Acad. Sci. USA. 107:5465–5470. 10.1073/pnas.1000834107 [DOI] [PMC free article] [PubMed] [Google Scholar]
- Beerman, I., Bock C., Garrison B.S., Smith Z.D., Gu H., Meissner A., and Rossi D.J.. 2013. Proliferation-dependent alterations of the DNA methylation landscape underlie hematopoietic stem cell aging. Cell Stem Cell. 12:413–425. 10.1016/j.stem.2013.01.017 [DOI] [PubMed] [Google Scholar]
- Bhattacharya, D., Rossi D.J., Bryder D., and Weissman I.L.. 2006. Purified hematopoietic stem cell engraftment of rare niches corrects severe lymphoid deficiencies without host conditioning. J. Exp. Med. 203:73–85. 10.1084/jem.20051714 [DOI] [PMC free article] [PubMed] [Google Scholar]
- Cabezas-Wallscheid, N., Klimmeck D., Hansson J., Lipka D.B., Reyes A., Wang Q., Weichenhan D., Lier A., von Paleske L., Renders S., et al. 2014. Identification of regulatory networks in HSCs and their immediate progeny via integrated proteome, transcriptome, and DNA methylome analysis. Cell Stem Cell. 15:507–522. 10.1016/j.stem.2014.07.005 [DOI] [PubMed] [Google Scholar]
- Challen, G.A., Boles N.C., Chambers S.M., and Goodell M.A.. 2010. Distinct hematopoietic stem cell subtypes are differentially regulated by TGF-β1. Cell Stem Cell. 6:265–278. 10.1016/j.stem.2010.02.002 [DOI] [PMC free article] [PubMed] [Google Scholar]
- Chandel, N.S., Jasper H., Ho T.T., and Passegué E.. 2016. Metabolic regulation of stem cell function in tissue homeostasis and organismal ageing. Nat. Cell Biol. 18:823–832. 10.1038/ncb3385 [DOI] [PubMed] [Google Scholar]
- Chen, Q., Liu Y., Jeong H.W., Stehling M., Dinh V.V., Zhou B., and Adams R.H.. 2019. Apelin+ endothelial niche cells control hematopoiesis and mediate vascular regeneration after myeloablative injury. Cell Stem Cell. 25:768–783.e6. 10.1016/j.stem.2019.10.006 [DOI] [PMC free article] [PubMed] [Google Scholar]
- Chhabra, A., Ring A.M., Weiskopf K., Schnorr P.J., Gordon S., Le A.C., Kwon H.S., Ring N.G., Volkmer J., Ho P.Y., et al. 2016. Hematopoietic stem cell transplantation in immunocompetent hosts without radiation or chemotherapy. Sci. Transl. Med. 8:351ra105. 10.1126/scitranslmed.aae0501 [DOI] [PMC free article] [PubMed] [Google Scholar]
- Czechowicz, A., Kraft D., Weissman I.L., and Bhattacharya D.. 2007. Efficient transplantation via antibody-based clearance of hematopoietic stem cell niches. Science. 318:1296–1299. 10.1126/science.1149726 [DOI] [PMC free article] [PubMed] [Google Scholar]
- de Haan, G., and Lazare S.S.. 2018. Aging of hematopoietic stem cells. Blood. 131:479–487. 10.1182/blood-2017-06-746412 [DOI] [PubMed] [Google Scholar]
- Dykstra, B., Olthof S., Schreuder J., Ritsema M., and de Haan G.. 2011. Clonal analysis reveals multiple functional defects of aged murine hematopoietic stem cells. J. Exp. Med. 208:2691–2703. 10.1084/jem.20111490 [DOI] [PMC free article] [PubMed] [Google Scholar]
- Elias, H.K., Bryder D., and Park C.Y.. 2017. Molecular mechanisms underlying lineage bias in aging hematopoiesis. Semin. Hematol. 54:4–11. 10.1053/j.seminhematol.2016.11.002 [DOI] [PubMed] [Google Scholar]
- Geiger, H., de Haan G., and Florian M.C.. 2013. The ageing haematopoietic stem cell compartment. Nat. Rev. Immunol. 13:376–389. 10.1038/nri3433 [DOI] [PubMed] [Google Scholar]
- Hooper, A.T., Butler J.M., Nolan D.J., Kranz A., Iida K., Kobayashi M., Kopp H.G., Shido K., Petit I., Yanger K., et al. 2009. Engraftment and reconstitution of hematopoiesis is dependent on VEGFR2-mediated regeneration of sinusoidal endothelial cells. Cell Stem Cell. 4:263–274. 10.1016/j.stem.2009.01.006 [DOI] [PMC free article] [PubMed] [Google Scholar]
- Issa, J.P. 2014. Aging and epigenetic drift: a vicious cycle. J. Clin. Invest. 124:24–29. 10.1172/JCI69735 [DOI] [PMC free article] [PubMed] [Google Scholar]
- Lara-Astiaso, D., Weiner A., Lorenzo-Vivas E., Zaretsky I., Jaitin D.A., David E., Keren-Shaul H., Mildner A., Winter D., Jung S., et al. 2014. Immunogenetics. Chromatin state dynamics during blood formation. Science. 345:943–949. 10.1126/science.1256271 [DOI] [PMC free article] [PubMed] [Google Scholar]
- López-Otín, C., Blasco M.A., Partridge L., Serrano M., and Kroemer G.. 2013. The hallmarks of aging. Cell. 153:1194–1217. 10.1016/j.cell.2013.05.039 [DOI] [PMC free article] [PubMed] [Google Scholar]
- Love, M.I., Huber W., and Anders S.. 2014. Moderated estimation of fold change and dispersion for RNA-seq data with DESeq2. Genome Biol. 15:550. 10.1186/s13059-014-0550-8 [DOI] [PMC free article] [PubMed] [Google Scholar]
- Miura, F., Enomoto Y., Dairiki R., and Ito T.. 2012. Amplification-free whole-genome bisulfite sequencing by post-bisulfite adaptor tagging. Nucleic Acids Res. 40:e136. 10.1093/nar/gks454 [DOI] [PMC free article] [PubMed] [Google Scholar]
- Miura, F., Shibata Y., Miura M., Sangatsuda Y., Hisano O., Araki H., and Ito T.. 2019. Highly efficient single-stranded DNA ligation technique improves low-input whole-genome bisulfite sequencing by post-bisulfite adaptor tagging. Nucleic Acids Res. 47:e85. 10.1093/nar/gkz435 [DOI] [PMC free article] [PubMed] [Google Scholar]
- Morrison, S.J., and Scadden D.T.. 2014. The bone marrow niche for haematopoietic stem cells. Nature. 505:327–334. 10.1038/nature12984 [DOI] [PMC free article] [PubMed] [Google Scholar]
- Muller-Sieburg, C.E., Cho R.H., Karlsson L., Huang J.F., and Sieburg H.B.. 2004. Myeloid-biased hematopoietic stem cells have extensive self-renewal capacity but generate diminished lymphoid progeny with impaired IL-7 responsiveness. Blood. 103:4111–4118. 10.1182/blood-2003-10-3448 [DOI] [PubMed] [Google Scholar]
- Nilsson, S.K., Dooner M.S., Tiarks C.Y., Weier H.U., and Quesenberry P.J.. 1997. Potential and distribution of transplanted hematopoietic stem cells in a nonablated mouse model. Blood. 89:4013–4020. 10.1182/blood.V89.11.4013 [DOI] [PubMed] [Google Scholar]
- Oshima, M., and Iwama A.. 2014. Epigenetics of hematopoietic stem cell aging and disease. Int. J. Hematol. 100:326–334. 10.1007/s12185-014-1647-2 [DOI] [PubMed] [Google Scholar]
- Pinho, S., and Frenette P.S.. 2019. Haematopoietic stem cell activity and interactions with the niche. Nat. Rev. Mol. Cell Biol. 20:303–320. 10.1038/s41580-019-0103-9 [DOI] [PMC free article] [PubMed] [Google Scholar]
- Rossi, D.J., Bryder D., Zahn J.M., Ahlenius H., Sonu R., Wagers A.J., and Weissman I.L.. 2005. Cell intrinsic alterations underlie hematopoietic stem cell aging. Proc. Natl. Acad. Sci. USA. 102:9194–9199. 10.1073/pnas.0503280102 [DOI] [PMC free article] [PubMed] [Google Scholar]
- Shimoto, M., Sugiyama T., and Nagasawa T.. 2017. Numerous niches for hematopoietic stem cells remain empty during homeostasis. Blood. 129:2124–2131. 10.1182/blood-2016-09-740563 [DOI] [PubMed] [Google Scholar]
- Shiozawa, Y., Havens A.M., Pienta K.J., and Taichman R.S.. 2008. The bone marrow niche: habitat to hematopoietic and mesenchymal stem cells, and unwitting host to molecular parasites. Leukemia. 22:941–950. 10.1038/leu.2008.48 [DOI] [PMC free article] [PubMed] [Google Scholar]
- Si, S., Nakajima-Takagi Y., Iga T., Tsuji M., Hou L., Oshima M., Koide S., Saraya A., Yamazaki S., Takubo K., et al. 2018. Hematopoietic insults damage bone marrow niche by activating p53 in vascular endothelial cells. Exp. Hematol. 63:41–51.e1. 10.1016/j.exphem.2018.04.006 [DOI] [PubMed] [Google Scholar]
- Sudo, K., Ema H., Morita Y., and Nakauchi H.. 2000. Age-associated characteristics of murine hematopoietic stem cells. J. Exp. Med. 192:1273–1280. 10.1084/jem.192.9.1273 [DOI] [PMC free article] [PubMed] [Google Scholar]
- Sun, D., Luo M., Jeong M., Rodriguez B., Xia Z., Hannah R., Wang H., Le T., Faull K.F., Chen R., et al. 2014. Epigenomic profiling of young and aged HSCs reveals concerted changes during aging that reinforce self-renewal. Cell Stem Cell. 14:673–688. 10.1016/j.stem.2014.03.002 [DOI] [PMC free article] [PubMed] [Google Scholar]
- Tikhonova, A.N., Dolgalev I., Hu H., Sivaraj K.K., Hoxha E., Cuesta-Domínguez Á., Pinho S., Akhmetzyanova I., Gao J., Witkowski M., et al. 2019. The bone marrow microenvironment at single-cell resolution. Nature. 569:222–228. 10.1038/s41586-019-1104-8 [DOI] [PMC free article] [PubMed] [Google Scholar]
- Verovskaya, E.V., Dellorusso P.V., and Passegué E.. 2019. Losing sense of self and surroundings: hematopoietic stem cell aging and leukemic transformation. Trends Mol. Med. 25:494–515. 10.1016/j.molmed.2019.04.006 [DOI] [PMC free article] [PubMed] [Google Scholar]
- Wahlestedt, M., Norddahl G.L., Sten G., Ugale A., Frisk M.A.M., Mattsson R., Deierborg T., Sigvardsson M., and Bryder D.. 2013. An epigenetic component of hematopoietic stem cell aging amenable to reprogramming into a young state. Blood. 121:4257–4264. 10.1182/blood-2012-11-469080 [DOI] [PubMed] [Google Scholar]
- Westerhuis, G., van Pel M., Toes R.E.M., Staal F.J.T., and Fibbe W.E.. 2011. Chimerism levels after stem cell transplantation are primarily determined by the ratio of donor to host stem cells. Blood. 117:4400–4401. 10.1182/blood-2011-01-328518 [DOI] [PubMed] [Google Scholar]
- Young, K., Borikar S., Bell R., Kuffler L., Philip V., and Trowbridge J.J.. 2016. Progressive alterations in multipotent hematopoietic progenitors underlie lymphoid cell loss in aging. J. Exp. Med. 213:2259–2267. 10.1084/jem.20160168 [DOI] [PMC free article] [PubMed] [Google Scholar]
- Yu, V.W.C., Yusuf R.Z., Oki T., Wu J., Saez B., Wang X., Cook C., Baryawno N., Ziller M.J., Lee E., et al. 2016. Epigenetic memory underlies cell-autonomous heterogeneous behavior of hematopoietic stem cells. Cell. 167:1310–1322.e17. 10.1016/j.cell.2016.10.045 [DOI] [PubMed] [Google Scholar]
Associated Data
This section collects any data citations, data availability statements, or supplementary materials included in this article.
Supplementary Materials
lists DEGs between Young and Aged HSCs.
shows GSEA analysis using up-regulated and down-regulated gene sets in Aged HSCs and a summary of pathway analysis data of five cluster genes.
lists basic statistics on methylome data and DMRs in Aged HSCs.


