

Abstract
Osteoarthritis (OA) is a degenerative disease resulting in irreversible, progressive destruction of articular cartilage1. The etiology of OA is complex and involves a variety of factors, including genetic predisposition, acute injury and chronic inflammation2–4. Here we investigate the ability of resident skeletal stem-cell (SSC) populations to regenerate cartilage in relation to age, a possible contributor to the development of osteoarthritis5–7. We demonstrate that aging is associated with progressive loss of SSCs and diminished chondrogenesis in the joints of both mice and humans. However, a local expansion of SSCs could still be triggered in the chondral surface of adult limb joints in mice by stimulating a regenerative response using microfracture (MF) surgery. Although MF-activated SSCs tended to form fibrous tissues, localized co-delivery of BMP2 and soluble VEGFR1 (sVEGFR1), a VEGF receptor antagonist, in a hydrogel skewed differentiation of MF-activated SSCs toward articular cartilage. These data indicate that following MF, a resident stem-cell population can be induced to generate cartilage for treatment of localized chondral disease in OA.
Musculoskeletal disorders are a large global health burden8,9. Currently 52.2 million Americans are diagnosed with arthritis, and this is estimated to rise to 78.4 million by 2040 (ref. 10). Of these disorders, the most common type is OA, which has a lifetime risk of 40% (ref. 11). With no effective treatments yet approved to prevent OA disease progression, symptomatic relief and eventual joint replacement are the standards of care12,13. In an attempt to regenerate cartilage in OA, surgeons perform MF surgery, a technique developed in the 1950s, which is widely used today14–17. During MF surgery, the surgeon drills into the debrided chondral bone until the marrow cavity is accessed. A hematoma forms at the MF site that is resorbed and replaced with fibrous tissues. The resulting ‘fibrocartilage’ provides some symptomatic relief but has substantially reduced mechanical properties compared with those of normal articular cartilage6. Little is known about the mechanism through which MF causes fibrocartilage formation, the effect of this technique on resident stem-cell populations or how this can be leveraged for tissue regeneration18.
The limitations of current approaches for addressing OA, including MF, have led to widespread interest in the potential of stem-cell therapy for regenerating cartilage19. The majority of stem-cell-specific trials treating OA of the hip and knee are pilot or feasibility studies investigating the use of plastic-adherent, culture-expanded mesenchymal stem cells (MSCs)7,15,20–23. These MSCs are derived from bone marrow or adipose tissue7,10. However, these MSCs do not constitute validated stem-cell populations, and it is difficult to ascertain the degree of engraftment by the transplanted cells and their contribution to changes in functional outcomes21. The trials also did not reveal specific mechanisms of action behind cases of apparent symptomatic improvement15,22,23. More recently, several groups, including our own, have made progress in identifying SSCs in mice (mSSCs) and humans (hSSCs)24–31. Purified SSCs are defined by their ability to self-renew and their multilineage contribution to bone, cartilage and stroma but not fat. However, it is important to consider that SSCs isolated using different sorting strategies, though similar, may not necessarily be the same, for instance in their ability to make adipocytes. Furthermore, SSCs in the bones of mice and humans are stimulated to proliferate following injury26,27, and injury-activated progenitor populations also demonstrate enhanced skeletogenic potential relative to homeostatic populations32. However, whether activation of resident SSCs can be utilized to regenerate cartilage as a means to treat OA has yet to be determined.
To test the hypothesis that alterations in SSC activity underlie age-related susceptibility to OA33, we first assessed changes in clonal skeletogenesis in the articular surfaces of distal femurs of different aged Rainbow reporter mice in situ34. We crossed Rainbow reporter mice with a transgenic mouse which ubiquitously expressed Actb-CreERT (hereafter β actin-CreERT) to include the possibility that genetic drivers (other than Lepr1) may be active in SSC populations within articular cartilage. To induce random colorimetric labeling of cells systemically in β actin-CreERT/Rainbow mice, we injected tamoxifen into newborn (postnatal day 3 (P3)), juvenile (2 week), adult (6 week), and aged (1 yr) mice, then isolated limb tissue 1 month after treatment to measure the frequency of uniquely colored clones in chondral tissues by histological analysis. The presence of Rainbow-labeled areas is consistent with the presence of mSSCs which has the ability to form multipotent colonies of cartilage and osteoblast lineage cells26,27. We observed that skeletal maturity corresponds to a substantial reduction in the clonality of chondral tissues (Fig. 1a–d)34. In addition, there was a striking reduction in proteoglycan secretion with age in clonally marked chondral areas, as detected by staining with Movat’s Pentachrome and by H&E (Fig. 1f)35.
Fig. 1 |. Age-related changes in articular mSSC activity.
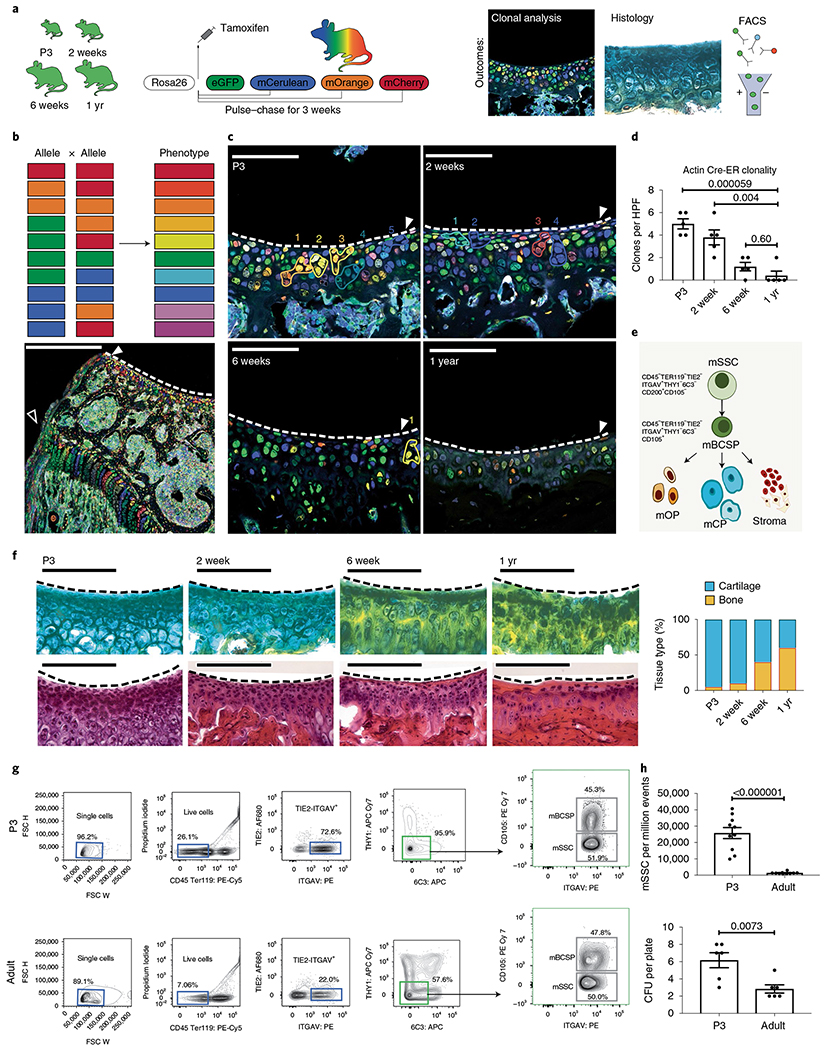
a, Schematic of the experimental outline. βactin-CreERT/Rainbow mice were injected with tamoxifen and analyzed after 3 weeks using fluorescence microscopy and histology, and C57BL/6 mice were analyzed using FACS. eGFP, enhanced GFP. b, Top, schematic of the ten potential colors that can be generated (phenotype) following recombination of alleles in the β actin-CreERT/Rainbow mouse model. Bottom, low magnification of the distal femur showing clonality at the growth plate (white outline arrowhead) and articular surface (white solid arrowhead) of a P3 pup. Scale bar, 500 μm. c, Representative confocal images of articular surfaces (white solid arrowhead and dotted white line) in mice at the indicated ages. Numbers refer to cell clones, outlined in their respective colors. Scale bar, 20μm. n = 5 mice per group. d, Quantitation of the number of clones per high-power field (HPF) at the indicated ages. Ordinary one-way analysis of variance (ANOVA) (P ≤ 0.0001) with post hoc analysis using the Sidak method to compare between specific means. n = 5 mice per group. e, Schematic of the mSSC hierarchy, which can be identified by the indicated cell surface markers. mSSCs differentiate into mBCSPs, which give rise to osteoprogenitors (mOP), chondroprogenitors (mCP) and stromal progenitors (stroma). f, Left, staining of articular cartilage with pentachrome (top) and H&E (bottom) in mice at the indicated ages. Scale bar 100 μm. Representative of three independent experiments. Right, quantitation of the composition of the articular surface in mice at the indicated ages (pentachrome: yellow, bone; blue, cartilage. H&E: purple, cartilage, pink, extracellular material). g, Representative flow cytometry analysis of mSSC populations in P3 (top) and adult (bottom) mice (n = 10 mice per group). h, Top, quantitation of the numbers of mSSCs per million events in FACS analysis of P3 and adult mice (n = 10 mice per group). Bottom, quantitation of colony-forming units (CFUs) isolated by FACS from P3 and adult distal femurs and seeded at a density of 1,000 cells per plate (n = 6 mice per group). Unless otherwise stated, graphs show mean ± s.e.m.; two-tailed Student’s t-test. Exact P values to two significant figures are shown.
Since we had previously observed that clonal areas in mouse skeletal tissues are highly enriched for mSSCs26 (Fig. 1e), we micro-dissected chondral regions from limb joints of young (P3) and adult C57/BL6 male mice to analyze their constituting cell populations by FACS36. These analyses revealed that mSSCs and downstream bone cartilage and stromal progenitors (BCSPs) were substantially diminished (95.9% versus 57.6%) between P3 and adult mice (Fig. 1g,h). Following FACS, we evaluated the mSSCs for their clonogenic potential in vitro. Consistent with our observations of reduced clonality in mature chondral tissues of Rainbow mice, we also found that mSSCs isolated from adult mice have a reduced capacity to form colonies in vitro compared with the capacity of chondral mSSCs isolated from P3 mice (Fig. 1h).
The reduction in mSSCs that we observed with age led us to question how adult SSCs respond to injury, including localized defects introduced by MF surgery. We had previously reported that mSSCs and mouse bone, cartilage and stromal progenitors (mBCSPs) are substantially amplified following bicortical fracture in adult mouse femurs26,32. To assess how focal MF affected the resident SSC population at the articular surface, we introduced MF lesions with a dental drill on the distal femur articular surface of induced β Actin-CreERT/Rainbow mice. We then followed MF-induced remodeling of the chondral tissue with a variety of techniques, including morphometric analysis, immunostaining (IF), 5-ethynyl-2′-deoxyuridine (EdU) labeling and FACS analysis (Fig. 2a–e). Following MF surgery in adult mice (Ad/MF), we detected an increase in EdU-labeled proliferating cells in the vicinity of the MF site that corresponded to an increase in clonally derived tissues in the regenerate (Fig. 2b,d). Compared with uninjured tissue, the regenerated tissues appeared to be morphologically heterogenous and contained proteoglycan-producing chondrocytes and fibrotic cells, which stained positive for type I collagen (COL1) and matrix metalloproteinase-13 (MMP-13) and negative for COL2 (Fig. 2b)37. This MF-induced tissue was indicative of fibrocartilage5, a form of scar cartilage. We also detected some COL10 staining that suggests the existence of hypertrophic chondrocytes in the regenerate. However, by week 4, the frequency of remaining mSSC was reduced (Fig. 2c). The MF-stimulated increase in SSC and BCSP populations appeared to be due to an expansion of skeletal stem/progenitor cells because the majority of expanded mSSCs and mBCSPs incorporated EdU, as determined by intracellular FACS at 1 week following MF (Fig. 2e).
Fig. 2 |. The effect of focal MF on mSSCs at the articular surface.
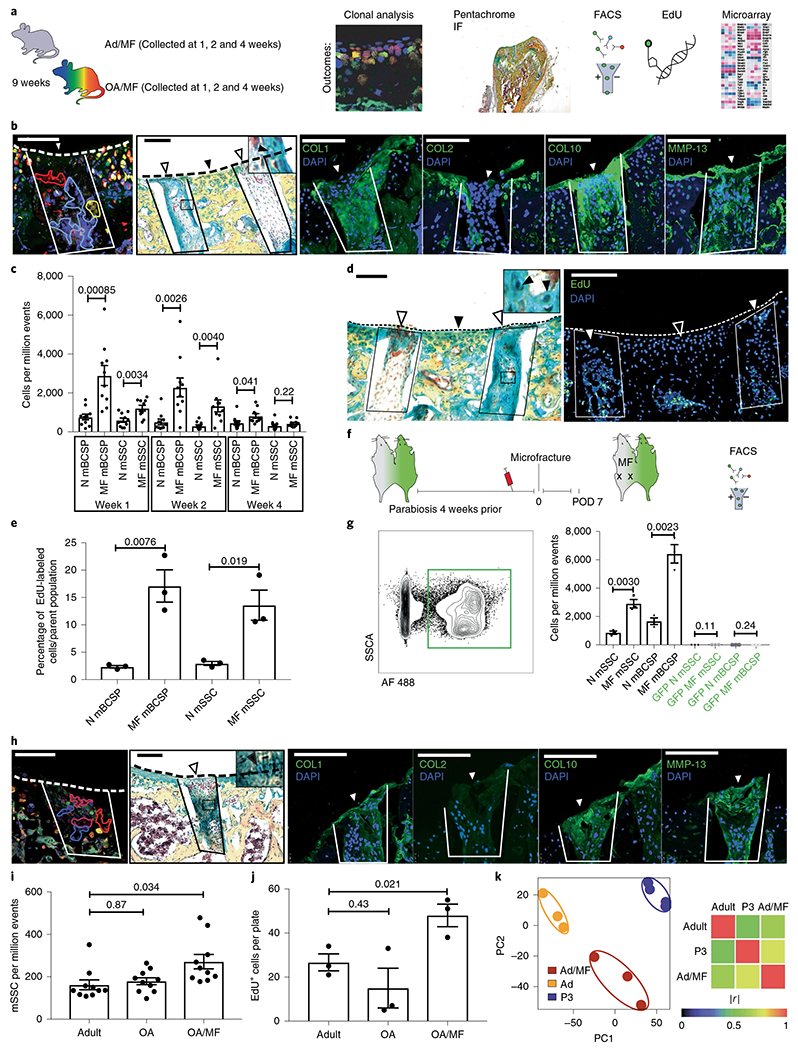
a, Schematic of the experimental outline. MF surgery was performed on the distal femurs of adult mice. The tissue was collected at 1, 2 and 4 weeks after surgery and analyzed using the indicated techniques. b, Histological analysis of 9-week-old adult mice that underwent MF surgery; tissue was collected 4 weeks after MF surgery. From left to right, representative fluorescence microscopy of the clonal expansion within the MF defect in an adult β actin-CreERT/Rainbow mouse; representative pentachrome staining of fibrocartilage within the MF defect of a C57BL/6 mouse (inset shows higher magnification of chondrocytes marked by the black arrowhead); and representative IF staining for collagen COL1, COL2, COL10 and MMP-13 of the same C57BL/6 mouse. The MF defect is outlined in solid lines, and white arrowheads indicate the surface of the regenerate. Black arrowheads indicate uninjured tissue. The dotted line indicates the articular surface. Scale bars, 100 μm. n = 3 mice per group. c, Quantitation of mSSCs and mBCSPs numbers over the course of 4 weeks after MF surgery. N, normal/uninjured mice (n = 10 mice per group per timepoint). Left, representative pentachrome staining for fibrocartilage. White arrowheads indicate the surface of the regenerate. Black arrowhead indicates uninjured tissue. Inset shows higher magnification view, with chondrocytes marked by black arrowheads. n = 5 mice. Right, the adjacent section stained for EdU within the regenerate (outlined by a box and marked with a white arrowhead); the black arrowhead marks uninjured articular cartilage. The dotted line indicates the articular cartilage surface. Scale bars, 100 μm. n = 3 mice. e, Quantitation of the percentage of EdU+ mSSCs and mBCSPs 1 week after MF surgery. n = 3 mice per group. f, Schematic of the experimental design. A parabiosis model was established with a C57BL/6 mouse and a GFP+ mouse. Blood was drawn from the tail vein to assess chimerism. After 4 weeks, MF surgery was performed on the non-GFP mouse, and cells were analyzed on postoperative day (POD) 7 by FACS. g, Left, Representative flow cytometry plot showing GFP+ cells within the circulation of a non-GFP parabiont. Right, Quantitation of non-GFP and GFP+ mSSCs and mBCSPs in the non-GFP mouse (n = 3 per group). h, Histological analysis of OA/MF mice 4 weeks after MF surgery. From left to right, Representative fluorescence microscopy of the clonal expansion within the MF defect of a β actin-CreERT/Rainbow mouse (n = 3 mice); representative pentachrome staining of fibrocartilage within the regenerate of a C57BL/6 mouse (inset shows higher magnification of chondrocytes marked by the black arrowhead); and IF staining for COL1, COL2, COL10 and MMP-13 of the same C57BL/6 mouse. Dotted line indicates the articular surface. White arrowheads indicate the surface of the regenerate. Scale bars, 100 μm. n = 3 mice. i, Quantification of the numbers of mSSCs in adult mice, OA mice and OA/MF mice. Ordinary one-way ANOVA (P = 0.012) with post hoc analysis using the Sidak method to compare between specific means. n = 10 mice per group. j, Quantification of an in vitro EdU assay of FACS-isolated adult, OA and OA/MF mSSCs. Ordinary one-way ANOVA (P = 0.028) with post hoc analysis using the Sidak method to compare between specific means. n = 3 mice per group. k, Left, PCA plot showing clustering of microarray data from adult, Ad/MF and P3 mice. Right, Pearson product-moment correlation coefficient (r) of gene-expression activity. |r| = 1 signifies identical correlation, or no variance. n = 3 for Ad and Ad/MF; n = 4 for P3. Unless otherwise stated, graphs show mean ± s.e.m.; two-tailed Student’s t-test. Exact P values to two significant figures shown.
We then asked whether amplification of SSC numbers at the MF site could be due to recruitment of systemically derived cells. To investigate potential contribution by circulating mSSCs to the regenerate, we established green fluorescent protein (GFP) to non-GFP parabiont mice (Fig. 2f,g), but found little evidence of systemically recruited mSSCs and mBCSPs at the MF site38. We concluded that the increase in mSSCs following MF is due to local expansion, rather than recruitment, of circulating mSSCs at the injured mouse joint.
Although we have shown that MF can amplify regenerative mSSCs in healthy adult mice, we hypothesized that MF could also stimulate mSSC expansion in osteoarthritic (OA) mouse joints33. To evaluate the effects of MF in an OA setting, we employed a clinically relevant mouse model of OA that is induced by destabilization of the medial meniscus39,40. Following MF surgery in the OA joint (OA/MF), we observed a local increase in clonality within the defect, which resulted in fibrocartilage formation. Fibrocartilage was confirmed by immunofluorescence, with the regenerating staining positive for COL1, COL10 and MMP-13, and negative for COL2 (Fig. 2h). Chronic injury in OA without MF did not yield a substantial increase in mSSCs; however, MF surgery substantially increased the number of mSSCs in OA (Fig. 2i). The MF-activated mSSCs also demonstrated inherently greater proliferative potential, as revealed by higher levels of EdU labeling in vitro, relative to mSSCs isolated from adult mice, and adult mouse OA joints (Fig. 2j).
Considering that we had observed that fractures could induce re-expression of embryonic genes in the mandible that are silenced in adults, we asked whether MF induces similar changes in mSSC gene expression41. We therefore isolated mSSCs from the joints of adult and Ad/MF mice and newborn mice P3 pups, and compared their transcriptomes using microarray analysis. Using the Gene Expression Commons platform (https://gexc.riken.jp), we normalized the expression data and computed dynamic ranges across all probe sets and then performed principal-component analysis on the adult, Ad/MF and P3 mSSC transcriptomes. We found that the transcriptomes of adult uninjured mSSCs clustered separately from Ad/MF and P3 (Fig. 2k and Extended Data Fig. 1a–c). In particular, Ad/MF mSSCs showed greater overall transcriptomic similarity to P3 mSSCs. Pathways enriched in Ad/MF and P3 mSSC also included those responsible for cell cycling and cartilage development (Extended Data Fig. 1a–c), suggesting that MF reverts mSSCs to a more juvenile gene expression (Extended Data Fig. 1a–d).
We previously observed that mBCSPs isolated from fracture calluses display enhanced skeletogenic activity relative to mBCSPs isolated from uninjured bone32. To determine whether MF surgery alters mSSCs on the articular surface, we transplanted GFP+ mSSCs collected from the distal femur, including cartilage and bone, of adults and Ad/MF mice into immunodeficient NSG mice in two different niches (Fig. 3a). Specifically, we transplanted 20,000 FACS-isolated GFP+ adult or Ad/MF mSSCs beneath the renal capsule or orthotopically into the distal femur following MF Four weeks post-transplantation, we observed that Ad/MF mSSCs formed both fibrous and cartilaginous tissue in both niches (Fig. 3b,c, lower right panels). In contrast, adult mSSCs formed more bone tissue regardless of recipient site (kidney or knee) (Fig. 3b,c, upper right panels). We also observed higher contribution by GFP-labeled Ad/MF mSSCs in the regenerated tissue than by adult mSSCs after transplantation to the knee (Fig. 3d), consistent with previous EdU assays indicating that Ad/MF mSSCs have a greater proliferative capacity than adult mSSCs do (Fig. 2d,e). GFP+ Ad/MF mSSCs also formed more fibrocartilage than did adult mSSCs, as seen by IF costaining showing COL1 and MMP-13 positivity within the GFP+ Ad/MF mSSC cellular matrix (Fig. 3d). Our data suggest that, both in terms of their enhanced proliferation and increased cartilage formation, MF-activated SSCs more closely resemble juvenile than adult uninjured mSSCs. Consistent with the in vivo data, mSSCs from MF also show intrinsically enhanced osteogenic and cartilagenic potential in vitro with absent adipogenic potential (Extended Data Fig. 2a–c). By carefully microdissecting the articular surface, periosteum and bone marrow after MF surgery for FACS analysis and chondrogenic differentiation, we found that the mobilization of activated mSSCs likely involves all three areas, although there were higher frequencies of activated mSSCs in the chondal areas (Extended Data Fig. 3a–f).
Fig. 3 |. Manipulating the adult articular microenvironment to facilitate mSSC-derived chondrogenesis.
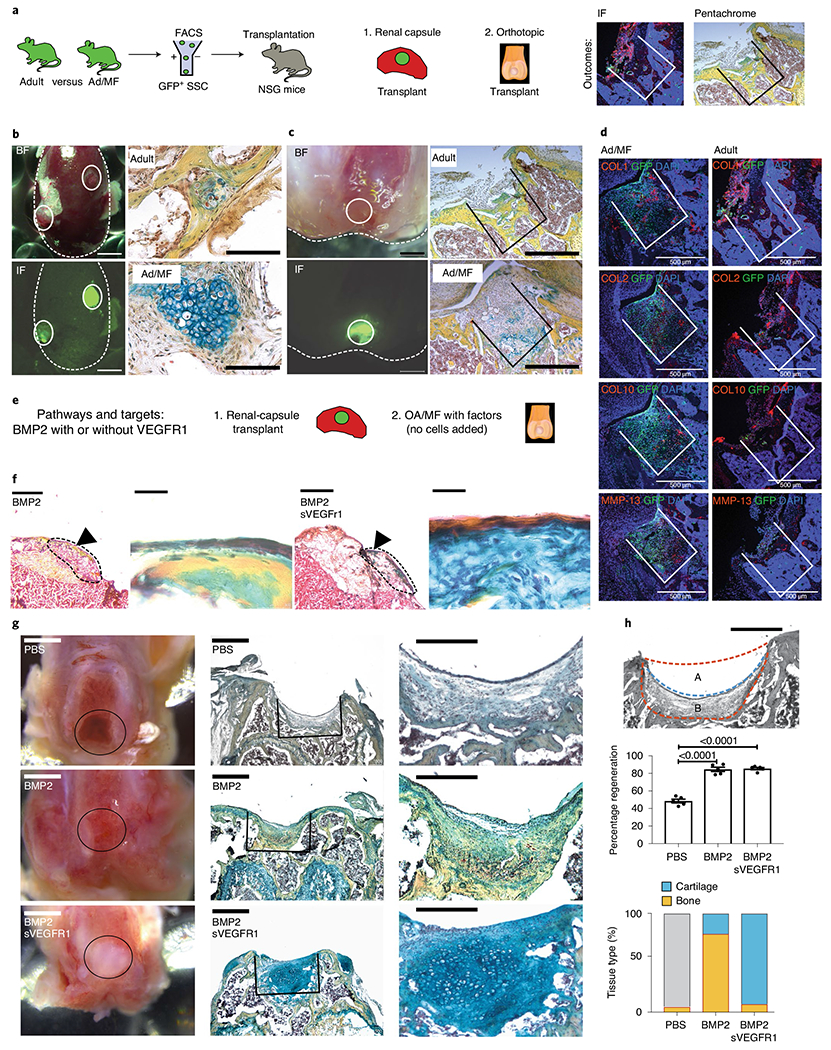
a, Schematic of the experimental outline to assess cell intrinsic changes in GFP+ adult mice (Ad) versus adult microfractured mice (Ad/MF). Cells were isolated using FACS and transplanted either within the renal capsule or within a MF defect at the distal femur of immunocompromised NSG mice. b, Transplantation of Ad and Ad/MF GFP+ mSSCs into the renal capsule of an NSG mouse. Left, brightfield and fluorescence microscopy show gross images of two grafts within the renal capsule. Solid lines indicate the grafts. Scale bar, 1 mm. Right, pentachrome staining of the Ad and Ad/MF mSSC grafts. Scale bar, 100 μm. n = 4 mice per group. c, Transplantation of adult and Ad/MF GFP+ mSSCs orthotopically. Left, brightfield and fluorescence microscopy show gross images of the orthotopic transplant within the MF defect. Solid lines indicate the grafts. Right, pentachrome staining of the Ad and Ad/MF mSSC grafts within the MF defects. Scale bar, 500 μm. n = 4 mice per group. d, Representative IF staining for COL1, COL2, COL10 and MMP-13 of GFP+ mSSC transplants within the MF defects. Scale bars, 500 μm. n = 3 mice per group. e, Schematic of the experimental design to assess cell-extrinsic effects of the niche. Ad/MF mSSCs are isolated by FACS and transplanted into the renal capsules of NSG mice along with hydrogels containing either BMP2 or BMP2 + sVEGFR1. OA/MF mice are treated with hydrogels containing PBS, BMP2 or BMP2 + sVEGFR1. f, Representative pentachrome stains of Ad/MF renal-capsule transplants treated with either BMP2 or BMP2 + sVEGFR1. Left, low magnification (scale bar, 1 mm) with the region of interest (ROI) indicated by the black arrowhead. Right, higher magnification of ROI. Scale bars, 500 μm. n = 4 mice per group. g, OA/MF defects with transplants of hydrogels with the indicated factors. From left to right, gross images (scale bars, 1 mm); representative pentachrome stains of the regenerate (scale bars, 500 μm); and higher magnification (scale bars, 100 μm) of the pentachrome stains. n = 8 mice per group. h, Tissue regeneration. Top, a schematic of the MF defect outlined by the dotted orange line and the regenerate outlined by the blue line (scale bar, 500 μm). The percentage regeneration was calculated as: 100 × (A / A + B). Middle, quantification of regeneration with treatment of BMP2, BMP2 + sVEGFR1 or PBS. Graph shows mean ± s.e.m.; ordinary one-way ANOVA (P < 0.0001) with post hoc analysis using the Sidak method to compare between specific means. Exact P values to two significant figures shown. Bottom, quantitation of the composition of the articular surface in mice after treatment with the indicated factors. Yellow signifies bone, and blue signifies cartilage within the regenerate (n = 5 mice per group).
Although fibrocartilage is preferable to an exposed bone defect, its mechanical properties are inferior to articular cartilage. The ultimate goal of MF surgery is to produce articular cartilage; therefore, we asked whether we could provide a niche promoting formation of articular cartilage rather than fibrocartilage. Two key pathways, BMP2 and VEGF, play an important role in determining the fate of tissue remodeling and homeostasis of cartilage42,43. BMP2 is well known as a potent osteogenic growth factor44–48. Inhibiting VEGF signaling has been shown to reduce OA progression and fibrosis in vivo49,50. We have also found that a combination of BMP2 with VEGF inhibition using soluble sVEGFR1 leads to cartilage formation in resting mSSCs and hSSCs26,27. We observed that BMP2 and VEGF inhibition promote expression of cartilaginous pathways on sorted mSSCs in vitro, suggesting that these pathways regulate cartilage differentiation in mSSCs directly (Extended Data Fig. 1d). We also show that mSSCs isolated from the articular surface, periosteum and bone marrow all produced higher amounts of cartilage with addition of BMP2 + sVEGFR1 when compared with addition of PBS only (Extended Data Fig. 3f). To determine how BMP2 and VEGF blockade could influence MF-activated mSSC differentiation in vivo, we cotransplanted Ad/MF mSSCs with BMP2 with or without sVEGFR1. We used FACS to isolate and transplant 20,000 adult MF mSSCs beneath the renal capsule of NSG mice and placed a lyophilized collagen sponge, treated with combinations of BMP2 and sVEGFR1, directly beside the transplanted cells; we then allowed the mSSCs to differentiate for 4 weeks. Cotransplantation of adult MF mSSCs and BMP2 produced bone, whereas cotransplantation with BMP2 + sVEGFR1 led to increased cartilage formation (Fig. 3e,f).
Having determined that BMP2 and sVEGFR1 could guide MF-activated mSSCs toward chondrogenic fates in vivo, we asked whether combining MF surgery and codelivery of BMP2 and sVEGFR1 could stimulate cartilage regeneration in an immunocompetent, OA setting. Using our model of meniscectomy-induced OA (Extended Data Fig. 4a–c), we microfractured OA knee joints, and then delivered previously validated PEG hydrogel constructs, treated with combinations of BMP2 and sVEGFR1, to the MF site51. We allowed the recipient mice to heal for 4 weeks before re-isolating joints for histological analysis. We found that PEG hydrogels loaded with control PBS led to a fibrotic-tissue defect with minimal cartilage or bone regeneration, whereas PEG hydrogels loaded with BMP2 promoted substantial bone formation at the MF site (Fig. 3g).
In contrast, BMP2 + sVEGFR1 stimulated robust formation of cartilage at the MF site that stained intensely blue for proteoglycan by Movat’s Pentachrome and contained numerous morphologically distinct chondrocytes (Fig. 3g). While regeneration was substantially enhanced in both the BMP2 and BMP2 + sVEGFR1 groups, only the combination of sVEGFR1 with BMP2 resulted in substantial cartilage formation (Fig. 3h). The regenerated cartilage also stained positive for aggrecan (ACAN) and COL2, and negative for fibroblast markers such as COL1 and MMP-13, suggesting that stable mature cartilage was formed (Extended Data Fig. 5a–c). COL10 expression, which is indicative of hypertrophic chondrocytes, was also substantially diminished in the group that received BMP2 and sVEGFR1 treatment. The results consistently indicated that intra-articular use of BMP2 stimulates local bone formation, whereas BMP2 + sVEGFR1 leads to stable aggrecan-positive cartilage formation in a clinically relevant mouse OA model (Extended Data Fig. 5d).
To examine the rate and duration of cartilage formation, and to exclude endochondral ossification in our BMP2 + sVEGFR1-treated group, we collected knee joints from OA/MF mice at 2, 4, 8 and 16 weeks (Extended Data Figs. 5a–d, 6a–c and 7a–c). At 2 weeks, we found that the regenerate with BMP2 + sVEGFR1 already stained positive for ACAN and COL2 in IHC analysis. At 2 weeks, PBS regenerated tissue showed minor fibrosis and BMP2 showed some ossification, suggesting that there was some tissue remodeling at 2 weeks (Extended Data Fig. 6a). We observed similar, persistent histological findings at 8 weeks (Extended Data Fig. 6b) and even 16 weeks (Extended Data Fig. 7a–c), indicating stable and durable regeneration of lost cartilage. MF-stimulated expansion of mSSCs was substantially diminished in aged animals, corresponding to reduced cartilage regeneration (Extended Data Fig. 8a,b). However, GFP+ MF-activated mSSCs isolated from young adult mice robustly contributed to stable cartilage formation when transplanted with BMP2 + sVEGFR1 into irradiated joint tissues (Extended Data Fig. 8c,d).
Although we showed histologically that the regenerate stained positive for ACAN and COL2, we wanted to further assess its mechanical qualities. Viscoelastic properties of the regenerate were assessed using atomic force microscopy (AFM) at 8 weeks post-MF. Many groups have characterized mechanical properties of articular cartilage from larger animals with indentation techniques, but given the scale of our defects, AFM was considered a more precise and delicate method to characterize the regenerate52,53.
Utilizing AFM with a spherical probe (Extended Data Fig. 9a), we observed that the modulus of BMP2-treated regenerate was greater than that of both BMP2 + sVEGFR1 regenerate and uninjured cartilage. The AFM measurements further indicated that the BMP2 + sVEGFR1 regenerate had a log.DMT elastic modulus, deformation and force volume within the range of those observed for uninjured cartilage (Extended Data Fig. 9b). Examples of force height curves also demonstrated that BMP2 + sVEGFR1 regenerates displayed mechanical characteristics similar to those of uninjured cartilage. Taken together, our results indicated that combining MF activation with BMP2 + sVEGFR1 induced resurfacing of OA joints with new cartilage that possessed biomechanical properties similar to those of uninjured cartilage (Extended Data Fig. 9c). It was encouraging that the restoration of biomechanically similar cartilage in affected joints also corresponded with improved mobility parameters in the animal as measured by gait analysis (Extended Data Fig. 10a) as well as enhanced pain relief (Extended Data Fig. 10b,c).
Thus far, we have observed that MF can induce a transient, localized expansion of mSSCs in chondral tissues, despite maturity-related depletion of the resident stem-cell pool. Furthermore, the MF-activated mSSCs possess enhanced clonogenic activity and could be amplified and skewed toward cartilage differentiation by stimulation of BMP2 signaling while VEGF signaling is antagonized. To determine whether MF can elicit a similar regenerative response by hSSCs, we first asked whether maturity also corresponds to reduced hSSC pools in human chondral tissues. We compared hSSC frequency in 18-weeks-gestation human fetal distal femurs with that in human adult femoral heads using a validated human hSSC FACS gating strategy (Fig. 4a)27. We found that, as with mice, there is a substantial reduction in hSSCs with age (Fig. 4b,c). When human fetal and adult articular cartilage were explanted into the renal capsule of NSG mice, we found that human fetal cartilage produced considerably more proteoglycan than human adult cartilage did. In addition, human fetal tissue was substantially more cellular and proliferative at 4 weeks post-transplant (Fig. 4d–f). These data corroborate our findings in mice and suggest that human chondral hSSCs are also depleted substantially by the onset of maturity.
Fig. 4 |. Regeneration of human articular cartilage in a preclinical xenograft model.
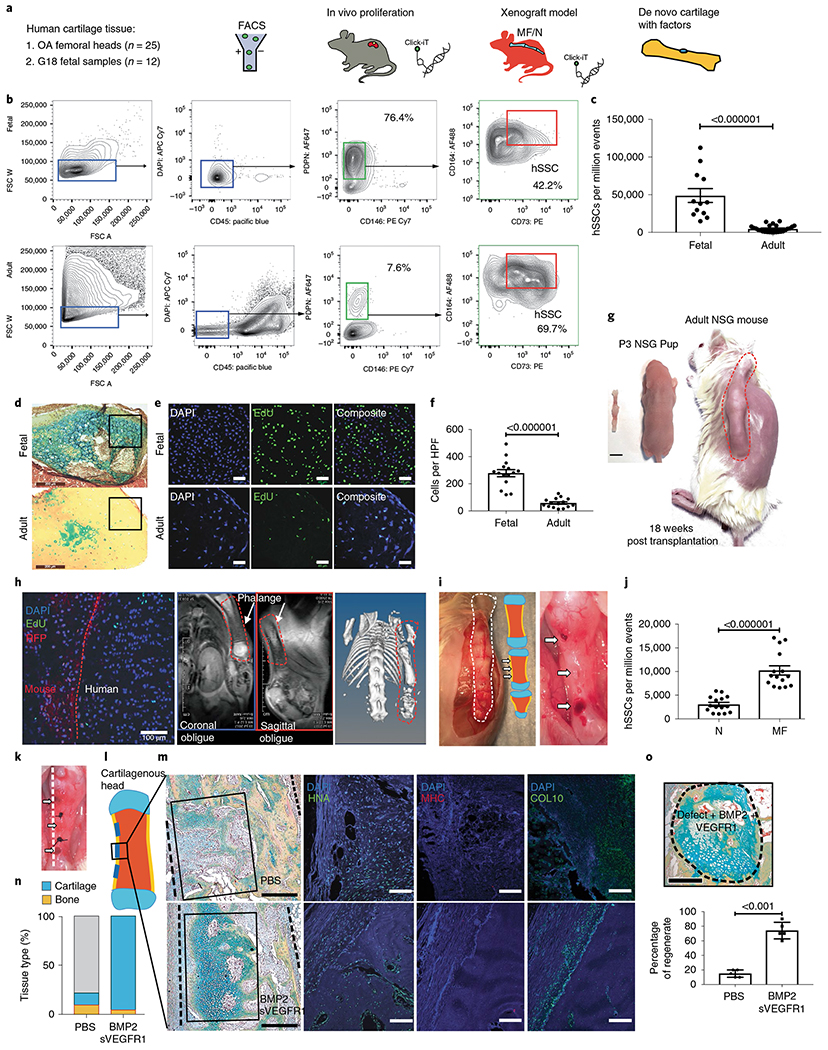
a, Schematic of the experimental outline. Human adult and fetal SSCs are isolated by FACS and transplanted within the kidney capsule of immunocompromised NSG mice. Cell proliferation is analyzed by Click-iT EdU. A human xenograft MF model is established by transplanting whole fetal phalanges under the dorsum of P3 NSG pups. Click-iT EdU is used to analyze cell proliferation. Hydrogels are transplanted in MF defects of the phalanges, and tissue regeneration is analyzed by histology. b, Representative flow cytometry showing the validated human articular SSC (hSSC) profile and percentages of PDPN+CD146− cells from human fetal cartilage (top) and human adult cartilage (bottom). c, Quantification of the numbers of hSSC per million events in FACS analysis of fetal and adult cartilage. (b,c, adult cartilage n = 25 biologically independent samples, 20 male, 5 female. 48-90 years; fetal cartilage n = 12 biologically independent samples, 18 weeks gestation). d, Representative pentachrome stains of human fetal (top) and human adult (bottom) articular cartilage 4 weeks after transplantation into NSG mice. Scale bars, 200 μm (n = 8 biologically independent samples per group). e, Representative fluorescence microscopy of in vivo Click-iT EdU assays of hSSC transplants within the renal capsule of NSG mice. Top, human fetal articular cartilage. Bottom, human adult articular cartilage transplant. Scale bars, 45 μm. n = 8 biologically independent samples per group. f, Quantitation of the number of clones per HPF (n = 15 biologically independent samples per group). g, Gestation-week-18 human fetal phalanges were transplanted subcutaneously into the dorsum of P3 RFP NSG mice (scale bar, 5 mm); the same mouse is shown at 18 weeks post-transplant. h, From left to right, EdU GFP+ non-RFP human tissue proliferating in vivo. Scale bar 100 μm. MRI shows healthy human tissue, and micro-CT shows evidence of ossification of the human diaphysis in vivo. The xenograft is outlined with an orange dotted line. Representative of two independent experiments. i, Left, evidence of healthy viable human fetal phalangeal tissue with a schematic showing areas of MF. Right, three areas of MF on a human fetal phalangeal diaphysis indicated by white arrows. Representative of 15 independent experiments. j, Quantification of hSSC post MF of human fetal phalangeal diaphyseal regions. (n = 15 per group). k, Gross image of MF human fetal phalangeal diaphysis with transplanted hydrogels marked by white arrows. Sutures indicate the sites between MF defects. Dotted line indicates the plane of sectioning. l, Schematic showing the regions where MF surgery was performed on the human fetal phalangeal diaphysis, as indicated by blue lines. Topical factors were applied within the MF defect. m, Top, PBS control. Bottom, BMP2 + sVEGFR1. Left, pentachrome stains for cartilage within the MF defect. Right, corresponding IF staining of the regenerate for (left to right) human nuclear antigen (HNA), mouse-specific MHC and COL10. Scale bars, 500 μm. n = 8 mice per group. n, Quantification of the tissue composition within the MF defects that were treated with PBS or BMP2 + sVEGFR1. Yellow signifies bone and blue signifies cartilage within the regenerate. o, Top, representative pentachrome staining of de novo cartilage formation within a MF defect treated with BMP2 + sVEGFR1. Scale bar, 500 μm. Bottom, quantification of the tissue regeneration within the MF defects that were treated with PBS or BMP2 + sVEGFR1. n = 5 mice per group. Unless otherwise stated, graphs show mean ± s.e.m.; two-tailed Student’s t-test. Exact P values to two significant figures.
To investigate whether MF surgery could reactivate human hSSC expansion, we established a preclinical human xenograft model by transplanting human 18-week gestation phalanges into the dorsum of red fluorescent protein (RFP) NSG P3 pups (Fig. 4g)27. Human tissue viability was confirmed by detection of numerous proliferating EdU+ cells within non-RFP human fetal phalangeal xenograft tissue in vivo, as well as viable cartilage shown by magnetic resonance imaging (MRI) and ossification by micro computed tomography (micro-CT) (Fig. 4h).
To assess whether a cortical bone defect would yield a substantial increase in hSSCs, the viable human fetal phalangeal xenograft was acutely injured at the diaphysis (Fig. 4i). To utilize a bone niche, we created a cortical bone defect at the human fetal phalangeal diaphysis, rather than the articular surface of the phalangeal xenograft, as the articular surfaces are still highly cartilaginous. We observed that unicortical defect resulted in an amplification of hSSCs detected by FACS 1 week after surgery (Fig. 4j). To confirm whether a cortical-bone defect with the addition of chemical niche manipulation could stimulate de novo cartilage growth within a cortical bone niche, we injured the human fetal phalangeal diaphyseal cortex and applied hydrogels with PBS or BMP2 + sVEGFR1 within the defects (Fig. 4k). As was seen in mice, BMP2 + sVEGFR1 generated substantially more de novo cartilage within the human fetal phalangeal cortical bone niche than did PBS (Fig. 4l–o). Paralleling the results we saw in our mouse mSSC model, our human data confirmed the role of MF-mechanical stimulus in activating local SSC populations and supported the role of BMP2 and VEGF inhibition in regenerating cartilage. Clinical studies, in the settings of acute cartilage defects or hand osteoarthritis, might provide good clinical opportunities to test the efficacy of this approach in human patients.
Tissue-specific stem cells are necessary for formation and maintenance of many tissue types. Emerging evidence suggests that in some adult tissues, there are no or diminished resident stem cell populations54. Because adult articular cartilage possesses little regenerative ability compared with bone tissues, we initially suspected that SSC populations may no longer be present in adult cartilage tissues. Using our previously described methods for isolating functionally defined mSSCs and hSSCs by FACS, we found that the frequency of adult SSCs is substantially lower than the frequency in juvenile or fetal tissues. However, mature articular cartilage tissues in both mice and humans still contain reservoirs of SSCs. We have found that these resident pools of SSCs can be reactivated in response to a local acute injury following MF and these ‘activated’ SSCs contain enhanced chondrogenic potential, reflecting alterations at the transcriptomic level. These findings led us to develop a multifaceted approach for successful regeneration of articular cartilage. Resident SSCs are first activated by a local MF surgery, expanded by local delivery of BMP2 and guided toward cartilage using VEGF blockade, which repress osteogenic and fibroblastic fates55,56.
The chondrogenic potential of BMP2 with sVEGFR1 has been shown in mouse26 and human27 studies. With Food & Drug Administration (FDA)-approved versions of BMP2 (Infuse) and VEGF signaling blockage (Avastin) already in clinical use, we believe these factors have the potential to be used in combination with MF surgery for cases of early, mild OA cartilage regeneration57,58. Our study further demonstrates that localized, acute injuries can present a powerful extrinsic cue to resident stem cells even in adult tissues with poor regenerative potential. Acute injury can dramatically alter resident-stem-cell behavior and provide opportunities for further enhancing their regenerative ability by specific modulation of their regenerative niche41,59.
While other studies have investigated disease progression of OA60, to our knowledge this is one of the first studies that has shown effective, stable articular cartilage re-formation through the lens of resident-SSC-specific activation and biochemical-niche-differentiation fate control.
Methods
Mouse MF model.
Nine-week-old, skeletally mature, sex-matched C57BL/6 or β Actin-CreERT/Rainbow mice were used to examine the effect of MF on the resident mSSC population. Under general anesthesia (isoflurane), after assessing the pain response of the mice by using a toe pinch, we made a 5-mm incision medial to knee, reflected the patella laterally, applied a drop of sterile 0.9% sodium chloride and flexed the knee to expose the femoral condyles. Microfracturing was performed on the articular surface of the left femur (0.1-mm diameter to access underling subchondral bone). The right femur underwent incisions to expose patella but without MF and acted as a control (sham). The patella was repositioned. The incision was closed with 6-0 prolene suture.
Mouse OA model.
Mice were anesthetized with general anesthetic with inhaled isoflurane and a preoperative dose of 0.5 ml per kg (body weight) of buprenorphine. Routine preparation and surgical draping of each animal around the surgical site included: shaving the leg, a thorough cleaning with 70% alcohol/betadine and draping with sterile gauze. Surgical instruments were sterilized with heat. A 5-mm incision made medial to knee. The patella was reflected laterally. A drop of sterile 0.9% sodium chloride was applied. The knee was flexed to expose the femoral chondyles. A small vertical incision was made to the meniscotibial ligament of the medial meniscus. The patella was repositioned. The incision was closed with 6-0 prolene.
Mouse parabiosis model.
To investigate the effect of circulating cells to form the regenerate, after MF we parabiosed GFP+ homozygous mice with C57BL/6. Both mice were positioned side by side in the supine position with the non-GFP mouse on the right and the GFP+ mouse on the left. Under general anesthesia (isoflurane), we made a longitudinal (midaxial line) incision from knee to elbow on the right side of the C57BL/6 and the left side of the GFP+ mouse. Deep 4-0 prolene sutures were placed uniformly through the muscle bellies of both mice along the quadriceps, obliques, latissimus dorsi and triceps. The skin was closed with 6-0 prolene. For confirmation of adequate chimerism, we used FACS to analyze the circulation of the non-GFP mouse, showing GFP+ cells at 4 weeks by a blood draw from a tail-vein assay of the C57BL/6 mice at 4 weeks. After confirming crosscirculation at 4 weeks, MF surgery was performed on the left knee of the non-GFP parabiont, using a technique described above in the Mouse MF model in the C57BL/6 mouse.
Human xenograft MF model.
Fetal 10- to 18-week old phalanges were dissected and transplanted under the dorsum of immunocompromised P3 RFP NSG pups27. The xenograft model was then left for at least 6–18 weeks to ensure optimal xenograft engraftment. After engraftment, under general anesthesia (isoflurane), the graft was accessed and the diaphyseal cortical surfaces of the middle phalangeal bone underwent MF. Non-MF areas in the proximal and distal phalangeal diaphysis served as controls.
Clonal analysis.
We accessed clonal skeletogenic activity in male Rainbow mouse model crossed with the ubiquitous β Actin-CreERT driver. Systemic induction by intraperitoneal administration of tamoxifen (200 mg per kg (body weight)) for 5 d labeled all cells. The rainbow reporter is a multi-color Cre-dependent marker system with a four-color construct. Once recombination occurs, cells are randomly and genetically marked with a color (one of eight total colors). All daughter cells will inherit that same color. The systemic contribution to clonality was then assessed. Fixation, decalcification and embedding of the isolated knee joints were performed as has been described by our group30.
FACS isolation and analysis of mouse SSCs using FACS.
The ROI (distal femur) was dissected out, and cells were isolated with a combination of mechanical and collagenase digestion32. The solution was then centrifuged. The supernatant was removed with the remaining cell pellet resuspended in FACS-buffered solution. The remaining cells were then stained for antibodies to the following antigens: CD45, Ter119, CD202b, Thy1.1, Thy1.2, CD105, CD51, 6C3 and streptavidin-conjugated antibody against CD200 as used before26. Propidium iodide was used to label and exclude any dead cells. FACS analysis was performed on an FACS Aria ll Instrument (BD Biosciences), using FlowJo v10 and BD FACSDiva v8.0 software.
FACS isolation and analysis of human SSCs from fetal and adult specimens using FACS.
The ROI was dissected out and serially digested with the collagenase buffer supplemented with DNase in constant agitation at 37 °C for 20 min. This was repeated three times in total. Each digest was filtered through a 70-μm filter, and the collagenase buffer was neutralized with FACS-buffered solution. The solution was then centrifuged. The supernatant was removed with the remaining cell pellet resuspended in FACS-buffered solution. The remaining cells were stained for antibodies to CD45, CD235ab, Tie2, CD31, CD146, PDPN, CD73 and CD164. DAPI was used to label and exclude any dead cells24. FACS analysis was performed on an FACS Aria ll Instrument using a 100-μm nozzle. FACS results were analyzed and sorted by cell populations to include SSC, BCSP and PCP populations. Populations were double sorted for purity.
Cell culture.
Cells were maintained in an incubator at 37 °C with 5% CO2. For cultivation, MEMalpha (Invitrogen) was supplemented with 100 U ml−1 penicillin and 1,000 U ml−1 streptomycin (Invitrogen), and 10% FBS.
Chondrogenesis differentiation.
Assays were performed in micromass cultures by pipetting a 5-μl droplet of cell suspension (appr 1.5 × 10⁷ cells ml−1) in the center of each well (48-well plate). Micromasses were cultured for 2 h in the incubator, before the addition of warm chondrogenic medium (high-glucose DMEM (Invitrogen)) with 10% FBS, 100 nM dexamethasone, 1 μM l-ascorbic acid-2-phosphate and 10 ng ml−1 transforming growth factor β1. Cell medium was changed every other day. At day 21, cells were fixed and stained with 1% Alcian-Blue staining (Sigma) for 30 min at room temperature.
Osteogenic differentiation.
Subconfluent cells were supplemented with osteogenic medium (MEMalpha low glucose (Invitrogen)) with 2% FBS, 100 nM dexamethasone, 0.2 mM l-ascorbic acid-2-phosphate and 10 mM β-glycerophosphate for 14 d. Cells were then formalin-fixed and stained with 2% Alizarin Red S (Roth) in distilled water.
Adipogenic differentiation.
Cells were cultured and allow to expand for 3 d to confluency. For adipogenic differentiation, induction medium (growth medium) containing 5 μg ml−1 human insulin (Roche), 50 μM indomethacin, 1 μM dexamethasone, 0.5 μM isobutylmethylxanthine and 1 nM 3,3′,5-triiodo-l-thyronine (T3) (all from Sigma-Aldrich) were added for 48 h, followed by a period of 5 d of further differentiation in growth medium and the addition of T3 and insulin only. Oil Red O staining was performed after fixing cells with 4% PFA for 15 min at room temperature.
Determining colony-forming capabilities.
Purified populations of mouse and human SSCs were collected by FACS and plated directly in n = 3 replicate platings on pre-coated (0.1% gelatin) culture plates. There were a uniform 1,000 cells per well in a 10 cm2 plate. The medium used was MEMalpha medium with 10% FCS and 1% penicillin–streptomycin. Conditions were set at low O2 (2% atmospheric O2 and 7.5% CO2). The colony-forming units (CFU) were assessed at 2 weeks after plating using an inverted microscope at ×40 magnification.
In vivo differentiation assays.
After isolation of the respective cell using FACS, 20,000 cells were collected and resuspended in 2 μl matrigel. The cellular mix was then injected into either the renal capsule or orthotopic cartilaginous defect. The animals were then euthanized 4 weeks post-transplantation32.
Tissue preparation.
Fixation, decalcification and embedding of the isolated knee joints was performed using: 2% paraformaldehyde at 4 °C for 24 h, 0.4 M EDTA in PBS (pH 7.2) at 4 °C for 2 weeks. Tissues were embedded in optimal cutting temperature compound after 24 h in 30% sucrose. Eight-micrometer slices were made with a microtome in a coronal plane.
Hydrogel fabrication.
Eight-arm PEG monomers with end groups of norbornene (molecular weight, 10 kDa) or mercaptoacetic ester (molecular weight, 10 kDa) were dissolved in PBS at a concentration of 20% (wt/vol). Photoinitiator lithium phenyl-2,4,6-trimethylbenzoylphosphinate was then added to each solution to make a concentration of 0.05% (wt/vol). The two polymer solutions were mixed at a 1:1 volume ratio to obtain a hydrogel precursor solution47. Recombinant BMP2 and sVEGFR1 (R&D Systems) were added to precursor solution to reach predetermined loading amount. Solutions were sandwiched between 2 slides with a thickness of 400 μm and exposed to ultraviolet light (365 nm, 4 mW per cm2) for 5 min. The hydrogels were made with volume of 1 μl or 10 μl. The growth factor loading per each 6 μl hydrogel included: 3 μg BMP2 ± 25 μg sVEGFR1. The hydrogels were made without growth factors and served as controls.
Determining the proliferative capacity of cells.
To determine the proliferative capacity of the cells, we pulse-injected the mice with 50 mg per kg (body weight) of EdU twice weekly for 1 week. For histology, the mice were euthanized at 1 week. After tissue preparation, we used a Click-iT reaction by Invitrogen Thermo Fisher (as per manufacturer’s guidelines)—a copper-catalyzed azide-alkyne cycloaddition—using a fluorescent Alexa Fluor 488 to detect the incorporated EdU. For EdU Intracellular FACS, to assess the proliferative capacity of SSC and BCSP populations, we first used FACS to sort the populations into buffered solution. Then, we fixed the cells and permeabilized the cells using BD Cytofix Cytoperm kit. When the cells were fixed and permeabilized, we then performed the Click-iT EdU assay on the FACS-isolated cells. Following the Click-iT EdU reaction we then used FACS again to sort the purified SSC and BCSP populations while assessing GFP signal changes between the MF and uninjured groups.
Definition of fibrocartilage by Movat’s pentachrome staining.
Sections were stained using Movat’s pentachrome. The outcomes were reported by expert histopathologists who were blinded to the experimental groups. Immunofluorescence (IF) of ACAN, COL1, COL2, COL10 and MMP-13 involved rehydration and staining with rabbit anti-mouse or anti-human primary antibodies against ACAN, COL1, COL2, COL10 or MMP-13 (diluted to 1:500) overnight at 4 °C. The secondary antibody goat anti-rabbit AF-488 was added the following day.
Fluorescence microscopy (Leica TCS Sp8) was used to assess for FITC tagged secondary to ACAN, COL1, COL2, COL10 and MMP-13.
Atomic force microscopy.
Eight weeks following MF and application of hydrogels, the mice were euthanized. Distal femurs were then imaged grossly by stereomicroscopy. Utilizing a microtome blade, the defect was bisected. Half of the tissue was immediately fixed in 4% PFA (and processed as usual) and the other half of the freshly isolated tissue was then dissected further and cleaned.
The tissue was then fixed to a slide glass utilizing tissue glue. The samples were hydrated in protease-free PBS to prevent tissue degradation. The samples were then imaged on a Bruker Resolve Bio-AFM (Bio-AFM). We utilized a pre-calibrated set of Nanotools 40 N/m B50-NCH biosphere spherical probes. All variables, including spring constant, resonant frequency in air and quality factor in air were kept constant throughout experimental groups. Analysis was performed utilizing Nanoscope Analysis 1.9 Software.
Microarray analysis of mSSCs and bulk tissues in P3, adult and microfractured adult joints.
Gene-expression profiling of mSSCs and bulk tissues from healthy newborn (post-natal day 3, P3), healthy adult (9-to-25-week-old, adults) and microfractured adult joints (Ad/MF) and mSSCs from Ad/MF joints treated with control (PBS), BMP2 and VEGFR1 were done using microarrays as previously described27. Briefly, for RNA extraction of mSSCs, 500 to 1,000 cells were sorted with FACS directly into 1 ml TRIzol LS (Invitrogen, cat. no. 10296028). For bulk tissues, bones were flash frozen in liquid nitrogen, crushed into powder and added directly into 1 ml TRIzol. RNA was isolated with the RNeasy Micro Kit (Qiagen, cat. no. 74004), twice amplified with an Arcturus RiboAmp PLUS Kit (Applied Biosystems, cat. no. KIT0521), streptavidin-labeled, fragmented and hybridized to an Affymetrix Mouse 430 2.0 array (Applied Biosystems, cat. no. 900495). Arrays were scanned with a Gene Chip Scanner 3000 (Affymetrix) running the GCOS 1.1.1 software.
For mSSCs profiled from P3, adult and Ad/MF joints related to Fig. 2k, the corresponding CEL files were normalized by MAS5 using the affy v1.66.0R package, mapped to NCBI Entrez gene identifiers using a custom chip definition file for Mouse Genome 430 2.0 microarrays (‘mouse4302mmentrezgcdf’) and converted to Mouse Genome Informatics (MGI) gene symbols using the org. Mm.eg.db v3.11.1R package. Gene-expression values were log2-normalized prior to downstream analysis.
For mSSCs profiled from bulk tissues and Ad/MF joints treated with control, BMP2 and VEGFR1 related to Extended Data Fig. 1c,d, the corresponding CEL files were normalized using the Gene Expression Commons platform (http://gexc.stanford.edu). Briefly, gene-expression profiles were normalized against a common reference of >11,939 Affymetrix Mouse Genome 430 2.0 microarrays as described before61. Each gene’s expression was then transformed to percentile ranks (range, −100% to +100%) on the basis of its value relative to the reference.
Pathway enrichment analysis in microarray gene-expression data.
Hypergeometric tests were performed using the clusterProfiler v3.16.0 package to calculate enrichment of Gene Ontology pathways (for example, cellular components, molecular functions and biological processes) in the microarray data. Genes significantly enriched or depleted in Ad/MF and P3 mSSCs compared with in adult mSSCs were defined on the basis of a log2(fold change) value of >1 or <−1 and adjusted P < 0.01 (Benjamini–Hochberg procedure). Pathways were selected using the ‘enrichGO’ function with P < 0.01 and adjusted P < 0.05.
Geneset enrichment analysis (GSEA) was performed using the Broad Institute’s online software with a gene list ordered by log2-fold enrichment in Ad/MF and P3 mSSCs compared with adult mSSCs. Only gene sets with a nominal P < 0.05 and false discovery rate < 0.25 were considered.
Gait analysis.
Mouse gait was analyzed using the CatWalk XT (Noldus Information Technology), an automated gait-analysis system which assesses motor performance. A video camera recorded from below while each subject walked unforced across an illuminated gate platform. The software calculated statistics on the basis of the footprints and body-weight distribution.
Statistical analysis.
Statistical analysis was done using a ratio-paired Student’s t-test or an ANOVA test where appropriate. The software used for statistical analysis was Prism 7 GraphPad. Exact P values were calculated and are presented to two significant figures.
Ethical approval.
We have complied with all relevant ethical regulations. Twelve human fetal samples were obtained commercially through StemExpress, and the handling and was approved the Institutional Review Board (IRB-35711). Twenty-five human osteoarthritic adult femoral heads were obtained from the Stanford Hospital in accordance with the guidelines outlined in Institutional Review Board (IRB-35711). All surgical procedures on mice have been approved by Stanford’s Administrative Panel on Laboratory Animal Care (APLAC-9999). All experimental procedure performed on mice complied with APLAC-9999.
Reporting Summary.
Further information on research design is available in the Nature Research Reporting Summary linked to this article.
Extended Data
Extended Data Fig. 1 |. Mouse microarray data analysis.
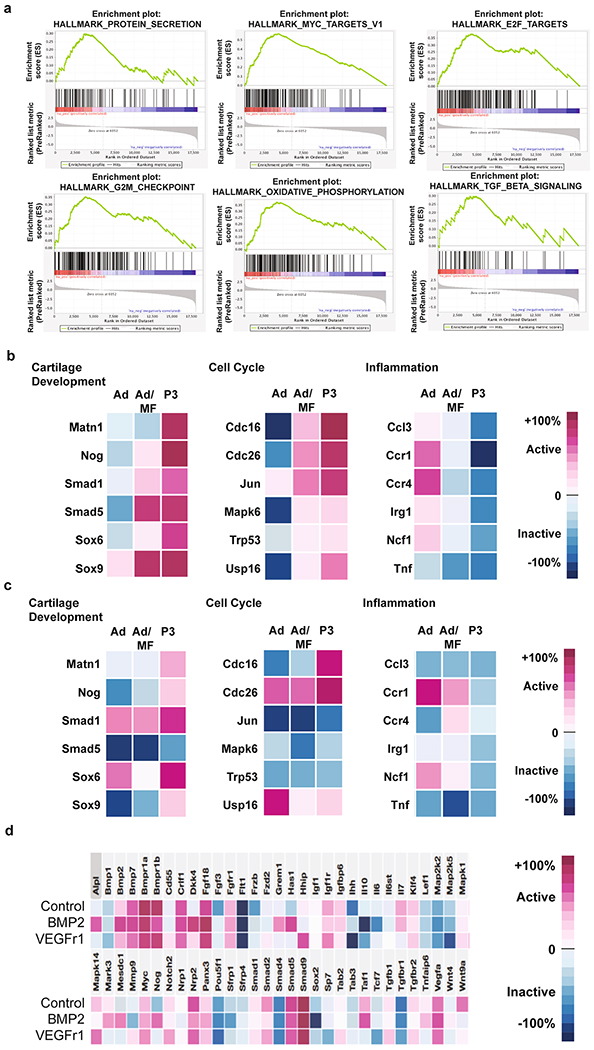
a, Pathways significantly enriched in Ad/MF and P3 mSSC populations. Top, (from left-right) Protein secretion, MYC targets, E2F targets. Bottom, (from left-right) G2M checkpoint, oxidative phosphorylation and TGFb signaling. b-c, mSSC expression (b) and bulk tissue expression (c) of key genes involved in cartilage development, cell cycle and inflammation. d, mSSC gene expression levels after in vitro treatment of PBS, BMP2, or sVEGFR1.
Extended Data Fig. 2 |. In vitro assays for groups (N, MF).
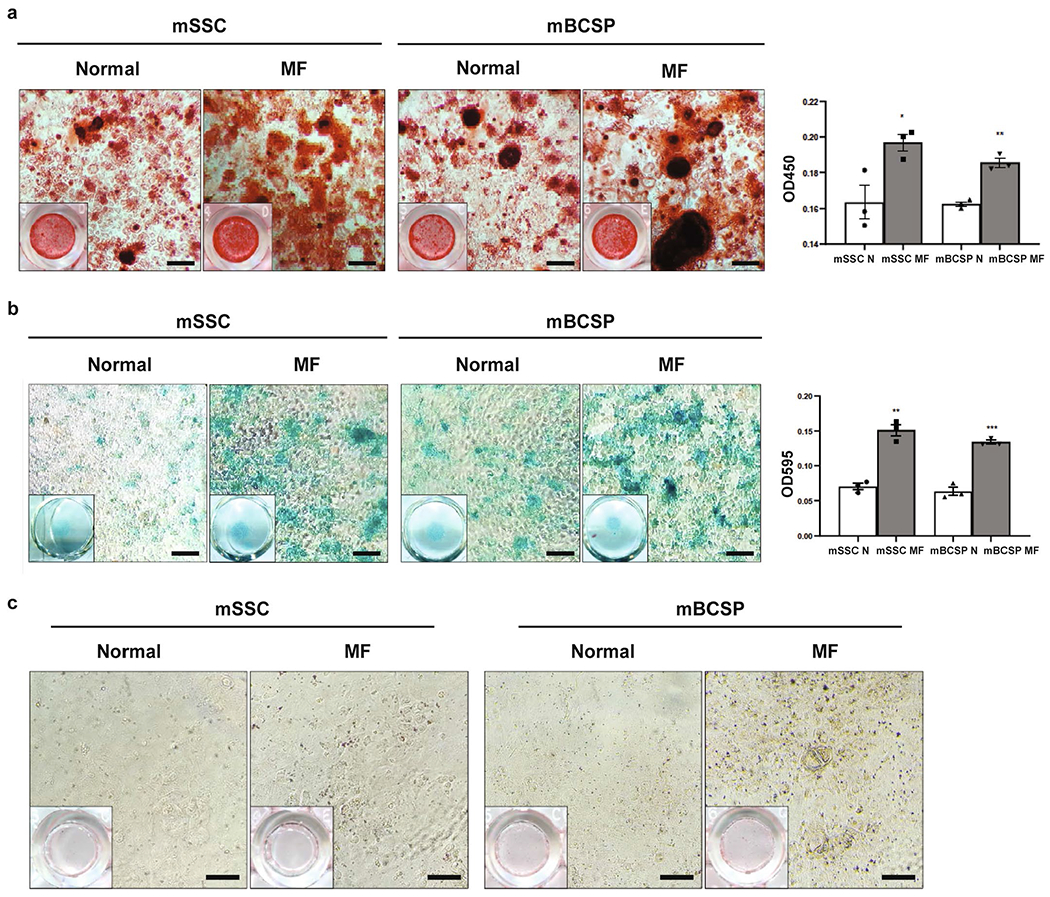
a, Alizarin red staining of uninjured/normal adult (N) and adult MF mSSCs (left) and mBCSPs (right), and quantification of the alizarin red stain after extraction and photometric measurement at OD450. (n = 3 mice per group). * 0.032; ** 0.0014. b, Alcian blue staining of N and MF mSSCs (left) and mBCSPs (right), and quantification of the Alcian blue stain after extraction and photometric measurement at OD595. (n = 3 mice per group). ** 0.0010; *** 0.0004. c, Oil red O staining of Ad and Ad/MF mSSCs (Left) and mBCSPs (Right). Scale bar 100μm. (n = 3 mice per group). Graphs show mean+/− s.e.m. Two-tailed Student’s t-test. Exact P values to 2 significant figures.
Extended Data Fig. 3 |. Microdissection before and after MF surgery.
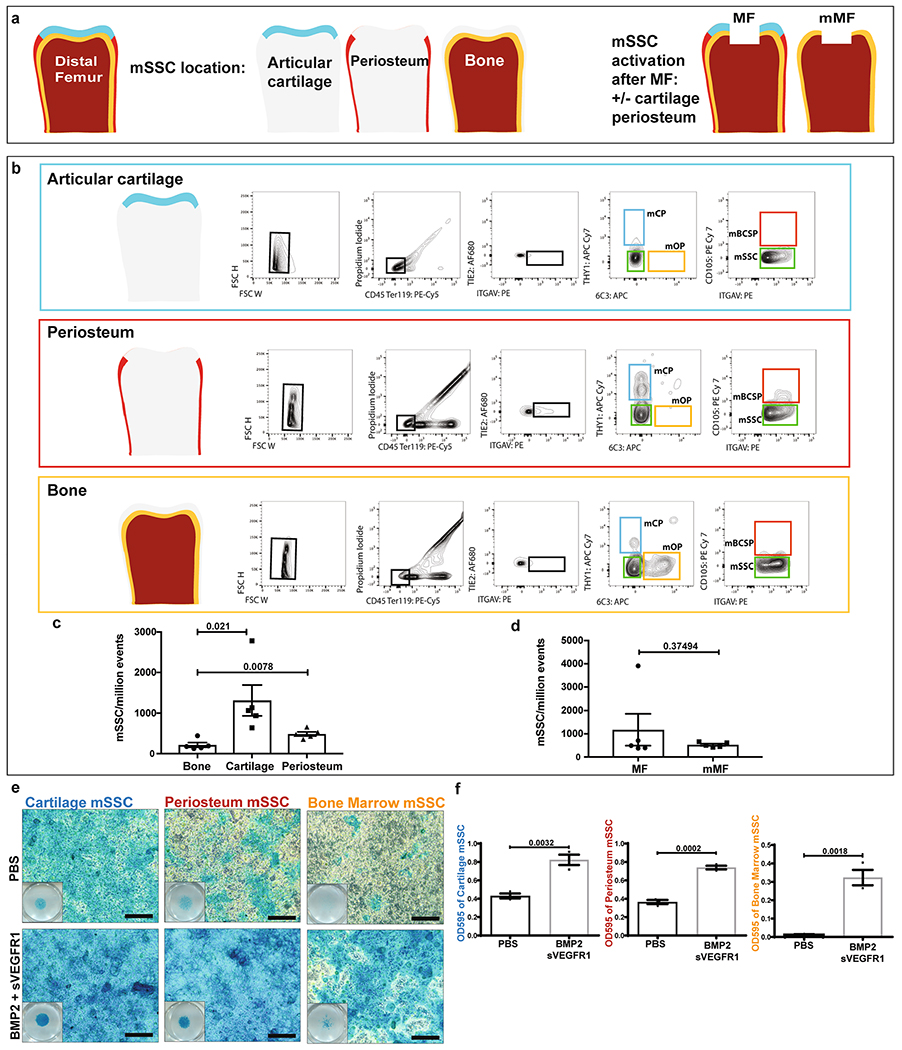
a, Schematic depicting the distal femur of a mouse and its major tissue layers before and after MF surgery. b, Representative flow cytometry analysis of the articular surface (top), the periosteum (middle), and bone (bottom) with relative populations of mOP, mCP, mBCSP, and mSSC. c, Quantification of mSSC/million events in bone, cartilage, and periosteum. Graph shows mean +/− s.e.m. Ordinary one-way ANOVA test with post-hoc analysis using Šídák method to compare between specific means. Exact P values to 2 significant figures. (n = 5 mice per group). d, Quantification of mSSC/million events comparing MF joints and joints with articular cartilage and periosteum removed prior to MF surgery (mMF). (n = 5 mice per group). e, Alcian blue staining of mSSC following chondrogenic differentiation with treatment of PBS or BMP2 + sVEGFR1. Scale bars 100μm. Representative of three independent experiments. f, Quantification of the Alcian blue stain after extraction and photometric measurement at OD595. Unless otherwise stated, graphs show mean +/− s.e.m. Two-tailed Student’s t-test. Exact P values to 2 significant figures.
Extended Data Fig. 4 |. OA progression.
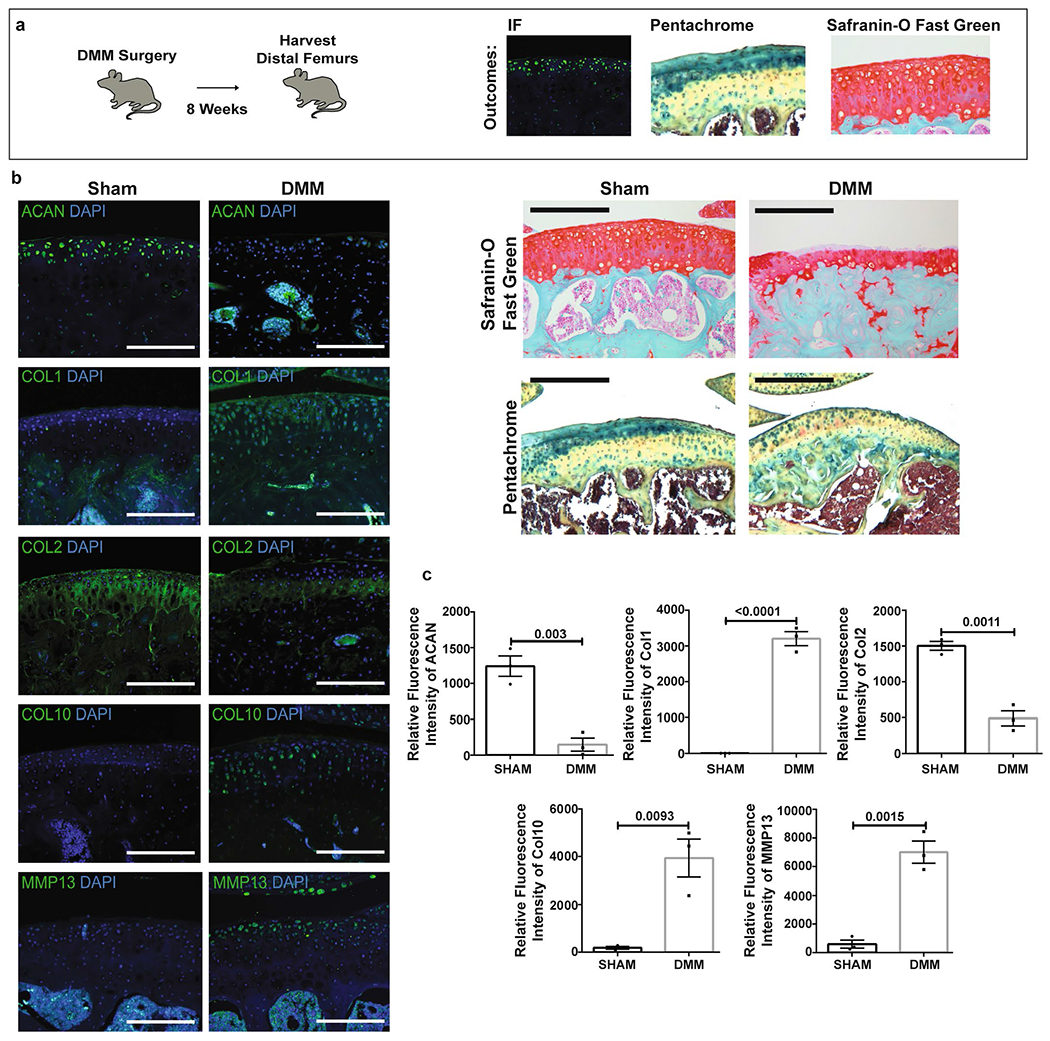
a, Schematic of the experimental outline. Destabilization of the medial meniscus (DMM) was performed on adult mice, and the distal femurs were harvested after 8 weeks. Analysis was performed by IF, pentachrome, and Safranin-O Fast Green staining. b, Left, representative IF of indicated markers in sham and DMM joints. Scale bars 100μm. Right, Safranin-O Fast Green and pentachrome stains of sham and joints 8 weeks after DMM. Scale bars 500μm. (n = 3 per group). c, Quantification of IF stains in sham versus DMM. Graphs show mean+/− s.e.m. Two-tailed Student’s t-test. Exact P values to 2 significant figures. (n = 3 per group).
Extended Data Fig. 5 |. IHC and quantification of OA/MF with factors at 4 weeks.
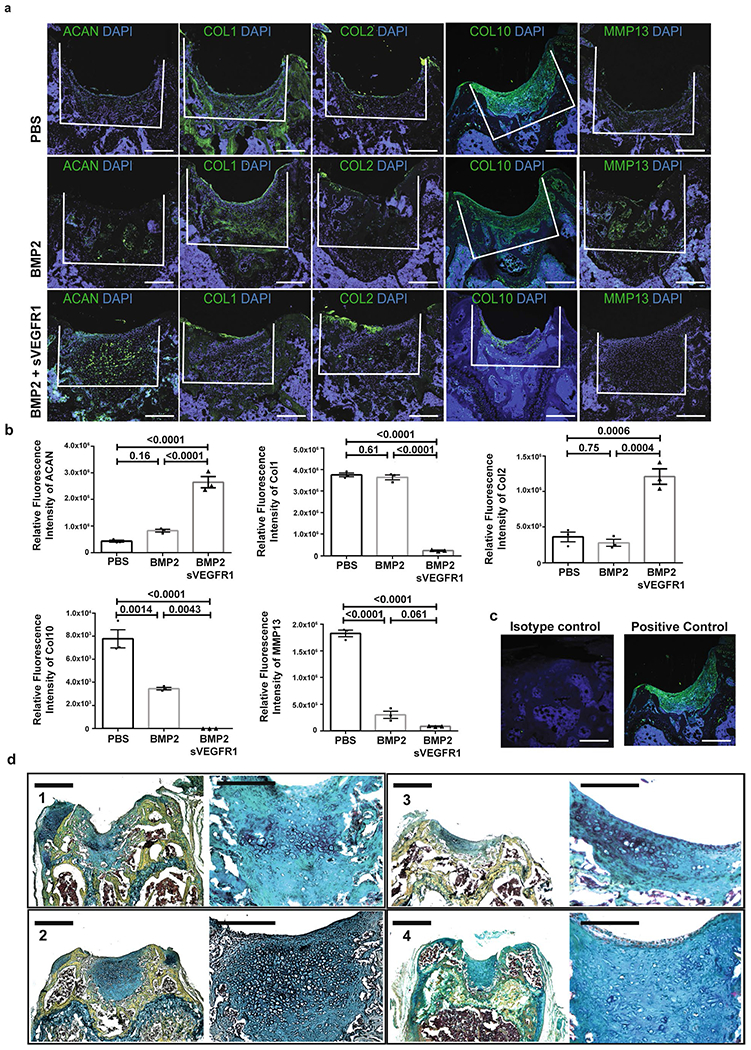
a, Representative IF of (from left-right) ACAN, COL 1, COL 2, COL 10 and MMP 13 in 3 treatment conditions (top: PBS, middle: BMP2, bottom: BMP2 + sVEGFR1) at 4 weeks after MF. Scale bars 250μm. (n = 8 per group). b, Quantification of IF stains for indicated markers of MF + factors at 4 weeks. Graphs show mean +/− s.e.m. Ordinary one-way ANOVA test with post-hoc analysis using Šídák method to compare between specific means. Exact P values to 2 significant figures. c, Representative IF isotype and positive controls. (n = 3 per group). d, Repeat examples of pentachrome staining of BMP2 + sVEGFR1 sections at low (scale bars 500μm) and high (scale bars 100μm) magnification. Representatives of eight independent experiments.
Extended Data Figure 6 |. Histology of OA/MF at 2 weeks and 8 weeks.
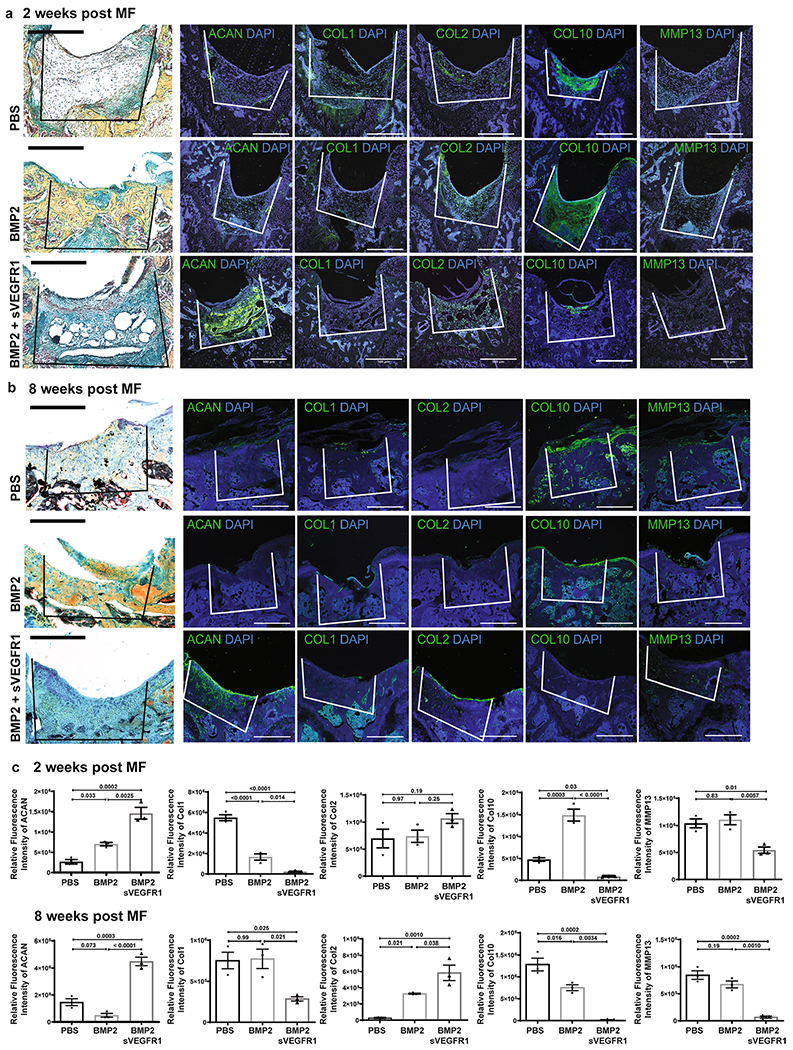
a, Representative pentachrome stains and respective IF of (from left-right) ACAN, COL 1, COL 2, COL 10 and MMP 13 in 3 treatment conditions (top: PBS; middle: BMP2; bottom: BMP2 + sVEGFR1) at 2 weeks after MF. Scale bars 500μm. (n = 4 per group). b, Representative pentachrome stains and respective IF stains for the indicated markers in 3 treatment conditions (top row: PBS; middle: BMP2; bottom: BMP2 + sVEGFR1) at 8 weeks after MF. Scale bars 500μm. (n = 4 per group). c, Quantification of IF stains for the indicated markers at 2 weeks (top) and 8 weeks (bottom) after MF. (n = 3 per group per timepoint). Graphs show mean +/− s.e.m. Ordinary one-way ANOVA test with post-hoc analysis using Šídák method to compare between specific means. Exact P values to 2 significant figures.
Extended Data Fig. 7 |. Week 16 timepoint.
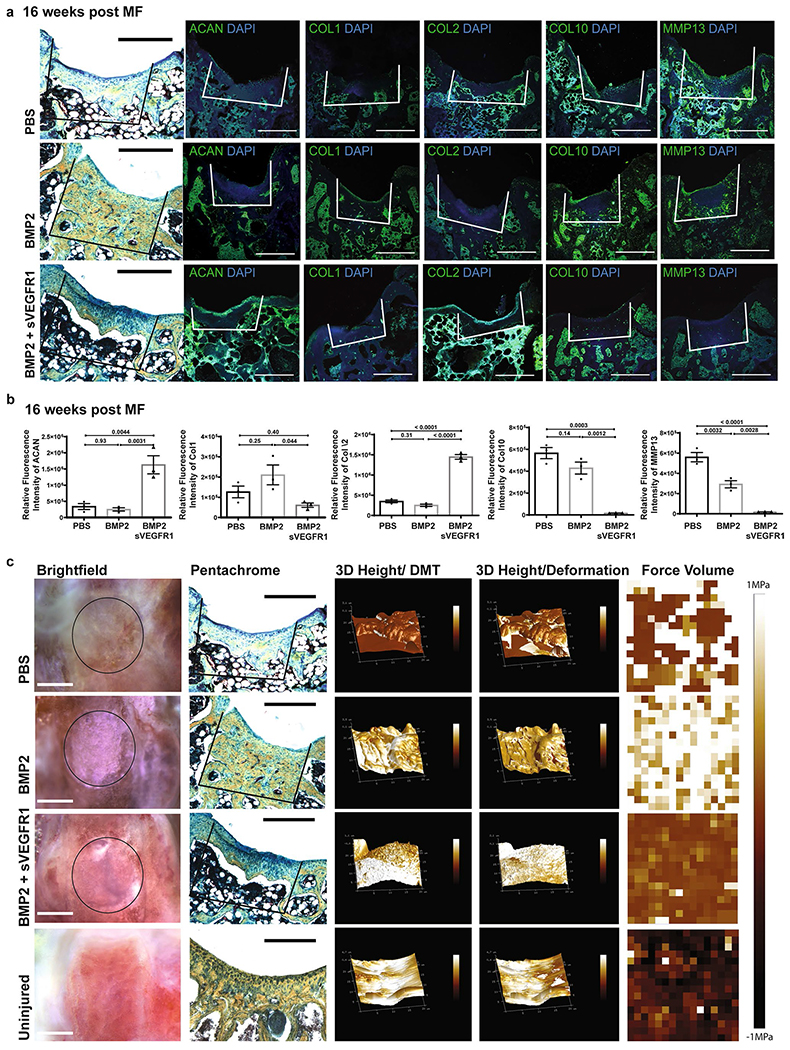
a, Representative pentachrome and respective IF of (from left-right) ACAN, COL 1, COL 2, COL 10 and MMP 13 in 3 treatment conditions (top: PBS, middle: BMP2, bottom: BMP2 + sVEGFR1). Scale bars 500μm. (n = 4 per group). b, Quantification of IF stains for indicated markers of MF + factors. Graphs show Mean +/− SEM. Ordinary one-way ANOVA test with post-hoc analysis using Šídák method to compare between specific means. Exact P values to 2 significant figures. (n = 3 per group). c, From left-right, gross images of distal femur (scale bars 1 mm); respective pentachrome (scale bars 500μm); 3D Peak Force Error; 3D Deformation; Force Volume in 4 conditions (PBS, BMP2, BMP2 + sVEGFR1, Uninjured). (n = 4 per group).
Extended Data Fig. 8 |. Effects of aged and irradiated niches.
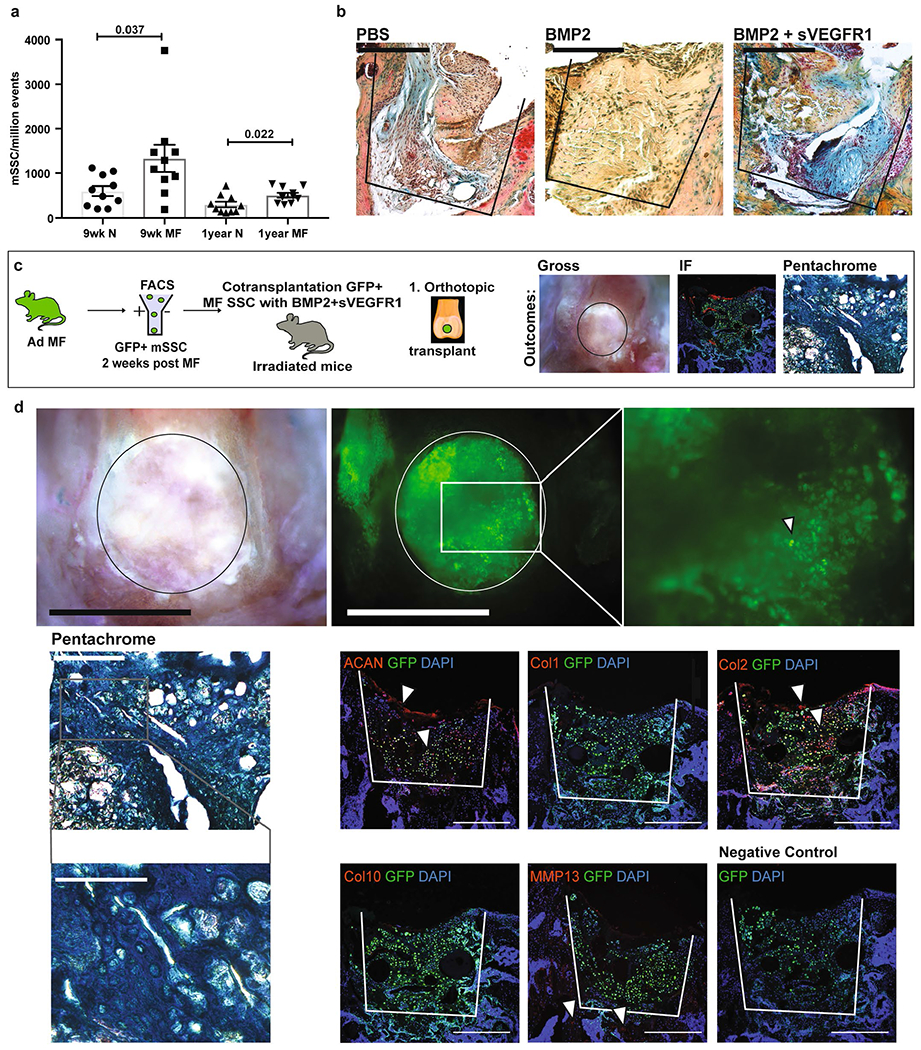
a, Quantification of mSSC/million events in normal and MF joints of adult (9wks) and aged (1 yr) mice. Graph shows mean +/− s.e.m. Two-tailed Student’s t-test. Exact P values to 2 significant figures. (n = 10 mice per group). b, Representative pentachrome stains of 2-weeks post MF surgery in aged joints with (from left-right) PBS, BMP2, and BMP2 + sVEGFR1. Scale bar 500μm. (n = 3 per group). c, Schematic of the experimental outline. Microfracture surgery is performed on the joints of GFP + adult mice (Ad/MF). GFP + mSSCs are sorted by flow cytometry and cotransplanted with BMP2 + sVEGFR1 into MF defects of irradiated mice. Analysis is performed by brightfield microscopy (BF), immunofluorescence (IF), and pentachrome staining. d, Top, Representative BF (left) and fluorescence microscopy (right) of GFP + Ad/MF mSSC 4 weeks after they were transplanted into the MF defect of an irradiated joint. Scale bars 500μm. (n = 5 mice). Middle, Representative pentachrome stain (scale bar 500μm) shown with higher magnification (scale bar 100μm) and respective IF of GFP + Ad/MF mSSC 4 weeks after they were transplanted into the MF defect of an irradiated joint. Positive staining marked by white arrows. Representatives of three separate experiments. Bottom right, a negative control IF stain was performed for each experiment. Scale bars 500μm.
Extended Data Fig. 9 |. Atomic Force Microscopy at 8 weeks post MF.
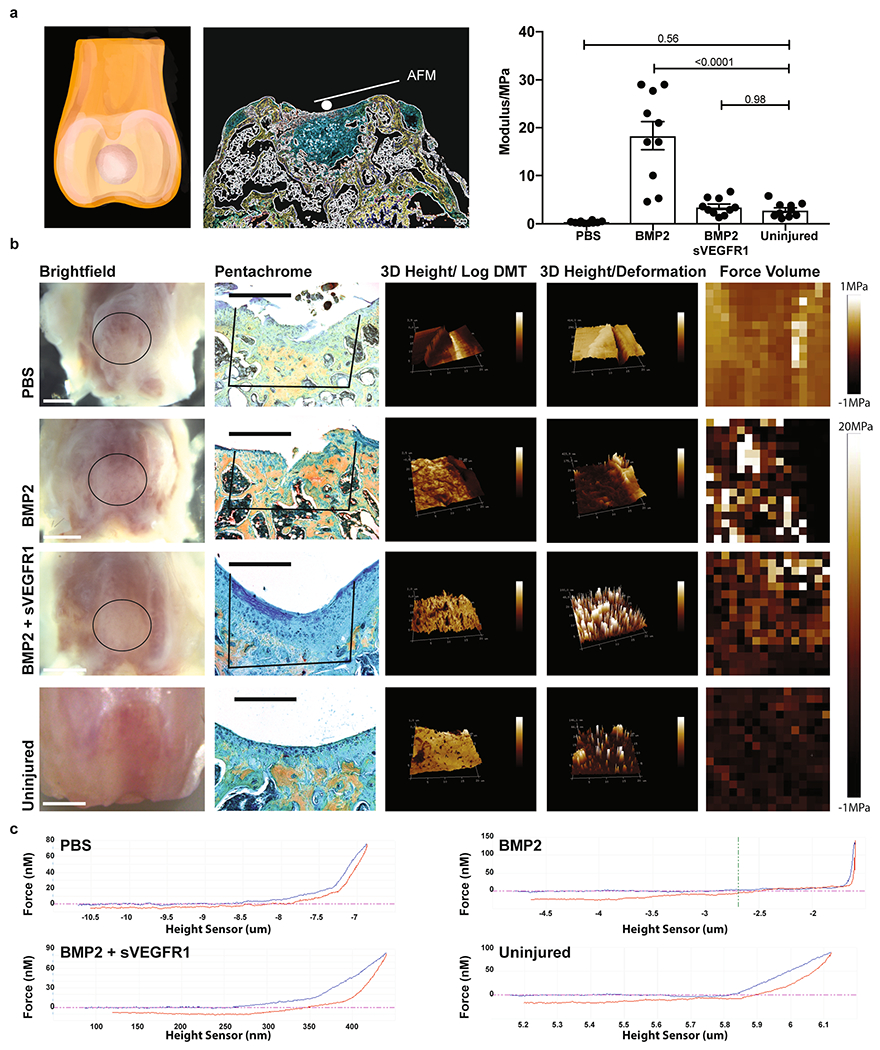
a, Left and middle, schematic of Rheology experimental outline. Right, Quantification for the modulus of the regenerate (PBS, BMP2, BMP2 + sVEGFR1.) Graph shows mean +/− s.e.m. Ordinary one-way ANOVA test (p = <0.0001) with post-hoc analysis using Šídák method to compare between specific means. Exact P values to 2 significant figures. (n = 10 mice per group). b, From left-right, gross images of distal femur (scale bars 1 mm); respective pentachrome (scale bars 500μm); 3D Peak Force Error; 3D Deformation; Force Volume in 4 conditions (PBS, BMP2, BMP2 + sVEGFR1, Uninjured) (n = 4 per group). Scale bar 500μm. c, Force graphs for PBS, BMP2, BMP2 + sVEGFR1, and uninjured. (n = 4 per group).
Extended Data Fig. 10 |. Functional assessment.
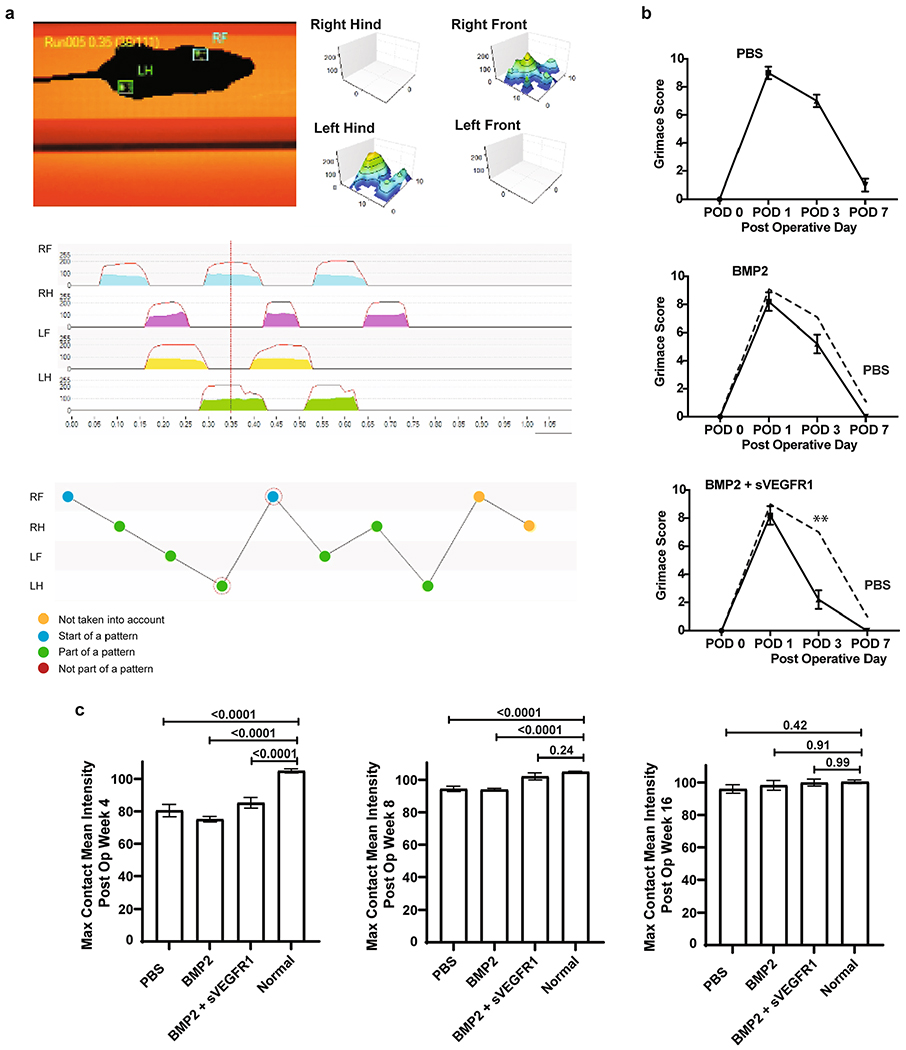
a, Schematic of the gait analysis performed on Ad/MF mice. b, Grimace assessment scores for adult mice following MF surgery of the distal femur with 3 treatment conditions (PBS, BMP2, BMP2 + sVEGFR1). Graphs show mean +/− s.e.m. Ordinary one-way ANOVA test (p = <0.0001) with post-hoc analysis using Šídák method to compare between specific means. Exact P values to 2 significant figures. (n = 5 mice per group). c, Gait assessment scores for maximum contact mean intensity with 4 conditions (PBS, BMP2, BMP2 + sVEGFR1, and Uninjured) at 4, 8, and 16 weeks after surgery. (n = 3 mice per group per timepoint).
Supplementary Material
Acknowledgements
The authors thank N. Williams, C. Queen, C. Crumpton, E. Kang, M. Butcher, L. Quinn, P. Perira and R. Mann for advice and assistance, and A. McCarty, M. Alvarez, and VSC Staff for animal model support. The authors also thank M. Ekhart, and the PAN facility at Stanford for help in gene-expression analysis. In addition, the authors thank S. Goodman and the Orthopedic Department of Stanford for donation of human adult specimens. The study was supported by NIH (R01 DE027323, R56 DE025597, R01 DE026730, R01 DE021683, R21 DE024230, U01HL099776, U24DE026914 and R21 DE019274), CIRMTR1-01249, Oak Foundation, Hagey Laboratory, Pitch Johnson Fund and Gunn/Olivier Research Fund to M.T. Longaker; Siebel Fellowship, PCF YI Award, Stinehart/Reed, and NIHNIAK99AG049958-01A1, American Federation of Aging Research and Arthritis National Research Foundation to C.K.F.C.; HHMI Fellowship to G.S.G.; the German Research Foundation (DFG) Fellowship 399915929 to T.H.A.; NIH, NIGMS R01GM123069, NIH1R01AR071379, ACS Clowes Award, Department of Defense CDMRP W81XWH-18-1-0653, OR170174 to B.L; PSRF National Endowment and Stanford TTE fellowship to M.P.M.; NIHS10 RR02933801 to Stanford Stem Cell FACS core. The project was supported, in part, by Award Number 1S10OD021514-01 from the National Center for Research Resources (NCRR). Its contents are solely the responsibility of the authors and do not necessarily represent the official views of the NCRR or the National Institutes of Health.
Footnotes
Online content
Any methods, additional references, Nature Research reporting summaries, source data, extended data, supplementary information, acknowledgements, peer review information; details of author contributions and competing interests; and statements of data and code availability are available at https://doi.org/10.1038/s41591-020-1013-2.
Competing interests
The authors declare no competing interests.
Data availability
Microarray data described in this study was deposited with the gene expression omnibus with the accession number GSE151303. There are no restrictions on sharing the data. All data are available from the corresponding author upon reasonable request.
Extended data is available for this paper at https://doi.org/10.1038/s41591-020-1013-2.
Supplementary information is available for this paper at https://doi.org/10.1038/s41591-020-1013-2.
Peer review information Michael Basson and Brett Benedetti were the primary editors on this article and managed its editorial process and peer review in collaboration with the rest of the editorial team.
References
- 1.Robinson WH et al. Low-grade inflammation as a key mediator of the pathogenesis of osteoarthritis. Nat. Rev. Rheumatol 12, 580–592 (2016). [DOI] [PMC free article] [PubMed] [Google Scholar]
- 2.Rahmati M, Mobasheri A & Mozafari M Inflammatory mediators in osteoarthritis: a critical review of the state-of-the-art, current prospects, and future challenges. Bone 85, 81–90 (2016). [DOI] [PubMed] [Google Scholar]
- 3.Marques-Rocha JL et al. Noncoding RNAs, cytokines, and inflammation-related diseases. FASEB J. 29, 3595–3611 (2015). [DOI] [PubMed] [Google Scholar]
- 4.Liu-Bryan R & Terkeltaub R Emerging regulators of the inflammatory process in osteoarthritis. Nat. Rev. Rheumatol 11, 35–44 (2015). [DOI] [PMC free article] [PubMed] [Google Scholar]
- 5.Hoemann CD et al. Chondroinduction is the main cartilage repair response to microfracture and microfracture with BST-CarGel: results as shown by ICRS-II histological scoring and a novel zonal collagen type scoring method of human clinical biopsy specimens. Am. J. Sports Med 43, 2469–2480 (2015). [DOI] [PubMed] [Google Scholar]
- 6.Mithoefer K, McAdams T, Williams RJ, Kreuz PC & Mandelbaum BR Clinical efficacy of the microfracture technique for articular cartilage repair in the knee: an evidence-based systematic analysis. Am. J. Sports Med 37, 2053–2063 (2009). [DOI] [PubMed] [Google Scholar]
- 7.Goldberg A, Mitchell K, Soans J, Kim L & Zaidi R The use of mesenchymal stem cells for cartilage repair and regeneration: a systematic review. J. Orthop. Surg. Res 12, 39 (2017). [DOI] [PMC free article] [PubMed] [Google Scholar]
- 8.Vos T et al. Years lived with disability (YLDs) for 1160 sequelae of 289 diseases and injuries 1990–2010: a systematic analysis for the global burden of disease study 2010. Lancet 380, 2163–2196 (2012). [DOI] [PMC free article] [PubMed] [Google Scholar]
- 9.Murray CJ et al. The state of US health, 1990–2010: burden of diseases, injuries, and risk factors. JAMA 310, 591–608 (2013). [DOI] [PMC free article] [PubMed] [Google Scholar]
- 10.Hootman JM, Helmick CG, Barbour KE, Theis KA & Boring MA Updated projected prevalence of self-reported doctor-diagnosed arthritis and arthritis-attributable activity limitation among US adults, 2015–2040. Arthritis Rheumatol. 68, 1582–1587 (2016). [DOI] [PMC free article] [PubMed] [Google Scholar]
- 11.Johnson VL & Hunter DJ The epidemiology of osteoarthritis. Best. Pr. Res Clin. Rheumatol 28, 5–15 (2014). [DOI] [PubMed] [Google Scholar]
- 12.Marshall M, Watt FE, Vincent TL & Dziedzic K Hand osteoarthritis: clinical phenotypes, molecular mechanisms and disease management. Nat. Rev. Rheumatol 14, 641–656 (2018). [DOI] [PubMed] [Google Scholar]
- 13.Bijlsma JW, Berenbaum F & Lafeber FP Osteoarthritis: an update with relevance for clinical practice. Lancet 377, 2115–2126 (2011). [DOI] [PubMed] [Google Scholar]
- 14.Steadman JR, Rodkey WG, Briggs KK & Rodrigo JJ [The microfracture technic in the management of complete cartilage defects in the knee joint]. Orthopade 28, 26–32 (1999). [DOI] [PubMed] [Google Scholar]
- 15.Makris EA, Gomoll AH, Malizos KN, Hu JC & Athanasiou KA Repair and tissue engineering techniques for articular cartilage. Nat. Rev. Rheumatol 11, 21–34 (2015). [DOI] [PMC free article] [PubMed] [Google Scholar]
- 16.Knutsen G et al. Autologous chondrocyte implantation compared with microfracture in the knee. A randomized trial. J. Bone Jt. Surg. Am 86-A, 455–464 (2004). [DOI] [PubMed] [Google Scholar]
- 17.Devitt BM, Bell SW, Webster KE, Feller JA & Whitehead TS Surgical treatments of cartilage defects of the knee: systematic review of randomised controlled trials. Knee 24, 508–517 (2017). [DOI] [PubMed] [Google Scholar]
- 18.Vanlauwe J et al. Five-year outcome of characterized chondrocyte implantation versus microfracture for symptomatic cartilage defects of the knee: early treatment matters. Am. J. Sports Med 39, 2566–2574 (2011). [DOI] [PubMed] [Google Scholar]
- 19.Piuzzi NS et al. Accelerated growth of cellular therapy trials in musculoskeletal disorders: an analysis of the NIH Clinical Trials Data Bank. Orthopedics 42, e144–e150 (2019). [DOI] [PubMed] [Google Scholar]
- 20.Sipp D, Robey PG & Turner L Clear up this stem-cell mess. Nature 561, 455–457 (2018). [DOI] [PubMed] [Google Scholar]
- 21.Jo CH et al. Intra-articular injection of mesenchymal stem cells for the treatment of osteoarthritis of the knee: a proof-of-concept clinical trial. Stem Cells 32, 1254–1266 (2014). [DOI] [PubMed] [Google Scholar]
- 22.Vega A et al. Treatment of knee osteoarthritis with allogeneic bone marrow mesenchymal stem cells: a randomized controlled trial. Transplantation 99, 1681–1690 (2015). [DOI] [PubMed] [Google Scholar]
- 23.Pers YM et al. Adipose mesenchymal stromal cell-based therapy for severe osteoarthritis of the knee: a phase I dose–escalation trial. Stem Cells Transl. Med 5, 847–856 (2016). [DOI] [PMC free article] [PubMed] [Google Scholar]
- 24.Worthley DL et al. Gremlin 1 identifies a skeletal stem cell with bone, cartilage, and reticular stromal potential. Cell 160, 269–284 (2015). [DOI] [PMC free article] [PubMed] [Google Scholar]
- 25.Sacchetti B et al. Self-renewing osteoprogenitors in bone marrow sinusoids can organize a hematopoietic microenvironment. Cell 131, 324–336 (2007). [DOI] [PubMed] [Google Scholar]
- 26.Chan CK et al. Identification and specification of the mouse skeletal stem cell. Cell 160, 285–298 (2015). [DOI] [PMC free article] [PubMed] [Google Scholar]
- 27.Chan CKF et al. Identification of the human skeletal stem cell. Cell 175, 43–56 e21 (2018). [DOI] [PMC free article] [PubMed] [Google Scholar]
- 28.Ambrosi TH, Longaker MT & Chan CKF A revised perspective of skeletal stem cell biology. Front Cell Dev. Biol 7, 189 (2019). [DOI] [PMC free article] [PubMed] [Google Scholar]
- 29.Luria EA, Owen ME, Friedenstein AJ, Morris JF & Kuznetsow SA Bone formation in organ cultures of bone marrow. Cell Tissue Res. 248, 449–454 (1987). [DOI] [PubMed] [Google Scholar]
- 30.Gronthos S, Simmons PJ, Graves SE & Robey PG Integrin-mediated interactions between human bone marrow stromal precursor cells and the extracellular matrix. Bone 28, 174–181 (2001). [DOI] [PubMed] [Google Scholar]
- 31.Kratchmarova I, Blagoev B, Haack-Sorensen M, Kassem M & Mann M Mechanism of divergent growth factor effects in mesenchymal stem cell differentiation. Science 308, 1472–1477 (2005). [DOI] [PubMed] [Google Scholar]
- 32.Marecic O et al. Identification and characterization of an injury-induced skeletal progenitor. Proc. Natl Acad. Sci. USA 112, 9920–9925 (2015). [DOI] [PMC free article] [PubMed] [Google Scholar]
- 33.Jiang Y & Tuan RS Origin and function of cartilage stem/progenitor cells in osteoarthritis. Nat. Rev. Rheumatol 11, 206–212 (2015). [DOI] [PMC free article] [PubMed] [Google Scholar]
- 34.Ransom RC et al. Genetic dissection of clonal lineage relationships with hydroxytamoxifen liposomes. Nat. Commun 9, 2971 (2018). [DOI] [PMC free article] [PubMed] [Google Scholar]
- 35.Loeser RF, Collins JA & Diekman BO Ageing and the pathogenesis of osteoarthritis. Nat. Rev. Rheumatol 12, 412–420 (2016). [DOI] [PMC free article] [PubMed] [Google Scholar]
- 36.Gulati GS et al. Isolation and functional assessment of mouse skeletal stem cell lineage. Nat. Protoc 13, 1294–1309 (2018). [DOI] [PMC free article] [PubMed] [Google Scholar]
- 37.Eldracher M, Orth P, Cucchiarini M, Pape D & Madry H Small subchondral drill holes improve marrow stimulation of articular cartilage defects. Am. J. Sports Med 42, 2741–2750 (2014). [DOI] [PubMed] [Google Scholar]
- 38.Rinkevich Y, Lindau P, Ueno H, Longaker MT & Weissman IL Germ-layer and lineage-restricted stem/progenitors regenerate the mouse digit tip. Nature 476, 409–413 (2011). [DOI] [PMC free article] [PubMed] [Google Scholar]
- 39.Fang H & Beier F Mouse models of osteoarthritis: modelling risk factors and assessing outcomes. Nat. Rev. Rheumatol 10, 413–421 (2014). [DOI] [PubMed] [Google Scholar]
- 40.Loeser RF et al. Microarray analysis reveals age-related differences in gene expression during of harpagoside by upregulation of the BMP2 and Wnt signaling pathways in osteoblasts and suppression of differentiation in osteoclasts. J. Nat. Prod 80, 434–442 (2017). [DOI] [PubMed] [Google Scholar]
- 41.Ransom RC et al. Mechanoresponsive stem cells acquire neural crest fate in jaw regeneration. Nature 563, 514–521 (2018). [DOI] [PMC free article] [PubMed] [Google Scholar]
- 42.Ray A, Singh PN, Sohaskey ML, Harland RM & Bandyopadhyay A Precise spatial restriction of BMP signaling is essential for articular cartilage differentiation. Development 142, 1169–1179 (2015). [DOI] [PMC free article] [PubMed] [Google Scholar]
- 43.Bragdon B et al. Earliest phases of chondrogenesis are dependent upon angiogenesis during ectopic bone formation in mice. Bone 101, 49–61 (2017). [DOI] [PMC free article] [PubMed] [Google Scholar]
- 44.Urist MR Bone: formation by autoinduction. Science 150, 893–899 (1965). [DOI] [PubMed] [Google Scholar]
- 45.Keeney M et al. Scaffold-mediated BMP-2 minicircle DNA delivery accelerated bone repair in a mouse critical-size calvarial defect model. J. Biomed. Mater. Res. A 104, 2099–2107 (2016). [DOI] [PMC free article] [PubMed] [Google Scholar]
- 46.Chung HJ et al. Anti-osteoporotic activity of harpagoside by upregulation of the BMP2 and Wnt signaling pathways in osteoblasts and suppression of differentiation in osteoclasts. J. Nat. Prod 80, 434–442 (2017). [DOI] [PubMed] [Google Scholar]
- 47.Gonzalez-Fernandez T, Tierney EG, Cunniffe GM, O’Brien FJ & Kelly DJ Gene delivery of TGF-beta3 and BMP2 in an MSC-laden alginate hydrogel for articular cartilage and endochondral bone tissue engineering. Tissue Eng. Part A 22, 776–787 (2016). [DOI] [PubMed] [Google Scholar]
- 48.Hamilton JL et al. Targeting VEGF and its receptors for the treatment of osteoarthritis and associated pain. J. Bone Miner. Res 31, 911–924 (2016). [DOI] [PMC free article] [PubMed] [Google Scholar]
- 49.Nagai T et al. Bevacizumab, an anti-vascular endothelial growth factor antibody, inhibits osteoarthritis. Arthritis Res Ther. 16, 427 (2014). [DOI] [PMC free article] [PubMed] [Google Scholar]
- 50.Tevlin R et al. Pharmacological rescue of diabetic skeletal stem cell niches. Sci. Transl. Med 9, eaag2809 (2017). [DOI] [PMC free article] [PubMed] [Google Scholar]
- 51.Adouni M & Dhaher YY A multi-scale elasto-plastic model of articular cartilage. J. Biomech 49, 2891–2898 (2016). [DOI] [PubMed] [Google Scholar]
- 52.Chandran PL, Dimitriadis EK, Mertz EL & Horkay F Microscale mapping of extracellular matrix elasticity of mouse joint cartilage: an approach to extracting bulk elasticity of soft matter with surface roughness. Soft Matter 14, 2879–2892 (2018). [DOI] [PMC free article] [PubMed] [Google Scholar]
- 53.Kretzschmar K et al. Profiling proliferative cells and their progeny in damaged murine hearts. Proc. Natl Acad. Sci. USA 115, E12245–E12254 (2018). [DOI] [PMC free article] [PubMed] [Google Scholar]
- 54.Nagao M et al. Vascular endothelial growth factor in cartilage development and osteoarthritis. Sci. Rep 7, 13027 (2017). [DOI] [PMC free article] [PubMed] [Google Scholar]
- 55.Steinberg J & Zeggini E Functional genomics in osteoarthritis: past, present, and future. J. Orthop. Res 34, 1105–1110 (2016). [DOI] [PMC free article] [PubMed] [Google Scholar]
- 56.Prockop DJ et al. Defining the risks of mesenchymal stromal cell therapy. Cytotherapy 12, 576–578 (2010). [DOI] [PubMed] [Google Scholar]
- 57.Jones IA, Togashi R, Wilson ML, Heckmann N & Vangsness CT Jr. Intra-articular treatment options for knee osteoarthritis. Nat. Rev. Rheumatol 15, 77–90 (2019). [DOI] [PMC free article] [PubMed] [Google Scholar]
- 58.Conrad B, Han LH & Yang F Gelatin-based microribbon hydrogels accelerate cartilage formation by mesenchymal stem cells in three dimensions. Tissue Eng. Part A 24, 1631–1640 (2018). [DOI] [PMC free article] [PubMed] [Google Scholar]
- 59.Taylor SE et al. Identification of human juvenile chondrocyte-specific factors that stimulate stem cell growth. Tissue Eng. Part A 22, 645–653 (2016). [DOI] [PubMed] [Google Scholar]
- 60.Glyn-Jones S et al. Osteoarthritis. Lancet 386, 376–387 (2015). [DOI] [PubMed] [Google Scholar]
- 61.Seita J et al. Gene Expression Commons: an open platform for absolute gene expression profiling. PLoS ONE 7, e40321 (2012). [DOI] [PMC free article] [PubMed] [Google Scholar]
Associated Data
This section collects any data citations, data availability statements, or supplementary materials included in this article.