Abstract
Pathogen-derived nucleic acids induce potent innate immune responses1-6. Cyclic GMP-AMP synthase (cGAS) is a dsDNA sensor that catalyzes the synthesis of a cyclic dinucleotide cGAMP, which mediates the induction of type I interferons through the STING-TBK1-IRF3 signaling axis7-11. It was widely accepted that cGAS is not reactive to self-DNA due to its cytosolic localization2,12,13. However, recent studies revealed that cGAS is mostly localized in the nucleus and tight nuclear tethering keeps cGAS inactive14-18. Here we show that cGAS binds to nucleosomes with nanomolar affinity and nucleosome binding potently inhibits the catalytic activity of cGAS. To elucidate the molecular basis of cGAS inactivation by nuclear tethering, we have determined the structure of mouse cGAS bound to human nucleosome by cryo-EM. The structure shows that cGAS binds to a negatively charged acidic patch formed by histone H2A and H2B via its second DNA binding site19. High affinity nucleosome binding blocks dsDNA binding and keeps cGAS in an inactive conformation. Mutations of cGAS that disrupt nucleosome binding dramatically affect cGAS mediated signaling in cells.
Keywords: Innate immunity, cGAS-STING pathway, nucleosome
The presence of billions of base pairs of DNA in the mammalian genome raises the question about how the cGAS activity is inhibited towards self-DNA. The prevalent explanation for this is that cGAS is sequestered in the cytosol and does not have access to host DNA2,12-14. However, this concept has been challenged by several recent studies, which demonstrated that cGAS is also localized in the nucleus and is tightly tethered to the chromatin2,14,15. The catalytic activity of cGAS is suppressed when it is tethered to the nucleus14,15. A patch of conserved, positively charged residues of cGAS within its second DNA binding site19 was identified to be critical for its interaction with the chromatin14. In addition, it was suggested that the intact chromatin structure was essential for cGAS nuclear tethering14. However, the molecular basis of cGAS nuclear tethering remains largely unknown.
cGAS binds tightly to individual nucleosomes
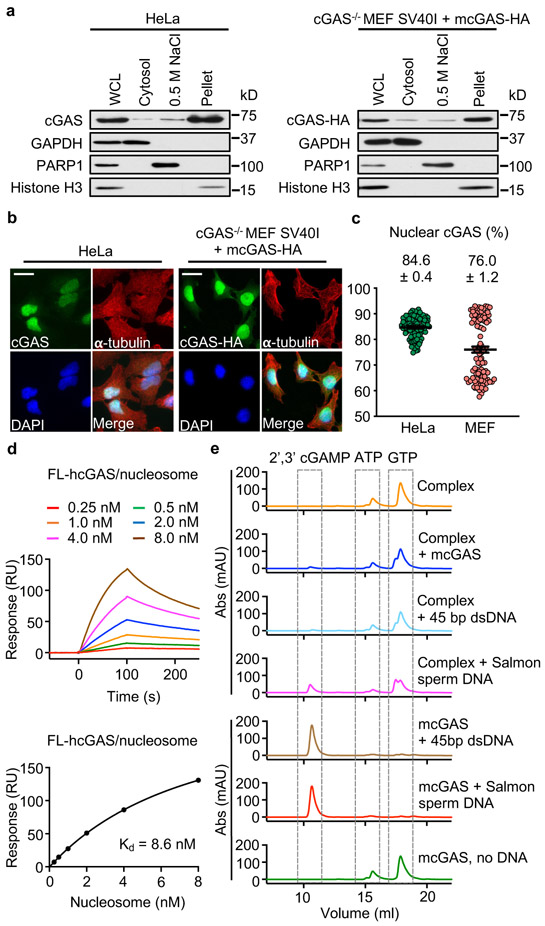
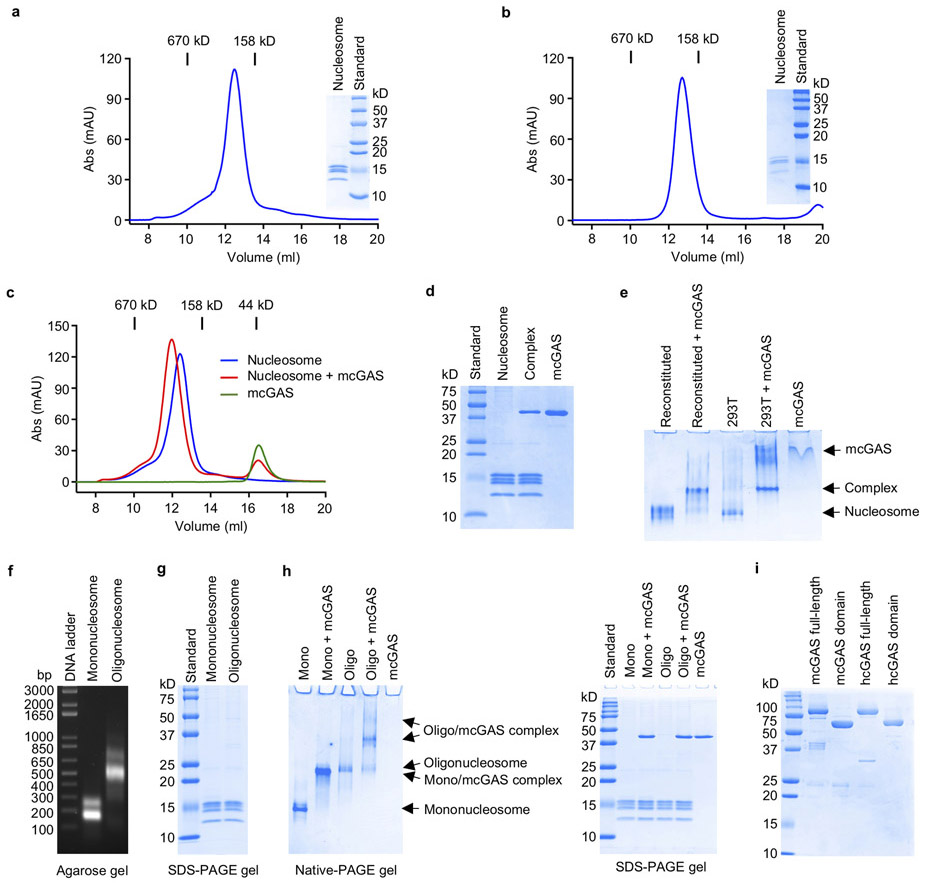
We first confirmed that cGAS is predominantly localized in the nucleus of both human (HeLa) cells and mouse embryonic fibroblasts (MEFs) (Fig.1a). Quantitative fluorescent microscopy revealed that 70-80% of cGAS are localized in the nucleus (Fig. 1b, c). To test if cGAS binds to the nucleosome directly, we purified nucleosomes from HEK 293T cells and reconstituted nucleosomes using histone proteins20 (Extended Data Fig. 1a,b). Next, we conducted cGAS binding studies using mouse cGAS (mcGAS) catalytic domain. We observed that the nucleosomes bound cGAS tightly and resulted in a clear shift of the nucleosome peak (Extended Data Fig. 1c, d). Gel shift assays also showed direct binding between the nucleosome and cGAS (Extended Data Fig. 1e). In addition, we observed that oligonucleosomes also bind cGAS tightly (Extended Data Fig. 1f, g, h).
Figure 1. Tight nucleosome binding inactivates cGAS.
a. Western blot analyses of cGAS expression in 1% SDS whole cell lysates (WCL), 0.2% NP-40 cytosolic fractions, 0.5 M NaCl nuclear extracts, and 1% SDS nuclear lysates of HeLa and cGAS−/− MEF SV40I + mcGAS-HA cells.
b. Immunofluorescence microscopy images of HeLa and cGAS−/− MEF SV40I + mcGAS-HA cells stained with anti-cGAS or –HA, and -α-tubulin antibodies and DAPI. The scale bars denote 50 μm.
c. The percentage of nuclear- to whole cell-cGAS ratio quantified by microscopy. All data are presented as mean ± SEM.
d. Surface plasmon resonance (SPR) shows that full-length human cGAS binds to in vitro reconstituted human nucleosome with nanomolar affinity. The binding affinity (Kd) was determined by fitting the binding data to a simple one-to-one binding model.
e. Enzyme activity assays by ion exchange chromatography show that nucleosome binding potently inhibits the catalytic activity of cGAS.
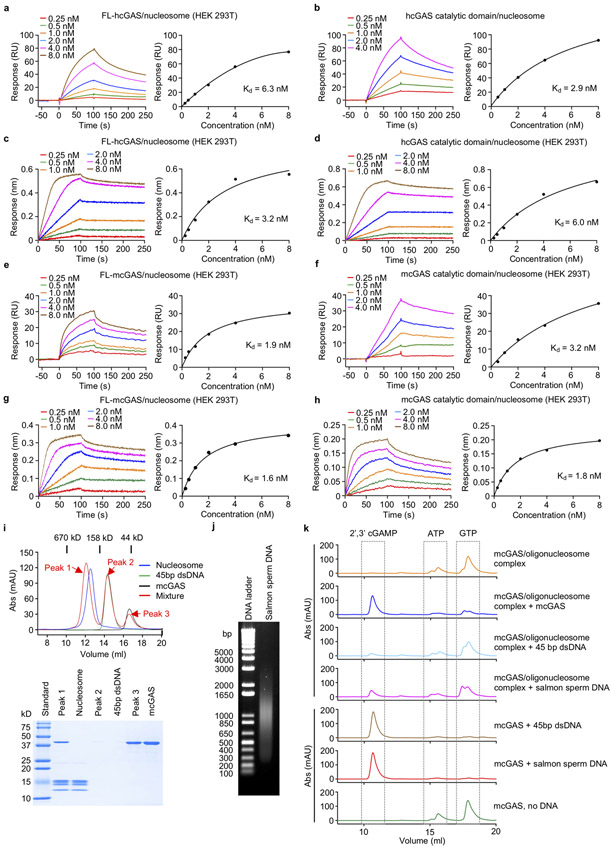
To determine the binding affinity between the nucleosome and cGAS, we expressed biotin labeled full-length human cGAS (hcGAS) and conducted binding studies by surface plasmon resonance (SPR) (Fig. 1d, Extended Data Fig. 1i, 2a). We observed that both reconstituted and cell-derived nucleosomes bind to hcGAS with high affinity (Kd 8.6 and 6.3 nM, Fig. 1d, Extended Data Fig. 2a). The catalytic domain of hcGAS binds to the nucleosome with similar affinity (Kd 2.9 nM, Extended Data Fig. 2b). Similar results were obtained by bio-layer interferometry (Extended Data Fig. 2c, d). In addition, binding studies showed that full-length mcGAS and its catalytic domain also bind to the nucleosome with nanomolar affinities (Extended Data Fig. 2e-h). We have also analyzed a mixture of nucleosome, 45 bp dsDNA and mcGAS by gel filtration chromatography, which revealed that the nucleosome competes with dsDNA to bind cGAS (Extended Data Fig. 2i).
Nucleosome binding inhibits the activity of cGAS
Next, we conducted cGAS activity assays to determine if the nucleosome bound cGAS is active or not. First, we conducted cGAS activity assay using purified mcGAS-nucleosome complex and no activity was detected (Fig. 1e). Next, we added mcGAS to the mcGAS-nucleosome complex and observed that just a little cGAMP was formed (Fig. 1e), indicating that the dsDNA associated with the nucleosome cannot effectively activate cGAS that was not bound to the nucleosome. In addition, we added some 45 bp dsDNA and salmon sperm DNA (Extended Data Fig. 2j) to the mcGAS-nucleosome complex and conducted the activity assay. We observed very low activity from the nucleosome bound cGAS towards the 45 bp dsDNA (Fig. 1e). However, salmon sperm DNA can weakly activate cGAS bound to the nucleosome (Fig. 1e). As a positive control, ligand free cGAS can be robustly activated by the 45 bp DNA or salmon sperm DNA (Fig. 1e). Consistent with these results, very low activity was detected for cGAS bound to oligonucleosomes (Extended Data Fig. 2k). The cGAS-oligonucleosomes complex can be weakly activated by salmon sperm DNA (Extended Data Fig. 2k). Surprisingly, ligand free cGAS can be activated by the cGAS-oligonucleosome complex, likely through the naked linker dsDNA (Extended Data Fig. 2k).
Structural determination by cryo-EM
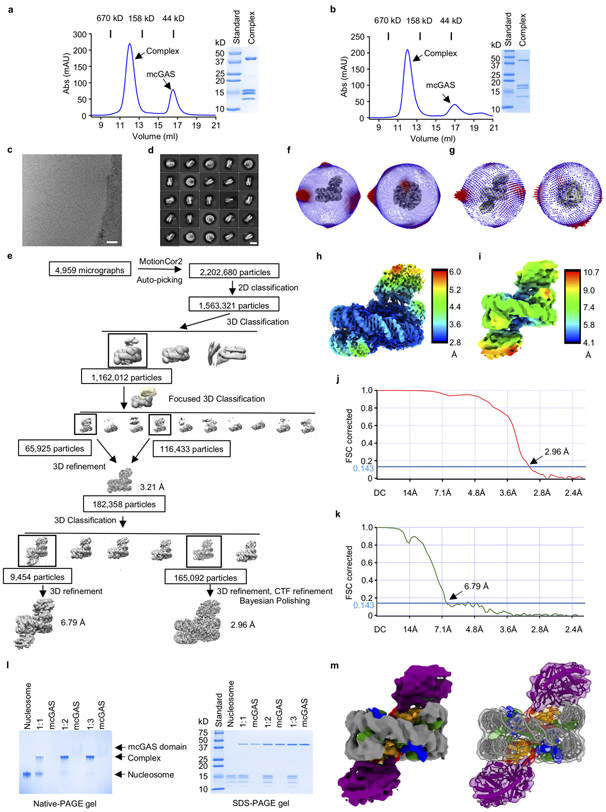
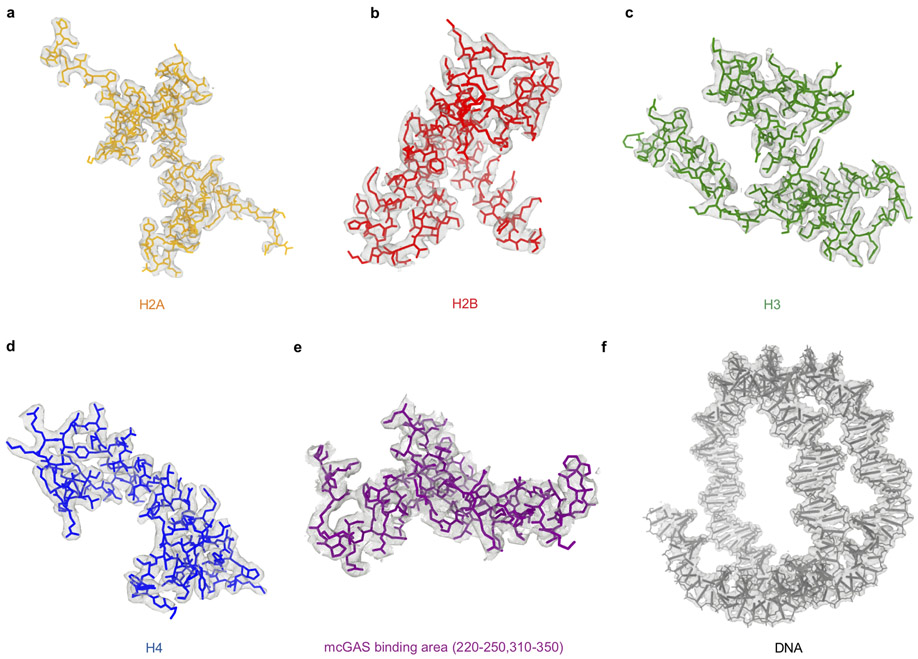
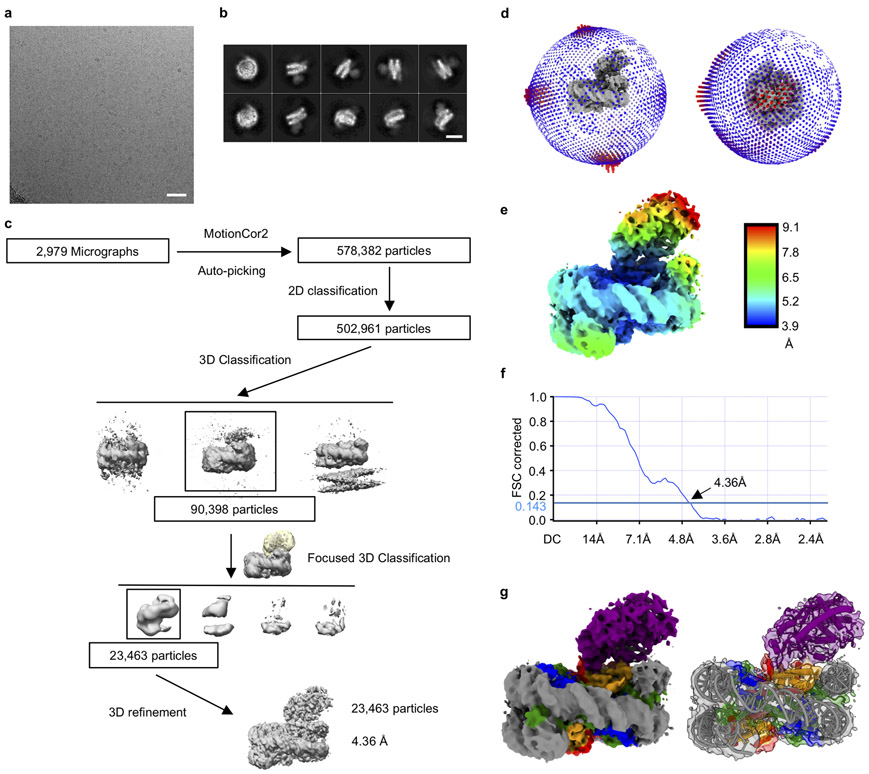
To generate samples for cryo-EM, we purified mcGAS-nucleosome complex using both reconstituted nucleosome and nucleosomes purified from HEK 293T cells (Extended Data Fig. 3a, 3b). Particle classification yielded a 3D reconstruction at a nominal resolution of 2.96 Å for mcGAS bound to the reconstituted nucleosome (Fig. 2a, Extended Data Fig. 3, Extended Data Table 1). In addition, we observed that a small fraction of the particles has two cGAS bound to them (Extended Data Fig. 3e, 3i, and 3k-l). Structural models of the catalytic domain of inactive mouse cGAS (PDB 4K8V)10 and human nucleosome (PDB 3AFA)21 were docked into the 2.96 Å resolution map to generate the initial model of the cGAS-nucleosome complex. The model was rebuilt manually and refined against the EM density map using Phenix22. The nucleosome was well defined in the EM map (Fig. 2b, Extended Data Fig. 4). A majority of residues of cGAS interacting with the nucleosome were also well defined (Extended Data Fig. 4). Reconstruction of the complex using nucleosome purified from cells resulted in a 4.36 Å map and a similar structural model (Extended Data Fig. 5, Extended Data Table 1). The higher resolution 1:1 mcGAS-nucleosome complex structure will be discussed hereafter.
Figure 2. Cryo-EM structure of mouse cGAS catalytic domain bound to human nucleosome.
a. Cryo-EM density map of the mcGAS-nucleosome complex at 2.96 Å resolution in two different orientations contoured at 3σ.
b. Ribbon representation of the mcGAS-nucleosome complex structure.
Structure of cGAS bound to the nucleosome
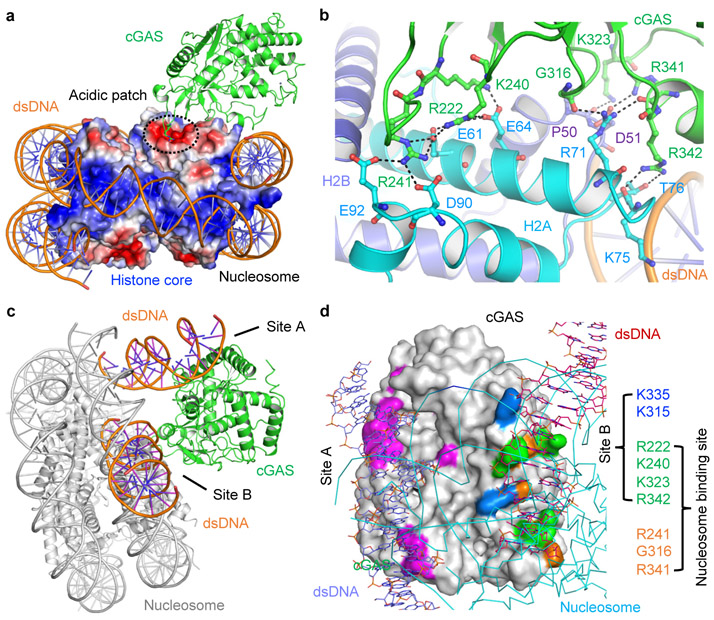
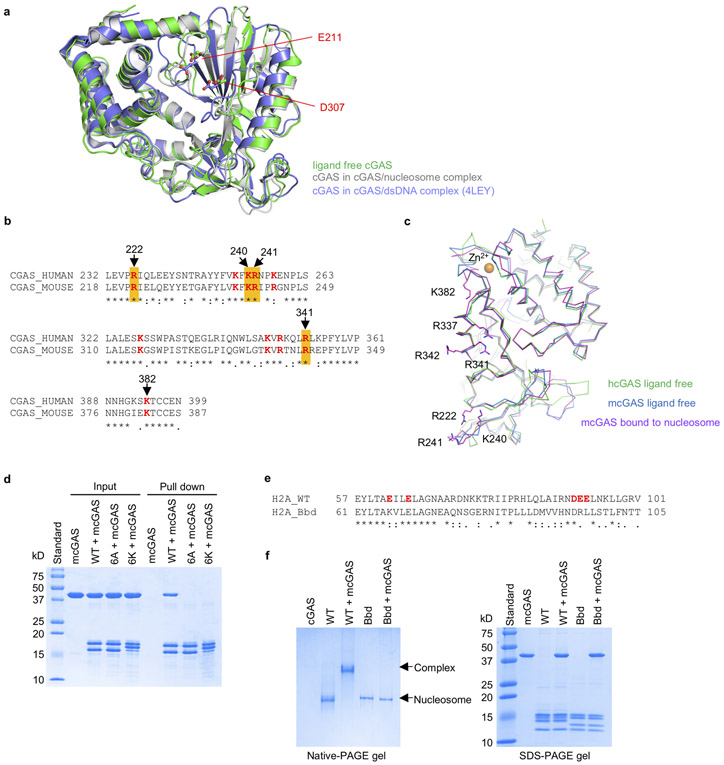
The structure of mcGAS bound to the nucleosome reveals that cGAS binds to the top of the nucleosome, interacting with the exposed histone proteins (Fig. 3a). Mouse cGAS in the DNA free conformation (PDB 4K8V)10 fits into the density map much better than mcGAS in the DNA-bound conformation (PDB 4LEZ) (Extended Data Fig. 6a)19. A few loops of cGAS have slightly altered conformations compared to ligand free cGAS to maximize its interaction with the nucleosome (Extended Data Fig. 6a). Consistent with previous studies15, the structure reveals that cGAS interacts with the nucleosome mainly through histone H2A and H2B (Fig. 3b). The buried surface areas are ~1000 Å2 at the cGAS-H2A interface and ~620 Å2 at the cGAS-H2B interface. cGAS does not interact with histones H3 and H4 and the dsDNA associated with the nucleosome.
Figure 3. Interactions between cGAS and the nucleosome.
a. cGAS binds to the acidic patch of the nucleosome. cGAS is shown by the green ribbons. The histone core is shown by the surface representation colored according to surface electrostatic potential. Positively charged surface is colored in blue and negatively charged surface in red.
b. Interactions between cGAS (green) and histone H2A (cyan) and H2B (slate).
c. Superposition of the cGAS-dsDNA and the cGAS-nucleosome complex structures shows that the second DNA binding site (site B) of cGAS mediates its interactions with the nucleosome.
d. Two overlapping sets of residues are involved in nucleosome and DNA binding by cGAS.
cGAS interacts with the nucleosome mainly through electrostatic interactions via a surface that overlaps with its second DNA binding site, the B site19 (Fig. 3b, c). The side chains of Arg222, Lys240 and Arg241 interact with the carboxyl groups of Glu61, Glu64, Asp90 and Glu92 of histone H2A through electrostatic interactions, anchoring cGAS to the acidic patch (Fig. 3b). The carbonyl groups of Gly316 and Arg341 form two hydrogen bonds with the side chain of Arg71. Besides interacting with Arg71, Arg341 also interacts with the carboxyl group of Asp51 of histone H2B via its side chain (Fig. 3b). In addition, the side chain of Lys323 forms a hydrogen bond with the carbonyl group of Pro50 of histone H2B. Arg342 forms two hydrogen bonds with the carbonyl group of Lys75 and hydroxyl group of Thr76 (Fig. 3b). Superposition of the cGAS-dsDNA complex (PDB 4LEZ) and cGAS-nucleosome complex structures reveals that residues Arg222, Lys240, Lys323, and Arg342 are involved in both dsDNA binding and nucleosome binding (Fig. 3d). It is obvious that tight nucleosome binding prevents DNA binding to the B site and thus blocks cGAS activation. Since the structures of human and mouse cGAS are similar (Extended Data Fig. 6b, c), we speculate that hcGAS should bind the nucleosome in a similar fashion.
To confirm that cGAS binds to the nucleosome by interacting with H2A/B, we have generated the H2A/B dimer and its mutants and conducted cGAS binding studies. We observed that cGAS bound to the WT H2A/B, but did not bind to the acidic patch mutants (Extended Data Fig. 6d). Moreover, we have conducted nucleosome binding study using the H2A.Bdb nucleosome, which contains mutations at the acidic patch (Extended Data Fig. 6e) and observed that the H2A.Bdb nucleosome did not bind cGAS (Extended Data Fig. 6f).
Mutations of cGAS affect nucleosome binding
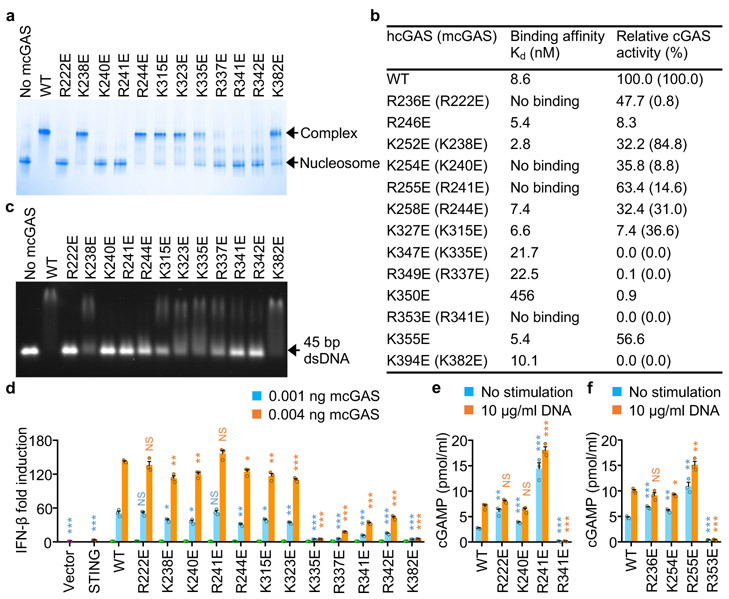
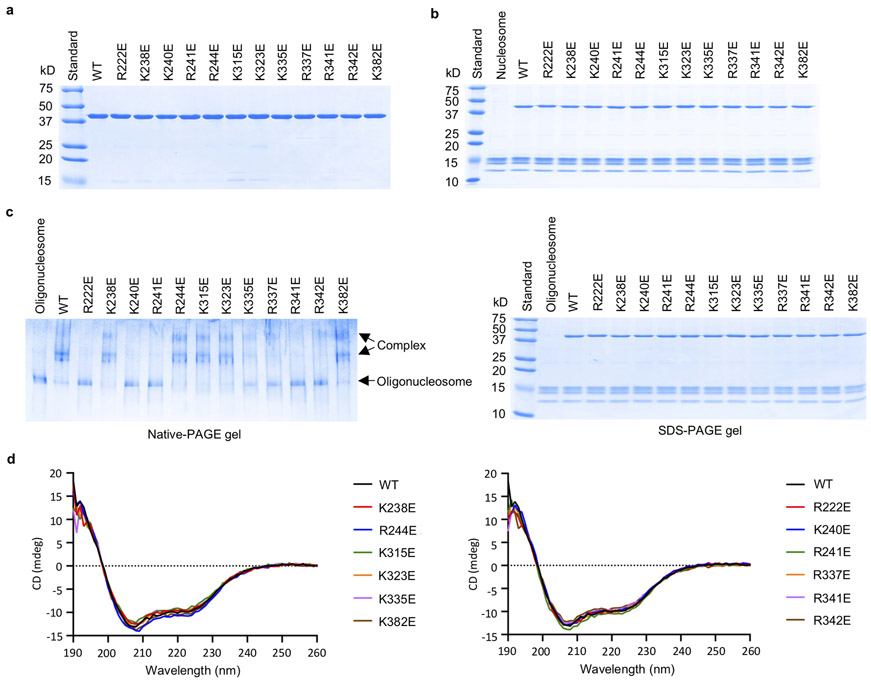
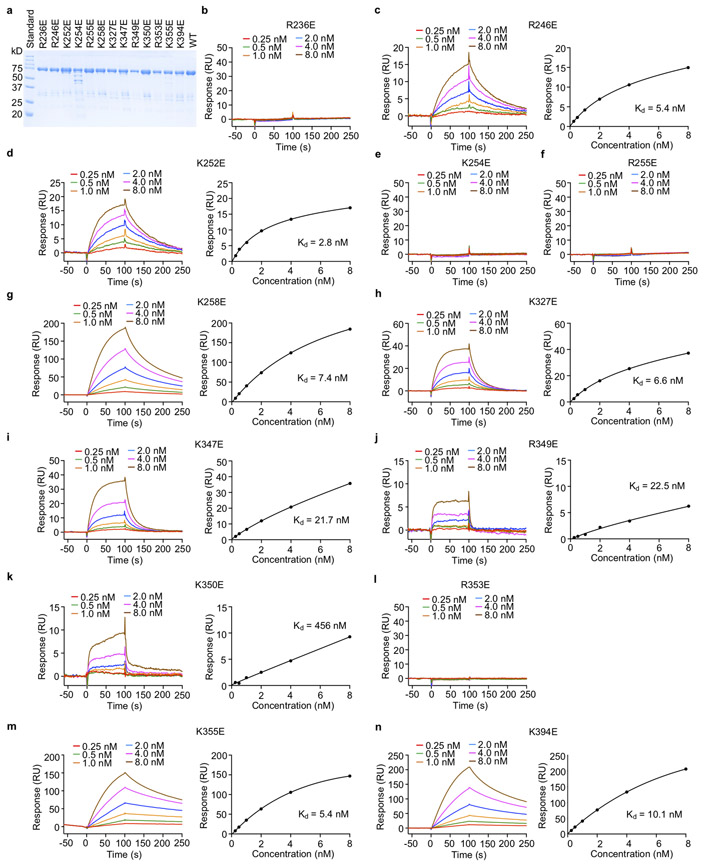
To determine how those positively charged residues at the cGAS-nucleosome interface contribute nucleosome binding, we have generated several mouse cGAS mutants and conducted nucleosome binding studies (Fig. 4a, Extended Data Fig. 7a, b). We observed that mutations R222E, K240E, R241E, and R341E disrupted nucleosome binding (Fig. 4a). Mutations R337E and R342E dramatically reduced nucleosome binding (Fig. 4a). Nucleosome binding was slightly reduced by mutations K315E, K323E, K335E and K382E (Fig. 4a). By contrast, mutations K238E and R244E did not affect nucleosome binding (Fig. 4a). Similar results were obtained using oligonucleosomes in the binding studies (Extended Data Fig. 7c). Circular dichroism (CD) spectroscopy showed that these mcGAS mutants fold properly (Extended Data Fig. 7d). Next, we expressed several hcGAS mutants and conducted nucleosome binding studies by SPR (Fig. 4b, Extended Data Fig. 8). We observed that mutations R236E, K254E, R255E, and R353E abolished nucleosome binding (Fig. 4b, Extended Data Fig. 8). In addition, mutation K350E also reduced nucleosome binding dramatically (Fig. 4b, Extended Data Fig. 8k). Mutations K347E and R349E only reduced the binding affinity by just a few folds (Fig. 4b, Extended Data Fig. 8i, j). By contrast, mutations R246E, K252E, K258E, K327E, K355E, and K394E almost did not affect the binding (Fig. 4b, Extended Data Fig. 8).
Figure 4. Mutations at the cGAS-nucleosome interface affect nucleosome binding, dsDNA binding, cGAS activity, and cGAS mediated signaling.
a. Polyacrylamide gel electrophoretic mobility shift assay (EMSA) shows that mutations at the cGAS-nucleosome interface affect nucleosome binding by mcGAS. In this assay, mcGAS catalytic domain was mixed with nucleosome at molar ratio of 3:1.
b. Binding affinities of human cGAS mutants to the nucleosome and the relative catalytic activities of human and mouse cGAS mutants.
c. Agarose gel electrophoretic mobility shift assay (EMSA) shows that mutations at the cGAS-nucleosome interface affect dsDNA binding. In this assay, mcGAS catalytic domain was mixed with 45 bp dsDNA at molar ratio of 20:1
d. IFN-β luciferase reporter assays show that mutations of mcGAS affect signaling in HEK 293T cells. Luciferase reporter signals from the cells transfected with 0.004 ng cGAS and 0.4 ng STING are indicated by the orange bars, from cells transfected with 0.001 ng cGAS and 0.4 ng STING by the cyan bars, from cells transfected with 0.004 ng cGAS, 0.4 ng STING, or the vector control by the green, brown and purple bars, respectively.
e. cGAMP levels in HEK 293T cells transfected with mcGAS mutants. The cells were transfected with indicated mcGAS plasmids for 24 hours and stimulated with lipofactamine alone or lipofactamine plus salmon sperm DNA, followed by cGAMP assays from the cell lysates.
f. cGAMP levels in HEK 293T cells transfected with hcGAS mutants with and without DNA stimulation.
In d-f, the data (mean ± SEM) are representative of three independent experiments. Each dot represents a biological replicate (n = 3). The p values were calculated by two-tailed Student’s t test: * p < 0.05, ** p < 0.01, *** p < 0.001, NS-not significant.
DNA binding and catalytic activity of the cGAS mutants
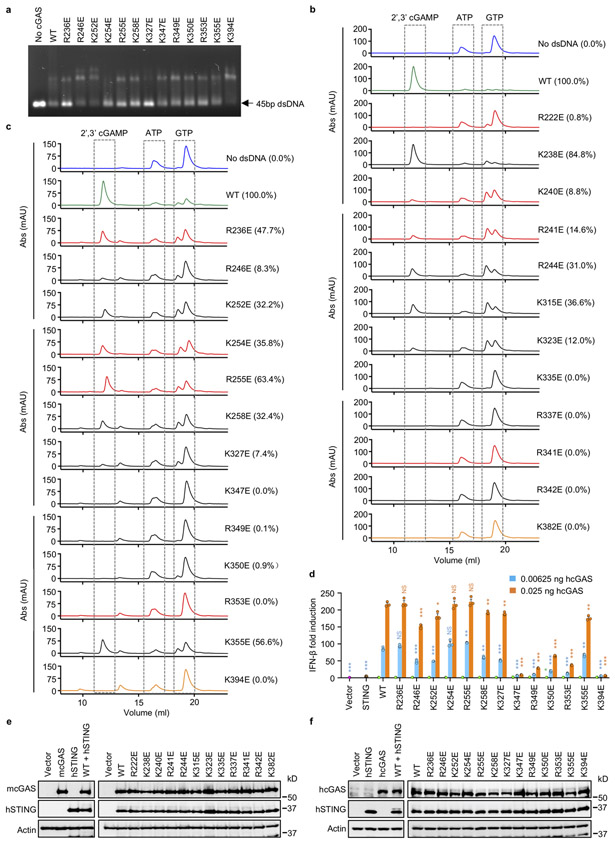
Next, we tested how these mutations affect dsDNA binding by cGAS. We observed that mutations R222E, K240E, R241E, R244E, R341E, and R342E of mcGAS nearly abolished DNA binding, while mutations K238E, K315E, K323E, K335E, and R337E reduced DNA binding (Fig. 4c). By contrast, mutation K382E only slightly reduced DNA binding (Fig. 4c). Consistent with these results, gel shift assays showed that mutations R236E and K327E of hcGAS dramatically reduced DNA binding (Extended Data Fig. 9a). Mutations K254E, R255E, K258E, K350E, and R353E also significantly reduced DNA binding (Extended Data Fig. 9a). Mutations K347E, R349E, and K355E slightly reduced DNA binding (Extended Data Fig. 9a). By contrast, mutations R246E, K252E, and K394E only have minor effects on DNA binding (Extended Data Fig. 9a).
We have also analyzed the catalytic activities of these cGAS mutants. We observed that mutation K238E slightly reduced the activity of mcGAS (Fig. 4b, Extended Data Fig. 9b). Mutations R244E and K315E reduced the activity by nearly 70% (Fig. 4b, Extended Data Fig. 9b). Mutations K240E, R241E and K323E reduced the activity by almost 90% (Fig. 4b, Extended Data Fig. 9b). By contrast, mutations R222E, K335E, R337E, R341E, R342E and K382E nearly abolished the activity (Fig. 4b, Extended Data Fig. 9b). Consistent with these data, enzyme assays showed that hcGAS mutants R236E, R255E and K355E exhibit 40% to 50% reduced activity (Fig. 4b, Extended Data Fig. 9c). Mutations K252E, K254E, and K258E reduced the activity by more than 60% (Fig. 4b, Extended Data Fig. 9c). Mutations R246E and K327E reduced the activity by over 90% (Fig. 4b, Extended Data Fig. 9c). By contrast, the K347E, R349E, K350E, R353E and K394E mutants are almost not active (Fig. 4b, Extended Data Fig. 9c).
Mutations of cGAS affect signaling in cells
To investigate how these mutations affect the function of cGAS in cells, we conducted IFN-β luciferase reporter assays in HEK 293T cells transfected with these cGAS mutants and STING (Fig. 4d, Extended Data Fig. 9d). The expression of cGAS and STING were confirmed by Western blot (Extended Data Fig. 9e, f). Although the mutation R222E nearly abolished the catalytic activity of mcGAS (Fig. 4b), it still shows similar activity as the WT (Fig. 4d), likely due to disrupted nuclear tethering. The K240E mutant shows slightly lower activity (Fig, 4d) even though its catalytic activity is reduced by more than 90% (Fig. 4b). The R241E mutant shows slightly higher activity compared to the WT, likely due to the disruption of nuclear tethering (Fig. 4d). The R337E, R341E, and R342E mutants exhibit significantly lower activity (Fig. 4d), in agreement with the severely compromised catalytic activities of these mutants (Fig. 4b, Extended data Fig 9b). The effects of mutations K238E, R244E, K315E, K323E, and K335E on signaling (Fig. 4d) roughly correlate with the catalytic activities of these mutants (Fig. 4b, Extended Data Fig. 9b). As a negative control, the K382E mutation, which abolishes cGAS enzymatic activity but does not affect nucleosome binding (Fig. 4a, b), also abolishes signaling in cells (Fig. 4d). Similar results were obtained when hcGAS mutants were expressed in the cells (Extended Data Fig. 9d). The R236E, K254E, and R255E mutants of hcGAS, which do not bind to the nucleosome (Extended Data Fig. 9d), showed similar or slightly higher activity compared to the WT (Extended Data Fig. 9d). Mutations K350E and R353E, which dramatically reduced nucleosome binding and the catalytic activity (Fig. 4b), also reduced the reporter signal (Extended Data Fig. 9d). To confirm results from the reporter assays, we measured cGAMP levels in cell transfected with cGAS mutants that disrupt nucleosome binding. Consistent with results from previous studies14, transfection of cells with the R222E and R241E mutants of mcGAS or the R236E and R255E mutants of hcGAS induced significantly higher levels of cGAMP compared to WT cGAS (Fig. 4e, f). Transfection of cells with the K240E mutant of mcGAS or the K254E mutant of hcGAS also induced slightly higher levels of cGAMP (Fig. 4e, f). Moreover, the production of cGAMP in these cells are inducible by dsDNA transfection (Fig. 4e, f).
Discussion
These structural and functional studies revealed the molecular basis of nuclear tethering that inactivates cGAS. We propose that high affinity nucleosome binding keeps cGAS in an inactive conformation and inhibits cGAS activation by dsDNA to avoid autoimmune responses to genomic DNA. Although the naked dsDNA in the linker region between nucleosomes can still activate cGAS, most of the nucleosome-bound dsDNA does not activate cGAS efficiently. By contrast, untethered cGAS in the cytosol is able to engage naked dsDNA and induces the expression of type I interferons. The delicate balance between nuclear-tethered and free cytosolic cGAS is likely critical to prevent autoreactivity, while at the same time provides a mechanism of host defense. It has been suggested that the sequestration of cGAS in an inactive state in the nucleus could be an important mechanism to optimize the dynamic range of the immune responses mediated by cGAS and to limit the ‘noise’ of the system2. Mutations that disrupt the balance between the free and nuclear tethered protein render cGAS constitutively active in cells and abolish its response to dsDNA transfection14,19. Perturbation of nuclear tethering of cGAS may provide a beneficial mechanism to boost the antiviral and antitumor immune responses, but may also increase the likelihood of causing autoimmunity. Our data do not definitively show that cGAS mutants unable to bind nucleosomes are more active against nuclear or mitochondrial DNA, and thus evidence for autoreactivity on endogenous DNA is indirect at this stage. Future studies are required to determine the cell biological basis governing how unique pools of cGAS are regulated to limit autoreactivity, while also maintaining responsiveness to pathogen-derived DNA and endogenous DNA damage. Since cGAS binds to nucleosome with high affinity by interacting with the acidic patch, this interaction likely blocks the access of many other nucleosome binding proteins that are involved in DNA damage repair, epigenetic regulation, cancer, and cell death. However, the exact roles of cGAS in those processes remain to be determined.
Methods
Antibodies
Commercially obtained antibodies include: primary antibodies: rabbit anti-human cGAS (15102s, Cell Signaling Technology, WB 1:1,000, IF 1:200), rabbit anti-mouse cGAS (31659s, Cell Signaling Technology, WB 1:1,000), rabbit anti-human STING (13647s, Cell Signaling Technology, WB 1:1,000), rat anti-PARP1 (MAB600, R&D Systems, WB 1:1,000), rabbit anti-Histone H3 (17168-1, Proteintech, WB 1:2,000), rat anti-HA (11867423001, Roche, WB 1:2,000, IF 1:600), mouse anti-α-tubulin (AB_1157911, DSHB, IF 1:1,000), mouse anti-GAPDH (600004-1, Proteintech, WB 1:20,000), and mouse anti-actin (MA5-11869, Thermo Fisher Scientific, WB 1:4,000); secondary antibodies: Peroxidase-conjugated AffiniPure Donkey Anti-Mouse IgG (H+L) (715-035-151, Jackson ImmunoResearch, WB 1:200,000 for GAPDH), Peroxidase-conjugated AffiniPure Donkey Anti-Rabbit IgG (H+L) (711-035-152, Jackson ImmunoResearch, WB 1:20,000 for cGAS, WB 1:200,000 for histone H3), Peroxidase-conjugated AffiniPure Donkey Anti-Rat IgG (H+L) (712-035-153, Jackson ImmunoResearch, WB 1:200,000 for HA, WB 1:20,000 for PARP1), Anti-rabbit IgG, HRP-linked Antibody (7074s, Cell Signaling, WB 1:1,000 for cGAS and STING in HEK 293T cells), Anti-mouse IgG, HRP-linked Antibody (7076s, Cell Signaling, WB 1:1,000 for actin in HEK 293T cells), IgG (H+L) Highly Cross-Adsorbed Donkey anti-Mouse, Alexa Fluor 555 (A31570, Invitrogen, IF 1:1,000), Alexa Fluor 488-conjugated AffiniPure Donkey Anti-Rabbit IgG (H+L) (711-545-152, Jackson ImmunoResearch, IF 1:600), and Alexa Fluor 488-conjugated AffiniPure Donkey Anti-Rat IgG (H+L) (712-545-153, Jackson ImmunoResearch, IF 1:800).
Cell culture
HeLa cells were purchased by ATCC, maintained in DMEM (D5796, Sigma) supplemented with 10% FBS (97068-085, VWR) and kept at low passage to minimize drift. Primary cGAS−/− MEFs were generated from E13.5 embryos in accordance with animal use protocols approved by the Institutional Animal Care and Use Committee (IACUC) at Texas A&M University, maintained in DMEM supplemented with 10% FBS, then transduced with retroviruses encoding SV40 large T antigen (pBABE-puro SV40 LT, Addgene) plasmid to obtain immortalized cGAS−/− MEF (cGAS−/− MEF SV40I). cGAS−/− MEF SV40I cells were then reconstituted with mouse cGAS construct (pMXs-blast-mcGAS-HA cloned from pUNO1-mcGAS-HA3x, InvivoGen) to generate cGAS−/− MEF SV40I+mcGAS-HA cells. HEK 293T cells (ATCC, CRL-3216) were cultured in DMEM (1×) + GlutaMAX medium (Gibco, 10569-010) supplemented with 10% FBS (Gibco, 26140-095), penicillin (100 U/ml) and streptomycin (100 μg/ml) (Lonza, 17-602E) at 37 °C in a humidified atmosphere with 5% CO2. The cells have been authenticated by validating cGAS, STING, or actin by western blotting or immunofluorescence and have been tested negative for mycoplasma contamination.
Salt fractionations and immunoblotting
Cellular fractionation was performed largely as described14. Briefly, cells were each divided into two aliquots, and one aliquot (10%) was resuspended in 50 μl of 1% SDS lysis buffer, boiled for 5 minutes, sonicated for 1 min and saved as ‘whole cell lysate’ (WCL). The second equal aliquot (90%) was resuspended in 400 μl extraction buffer containing 10 mM HEPES, 10 mM KCl, 1.5 mM MgCl2, 0.34 M sucrose, 10% glycerol, 0.2% NP-40, pH 7-7.6 and protease inhibitors. The homogenates were incubated on ice for 10 mins with occasional vortexing, centrifuged at 6500 g for 5 mins three times, and the supernatant was saved as the ‘cytosol’ fraction. The nuclei were then washed for 1 min on ice in extraction buffer without NP-40 and centrifuged at 6500 g for 5 mins at 4 °C twice, and resuspended in 150 μl salt buffer (50 mM Tris, 0.05% NP-40, 500 mM NaCl, pH 8.0), incubated on ice for 15 mins with vortexing for 15 s every 5 mins. Lysates were centrifuged at 15,000 rpm at 4 °C for 5 mins, and the supernatants were collected as “0.5 M NaCl” fraction. The final pellet was then lysed in 50 μl of 1% SDS lysis buffer, boiled at 95 °C for 5 mins and sonicated for 1 min. All samples were supplemented with denaturing SDS-PAGE sample buffer, loaded into 10-20% SDS–PAGE gradient gels, and transferred onto 0.22 μm PVDF membranes. After air drying to return to a hydrophobic state, membranes were incubated in primary antibodies at 4 °C overnight in 1× PBS containing 1% casein, HRP-conjugated secondary antibody at room temperature for 1 h, and then developed with Luminata Crescendo Western HRP Substrate (Millipore). For HEK 293T cells, the cells were harvested 24 h after transfection and washed with 1 × PBS twice. After centrifugation at 300 g for 5 mins, the cells were lysed in 200 mM Tris, 150 mM NaCl, 1 mM EDTA, pH 7.5, and 1% Nonidet P-40 supplemented with the EDTA-free protease inhibitor cocktail (Roche, 11836170001), boiled with denaturing SDS-PAGE sample buffer at 95 °C for 10 mins. The proteins were loaded into 10% SDS-PAGE gel and transferred to nitrocellulose membrane (Bio-rad, 1620215). After incubation with the primary antibodies overnight at 4 °C, the membrane was further incubated with the corresponding HRP-conjugated secondary antibodies at room temperature for 2 h. Detection of the target proteins was performed with a ChemiDoc Imager and Image lab touch software 2.3.0.07 (Bio-rad).
Immunofluorescence microscopy
Cells were grown on coverslips overnight before staining. After washing in PBS, cells were fixed with 4% paraformaldehyde for 20 mins, permeabilized with 0.1% Triton X-100 in PBS for 5 mins, blocked with PBS containing 5% FBS for 30 mins, stained with primary antibodies for 1 h, and stained with secondary antibodies for 1 h. Cells were washed with PBS containing 5% FBS between each step. Coverslips were mounted with ProLong Diamond Antifade Mountant with DAPI (Molecular Probes). Cells were imaged on a Lionheart FX (BioTek) with a 10× or 40× objective. At least 100 cells were used to obtain statistical significance for nuclear cGAS intensity analysis. Gen5 v3.08 software was utilized to define the cell and nuclear region, and calculate the ratio of nuclear to whole cell cGAS fluorescent intensity.
Protein expression and purification
The cDNA of cGAS full length and catalytic domain were cloned into a modified pET-28a vector with an N-terminal Avi-His6-SUMO tag. Mouse cGAS catalytic domain (residues 142 – 507) was expressed in E.coli BL21 (DE3) with 0.4 mM isopropyl β-D-1-thiogalactopyranoside (IPTG) induction overnight at 16°C and purified as described previously19 . Biotin-Avi-His6-SUMO human and mouse cGAS full length and catalytic domains (human cGAS domain residues 157 – 522) were expressed in E.coli BL21 (DE3) cells co-transformed with the plasmids coding for cGAS and the pBirAcm plasmid coding for BirA. Protein expression was induced with 0.4 mM IPTG in the presence of 5 μg/ml biotin (Sigma-Aldrich, B4501). The proteins were first purified using a Ni2+-NTA column (Qiagen) and were further purified over a Superdex200 column (GE Healthcare Life Sciences). Biotin-Avi-His6-SUMO human and mouse cGAS full length and human cGAS catalytic domain were eluted with the buffer containing 20 mM Tris, 500 mM NaCl, pH 7.5. Biotin-Avi-His6-SUMO mouse cGAS catalytic domain was eluted with the buffer containing 20 mM Tris, 150 mM NaCl, pH 7.5. All mutants were generated using a PCR-based technique with appropriate primers and confirmed by DNA sequencing. The cGAS mutant proteins were expressed and purified the same way as the wild-type cGAS.
Nucleosome purification from HEK 293T cells
Nucleosomes were extracted and purified from HEK 293T cells using the nucleosome preparation kit (Active motif, 53504) according to the manual. Briefly, HEK 293T cells were cultured in 10 cm tissue culture dish to 70-80% confluency and were harvested with a cell scraper. 2 × 10⁷ cells were washed with 10 ml 1 × PBS buffer twice. Then the cells were resuspended in 1 ml ice-cold lysis buffer supplemented with 5 μl protease inhibitor cocktail and 5 μl 100 mM PMSF. After incubation on ice for 30 mins, the lysed cells were centrifuged at 2400 g for 10 mins at 4 °C to pellet the nuclei. The nuclei pellet was resuspended in 350 μl digestion buffer supplemented with 1.75 μl protease inhibitor cocktail and 1.75 μl 100 mM PMSF. After incubation at 37 °C for 5 mins, the resuspended nuclei were mixed with 17 μl diluted enzymatic shearing cocktail and incubated at 37 °C for 50 mins. To generate oligonucleosomes, the mixture was incubated at 37 °C for 15 mins. During the incubation, the mixture was vortexed approximately every 2 mins. To stop the reaction, 7 μl ice-cold 0.5 M EDTA was added into the mixture for 10 mins on ice. Then, the mixture was centrifuged at 21000 g for 10 mins. Nucleosomes or oligonucleosomes in the supernatant were purified using a Superose 6 increase 10/300 GL column (GE Healthcare Life Sciences) with the running buffer 20 mM Tris, 150 mM NaCl, pH 7.5. The purified nucleosomes and oligonucleosomes were concentrated and stored at 4 °C.
Reconstitution and purification of human nucleosome
Human histone H2A, H2B, H3-C110A, and H4 with TEV tags were cloned into a pETDuet vector and expressed in E. coli BL21 (DE3) at 37 ˚C. The cell pellets were resuspended in 50 mM Tris, 100 mM NaCl, 0.1% Triton-X100, pH 8.0 buffer and lysed by sonication. Inclusion bodies were collected and washed three times with additional lysis buffer and three times with 50 mM Tris, 100 mM NaCl, pH 8.0 buffer. Inclusion bodies were then dissolved in 6 M guanidine hydrochloride, 20 mM Tris, 250 mM NaCl, pH 8.0 buffer and purified under denatured conditions using a Ni-NTA column. The histone proteins were eluted with 6 M urea, 20 mM Tris, 500 mM NaCl, 250 mM imidazole, pH 7.8 buffer, dialyzed against 5% acetic acid, flash frozen, and lyophilized. A plasmid containing the original Widom 601 sequence cloned in a pUR19 vector was used as a template for PCR amplification. Purified 601 DNA was diluted to 200-300 ng/μL in 20 mM Tris, 1 mM EDTA, pH 7.8 buffer and solid NaCl was added to a final concentration of 2 M. The histone pellets were dissolved in 6 M guanidine hydrochloride, 20 mM Tris, 500 mM NaCl, pH 7.8 buffer. To prepare the H2A/H2B dimer, H2A and H2B were mixed in an equimolar ratio and diluted with 6 M guanidine hydrochloride to adjust the total protein concentration to 4 mg/mL. The denatured H2A/H2B solution was then dialyzed sequentially at 4 ˚C against a 20 mM Tris, 1 mM EDTA, pH 7.8 buffer containing 2 M, 1 M, and 0.5 M NaCl. H2A/H2B 6A and 6K dimer mutants were prepared as the wild-type H2A/H2B dimer. Refolding of the H3/H4 tetramer were done in the same manner. The refolded H2A/H2B dimer and H3/H4 tetramer were mixed in a 2:1 molar ratio and solid NaCl was added to a final concentration of 2 M to form histone octamers. Purified 601 DNA in 2 M TE buffer was added to the histone octamer solution in a molar ratio of 0.9:1 and dialyzed against 2 M TE buffer. While stirred at room temperature, a 20 mM Tris buffer at pH 7.8 was slowly added to the 2 M salt buffer with the DNA/histone mixture until the salt concentration was reduced to below 200 mM. The reconstituted nucleosome was then dialyzed against 20 mM Tris, 20 mM NaCl, 1 mM EDTA, pH 7.8 buffer. TEV protease was then added to the nucleosome solution (TEV: nucleosome 1:30, w:w) to cleave the His-TEV tags. The reconstituted nucleosome was purified using a Superdex 200 column eluted with 20 mM Tris, 150 mM NaCl at pH 7.5.
Surface plasmon resonance (SPR)
All SPR binding studies were performed with a Biacore X100 instrument (GE Healthcare Life Sciences) and Biacore X100 control software version 2.0. The Biotin CAPture kit (GE healthcare life science, 28920233) was used to detect the binding between human cGAS and nucleosome according to the manual. Briefly, Biotin-Avi-His6-SUMO cGAS was captured on the sensor chip CAP. Serial dilutions of nucleosome were flowed through the chip at 30 μl/min in 1× HBS-EP buffer supplemented with 5 mM MgCl2. The multi-cycle kinetic/affinity protocol was used in all studies. In each cycle, the nucleosome was injected for 100 s. The sensor chip was regenerated with a buffer containing 6 M guanidine hydrochloride and 0.25 M NaOH at the end of each cycle. For full length mouse cGAS, the sensor chip SA (GE healthcare life science, BR-1000-32) was used for the binding study and the chip was regenerated with 2 M MgCl2 at the end of each cycle. The Biotin CAPture kit was used for the binding study of mouse cGAS catalytic domain and nucleosome with the running buffer 20 mM Tris, 150 mM NaCl, pH 7.5. All data were analyzed using Biacore X100 evaluation software version 2.0 (GE Healthcare Life Science) and the binding affinities (Kd) were determined by fitting the data to a steady-state 1:1 binding model. All graphs were made using GraphPad Prism 8.0.
Biolayer interferometry (BLI)
Biolayer interferometry (BLI)-based assays using the Octet RED96 instrument and ForteBio Data Acquisition 11.1 software (ForteBio, Inc.) were performed to detect the interaction between cGAS and nucleosome. Specifically, streptavidin biosensors were loaded with 5 μg/mL biotin-labeled cGAS proteins. The cGAS-immobilized tips were dipped into 2-fold serial dilutions of nucleosome (0.25, 0.5, 1, 2, 4, and 8 nM) in 1× HBS-EP buffer supplemented with 5 mM MgCl2. The association and dissociation phases were measured for 100s and 150s respectively. The buffer control was subtracted from raw data and curves were aligned to the baseline. All data were analyzed using Octet Data Analysis 11.1 software (Forte Bio, Inc.) and the binding affinities (Kd) were determined by fitting the data to a steady-state 1:1 binding model.
cGAS activity assay
All cGAS activity assays were performed in 20 mM HEPES, 5 mM MgCl2, 5 mM DTT, 150 mM NaCl, 2 mM ATP (Sigma Aldrich, A2383) and 2 mM GTP (Sigma Aldrich, G8877), pH 7.5. For mouse cGAS catalytic domain, 2.5 μM protein was incubated with 0.2 mg/ml salmon sperm DNA (Invitrogen, 15632-011) for 1 h at 37 °C. For mcGAS-nucleosome complex or mcGAS-oligonucleosome complex, nucleosomes or oligonucleosomes purified from HEK 293T cells were incubated with excess mouse cGAS catalytic domain (In the mixture, the molar ratio of mcGAS:nucleosome is 10:1 and mcGAS:oligonucleosome is 20:1) for 1 h on ice. The complexes were purified by Superdex 200 10/300 GL column (GE Healthcare Life Sciences) with the running buffer 20 mM Tris, 150 mM NaCl, pH 7.5. 2.5 μM mcGAS-nucleosome complex or 1.25 μM mcGAS-oligonucleosome complex was incubated with or without 2.5 μM mcGAS catalytic domain, 0.2 mg/ml 45bp interferon stimulatory dsDNA (ISD) or 0.2 mg/ml salmon sperm DNA for 1 h at 37 °C. For human cGAS full length, 2.5 μM protein was incubated with 0.2 mg/ml salmon sperm DNA for 4 h at 37 °C. The product in the supernatant was separated from cGAS, DNA and nucleosome by ultrafiltration and was analyzed on a Mono Q 5/50GL ion exchange column (GE Healthcare Life Sciences). The relative enzymatic activities of the mouse and human cGAS mutants were calculated by dividing the cGAMP peak height of the cGAS mutants by the cGAMP peak height of WT cGAS.
Electrophoretic mobility shift assay (EMSA)
For nucleosome binding studies by cGAS, 500 nM nucleosome or 250 nM oligonucleosome was mixed with mouse cGAS catalytic domain at indicated molar ratios in the buffer containing 20 mM Tris, 150 mM NaCl, 5 mM DTT, pH 7.5. After incubation on ice for 1 h, the mixtures were analyzed on 4-20% precast polyacrylamide gel (Bio-rad) at a constant voltage of 100 V. After coomassie blue staining and destaining, the gels were imaged using a ChemiDoc MP Imager (Bio-Rad). The binding study of nucleosome variant H2A.Bbd (Active motif, 31556) with mcGAS catalytic domain was also performed as the wild-type nucleosome. For cGAS and dsDNA binding studies, 1 μM 45 bp interferon stimulatory dsDNA was mixed with WT and mutants of mouse cGAS catalytic domain at molar ratio of 1:20. For human cGAS full length proteins, the molar ratio of DNA and protein is 1:4. The mixtures were incubated on ice for 30 mins and then analyzed using 1% agarose gel as described previously19.
ryo-EM data acquisition
Reconstituted nucleosomes or nucleosomes purified from HEK 293T cells were incubated with excess mouse cGAS catalytic domain for 1 h on ice. Excess cGAS was removed by Superdex 200 10/300 GL column (GE Healthcare Life Sciences). The cGAS-nucleosome complex fraction was collected and concentrated to 0.4 mg/ml. Aliquots of 3 μl nucleosome-cGAS complexes were loaded onto glow-discharged holey carbon grids (Electron Microscopy Sciences, CF312-50, CFlat, Cu, R 2/1, 300 mesh). Grids were blotted for 8 s and plunged frozen in liquid ethane using a Vitrobot at 4 °C and with 100% humidity. Grids were transferred to a Titan Krios electron microscope (Thermo fisher) operating at 300 kV equipped with a Gatan Gif Quantum energy filter (Slit width 20 eV). Micrographs were recorded by EPU through a Gatan K2 Summit detector in counting mode at a nominal magnification of ×130000 (yielding a pixel size of 1.07 Å). The dose rate on the camera was set to be 6 electrons per physical pixel per second. Exposure of 8 s was dose-fractionated into 40 moves frames, leading to a total accumulated dose of 42 electrons per Å2 on the specimen. Sample for the reconstituted nucleosome bound to mcGAS were recorded with a defocus in the range from 0.7 to 1.8 μm for a total of 4,959 micrographs. Nucleosomes purified from HEK 293T cells bound to cGAS were recorded with a defocus in the range from 0.8 to 2.0 μm for a total of 2,979 micrographs.
Cryo-EM data processing
The imaging processing was identical for the two datasets of in-vitro reconstituted and HEK 293T cells purified nucleosomes in complex with cGAS by Relion-3.0b. The collected movies were subjected to MotionCor2 for whole-frame dose-weighted motion correction. 2,202,680 and 578,382 particles were auto picked by Relion for reconstituted and HEK 293T cells purified nucleosome-cGAS complexes, respectively. Multiple rounds of reference-free 2D classification were run to remove aggregates, ice contamination and carbon edges by Relion, yielding 1,563,321 and 502,961 particles for reconstituted and HEK 293T cells purified nucleosome-cGAS complexes, respectively. Particles were processed with Relion 3D classification with ab-initio models generated in Relion. 3D class with cGAS densities were selected, yielding 1,162,012 and 90,398 particles for the reconstituted and HEK 293T cells purified nucleosome-cGAS complexes, respectively. The particles were subjected to 3D auto refine in Relion, followed by additional cGAS focused skip-align 3D classification. 3D classes with clear cGAS densities were selected again, yielding 182,358 and 23,463 particles for reconstituted and HEK 293T cells purified nucleosome-cGAS complexes, respectively. The particles were then re-centered and re-extracted to 3D auto refinement in Relion. The HEK 293T cells purified nucleosome-cGAS complex was reconstructed to 4.36 Å. The reconstituted nucleosome-cGAS complex was reconstructed to 3.21 Å and further subjected to skip-align 3D classification. Class of two cGAS bound nucleosome contained 9,454 particles and was refined to 6.79Å. The EM map of one cGAS bound nucleosome was refined to 2.96 Å by CTF refinement and Bayesian Polishing. The reported resolutions are based on the gold-standard Fourier shell correlation (FSC) 0.143 criterion. Local resolution variations were estimated using Relion.
Cryo-EM model building and refinement
Human nucleosome model containing the 601 DNA was generated using a published nucleosome structure (PDB 3AFA). The nucleosome and mcGAS (PDB 4K8V) models were docked in the EM map in Chimera and fine-tuned by manual adjustment with Coot23. This model was refined against the EM map in Phenix22. Several loop regions of mcGAS, tails of the histone proteins, and the 601 dsDNA were manually adjusted to fit into the map using Coot. The model was refined again in Phenix and the crystal structure of mcGAS was used as reference. This refined model was docked into the EM map derived from nucleosome purified from HEK 293T cells bound to mcGAS and the model was refined in Phenix to improve the fitting without further remodeling due to the lower resolution of the map. All structure figures were made by UCSF Chimera, UCSF ChimeraX, and PyMOL.
Ni-NTA Pull-down assay
The H2A/H2B acidic patch residues were mutated to alanine (H2A: E61A, E64A, D90A, E91A, E92A; H2B: D51A; referred as H2A/H2B 6A) or Lysine (H2A: E61K, E64K, D90K, E91K, E92K; H2B: D51K; referred as H2A/H2B 6K). 40 μg 6 × His tagged WT H2A/H2B, H2A/H2B 6A or H2A/H2B 6K dimer was incubated with 20 μg Ni-NTA beads in pull-down buffer (20 mM Tris, 150 mM NaCl, 5 mM DTT, pH 7.5) for 5 mins at 4°C. Beads were washed by pull-down buffer for three times and mixed with 60 μg mouse cGAS domain, then incubated for 5 mins at 4°C. Excess proteins were washed off the beads using 300 uL pull-down buffer for six times. 20 μl of 5 × SDS loading buffer was added to the resin and boiled for 5 mins, thereafter, the samples were centrifuged briefly. 5 μl of supernatant was analyzed by SDS-PAGE. The protein bands were visualized by coomassie blue staining.
Circular dichroism spectroscopy
Wild type mouse cGAS catalytic domain and its mutants were buffer exchanged into 10 mM phosphate buffer containing 50 mM K2SO4 at pH 7.5. The CD spectra were measured using a Chirascan spectrometer and Chirascan Spectrometer Control Panel software (v. 4.5.1848.0) with each protein samples at 3 μM concentration. The spectra from 280 nm to 190 nm wavelength were recorded at room temperature using a 2 mm path length quartz cuvette. The data were processed with Pro-Data Viewer (v. 4.5.1848.0).
IFN-β luciferase reporter assay
The cDNAs encoding human and mouse cGAS, human STING were cloned into pcDNA3.1 (−) vector respectively. All mutations were generated by site-directed mutagenesis and confirmed by DNA sequencing. We optimized the amount of STING plasmid used for transfection to ensure that the reporter signal results from cGAS transfection instead of the overexpression of STING. We have also conducted the assays at two different cGAS concentrations to test how cGAS expression level affects signaling. HEK 293T cells were seeded in CoStar White 96-well plate (Corning, 3917) at 4 × 10⁴ cells per well and cultured at 37 °C with 5% CO2. After 24 h, the cells were transfected with indicated amounts of pcDNA3.1-human or mouse cGAS plasmids, pcDNA3.1-human STING plasmid (0.4 ng per transfection), IFN-β firefly luciferase reporter plasmid (20 ng per transfection) and phRL-TK–Renilla luciferase plasmid (2 ng per transfection) using the transfection reagent Lipofectamine 2000 (Invitrogen, 11668-019) according to the manufacture’s manual. Empty pcDNA3.1 (−) plasmid was added to normalize the amount of DNA in each transfection. After 24 h, the luminescent signals were detected using the Dual-Glo Luciferase report assay kit (Promega, E2940) according to its manual with a BioTek Synergy HTX Multi-Mode microplate reader and Gen5 2.06 software. The relative firefly luciferase activity was normalized by the Renilla luciferase activity. The relative IFN-β reporter fold of induction represents the ratio normalized to the values from the cells transfected with the empty pcDNA3.1 (−) plasmid with the same treatment. Microsoft Excel was used to analyze the data. All data are presented as mean ± SEM. Two groups were compared using a two-tailed Student’s t test assuming equal variants. The statistical significance between the indicated samples is designated as *P < 0.05, **P < 0.01, ***P < 0.001, or NS (P > 0.05).
cGAMP assay
HEK 293T cells were seeded in Costar 24-well plate (Corning, 3526) at 2 × 10⁵ cells per well and cultured at 37 °C with 5% CO2. After 24 h, the cells were transfected with 1.5 ng pcDNA3.1-human cGAS plasmids or 0.05ng pcDNA3.1-mouse cGAS plasmids using the Lipofectamine 2000 according to the manufacture’s manual. Twenty four hours later, the cells were further transfected with 10 μg/ml salmon sperm DNA using Lipofectamine 2000 or with Lipofectamine 2000 alone. After 4 h, the cells were washed with 1×PBS once and lysed in 200 μl M-PER™ buffer (Thermo Fisher Scientific, 78501). After centrifugation at 15000 rpm for 10 mins at 4 °C, cGAMP in the supernatant was quantified using cGAMP ELISA kit (Cayman Chemical, 501700) according to the manufacture’s manual.
Statistics and Reproducibility
All data presented in this paper are representative of 2-4 independent experiments.
Extended Data
Extended Data Figure 1. cGAS binds tightly with nucleosome.
a. Gel filtration chromatography and SDS-PAGE analyses of nucleosomes purified from HEK 293T cells.
b. Gel filtration chromatography and SDS-PAGE analyses of the in vitro reconstituted nucleosomes.
c. Gel filtration chromatography showing that mcGAS catalytic domain binds to the nucleosomes.
d. SDS-PAGE analysis of nucleosome and mcGAS catalytic domain complex purified by gel filtration chromatography.
e. Polyacrylamide gel electrophoretic mobility shift assays (EMSA) showing the interactions between mcGAS catalytic domain with reconstituted nucleosomes and nucleosomes purified from HEK 293T cells. cGAS is mixed with nucleosome at molar ratio of 6:1.
f. Agarose gel electrophoresis of the dsDNA from purified mononucleosomes and oligonucleosomes. The histones have been digested with proteinase K.
g. SDS-PAGE analyses of purified mononucleosomes and oligonucleosomes.
h. Polyacrylamide gel electrophoretic mobility shift assays (EMSA) showing that mouse cGAS catalytic domain binds to mononucleosomes and oligonucleosomes (left panel). In the mixtures, the molar ratio of cGAS/mononucleosome is 3:1 and cGAS/oligonucleosome is 6:1. SDS-PAGE analyses of the input samples for EMSA were shown in the right panel.
i. SDS-PAGE analyses of biotin-Avi-His6-SUMO fusion of human and mouse cGAS full length and catalytic domain proteins used for nucleosome binding studies.
Extended Data Figure 2. cGAS-nucleosome binding studies and activity assays of cGAS-nucleosome complex.
a. Surface plasmon resonance (SPR) showing that full length human cGAS binds to nucleosomes purified from HEK 293T cells with nanomolar affinity.
b. Surface plasmon resonance (SPR) showing that human cGAS catalytic domain binds to reconstituted nucleosomes with nanomolar affinity.
c-d. Bio-Layer interferometry binding studies of full length human cGAS and its catalytic domain with nucleosomes (HEK 293T).
e-f. SPR binding studies show that full length mouse cGAS and its catalytic domain bind nucleosomes (HEK 293T) with nanomolar affinities.
g-h. Bio-Layer interferometry binding studies of full length mouse cGAS and its catalytic domain with nucleosomes (HEK 293T).
i. Gel filtration chromatography (top panel) and SDS-PAGE (lower panel) analyses of 45 bp ISD dsDNA, nucleosome and cGAS mixture show that the nucleosome efficiently competes with dsDNA to bind cGAS.
j. Agarose gel electrophoresis of the salmon sperm DNA used in cGAS activity assays.
k. cGAS activity assays by ion exchange chromatography show that oligonucleosome binding potently inhibits the activity of cGAS and ligand free cGAS can be activated by the cGAS-oligonucleosome complex.
Extended Data Figure 3. Cryo-EM analysis of mcGAS domain in complex with the reconstituted nucleosome.
a. Purification and SDS-PAGE analysis of nucleosomes from HEK 293T cells in complex with mcGAS catalytic domain.
b. Purification and SDS-PAGE analysis of reconstituted nucleosomes in complex with mcGAS catalytic domain.
c. Representative micrograph of mcGAS-nucleosome complex in vitrified ice. The scale bar denotes 50 nm.
d. 2D class averages of mcGAS-nucleosome complex particles. The scale bar denotes 10 nm.
e. Flowchart of data processing; see Methods for details.
f. Angular distribution of the mcGAS-nucleosome (1:1) particles included in the final reconstruction.
g. Angular distribution of the mcGAS-nucleosome (2:1) particles included in the final reconstruction.
h. Final 3D reconstruction of the mcGAS-nucleosome (1:1) complex, colored according to the local resolution.
i. Final 3D reconstruction of the mcGAS-nucleosome (2:1) complex, colored according to the local resolution.
j. Corrected Gold-standard Fourier shell correlation curves of the mcGAS-nucleosome (1:1) complex for the 3D electron microscopy reconstruction.
k. Corrected Gold-standard Fourier shell correlation curves of the mcGAS-nucleosome (2:1) complex for the 3D electron microscopy reconstruction.
l. Polyacrylamide gel shift assay (left) showing that one nucleosome can bind to two molecules of mcGAS catalytic domain. Nucleosome is mixed with mcGAS at molar ratio of 1:1, 1:2 and 1:3. SDS-PAGE analysis of the samples used for the gel shift assays was shown on right panel.
m. Density map (contoured at 3 σ) and structural model of cGAS-nucleosome (2:1) complex at 6.8 Å resolution.
Extended data Figure 4. Density maps and structural models of cGAS-nucleosome (reconstituted, 1:1) complex.
a - f. The density maps (grey mesh) of histones H2A, H2B, H3, H4, part of mouse cGAS catalytic domain, and the Widom 601 nucleosome positioning sequence DNA contoured at 3σ. The protein and DNA structures fitted into the density map are shown by the stick models.
Extended data Figure 5. Cryo-EM analysis of mcGAS domain in complex with nucleosome purified from HEK 293T cells.
a. Representative micrograph of mcGAS-nucleosome complex in vitrified ice. The scale bar denotes 50 nm.
b. 2D class averages of mcGAS-nucleosome complex particles. The scale bar denotes 10 nm.
c. Flowchart of data processing; see Methods for details.
d. Angular distribution of particles included in the final reconstruction.
e. Final 3D reconstruction, colored according to the local resolution.
f. Corrected Gold-standard Fourier shell correlation curves for the 3D electron microscopy reconstruction.
g. Density map (contoured at 3 σ) and structural model of cGAS-nucleosome (1:1) complex.
Extended Data Figure 6. Mutations in the acidic patch of the nucleosome abolished cGAS binding.
a. Superposition of structures of ligand free mcGAS (PDB, 4K8V), mcGAS in complex with dsDNA (PDB, 4LEY), and mcGAS bound to the nucleosome.
b. Sequence alignment of human and mouse cGAS around the nucleosome binding site. The conserved basic residues around the nucleosome binding site are colored red. Residues that abolish nucleosome binding when mutated are highlighted yellow.
c. Superposition for the structures of ligand free human cGAS (PDB, 4LEV), ligand free mouse cGAS (PDB, 4K8V) and mouse cGAS bound to the nucleosome.
d. Ni-NTA agarose pull-down assays of mouse cGAS catalytic domain by His-tagged H2A-H2B dimer. The 6A dimer contains mutations E61A, E64A, D90A, E91A, E92A of H2A and D51A of H2B. The 6K dimer contains mutations E61K, E64K, D90K, E91K, E92K of H2A and D51K of H2B.
e. Sequence alignment of WT human H2A and human H2A.Bbd. The acidic patch residues of WT H2A are colored red.
f. Polyacrylamide gel shift assay (left) showing that the recombinant nucleosome variant (H2A.Bbd) does not bind to mouse cGAS catalytic domain. In this assay, mcGAS was mixed with nucleosome at molar ratio of 3:1. SDS-PAGE analysis of the samples for gel shift assay were shown on the right panel.
Extended Data Figure 7. Characterization of mcGAS catalytic domain mutants and oligonucleosome binding studies.
a. SDS-PAGE analysis of mouse cGAS catalytic domain mutants used for the gel shift assays and enzyme activity assays.
b. SDS-PAGE analysis of mcGAS and nucleosome mixture samples used for the gel shift assay.
c. Polyacrylamide gel electrophoretic mobility shift assay (EMSA) shows that mutations at the cGAS-nucleosome interface affect oligonucleosome binding by cGAS. In these samples, mcGAS was mixed with oligonucleosome at molar ratio of 6:1. The samples used for the binding studies were analyzed by SDS-PAGE (right panel).
d. Circular dichroism of mouse cGAS catalytic domain and its mutants used for gel shift assays and enzyme activity assays. cGAS mutants that have strong binding to nucleosomes are shown by the spectra on the left. cGAS mutants that have weak or no binding to nucleosomes are shown by the spectra on the right.
Extended data Figure 8. Mutations at the cGAS-nucleosome interface affect nucleosome binding by human cGAS.
a. SDS-PAGE analysis of biotin-labeled full-length human cGAS mutants used for the SPR binding studies.
b - n. SPR binding studies of full-length human cGAS mutants with reconstituted nucleosomes.
Extended Data Figure 9. Mutations at the cGAS-nucleosome interface affect nucleosome binding, dsDNA binding and cGAS activity.
a. Agarose gel shift assay shows that mutations at the nucleosome binding surface of human cGAS affect the binding of a 45 bp dsDNA.
b. Enzyme activity assays of mouse cGAS catalytic domain mutants by ion exchange chromatography. In this assay, 2.5 μM mcGAS was incubated with 0.2 mg/ml salmon sperm DNA. WT mcGAS and negative control without DNA are colored in green and blue. Mutations that abolish nucleosome binding are colored red. The negative control mutation K382E is colored orange.
c. Enzyme activity assays of full-length human cGAS mutants by ion exchange chromatography. In this assay, 2.5 μM hcGAS was incubated with 0.2 mg/ml salmon sperm DNA. WT hcGAS and negative control without DNA are colored in green and blue. Mutations that abolish nucleosome binding are colored red. The negative control mutation K394E is colored orange.
d. IFN-β luciferase reporter assays show that mutations of hcGAS affect signaling in HEK 293T cells. Luciferase reporter signals from the cells transfected with 0.025 ng cGAS and 0.4 ng STING are indicated by the orange bars, from cells transfected with 0.00625 ng cGAS and 0.4 ng STING by the cyan bars, from cells transfected with 0.025 ng cGAS, 0.4 ng STING, or the vector control by the green, brown and purple bars, respectively. The data (mean ± SEM) are representative of three independent experiments. Each dot represents a biological replicate (n = 3). The p values were calculated by two-tailed Student’s t test: * p < 0.05, ** p < 0.01, *** p < 0.001, NS-not significant.
e. Western blot shows that WT mouse cGAS and its mutants have similar expression level in the transfected HEK 293T cells.
f. Western blot shows WT human cGAS and its mutants have similar expression level in the transfected HEK 293T cells.
Extended Data Table 1.
Cryo-EM data collection, refinement and validation statistics
| mcGAS/nucleosomex (reconstituted. 1:1) (EMDB-22046) (PDB 6X59) |
mcGAS/nucleosome (reconstituted, 2:1) (EMDB-22206) (PDB 6XJD) |
mcGAS/nucleosome (HEK 293T, 1:1) (EMDB-22047) (PDB 6X5A) |
|
|---|---|---|---|
| Data collection and processing | |||
| Magnification | 130,000 | 130,000 | 130,000 |
| Voltage (kV) | 300 | 300 | 300 |
| Electron exposure (e–/Å2) | 42 | 42 | 42 |
| Defocus range (μm) | −1.8 ~ −0.7 | −1.8 ~ −0.7 | −2.0 ~ −0.8 |
| Pixel size (Å) | 1.07 | 1.07 | 1.07 |
| Symmetry imposed | C1 | C1 | C1 |
| Initial particle images (no.) | 2,202,680 | 2,202,680 | 578,302 |
| Final particle images (no.) | 165,092 | 9,454 | 23,463 |
| Map resolution (Å) | 2.96 | 6.79 | 4.36 |
| FSC threshold 0.143 | |||
| Map resolution range (\) | 6.0 ~ 2.8 | 10.7 ~ 4.1 | 9.1 ~ 3.9 |
| Refinement | |||
| Initial model used (PDB code) | 3AFA 4K8V | 3AFA 4K8V | 3AFA 4K8V |
| Model resolution (Å) | 3.00 | 7.16 | 4.54 |
| FSC threshold 0.5 | |||
| Model resolution range (Å) | 32.5 ~ 2.8 | 39.8 ~ 6.8 | 35.3 ~ 4.4 |
| Map sharpening B factor (Å2) | −15 | −48 | N/A |
| Model composition | |||
| Non-hydrogen atoms | 14,963 | 17,957 | 14,963 |
| Protein residues | 1,123 | 1,485 | 1,123 |
| Nucleotide | 290 | 290 | 290 |
| Ligands | 1 | 2 | 1 |
| B factors (Å2) | |||
| Protein | 83.69 | 104.67 | 405.53 |
| Nucleotide | 74.19 | 74.19 | 278.45 |
| Ligand | 194.81 | 194.81 | 997.41 |
| R.m.s. deviations | |||
| Bond lengths (Å) | 0.006 | 0.008 | 0.007 |
| Bond angles (°) | 0.834 | 1.533 | 0.887 |
| Validation | |||
| MolProbity score | 2.64 | 2.73 | 2.23 |
| Clashscore | 10.75 | 10.82 | 13.71 |
| Poor rotamers (%) | 7.57 | 8.16 | 1.66 |
| Ramachandran plot | |||
| Favored (%) | 93.67 | 91.95 | 93.67 |
| Allowed (%) | 6.15 | 8.05 | 6.15 |
| Disallowed (%) | 0.18 | 0 | 0.18 |
Supplementary Material
Acknowledgements
We acknowledge University of Texas, McGovern Medical School in Houston for providing the access of their cryo-EM facility for data collection. We thank V. Mallmapalli, G. Fan and I. Serysheva for assistance of cryo-EM data collection. We thank Zhicheng Cui in Texas A&M University for assistance of cryo-EM data processing. This research was supported in part by the Welch Foundation (Grants A-1931-20170325 to P.L. and A-1715 to W.R.L.) and National Institute of Health (Grants R01 AI145287 to P.L., R01 GM121584 and R01 GM127575 to W.R.L.). A.P.W. and Y.L. were supported by NIH grant R01 HL148153 and award W81XWH-17-1-0052 through the Office of the Assistant Secretary of Defense for Health Affairs, Peer Reviewed Medical Research Programs.
Footnotes
Competing interests
The authors declare no competing interests.
Data availability
The three-dimensional cryo-EM density maps are deposited into the Electron Microscopy Data Bank (https://www.ebi.ac.uk/pdbe/emdb/) under accession numbers EMD-22046, EMD-22206, and EMD-22047. The coordinates were deposited in the Protein Data Bank (https://www.rcsb.org/) with accession numbers 6X59, 6XJD, and 6X5A.
References
- 1.Wu J & Chen ZJ Innate immune sensing and signaling of cytosolic nucleic acids. Annu Rev Immunol 32, 461–488, doi: 10.1146/annurev-immunol-032713-120156 (2014). [DOI] [PubMed] [Google Scholar]
- 2.Hopfner KP & Hornung V Molecular mechanisms and cellular functions of cGAS-STING signalling. Nat Rev Mol Cell Biol, doi: 10.1038/s41580-020-0244-x (2020). [DOI] [PubMed] [Google Scholar]
- 3.Roers A, Hiller B & Hornung V Recognition of Endogenous Nucleic Acids by the Innate Immune System. Immunity 44, 739–754, doi: 10.1016/j.immuni.2016.04.002 (2016). [DOI] [PubMed] [Google Scholar]
- 4.Kato H, Takahasi K & Fujita T RIG-I-like receptors: cytoplasmic sensors for non-self RNA. Immunol Rev 243, 91–98, doi: 10.1111/j.1600-065X.2011.01052.x (2011). [DOI] [PubMed] [Google Scholar]
- 5.Paludan SR & Bowie AG Immune sensing of DNA. Immunity 38, 870–880, doi: 10.1016/j.immuni.2013.05.004 (2013). [DOI] [PMC free article] [PubMed] [Google Scholar]
- 6.Ablasser A & Chen ZJ cGAS in action: Expanding roles in immunity and inflammation. Science 363, doi: 10.1126/science.aat8657 (2019). [DOI] [PubMed] [Google Scholar]
- 7.Burdette DL & Vance RE STING and the innate immune response to nucleic acids in the cytosol. Nat Immunol 14, 19–26, doi: 10.1038/ni.2491 (2013). [DOI] [PubMed] [Google Scholar]
- 8.Barber GN Innate immune DNA sensing pathways: STING, AIMII and the regulation of interferon production and inflammatory responses. Curr Opin Immunol 23, 10–20, doi: 10.1016/j.coi.2010.12.015 (2011). [DOI] [PMC free article] [PubMed] [Google Scholar]
- 9.Ablasser A et al. cGAS produces a 2’−5’-linked cyclic dinucleotide second messenger that activates STING. Nature 498, 380–384, doi: 10.1038/nature12306 (2013). [DOI] [PMC free article] [PubMed] [Google Scholar]
- 10.Gao P et al. Cyclic [G(2’,5’)pA(3’,5’)p] is the metazoan second messenger produced by DNA-activated cyclic GMP-AMP synthase. Cell 153, 1094–1107, doi: 10.1016/j.cell.2013.04.046 (2013). [DOI] [PMC free article] [PubMed] [Google Scholar]
- 11.Zhao B et al. A conserved PLPLRT/SD motif of STING mediates the recruitment and activation of TBK1. Nature 569, 718–722, doi: 10.1038/s41586-019-1228-x (2019). [DOI] [PMC free article] [PubMed] [Google Scholar]
- 12.Stetson DB & Medzhitov R Recognition of cytosolic DNA activates an IRF3-dependent innate immune response. Immunity 24, 93–103, doi: 10.1016/j.immuni.2005.12.003 (2006). [DOI] [PubMed] [Google Scholar]
- 13.Sun L, Wu J, Du F, Chen X & Chen ZJ Cyclic GMP-AMP synthase is a cytosolic DNA sensor that activates the type I interferon pathway. Science 339, 786–791, doi: 10.1126/science.1232458 (2013). [DOI] [PMC free article] [PubMed] [Google Scholar]
- 14.Volkman HE, Cambier S, Gray EE & Stetson DB Tight nuclear tethering of cGAS is essential for preventing autoreactivity. Elife 8, doi: 10.7554/eLife.47491 (2019). [DOI] [PMC free article] [PubMed] [Google Scholar]
- 15.Zierhut C et al. The Cytoplasmic DNA Sensor cGAS Promotes Mitotic Cell Death. Cell 178, 302–315 e323, doi: 10.1016/j.cell.2019.05.035 (2019). [DOI] [PMC free article] [PubMed] [Google Scholar]
- 16.Jiang H et al. Chromatin-bound cGAS is an inhibitor of DNA repair and hence accelerates genome destabilization and cell death. EMBO J 38, e102718, doi: 10.15252/embj.2019102718 (2019). [DOI] [PMC free article] [PubMed] [Google Scholar]
- 17.Gentili M et al. The N-Terminal Domain of cGAS Determines Preferential Association with Centromeric DNA and Innate Immune Activation in the Nucleus. Cell Rep 26, 2377–2393 e2313, doi: 10.1016/j.celrep.2019.01.105 (2019). [DOI] [PMC free article] [PubMed] [Google Scholar]
- 18.Liu H et al. Nuclear cGAS suppresses DNA repair and promotes tumorigenesis. Nature 563, 131–136, doi: 10.1038/s41586-018-0629-6 (2018). [DOI] [PubMed] [Google Scholar]
- 19.Li X et al. Cyclic GMP-AMP Synthase Is Activated by Double-Stranded DNA-Induced Oligomerization. Immunity 39, 1019–1031, doi: 10.1016/j.immuni.2013.10.019 (2013). [DOI] [PMC free article] [PubMed] [Google Scholar]
- 20.Wang WW, Zeng Y, Wu B, Deiters A & Liu WR A Chemical Biology Approach to Reveal Sirt6-targeted Histone H3 Sites in Nucleosomes. ACS Chem Biol 11, 1973–1981, doi: 10.1021/acschembio.6b00243 (2016). [DOI] [PMC free article] [PubMed] [Google Scholar]
- 21.Tachiwana H et al. Structural basis of instability of the nucleosome containing a testis-specific histone variant, human H3T. Proc Natl Acad Sci U S A 107, 10454–10459, doi: 10.1073/pnas.1003064107 (2010). [DOI] [PMC free article] [PubMed] [Google Scholar]
- 22.Liebschner D et al. Macromolecular structure determination using X-rays, neutrons and electrons: recent developments in Phenix. Acta Crystallogr D Struct Biol 75, 861–877, doi: 10.1107/S2059798319011471 (2019). [DOI] [PMC free article] [PubMed] [Google Scholar]
- 23.Emsley P, Lohkamp B, Scott WG & Cowtan K Features and development of Coot. Acta Crystallogr D Biol Crystallogr 66, 486–501, doi: 10.1107/S0907444910007493 (2010). [DOI] [PMC free article] [PubMed] [Google Scholar]
Associated Data
This section collects any data citations, data availability statements, or supplementary materials included in this article.


