

Abstract
Hematopoietic stem and progenitor cells (HSPC) can differentiate into all hematopoietic lineages to support hematopoiesis. Cells from the myeloid and lymphoid lineages fulfill distinct functions with specific shapes and intra‐cellular architectures. The role of cytokines in the regulation of HSPC differentiation has been intensively studied but our understanding of the potential contribution of inner cell architecture is relatively poor. Here, we show that large invaginations are generated by microtubule constraints on the swelling nucleus of human HSPC during early commitment toward the myeloid lineage. These invaginations are associated with a local reduction of lamin B density, local loss of heterochromatin H3K9me3 and H3K27me3 marks, and changes in expression of specific hematopoietic genes. This establishes the role of microtubules in defining the unique lobulated nuclear shape observed in myeloid progenitor cells and suggests that this shape is important to establish the gene expression profile specific to this hematopoietic lineage. It opens new perspectives on the implications of microtubule‐generated forces, in the early commitment to the myeloid lineage.
Keywords: chromatin remodeling, differentiation, microtubule, nucleus deformation, stem cells
Subject Categories: Cell Adhesion, Polarity & Cytoskeleton; Chromatin, Epigenetics, Genomics & Functional Genomics; Development & Differentiation
Microtubules modulate heterochromatin distribution and gene expression via induction of nuclear invaginations during myeloid progenitor differentiation from hematopoietic stem/progenitor cells.

Introduction
Hematopoietic stem and progenitors cells (HSPC) sustain hematopoietic lineages homeostasis throughout life (Orkin & Zon, 2008). A cell's engagement toward specific differentiation pathways is the outcome of the interplay of numerous cytokines (Notta et al, 2016; Velten et al, 2017) as well as physical cues associated with its interactions with the extra‐cellular matrix and with stromal cells in the bone marrow (Crane et al, 2017; Pinho & Frenette, 2019). Whether and how the transduction of these signals is mediated by specific intra‐cellular reorganization of cytoskeleton networks and organelle morphologies is not yet known; although these parameters have well‐established roles in the regulation of other lineages (Uhler & Shivashankar, 2017).
For example, the fate of mesenchymal stem cells strongly depends on the architecture of the acto‐myosin network (McBeath et al, 2004; Kilian et al, 2010). Substrate stiffness and adhesiveness promote the formation of large focal adhesions and cytoplasmic acto‐myosin bundles, the contraction of which deforms the nucleus (Khatau et al, 2009; Buxboim et al, 2014), induces chromatin remodeling (Versaevel et al, 2012; Makhija et al, 2015) and the shuttling of transcription factors (Miralles et al, 2003; Dupont et al, 2011) that further impact gene expression and cell identity (Gupta et al, 2012; Jain et al, 2013; Alam et al, 2016; Tajik et al, 2016; Närvä et al, 2017). However, similar mechanisms are unlikely to impact the fate of HSPC because these cells are poorly adhesive and thus are unable to assemble focal adhesion and contractile bundles. Other contractile actin networks, such as cytoplasmic filaments in mouse oocytes, have been shown to modulate nucleus shape and gene expression (Almonacid et al, 2019). The contraction of the cortical actin network can modulate cell shape and the symmetry of HSPC division (Shin et al, 2013a, 2014) but has not been shown to deform cell nucleus as in the case of mesenchymal stem cells. However, differentiated blood cells can display highly deformed nuclei, notably neutrophils (Bainton et al, 1971; Hoffmann et al, 2007; Carvalho et al, 2015). It is not known whether such deformations are instrumental in the regulation of the differentiation process, when they are initiated during cell differentiation, or what is mechanism that drives them.
To tackle these questions and better understand the early structural rearrangements of HSPC, we investigated the architecture of primary human HSPC as they commit either to the lymphoid or the myeloid lineages.
Results
We investigated the nucleus shape at various early stages of human HSPC differentiation, namely stem cells, myeloid progenitors, and lymphoid progenitors. We used human neonatal cord blood‐isolated and FACS‐purified cell populations. The surface‐marker signature of stem cells was considered to be CD34+/CD38−, whereas differentiated progenitors were CD34+/CD38+. Progenitors engaged in myeloid and lymphoid pathways were considered to be, respectively, CD33+ and CD19+ (Notta et al, 2016) (Fig 1A). Simple morphometric analysis revealed that nuclei displayed distinct and specific sizes and shapes at each stage of early hematopoietic differentiation. To measure this, sorted cells were fixed, immunostained, and imaged with highly resolved confocal microscopy. A quantitative analysis of nucleus volume and surface curvature was performed using 3D reconstructions (see Materials and Methods) (Fig 1B and C). In particular, the ratio of concave surface areas on the total surface was calculated as a proxy for the degree of invagination of the nucleus. Stem cells displayed rather small and round nuclei, characterized by two populations with volumes around 120 and 190 μm3 and a low mean invagination ratio of 8% for both. The nuclei of lymphoid progenitors were also small (120 μm3 on average) and spherical with a mean invagination ratio similar to those of HSPC (Fig 1B and C). By contrast, the nuclei of myeloid progenitors were approximately twice the size (250 μm3 on average). In addition, they displayed large deformed areas and invaginations. Accordingly, their invagination ratio of 15% was almost twofold greater than for stem cells or lymphoid progenitors (Fig 1B and C). This suggested that nucleus deformation is involved in the regulation of the myeloid differentiation process.
Figure 1. Nucleus morphologies of stem cells and progenitors.

- Left panel: experimental strategy. Hematopoietic stem cells (HSPC) and progenitors were characterized and isolated using specific sets of surface markers. All cells express CD34. Upon differentiation, progenitors start to express CD38 in contrast to HSPC (blue). Progenitors engaged in the myeloid (magenta) and lymphoid (green) pathways express, respectively, CD33 and CD19 markers. Right panel: FACS gating strategy to isolate HSPC (further referred as CD38− (blue box), and cells engaged in myeloid and lymphoid differentiation pathways (referred to as CD33+ [magenta box] and CD19+ [green box], respectively).
- For each population, equatorial Z stacks of two representative nuclei are shown in the left panel (chromatin is shown in blue (DAPI staining) and nuclear envelop in white (Sun2 staining). Scale bar: 5 μm. The corresponding 3D reconstructions are presented in the right panel. Convex and non‐convex surfaces are shown in blue and yellow, respectively.
- Nucleus‐invagination ratio is defined as the ratio of the non‐convex area over the total nucleus surface area. Nuclei are larger and deformed in CD33+ (magenta, n = 106) than CD38− and CD19+ cells (blue [n = 120] and green [n = 115], respectively; 3 independent experiments; Bars correspond to mean ± SD; ****P < 0.0001, Mann–Whitney test; n.s: non‐significant).
We then investigated differences in the intra‐nuclear and cytoplasmic cytoskeleton networks between early myeloid progenitors and stem cells that could be responsible for the observed deformations. The content of lamin A/C over lamin B was higher in myeloid progenitors than in HSPC (Fig EV1A and B) arguing against a global softening of the nuclear membrane as the cells started to differentiate (Swift et al, 2013; Makhija et al, 2015). In both cell types, actin was mainly present at the cell cortex (Fig 2A) but was not found on the nucleus surface. By contrast, microtubules were closely associated with the nucleus (Fig 2A and B). In myeloid progenitors, numerous microtubules appeared to form bundles within nuclear invaginations (Fig 2A and B). Microtubules were also present in the few narrow rifts that were visible in lymphoid cells (Fig EV1C). In the large nuclear fold of myeloid cells, all microtubules were still tyrosinated suggesting that they had not been not specifically stabilized by post‐translational modifications (Fig EV1D). Microtubules were found to converge at one of the larger invaginations, where the centrosome (the main microtubule organizing center) was located (Fig 2B). This could be quantified by measuring the relative position of the centrosome to the nucleus center and the cell periphery (Fig 2C). In contrast to HSPC where the centrosome was located close to cell periphery, in myeloid progenitors, the centrosome was buried deep in nuclear invagination, suggesting an active role of the centrosome‐microtubule network in the deformation of the nucleus.
Figure EV1. CD33+ nucleus undergoes plastic deformations.

- Lamin composition of stem vs progenitor cells. Chromatin, lamin A/C and lamin B immunostaining in representative HSPC (CD38−, blue) versus progenitors (CD38+, black). Inverted images of the equatorial Z stack are presented. Scale bar: 5 μm.
- The lamin A/C / lamin B ratio is significantly higher in CD38+ (n = 191) than CD38− cells (n = 169; ***P < 0.001 Mann Whitney test), indicative of a nuclear envelope stiffening upon differentiation. Bars correspond to mean ± SD.
- Microtubules are associated with CD33+ nuclear invaginations and CD19+ nuclear rifts. Z stacks of representative cells are shown. Microtubules are shown in green and chromatin in blue. Scale bar 5 μm.
- For each population (CD38−, CD33+ and CD19+ cells), inverted images Z stacks of a representative cell are shown. YL1/2 (tyrosinated alpha‐tubulin) and DM1A (total alpha‐tubulin) immunostainings are presented in the upper and lower panels respectively, both antibodies did exhibit identical patterns. Scale bar 5 μm.
- Gallery of selected Z stacks of representative CD33+ cells treated for 3 h with 5 μM nocodazole. Nucleus envelope (Sun2 immuno‐staining) is shown in magenta, chromatin in blue, and centrosome in white. The tubulin signal in green has been enhanced to show the lack of polymerized microtubules. Scale bar 5 μm.
Figure 2. Cytoskeletal organization of stem cells and myeloid progenitors.

- For each population (CD38− and CD33+ cells), Z stacks of two representative cells are shown in the left panel. Microtubules are shown in green, actin in magenta, centrosome in white and chromatin in blue. In the middle panel, inverted image the corresponding actin staining is shown. In the left panel, the corresponding 3D projection of microtubules is presented as inverted image. Scale bar 5 μm.
- Microtubules are tightly associated with the nucleus. Z stacks of representative CD38− and CD33+ cells are shown. Microtubules are shown in green, nucleus envelope (Sun2 immunostaining) in magenta and chromatin in blue. Scale bar 5 μm.
- As schematized, centrosome‐to-nucleus center distance (d) over nucleus center‐to-nucleus convex envelope (R) ratio is calculated to extract relative position of the centrosome to the center. This parameter is significantly lower in myeloid progenitors (n = 129) than in HSPC (n = 200; 3 independent experiments; ****P < 0.0001. Mann–Whitney test) indicating that centrosome becomes internalized within an invaginated region upon differentiation.
- p150 glued associates with the nuclear membrane of HSPC (CD38−) and myeloid progenitors (CD33+) cells. Z stacks of representative cells are shown. Image contrast has been inverted. Stainings show DAPI, Sun2, and p150 glued . Scale bar 5 μm.
- The dynein adaptor BicD2 associates with the nuclear membrane of HSPC (CD38−) and myeloid progenitors (CD33+) cells. Z stacks of representative cells are shown. Image contrast has been inverted. Stainings show DAPI and BicD2. Scale bar 5 μm.
The shapes of these nuclear deformations were suggestive of the action of pulling forces applied by molecular motors on the nuclear membrane along microtubules (Beaudouin et al, 2002; Splinter et al, 2010). We thus looked at dynein adaptors since this motor is instrumental in anchoring microtubules at the nuclear envelope (Splinter et al, 2010; Bolhy et al, 2011). Both p150Glued—a Dynactin subunit—and BicD2 were found to be enriched at the nucleus surface of HSPC (Fig 2D and E), indicating that dyneins were likely involved in the production of forces responsible for nucleus deformation during HSPC differentiation.
Microtubule disassembly seemed like a straightforward way to challenge the role of microtubules in nuclear deformation. However, a 3‐h‐long incubation with nocodazole, which fully depolymerized microtubules, did not resolve the nucleus deformations (Fig EV1E). This indicated that nuclei of myeloid progenitors had undergone plastic deformations that were introduced earlier in the course of differentiation. Therefore, to further test the role of microtubules, it was necessary to act upstream of the invagination process to prevent it. We first determined the exact time window during which nucleus was reshaped as cells progressed through differentiation. To achieve this, isolated HSPC were grown in culture medium supplemented with SCF, G‐CSF and IL3 to promote their differentiation into myeloid progenitors (Donaldson et al, 2001; Faivre et al, 2016) and fixed at various time points (Fig 3A). After 48 h of culture, nuclei had enlarged and displayed significant deformation, exhibiting kidney‐like shapes with shallow invaginations tightly associated with centrosomes and microtubules (Fig 3B). After 72 h of culture, nuclei were substantially deformed with deep invaginations containing microtubule bundles (Fig 3B). The nucleus volume and the invagination ratio at that stage were similar to those measured in myeloid progenitors freshly isolated from cord blood (Fig 3C). Therefore, the differentiation of HSPC for 3 days in culture was sufficient to recapitulate the nucleus expansion and deformation characteristics of primary myeloid progenitors.
Figure 3. Microtubules reshape the nucleus during HSPC differentiation in vitro .

- Experimental set‐up: isolated CD38− cells are cultured and differentiated upon addition of IL3, SCF, and G‐CSF cytokines. Cells are collected and analyzed at 24, 48, and 72 h after cytokine addition.
- The nucleus is progressively deformed over time in culture. For each time point, equatorial Z stacks of two representative cells are presented. Left panel: inverted image of chromatin (DAPI). Right panel: microtubules are shown in green and chromatin in blue. Scale bar: 5 μm.
- Nucleus volume (left panel) and invagination ratio (right panel) increase to attain levels similar to those of freshly isolated CD33+ cells (24 h, n = 165, 4 donors; 48 h, n = 143, 3 donors; and 72 h, n = 192, 4 donors; CD33+, n = 227, 5 donors; Bars correspond to mean ± SD; n.s: non‐significant; ***P < 0.001, ****P < 0.0001; Mann–Whitney test).
- For each condition (CTL, untreated cells; +Bleb, blebbistatin‐treated cells; +Bleb+NZ, blebbistatin and nocodazole‐treated cells; +TX, taxol‐treated cells; and +CilioD, ciliobrevin‐D-treated cells) Z stacks of 2 representative cells are displayed. Microtubules are shown in green, chromatin in blue, centrosome in white, and actin in magenta. Asterisks indicate regions where microtubules are not in contact with the nucleus. Scale bar 5 μm.
- 3D reconstructions of DAPI staining of 2 representative cells in each condition. Convex and non‐convex surfaces are shown in blue and yellow, respectively.
- Quantifications of nuclear volume (left panel) and invagination ratio (right panel) in the indicated conditions. Non‐treated cells at 48 h (n = 137, 3 donors) and 72 h (n = 143, 3 donors); and blebbistatin‐treated cells (n = 96/3 donors), blebbistatin and nocodazole‐treated cells (n = 66, 2 donors), taxol‐treated cells (n = 122, 3 donors), and ciliobrevin‐D-treated cells (n = 128, 3 donors). Bars correspond to mean ± SD; ****P < 0.0001. **P < 0.01, n.s: non‐significant; Mann–Whitney test.
Given the most substantial nucleus deformations of HSPC occurred between 48 and 72 h in culture, this was selected as the appropriate time window to interfere with microtubule network organization. As in many other cell models, microtubule depolymerization induced the contraction of the actin cortex (Kolodney & Elson, 1995; Paluch et al, 2005). This side effect, which could indirectly impact nucleus shape (Fig EV1E), was compensated by the addition of blebbistatin, an inhibitor of cell contractility, to nocodazole. Hence, in the absence of microtubules, the nucleus of differentiating HSPC expanded but did not deform (Fig 3D–F). A control experiment showed that blebbistatin alone was not sufficient to prevent nucleus deformation (Fig 3D–F). The active role of microtubules was further investigated by stabilizing them with taxol or by inhibiting dyneins with ciliobrevin, an inhibitor of dynein ATPase (Firestone et al, 2012) (Fig 3D). Taxol‐treated microtubules formed a dense array along the cell cortex, which was no longer in contact with the nucleus (see nucleus‐microtubule detachment annotated with yellow asterisks in Fig 3D). Similarly, in Ciliobrevin‐treated cells, microtubules were poorly interacting with the nuclear envelope (Fig 3D). In both conditions, nuclear expansion still occurred but nuclear deformations were completely impaired (Fig 3F). Taken together, these experiments demonstrated that microtubules and dyneins were responsible for nucleus invaginations during HSPC differentiation into myeloid progenitors.
Microtubule‐based forces were counteracted by the stiffness of the nucleus, which is determined by the organization of chromatin and the network of lamin filaments that covers the nucleus inner membrane (Schreiner et al, 2015; Stephens et al, 2017). To further investigate the adaptation of nucleus architecture to microtubule‐based forces, we assessed the distribution of lamin A/C and lamin B along the nuclear envelopes of HSPC, lymphoid, and myeloid progenitors. Lamin A/C exhibited an homogeneous distribution along the nuclear membranes of all cell populations, including in the nuclear invaginations found in myeloid progenitors (Fig 4A–C) (see Fig EV2 for the description of the quantification of signal heterogeneity along the nuclear contour). By contrast, the distributions of lamin B were different in the three populations (Fig 4D). Lamin B density was homogeneous along the nuclear membrane of HSPC (Fig 4E). However, in myeloid progenitors, lamin B density was strikingly reduced in the invaginated areas compared to the convex ones (Fig 4F). In lymphoid progenitors, in which narrow rifts rather than large invaginations were observed (Fig 1B), the intensity of lamin B was also slightly decreased at the extremity of the rift (Fig 4G). These results show that nuclear deformations were associated with the specific loss of lamin B, whereas lamin A/C remained intact.
Figure 4. Lamin B is removed from nuclear invaginations in myeloid progenitors.

-
ASpatial distribution of lamin A/C in the nuclei of HSPC (CD38−), myeloid progenitors (CD33+), and lymphoid progenitors (CD19+). Inverted images of equatorial Z plane of DAPI and lamin A/C are shown. Scale bar: 5 μm.
-
BLine scans of lamin A/C signal along nucleus contour of representative cells are presented for each cell population. The corresponding variations in lamin A/C intensity and nucleus curvature are plotted in blue and in red, respectively. Negative curvature values correspond to local nuclear invaginations. Red asterisk underlines local nucleus invaginations.
-
CDispersion of A/C signal along the nucleus periphery is similarly low in CD38− (n = 17, 3 donors), CD33+ (n = 61, 3 donors), and CD19+ (n = 11, 3 donors) indicative of an homogenous distribution of the protein along the nuclear membrane (Bars correspond to mean ± SD; n.s: non‐significant; Mann–Whitney test).
-
DDispersion of lamin B signal along the nucleus periphery is similarly low in CD38− (n = 131, 3 donors) and CD19+ (n = 74, 3 donors) indicative of a homogenous distribution of the protein along the nuclear membrane. But is significantly increased in CD33+ (n = 146, 3 donors). Bars correspond to mean ± SD; ****P < 0.0001; Mann–Whitney test.
-
E–GSpatial distribution of lamin B and local measurements of lamin B intensity and curvature of nuclear membrane in CD38− (E), CD33+ (F), and CD19+ (G) cells. Inverted images of the equatorial Z plane of DAPI (left panel) and lamin B (right panel) of a representative nucleus are shown for each population. Scale bar: 5 μm. The variations in lamin B signal intensity and curvature are plotted in blue in red, respectively. Asterisks indicate local invaginations of the nuclear membrane. In the bottom graphs, positive and negative curvatures are shown in gray and red, respectively. The absence of curvature (curvature = 0) is highlighted as a dashed line. In CD33+ cells, negative curvature of the nuclear membrane is associated with low lamin B intensities.
Figure EV2. Illustration of the methods to quantify signal heterogeneity along the nuclear membrane applied to H3K9me3.
- For each cell, the equatorial Z stack of the raw DAPI image is used to extract the nucleus contour (middle row) and measure H3K9Me3 intensity (in arbitrary units [a.u]) along the nucleus contour (lower row).
- For each time point, inverted images of equatorial Z stacks of H3K9me3 (left panel) of two representative nuclei are presented. For each cell, local curvature of the nucleus envelope is plotted as a function of H3K9Me3 local intensity at the indicated time points (right panel). Positive and negative and curvatures are shown in grey and red, respectively. Null curvature is highlighted as a dashed line.
- Histograms show the values of H3K9me3 signal intensity along the nucleus contour of two cell representatives of high and low signal dispersion, respectively. The distribution of values can be segmented in quartiles. H3K9me3 signal‐intensity dispersion is measured as the quartile coefficient of dispersion (Q disp = (Q3‐Q1)/(Q3 + Q1), where Q1 and Q3 are the first and the third quartiles, respectively, of the H3K9me3 intensity distribution on the nucleus contour.
- The dispersion parameter is higher in CD33+ (n = 124, 3 donors) than in CD38− (n = 137, 3 donors) and CD19+ (n = 132/ 3 donors) cells (****P < 0.0001. Mann Whitney test) indicating that H3K9me3 is homogenously distributed at the nucleus periphery in CD38− and CD19+ cells, but is heterogeneous at the nucleus periphery in CD33+ cells. Bars correspond to mean ± SD.
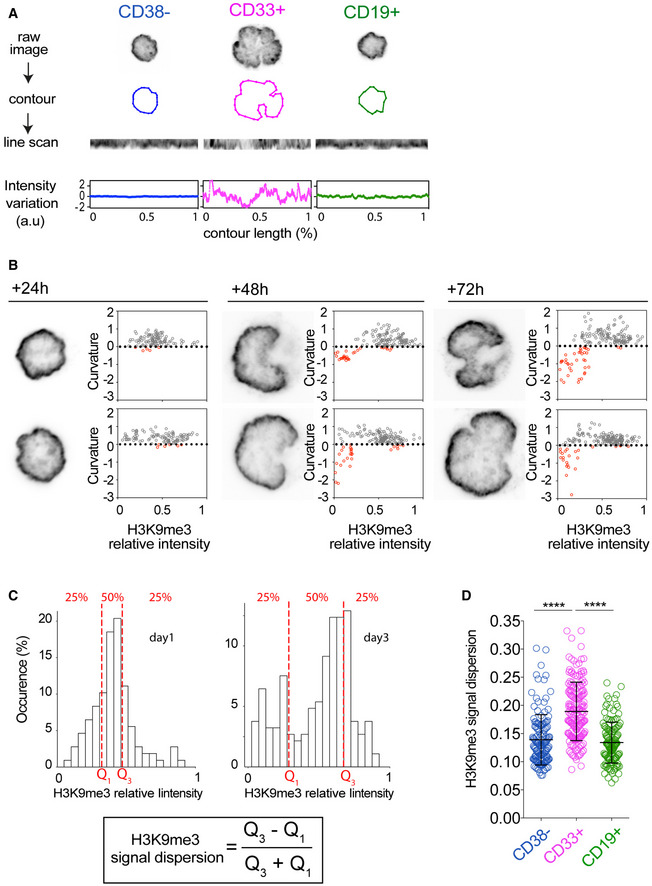
Interestingly, lamin B plays an important role in organizing chromatin in the nucleus primarily by anchoring heterochromatin territories at the nuclear membrane (van Steensel & Belmont, 2017), suggesting that the loss of lamin B in nuclear invagination in myeloid progenitors could be associated with local release of heterochromatin. To address this point, we first assessed the spatial distribution of histone H3 lysine 9 trimethylation (H3K9me3), as a marker of constitutive heterochromatin (Bannister et al, 2001; Becker et al, 2016). In freshly isolated HSPC, and in lymphoid progenitors, H3K9me3 was homogeneously distributed along the entire peripheral margin of the nucleus (Fig 5A), as previously described (Ugarte et al, 2015; Djeghloul et al, 2016). By contrast, in freshly isolated myeloid progenitors, H3K9me3 distribution was more heterogeneous: foci were detected in the nucleoplasm, and at the peripheral margin of the nucleus, the density of H3K9me3 foci was lower in the invaginated regions than the other (convex) regions (Fig 5A). Moreover, the difference of H3K9me3 distribution between the HSPC state and the myeloid progenitor state was also observed in the differentiation of HSPC into myeloid progenitors in culture (Fig 5B). As in the case of lamin B, the quantification of H3K9me3 distribution by linescan density measurements at the peripheral margin of the nucleus of cultured HSPC (Figs 5C and D, and EV2A) revealed a correlation between H3K9me3 density and curvature (Fig 5D). Hence, H3K9me3 density was lower with negative (inward) curvature, and this association was more acute after 3 days of HSPC differentiation toward myeloid lineage (Figs 5E and EV2B). This relationship was further supported by quantifying the dispersion of H3K9me3 signal intensity at the peripheral margin of the nucleus in cultured HSPC (Figs 5F and EV2C). The signal was generally homogeneous after 24 h in culture, but was more heterogeneous after 48 h, and attained a degree of dispersion after 72 h that was similar to that observed in freshly isolated myeloid progenitors (Fig 5F). In contrast to myeloid progenitors, a heterogeneous dispersion of H3K9me3 was not observed in lymphoid progenitors (Fig EV2D). These trends accurately followed the extent of nucleus deformation as the cells differentiated (Fig 3C).
Figure 5. HSPC differentiation is associated with microtubule‐dependent heterochromatin redistribution from the nucleus periphery.

- Spatial distribution of H3K9me3 in CD38−, CD33+, and CD19+cells. For each population, two representative nuclei are presented. Inverted images of equatorial Z plane of DAPI (left panel) and H3K9me3 (right panel) are shown. Scale bar: 5 μm.
- Spatial distribution of H3K9me3 at the indicated time points of differentiation of CD38− cells. For each population, two representative nuclei are presented. Inverted images of equatorial Z plane of DAPI (left panel) and H3K9me3 (right panel) are shown. Scale bar: 5 μm.
- For each cell, the raw DAPI image at the equatorial Z stack is used to extract the nucleus contour and measure H3K9Me3 intensity (in arbitrary units [a.u]) along the contour (lower row).
- H3K9me3 loss from the nucleus periphery occurs locally in nuclear invaginations. Line scans of H3K9me3 signal along nucleus contour of 2 representative cells are presented in the upper panel for each time point. Asterisks indicate the local loss of H3K9me3. The corresponding variations in H3K9Me3 intensity and curvature are plotted in blue in red, respectively. Negative curvature values correspond to local nuclear invaginations.
- Local curvature of the nucleus envelope as a function of H3K9Me3 local intensity at the indicated time points of differentiation. Positive and negative curvatures are shown in gray and red, respectively. The absence of curvature is highlighted as a dashed line. During differentiation, negatively curved domains increase in number and size and display low H3K9me3 intensities.
- H3K9me3 redistribution during differentiation. H3K9me3 signal dispersion at the nucleus periphery is low in CD38− (n = 137, 3 donors) indicating that H3K9me3 is homogenously distributed at the nucleus periphery. Upon differentiation, H3K9me3 signal dispersion remains homogenous after 24 h in culture (n = 115, 3 donors), but progressively becomes heterogeneous (48 h: n = 139, 3 donors) to attain a level at 72 h (n = 148, 3 donors) similar to that in freshly collected CD33+cells (n = 124, 3 donors), indicative of H3K9me3 redistribution from the nucleus periphery. Bars correspond to mean ± SD; ***P < 0.001; **P < 0.01; n.s: non‐significant; Mann–Whitney test.
- Microtubule perturbations impair H3K9me3 redistribution during HSPC differentiation. Microtubule‐modifying agents were added to culture medium between 48 and 72 h. Cells were fixed and analyzed after 72 h of culture. For each indicated treatment, one representative nucleus is presented. Inverted images of equatorial Z stacks of DAPI (left panel) and H3K9me3 (right panel) are shown. Scale bar: 5 μm.
- H3K9me3 signal dispersion significantly increases in non‐treated cells between 48 h (n = 139/3 donors) and 72 h (n = 148/3 donors) of culture. At 72 h, the dispersion is similar in non‐treated and blebbistatin‐treated cells (n = 124/ 3 donors). By contrast, H3K9me3 signal dispersion is significantly reduced compared with non‐treated cells after treatment with nocodazole and blebbistatin (n = 55, 2 donors), taxol (n = 109, 3 donors), and ciliobrevin‐D (n = 144, 3 donors) to a level attained by non‐treated cells at 48 h, demonstrating that microtubules affect H3K9me3 redistribution during HSPC differentiation. Bars correspond to mean ± SD; ****P < 0.0001; n.s: non‐significant; Mann–Whitney test.
We also analyzed the spatial distribution of H3K27me3, a marker of facultative heterochromatin that can induce gene expression changes during HSPC differentiation (Cui et al, 2009). In contrast with the peripheral distribution of H3K9me3, H3K27me3 was homogeneously distributed as foci throughout the whole nucleoplasm in freshly isolated HSPC and in lymphoid progenitors (Fig EV3A and B). However, it appeared enriched at the periphery of the nucleoplasm specifically in myeloid progenitors (Fig EV3A and B). As in the case of H3K9me3, the density of H3K27me3 was lower in the invaginated regions compared to the convex regions (Fig EV3C and D). All together, these results on the spatial distributions of H3K9me3 and H3K27me3 marks, indicate that facultative and constitutive heterochromatin were removed in the nuclear invaginations that appeared during HSPC differentiation into myeloid progenitors.
Figure EV3. Redistribution of facultative heterochromatin during HSPC differentiation.

- Spatial distribution of H3K27me3 in HSPC (CD38−), myeloid progenitors (CD33+) and lymphoid progenitors (CD19+) cells. For each population, a representative nucleus is presented. Inverted images of equatorial Z planes of DAPI (left panel) and H3K27me3 (right panel) are shown. Scale bar: 5 μm.
- Upper panel, for each nucleus, the equatorial Z stack of the raw DAPI image is used to extract the nucleus contour. The selected contour is then downscaled by 20% for four times to create five equidistant nuclear regions that are shown in red. Lower panel, Area normalized mean H3K27me3 intensity along Nucleus axis, from nucleus center (C) to the periphery(P) are shown. This parameter clearly shows an enrichment of H3K27me3 at nuclear periphery in the case of CD33+cells. Bars correspond to mean ± SD; ****P < 0.0001; Mann Whitney test.
- H3K27me3 loss from the nucleus periphery occurs locally in nuclear invaginations. Line scans of H3K27me3 signal along nucleus contour are presented in the upper panel. Asterisks indicate the local loss of H3K27me3. The corresponding variations in H3K27Me3 intensity and curvature are plotted in blue in red, respectively. Negative curvature values correspond to local nuclear invaginations
- Local curvature of the nucleus envelope as a function of H3K27Me3 local intensity in the indicated populations. Positive and negative curvatures are shown in grey and red, respectively. The absence of curvature is highlighted as a dashed line. In CD33+ cells, low H3K27Me3 intensities correspond to negative curvatures of the nuclear membrane, indicative of a loss of H3K27Me3in nuclear invaginations.
Importantly, the content and localization of heterochromatin can affect nuclear stiffness (Nava et al, 2020). Hence, the local loss of heterochromatin could initiate nuclear invagination. Alternatively, it could result from it. To distinguish these two possibilities, we prevented nuclear invagination, by interfering with microtubule‐nucleus interaction, and then monitoring H3K9me3 distribution along the nuclear membrane. The three treatments described above, blebbistatin/nocodazole, taxol, or ciliobrevin D, were applied between 48 and 72 h of culture, during which nuclei in differentiating HSPC undergo the invagination process. At 72 h, non‐treated cells and control cells treated with blebbistatin exhibited the expected heterogeneous H3K9me3 patterns associated with high signal dispersion values (Fig 5G and H). By contrast, cells treated with drugs against microtubules displayed minor invaginations of the nuclei (Figs 3F and 4G) and no significant increase of lamin B (Fig EV4A and B) or H3K9me3 signal dispersion (Fig 5H). These results showed that microtubule‐induced invaginations were required for the loss of lamin B and heterochromatin in these regions.
Figure EV4. Dynein‐dependent removal of lamin‐B in nuclear invaginations during HSPC differentiation in vitro .

- Lamin B distribution at 72 h of differentiation of CD38− cells upon no (CTL) or Ciliobrevin D (+Cilio D) treatment. Inverted images of the equatorial Z plane of DAPI (left panel) and Lamin B (right panel) are shown. Scale bar: 5 μm.
- Lamin B signal dispersion is significantly reduced in ciliobrevin‐treated cells (+Cilio D, n = 64, 3 donors) compared to control, non treated‐cells (CTL, n = 57, 3 donors). Bars indicate means and SD (***P < 0.001. Mann Whitney test).
We finally tested whether the heterochromatin remodeling that resulted from nuclear invagination could actually impact the process of myeloid differentiation. The investigation of the link between microtubule‐controlled nucleus deformation and heterochromatin redistribution and myeloid differentiation was complicated by the fact long‐term interference of microtubules could impair cell cycle progression. Therefore, in cultured HSPC (from three donors), microtubules were perturbed between 48 and 72 h of culture by the addition of the dynein inhibitor ciliobrevin D, and the effect on the transcriptome was assessed (Fig 6A and B, and Table EV1). In total, 123 genes were found to be significantly up‐ or down‐regulated with ciliobrevin D treatment (absolute log2 fold change higher than 1.8 and a false discovery rate lower than 0.05, as represented in Fig 6A). Among them, gene ontology analysis did not reveal genes involved in cell cycle progression (Fig EV5A) or apoptosis pathways, suggesting no deleterious secondary effect of the treatment used on differentiating cells. Strikingly, among the 38 genes that were significantly down‐regulated, eight had been previously defined as gene signatures of cells of myeloid lineages, notably erythroblasts, including CD14+ and CD66b+ lineages (BSG; CPVL; TLY96; QPCT; ZER1; SLC2A11: IL6R; IFIT3) (Watkins et al, 2009). Among the up‐regulated genes, two genes were erythroblast‐specific (EPB42, FKBP4), one gene was CD66b+ lineage‐specific (TM6SF) but none were associated with the CD14+ lineage. Importantly, six of the up‐regulated genes were associated with the megakaryocyte differentiation pathway (MED12L, CTDSPL, FUT8, ABCC4 FCER1A, and CPA3), which separates from the myeloid pathway in early stages of hematopoiesis (Fig 6 A and B) (Notta et al, 2016). Similar trends were observed in the expression of these genes upon treatment with taxol (Fig EV5B). These results show that, although microtubule perturbation was restricted to a small period within the HSPC differentiation process, it was sufficient to impair HSPC differentiation into myeloid progenitors.
Figure 6. Microtubules impact the transcriptome of myeloid differentiating cells.

- Microtubules perturbations impact the transcriptome of differentiating cells. Volcano plot representation of down‐regulated (blue) and up‐regulated genes (red) in non‐treated/control cells relative to ciliobrevin‐D-treated cells. Each circle represents the fold change (FC) of the quantity of mRNA and the significance of the change based on three independent replicates. Expressed genes with a false discovery rate (FDR) lower than 0.05 are shown in gray, whereas genes with a FDR greater than 0.05 are shown in blue or red. Genes significantly misregulated, i.e., with an absolute value of FC higher than 1.8 are shown as full disks. Names of genes of interest are indicated within the graph. Genes that are in the signature of the myeloid differentiation pathway are shown in magenta. Genes that are the signature of the megakaryocyte differentiation pathway are shown in green.
- Heatmap representation and hierarchical clustering of gene expression changes between non‐treated and ciliobrevin‐D-treated cells collected from 3 donors in each condition. The color code corresponds to a log2 scale of the differential expression levels.
Figure EV5. The stabilisation of microtubules impacts the transcriptome of myeloid differentiating cells.

- Same Volcano plot as in Fig 6A. Genes coding for cyclins are shown in red. Their position in the bottom and central part of the volcano (i.e. low fold change and low significance) suggested that the expressions of cyclins were not affected by the treatment with Ciliobrevin D.
- Volcano‐plot representation of down‐regulated and up‐regulated genes in non‐treated/control cells relative to Taxol treated cells. Each circle represents the fold change (FC) of the quantity of mRNA and the significance of the change based on three independent replicates. Names of genes that were revealed by the transcriptomic analysis in response to Ciliobrevin‐D are indicated. Genes that are in the signature of the myeloid differentiation pathway are shown in magenta. Genes that are the signature of the megakaryocyte differentiation pathway are shown in green. The myeloid genes that were downregulated in response to Ciliobrevin were also downregulated in response to Taxol. The megakaryocyte genes that were upregulated in response to Ciliobrevin were also upregulated in response to Taxol. Additional upregulated megakaryocyte genes are indicated with brackets.
In conclusion, our study shows that in contrast to the lymphoid differentiation pathway, HSPC commitment to the myeloid pathway involves the formation a large nuclear membrane invaginations and local reorganization of heterochromatin. During this process, microtubules act as a mechano‐regulator of stem cell identity. They form bundles that encircle the nucleus and resist chromatin expansion by attaching to the nuclear membrane via dyneins. This generates nuclear invaginations in which the densities of constitutive and facultative heterochromatin are reduced. These structural rearrangements can affect the expression of genes, some of which are involved in progenitor identity and function.
Discussion
The pioneering observations of Paul Ehrlich revealed the highly lobulated shapes of some mature blood cells (Ehrlich & Lazarus, 1900). In the case of neutrophils, nucleus lobulation has been proposed to be important for various functions including cell transmigration (Hoffmann et al, 2007; Kolaczkowska & Kubes, 2013). Based on princeps studies performed in vivo (Bainton et al, 1971), on established tissue culture cell lines (Olins & Olins, 2004; Zhu et al, 2017), and on basic histology (Junqueira & Carneiro, 2005), the deformation of the nucleus is considered to be a late differentiation process, appearing around the metamyelocyte stage, i.e., in late precursors of neutrophils. Our study establishes instead that large nuclear invaginations are hallmarks of an early stage in the differentiation of HSPC into myeloid progenitors and that the deformation of the nucleus in myeloid progenitors can affect the expression of genes involved in that differentiation process. This echoes similar observation in mesenchymal stem cells in which nucleus deformation has been related to the regulation of the differentiation process (Uhler & Shivashankar, 2017). Interestingly, some less striking but clear nuclear deformations consisting of narrow rifts were observed in lymphoid progenitors (Fig EV1D). Their different shape implied a distinct mechanism for controlling the morphology. Nevertheless, in both types of deformations, microtubules were buried deep in the invaginations.
The role of microtubules in HSPC nucleus deformation contrasts with previous observations in mesenchymal stem cells in which nucleus deformation was specifically controlled by the actin network (Uhler & Shivashankar, 2017). In HSPC, the actin network remained cortical and was not observed within the invaginations. Moreover, relaxation of the actin cortex had no impact on the deformation of nucleus in myeloid progenitors, whereas microtubule disassembly or disengagement prevented nucleus deformation. Finally, the localization of p150‐Glued and the cargo adaptor BicD2 in nuclear invaginations support the hypothesis that Dynein activity was required for the nucleus deformation process. Microtubules and Dyneins have already been shown to apply forces on the nucleus in other systems (Lele et al, 2018), where they regulate nucleus shape (Hampoelz et al, 2011; Schreiner et al, 2015; Tariq et al, 2017), position (Cadot et al, 2012; Szikora et al, 2013), heterochromatin localization (Ramdas & Shivashankar, 2015), and envelope breakdown (Beaudouin et al, 2002; Bolhy et al, 2011). Other molecular motors, such as kinesin 1, have been shown to be involved in the balance of forces between microtubules and the nucleus (Splinter et al, 2010; Wilson & Holzbaur, 2015). Such motors and some microtubule‐associated proteins could be instrumental to form microtubule bundles and eventually produce the mechanical forces responsible for nuclear membrane deformation. The players and the mechanism of force production still require further investigations.
A significant increase of nucleus volume was also associated with the process of nucleus deformation, in addition to microtubule‐based forces. This expansion of the nucleus is unlikely to be driven by a softening of the nuclear membrane because the lamin content suggests it becomes stiffer upon differentiation (Shin et al, 2013b). Nucleus expansion seemed also to be independent of microtubule‐based forces, because it was not prevented by microtubule disassembly (Fig 3F). The mechanism driving nucleus expansion in myeloid progenitors is yet unknown and deserves further investigation. It could depend on the regulation of nuclear osmolarity by specific ion channels (Finan et al, 2009) or be driven by chromatin decondensation and swelling due to histone modifications (Rao et al, 2007; Mazumder et al, 2008; Therizols et al, 2014). Peripheral invaginations would thus result from frustrated expansion against bundles of microtubules encircling the nucleus.
In addition to obstructing nucleus expansion, microtubules could be more directly involved in the regulation of chromatin rearrangements across the nuclear membrane. Mechanical forces can regulate chromatin organization (Miroshnikova et al, 2017), and microtubules can act specifically on chromatin across the nuclear membrane (King et al, 2008; Hampoelz et al, 2011), facilitating the pairing of homologous chromosomes (Christophorou et al, 2015), driving the positioning of chromosome territories, and clustering of telomeres or centromeres beneath the centrosome (King et al, 2008; Elkouby et al, 2016). Thus, microtubules could direct chromatin reorganization during nucleus expansion in myeloid progenitors. This is supported by our observation that lamin B as well as facultative and constitutive heterochromatin contents are reduced in invaginated regions of the nucleus where microtubules accumulate. Although we could not decipher the detailed roles of all players, the most parsimonious hypothesis is that microtubules can specifically release heterochromatin anchorage by forcing the detachment of lamin B.
Another hypothesis is that the regulation of heterochromatin anchoring to the nuclear periphery is independent of microtubules and sensitive to local curvature only. A weaker binding to invaginated regions would force the heterochromatin to flow away as the nucleus expands. Curvature also modulates the nuclear shuttling of transcription factors involved in stem cell fate regulation (Elosegui‐Artola et al, 2017). Hence, these hypotheses could explain how perturbation of microtubules could also directly and indirectly lead to the changes in the expression of genes involved in myeloid differentiation. Therefore, for the future, it will important to investigate the localization of those genes the expression of which has been modulated by nucleus deformation, and how that relates to the shape nucleus and heterochromatin distribution, in order to further understand the mechano‐regulation of HCS differentiation.
Materials and Methods
Cell culture
Blood cell harvesting and culture
All human umbilical cord blood samples collected from normal full‐term deliveries were obtained after mothers’ written and informed consent, following the Helsinki's Declaration and Health Authorities. Cord blood samples came from biological resource center, Saint‐Louis Hospital Cord Blood Bank (Paris, France) authorized by French Cord Blood Network (AC 2016‐2756, French Biomedical Agency, Paris, France).Mononuclear cells were collected using Ficoll separation medium (Eurobio, Courtaboeuf, France). CD34+ cells were further selected using Miltenyi Magnetically Activated Cell Sorting (MACS) columns (Miltenyi Biotech, Paris, France) according to the manufacturer's instructions. CD34+ cells were then either put in culture or frozen at −80°C in IMDM medium (Gibco) supplemented with 10% fetal bovine serum (FBS) and 10% DMSO (WAK Chemie Medical GmbH).
Flow cytometry, stem, and progenitor cells sorting
Freshly isolated CD34+ or thawed cells were allowed to recover overnight at 37°C in IMDM medium supplemented with 10% FBS and antibiotics (Antibiotic‐antimycotic, Sigma‐Aldrich). Cells were then labeled with fluorescent antibodies: CD45‐AF700 (Clone HI30 BioLegend), CD38−PerCp5.5 (Clone HB‐7 BioLegend), CD34‐APC (Clone 581 BD Bioscience), CD33‐PE (Clone WM‐53 BD Bioscience), and CD19‐FITC (Clone HIB19 BD Bioscience). Sorting was performed using FACS Aria II and DIVA software (BD Bioscience). Sub‐populations of stem (CD34+/CD38−), myeloid (CD38+/CD33+), and lymphoid (CD38+/CD19+) progenitors, or whole progenitors (CD34+/CD38+) for Fig EV1), were gated as shown in Fig 1B. Isolated cells were centrifuged and resuspended in the appropriate culture medium.
Cell culture and drug treatments
Cells were plated at a density of 40,000 cells/cm2 in 96‐well plates. Cells were cultured at 37°C in a 5% CO2 humidified atmosphere using IMDM culture medium supplemented with antibiotics (Anti‐anti, Sigma‐Aldrich), 10% FBS, human and SCF 100 ng/ml (PeproTech) G‐CSF 10 ng/ml (PeproTech) and IL‐3 20 ng/ml (Peprotech), adapted from (Donaldson et al, 2001; Faivre et al, 2016). For Figs 3, 4, 5, in addition to control non‐treated cells, cells were treated either with taxol (100 nM), blebbistatin (50 μM), nocodazole and blebbistatin (2 and 50 μM, respectively), or ciliobrevin (100 μM).
Immunofluorescence
Cells of interest were allowed to sediment on poly‐L‐lysine (Sigma‐Aldrich) coated cover slips for 15 min.
For cytoskeleton staining, cells were fixed for 10 min with 0.5% glutaraldehyde (Sigma‐Aldrich) and 0.1% Triton X‐100 (Sigma‐Aldrich) in Cytoskeleton Buffer (10 mM MES pH 6.1, 138 mM KCl, 3 mM MgCl2, 2 mM EGTA, 10% sucrose). Cells were permeabilized for 10 min in 0.1% Triton X‐100 in PBS and neutralized with NaBH4 in PBS. Microtubules, centrosomes, and microfilaments were labeled using YL1/2 rat antibody (Serotec) (1:500) or DM1A antibody (Sigma‐Aldrich) (1:1,000), rabbit anti‐pericentrin (Abcam) (1:2,000), and CY3‐phalloidin (1:100) (Sigma‐Aldrich), respectively.
For P150Glued and BicD2 straining, cells were incubated for 1 h in nocodazole (5 μM) prior to fixation, according to (Splinter et al, 2010). For BicD2, cells were fixed for 20 min with 3% paraformaldehyde (Electron Microscopy Sciences) in PBS solution, permeabilized with 0.1% Triton X‐100 and 1% BSA in PBS for 20 min and finally neutralized with NH4Cl in PBS. Anti‐BicD2—custom made and generously provided by A. Akhmanova (Matanis et al, 2002)—(1:250) was used. For P150Glued, cells were washed in a solution containing 1% paraformaldehyde (Electron Microscopy Sciences) and 0.01% glutaraldehyde (Sigma‐Aldrich); pre‐extracted for 90 s 0.5% Triton X‐100 (Sigma‐Aldrich) in Cytoskeleton Buffer then fixed for 20 min in 3% paraformaldehyde. P150Glued (BD Biosciences) (1:500) was used.
For nucleus and chromatin staining, cells were fixed for 20 min with 3% paraformaldehyde (Electron Microscopy Sciences) in PBS solution, permeabilized with 0.1% Triton X‐100 and 1% BSA in PBS for 20 min and finally neutralized with NH4Cl in PBS. Rabbit anti‐Sun2 (Sigma‐Aldrich; 1:1,000), rabbit anti‐H3K9me3 (Abcam; 1:500), monoclonal anti‐H3K27me3 (Cell Signalling; 1:1,000), goat anti‐lamin B (C‐20; Santa Cruz; 1:800), and monoclonal anti‐laminA/C (E‐1; Santa Cruz; 1:500) were used.
In all cases, chromatin was labeled using DAPI (Sigma‐Aldrich; 5 ng/ml) and samples were mounted using Mowiol solution (Sigma‐Aldrich).
Data acquisition and analysis
Confocal microscopy and 3D measurements
For quantifications, images were acquired using an LSM800 airy‐scan or an LSM 780 confocal microscope and ZEN software (Zeiss). The objective used was a 63× APO oil immersive: an 8× digital zoom was added. Each wavelength was acquired separately with a 350 nm z‐step width to achieve appropriate reconstruction resolution. The slice including the center of the nucleus was selected, and DAPI signal was thresholded using the Otsu method. The same threshold value was used for the entire stack. In order to prevent small‐scale curvature measurement, a Gaussian filter (radius value of 2) was applied and the images were thresholded again using the same method as described above. Obtained stacks were processed by ImageJ plug‐in 3D viewer to generate 3D models (represented as triangle mesh‐works) and were imported into MATLAB for further calculation. To reduce calculation time, the number of points composing the mesh was decreased and the surface smoothened (http://www.alecjacobson.com/weblog/?p=917, Alec Jacobson script; N_SmoothMesh script, Export Voxel Data, Cyprian Lewandowski, MATLAB file exchange). First, nucleus volume was determined by computing sum of the signed volume of each tetrahedron constituted by the center of mass of the nucleus and every triangles of the mesh. Second, to characterize the nucleus shape, the curvature of the 3D model was measured. Considering a point on a given surface, the intersections between the normal planes and the point generates an ensemble of curves defined by their curvature. Principal curvatures sign, which are the maximum and the minimum curvature values of the aforementioned curves, can be used to classify locally the surface as concave, convex, or horse‐saddle shaped. This method can be applied to a triangles meshwork by a quadratic approximation of the vertices to a continuous surface (patchcurvature script, Dirk‐Jan Kroon, MATLAB file exchange). The area of concave and horse‐saddle shaped triangles was thus summed to quantitatively assess the deformed area (represented by yellow patches in Figs 1B and C, and 3E). This value was normalized to the entire nuclear area in order to obtain the invagination ratio. To measure the penetration of the centrosome into the nucleus, centrosome position had to be located. First, the coordinates of the pericentrin signal were selected by hand in the 3 directions. At these coordinates, a point was added in a blank stack and a 3D model was generated following the same methodology as described above. Second, reconstruction of the nucleus was made as described previously but by computing the convex hull of the first thresholded stack image. This defined the minimal concave volume in which the nucleus was circumscribed. In addition, reference points were added at each corner of the first and last acquired planes to ensure correct alignment of the two models. The intersection point between the line going through the nucleus and the centrosome centers and the convex hull was computed (TriangleRayIntersection script, Jaroslaw Tuszynski, MATLAB file exchange), and then, the distance between this point and the nucleus center was used to normalize the distance between the nucleus and the centrosome centers. Images were generated with MATLAB (Mathworks). Data were plotted using Prism software (GraphPad Software, Inc).
Nuclear envelope image analysis
Images were acquired using an LSM 780 confocal microscope and ZEN software (Zeiss). The objective used was a 63× oil immersive (model): an 8× digital zoom was added. Single planar slices were manually selected, post‐acquisition, to maximize deformation in a 2D plane. The contour of the H3K9me3 signal was manually drawn on ImageJ in order to obtain precise intensity line scans of the nuclear border. This outline could not be used to obtain local curvature values because of the low sampling point number due to manual outlining. Instead, curvature values were obtained on thresholded DAPI signal. To avoid small‐scale curvature measurements, a Gaussian filter was applied (radius of 2) and images thresholded again. In case of strong curvature events inducing incorrect shape detection, shapes were corrected manually according to the original image. The polygon obtained was processed using ImageJ in order to obtain a spline fit, with 5 pixels distance between points, which was sufficient to resolve curvature changes. Signed curvature along the line was computed by calculating the second derivative of the curve at each point. Obtained datasets were plotted against each other by normalizing the length of each curve to one. Straight views of the line selection were obtained with ImageJ straighten function. To assess intensity variations of H3K9me3 signal between populations, the quartile coefficient of dispersion was used (see Fig EV2C). In Fig 4E, intensities were normalized to 1 in order to be able to compare intra‐cellular variations. All data are plotted with Prism software (GraphPad Software, Inc).
For equidistant distribution analysis, the equatorial Z stack of the raw DAPI image is used for each nucleus to extract the nucleus contour. The selected contour is then downscaled by 20% for four times to create five equidistant nuclear regions (see Fig EV3B) and to measure the mean H3K27me3 intensity (in arbitrary units [a.u]) from nucleus center to the nuclear periphery in an automatized way with a custom made ImageJ macro. The. Corresponding Macro is available on github.com/gokceagsu/EquidistantAnalysis.
Transcriptomic analysis
RNA quantification and quality control were performed using the HT RNA Pico sensitivity LabChip Kit and the Caliper LabChip Microfluidics System (Perkin Elmer). For each sample, 3 ng of total RNA was amplified, labeled, and fragmented using GeneChip WT Pico (Thermo Fisher Scientific). Each sample was hybridized onto Human Clariom D (Thermo Fisher Scientific), washed, and stained with the Affymetrix® Fluidics Station 450. Array scanning was performed with the Affymetrix® GeneChip Scanner 3000 7G using the Command Console software (Thermo Fisher Scientific) and then analyzed using the rma routine as implemented in the Oligo R library. Differential expression between condition was analyzed using the limma routine implemented in the limma R library (Smyth, 2004).
Statistical analysis
All statistical analyses, i.e., Mann–Whitney tests were performed with Prism software (GraphPad Software, inc).
Author contributions
SBi performed most experiments with the help of SBr. GA performed the experiments relative to nuclear lamina and H3K27me3. BV and LF contributed to design the culture set‐up. MD analyzed the transcriptomics data. LB, JL, LF, MT, and SBr supervised the project. JL and MT obtained funding for the project. MT and SBr conceived, directed the project, and wrote the manuscript.
Conflict of interest
The authors declare that they have no conflict of interest.
Supporting information
Expanded View Figures PDF
Table EV1
Review Process File
Acknowledgements
We thank Bruno Cadot, Anna Akhamnova, Deborah Bourc'his for the gift of anti P150Glued, BicD2, and H3K27me3 antibodies. We thank Matthieu Piel, David Pellman, Gérard Socié, and Kevin Chalut for interesting discussions and critical reading of the manuscript. This work was funded by grants from the Agence Nationale pour la Recherche (ANR‐14‐CE11‐0012, ANR‐10‐IHUB‐0002), from the European Research Council (ERC CoG 771599), from the Emergence program of the Ville de Paris, from the “Coups d'Elan” prize of the Bettencourt‐Schueller foundation, and the Schlumberger foundation for education and research. SB received PhD fellowships from the IRTELIS program of the CEA and from the Fondation pour la Recherche Medicale (grant FDT20170437071). We thank the Technological Core Facility (Plateforme Technologique de l'IRSL) of the Institut de Recherche Saint Louis, Université de Paris for technical support. The facility is supported by the Conseil Régional d'Ile‐de‐France, Canceropôle Ile‐de‐France, Université de Paris, Association Saint‐Louis, Association Jean‐Bernard, Fondation pour la Recherche Médicale, French National Institute for Cancer Research (InCa) and Ministère de la Recherche.
The EMBO Journal (2020) 39: e103957
See also: C Schwan & R Grosse (November 2020)
Contributor Information
Manuel Théry, Email: manuel.thery@cea.fr.
Stéphane Brunet, Email: stephane.brunet@inserm.fr.
Data availability
The RNA‐Seq data produced in this study are available in the following databases: Gene Expression Omnibus GSE157349 (https://www.ncbi.nlm.nih.gov/geo/query/acc.cgi?acc=GSE157349).
References
- Alam SG, Zhang Q, Prasad N, Li Y, Chamala S, Kuchibhotla R, Birendra KC, Aggarwal V, Shrestha S, Jones AL et al (2016) The mammalian LINC complex regulates genome transcriptional responses to substrate rigidity. Sci Rep 6: 38063 [DOI] [PMC free article] [PubMed] [Google Scholar]
- Almonacid M, Al Jord A, El‐Hayek S, Othmani A, Coulpier F, Lemoine S, Miyamoto K, Grosse R, Klein C, Piolot T et al (2019) Active fluctuations of the nuclear envelope shape the transcriptional dynamics in oocytes. Dev Cell 51: 145–157.e10 [DOI] [PubMed] [Google Scholar]
- Bainton DF, Ullyot JL, Farquhar MG (1971) The development of neutrophilic polymorphonuclear leukocytes in human bone marrow: origin and content of azurophil and specific granules. J Exp Med 134: 907–934 [DOI] [PMC free article] [PubMed] [Google Scholar]
- Bannister AJ, Zegerman P, Partridge JF, Miska EA, Thomas JO, Allshire RC, Kouzarides T (2001) Selective recognition of methylated lysine 9 on histone H3 by the HP1 chromo domain. Nature 410: 120–124 [DOI] [PubMed] [Google Scholar]
- Beaudouin J, Gerlich D, Daigle N, Eils R, Ellenberg J (2002) Nuclear envelope breakdown proceeds by microtubule‐induced tearing of the lamina. Cell 108: 83–96 [DOI] [PubMed] [Google Scholar]
- Becker JS, Nicetto D, Zaret KS (2016) H3K9me3‐dependent heterochromatin: barrier to cell fate changes. Trends Genet 32: 29–41 [DOI] [PMC free article] [PubMed] [Google Scholar]
- Bolhy S, Bouhlel I, Dultz E, Nayak T, Zuccolo M, Gatti X, Vallee R, Ellenberg J, Doye V (2011) A Nup133‐dependent NPC‐anchored network tethers centrosomes to the nuclear envelope in prophase. J Cell Biol 192: 855–871 [DOI] [PMC free article] [PubMed] [Google Scholar]
- Buxboim A, Swift J, Irianto J, Spinler KR, Dingal PCDP, Athirasala A, Kao Y‐RC, Cho S, Harada T, Shin J et al (2014) Matrix elasticity regulates lamin‐A, C phosphorylation and turnover with feedback to actomyosin. Curr Biol 24: 1909–1917 [DOI] [PMC free article] [PubMed] [Google Scholar]
- Cadot B, Gache V, Vasyutina E, Falcone S, Birchmeier C, Gomes ER (2012) Nuclear movement during myotube formation is microtubule and dynein dependent and is regulated by Cdc42, Par6 and Par3. EMBO Rep 13: 741–749 [DOI] [PMC free article] [PubMed] [Google Scholar]
- Carvalho LO, Aquino EN, Neves ACD, Fontes W (2015) The neutrophil nucleus and its role in neutrophilic function. J Cell Biochem 116: 1831–1836 [DOI] [PubMed] [Google Scholar]
- Christophorou N, Rubin T, Bonnet I, Piolot T, Arnaud M, Huynh J‐R (2015) Microtubule‐driven nuclear rotations promote meiotic chromosome dynamics. Nat Cell Biol 17: 1388–1400 [DOI] [PubMed] [Google Scholar]
- Crane GM, Jeffery E, Morrison SJ (2017) Adult haematopoietic stem cell niches. Nat Rev Immunol 17: 573–590 [DOI] [PubMed] [Google Scholar]
- Cui K, Zang C, Roh TY, Schones DE, Childs RW, Peng W, Zhao K (2009) Chromatin Signatures in Multipotent Human Hematopoietic Stem Cells Indicate the Fate of Bivalent Genes during Differentiation. Cell Stem Cell 4: 80–93 [DOI] [PMC free article] [PubMed] [Google Scholar]
- Djeghloul D, Kuranda K, Kuzniak I, Barbieri D, Naguibneva I, Choisy C, Bories J‐C, Dosquet C, Pla M, Vanneaux V et al (2016) Age‐associated decrease of the histone methyltransferase SUV39H1 in HSC perturbs heterochromatin and B lymphoid differentiation. Stem Cell Rep 6: 970–984 [DOI] [PMC free article] [PubMed] [Google Scholar]
- Donaldson C, Bradley B, Hows J (2001) The CD34+CD38neg population is significantly increased in haemopoietic cell expansion cultures in serum‐free compared to serum‐replete conditions: dissociation of phenotype and function. Bone Marrow Transplant 27: 365–371 [DOI] [PubMed] [Google Scholar]
- Dupont S, Morsut L, Aragona M, Enzo E, Giulitti S, Cordenonsi M, Zanconato F, Le Digabel J, Forcato M, Bicciato S et al (2011) Role of YAP/TAZ in mechanotransduction. Nature 474: 179–183 [DOI] [PubMed] [Google Scholar]
- Ehrlich P, Lazarus A (1900) Histology of blood, normal and pathological. London: Cambridge University Press; [Google Scholar]
- Elkouby YM, Jamieson‐Lucy A, Mullins MC (2016) Oocyte polarization is coupled to the chromosomal bouquet, a conserved polarized nuclear configuration in meiosis. PLoS Biol 14: e1002335 [DOI] [PMC free article] [PubMed] [Google Scholar]
- Elosegui‐Artola A, Andreu I, Beedle AEM, Lezamiz A, Uroz M, Kosmalska AJ, Oria R, Kechagia JZ, Rico‐Lastres P, Le Roux AL et al (2017) Force triggers YAP nuclear entry by regulating transport across nuclear pores. Cell 171: 1397–1410.e14 [DOI] [PubMed] [Google Scholar]
- Faivre L, Parietti V, Siñeriz F, Chantepie S, Gilbert‐sirieix M, Albanese P, Larghero J, Vanneaux V (2016) In vitro and in vivo evaluation of cord blood hematopoietic stem and progenitor cells amplified with glycosaminoglycan mimetic. Stem Cell Res Ther 1–10 [DOI] [PMC free article] [PubMed] [Google Scholar]
- Finan JD, Chalut KJ, Wax A, Guilak F (2009) Nonlinear osmotic properties of the cell nucleus. Ann Biomed Eng 37: 477–491 [DOI] [PMC free article] [PubMed] [Google Scholar]
- Firestone AJ, Weinger JS, Maldonado M, Barlan K, Langston LD, O'Donnell M, Gelfand VI, Kapoor TM, Chen JK (2012) Small‐molecule inhibitors of the AAA+ ATPase motor cytoplasmic dynein. Nature 484: 125–129 [DOI] [PMC free article] [PubMed] [Google Scholar]
- Gupta S, Marcel N, Sarin A, Shivashankar GV (2012) Role of actin dependent nuclear deformation in regulating early gene expression. PLoS ONE 7: e53031 [DOI] [PMC free article] [PubMed] [Google Scholar]
- Hampoelz B, Azou‐Gros Y, Fabre R, Markova O, Puech P‐H, Lecuit T (2011) Microtubule‐induced nuclear envelope fluctuations control chromatin dynamics in Drosophila embryos. Development 3386: 3377–3386 [DOI] [PubMed] [Google Scholar]
- Hoffmann K, Sperling K, Olins AL, Olins DE (2007) The granulocyte nucleus and lamin B receptor: avoiding the ovoid. Chromosoma 116: 227–235 [DOI] [PubMed] [Google Scholar]
- Jain N, Iyer KV, Kumar A, Shivashankar GV (2013) Cell geometric constraints induce modular gene‐expression patterns via redistribution of HDAC3 regulated by actomyosin contractility. Proc Natl Acad Sci USA 3: 1–6 [DOI] [PMC free article] [PubMed] [Google Scholar]
- Junqueira LC, Carneiro J (2005) Basic histology, text and atlas. McGraw‐Hill Medical; [Google Scholar]
- Khatau SB, Hale CM, Stewart‐Hutchinson PJ, Patel MS, Stewart CL, Searson PC, Hodzic D, Wirtz D (2009) A perinuclear actin cap regulates nuclear shape. Proc Natl Acad Sci USA 106: 19017–19022 [DOI] [PMC free article] [PubMed] [Google Scholar]
- Kilian KA, Bugarija B, Lahn BT, Mrksich M (2010) Geometric cues for directing the differentiation of mesenchymal stem cells. Proc Natl Acad Sci USA 107: 4872–4877 [DOI] [PMC free article] [PubMed] [Google Scholar]
- King MC, Drivas TG, Blobel G (2008) A network of nuclear envelope membrane proteins linking centromeres to microtubules. Cell 134: 427–438 [DOI] [PMC free article] [PubMed] [Google Scholar]
- Kolaczkowska E, Kubes P (2013) Neutrophil recruitment and function. Nat Rev Immunol 13: 159–175 [DOI] [PubMed] [Google Scholar]
- Kolodney MS, Elson EL (1995) Contraction due to microtubule disruption is associated with increased phosphorylation of myosin regulatory light chain. Proc Natl Acad Sci USA 92: 10252–10256 [DOI] [PMC free article] [PubMed] [Google Scholar]
- Lele TP, Dickinson RB, Gundersen GG (2018) Mechanical principles of nuclear shaping and positioning. J Cell Biol 217: 3330–3342 [DOI] [PMC free article] [PubMed] [Google Scholar]
- Makhija E, Jokhun DS, Shivashankar GV (2015) Nuclear deformability and telomere dynamics are regulated by cell geometric constraints. Proc Natl Acad Sci USA [DOI] [PMC free article] [PubMed] [Google Scholar]
- Matanis T, Akhmanova A, Wulf P, Del Nery E, Weide T, Stepanova T, Galjart N, Grosveld F, Goud B, De Zeeuw CI et al (2002) Bicaudal‐D regulates COPI‐independent Golgi‐ER transport by recruiting the dynein‐dynactin motor complex. Nat Cell Biol 4: 986–992 [DOI] [PubMed] [Google Scholar]
- Mazumder A, Roopa T, Basu A, Mahadevan L, Shivashankar GV (2008) Dynamics of chromatin decondensation reveals the structural integrity of a mechanically prestressed nucleus. Biophys J 95: 3028–3035 [DOI] [PMC free article] [PubMed] [Google Scholar]
- McBeath R, Pirone DM, Nelson CM, Bhadriraju K, Chen CS (2004) Cell shape, cytoskeletal tension, and RhoA regulate stem cell lineage commitment. Dev Cell 6: 483–495 [DOI] [PubMed] [Google Scholar]
- Miralles F, Posern G, Zaromytidou A, Treisman R (2003) Actin dynamics control SRF activity by regulation of its coactivator MAL. Cell 113: 329–342 [DOI] [PubMed] [Google Scholar]
- Miroshnikova YA, Nava MM, Wickström SA (2017) Emerging roles of mechanical forces in chromatin regulation. J Cell Sci 130: 2243–2250 [DOI] [PubMed] [Google Scholar]
- Närvä E, Stubb A, Guzmán C, Blomqvist M, Balboa D, Lerche M, Saari M, Otonkoski T, Ivaska J (2017) A strong contractile actin fence and large adhesions direct human pluripotent colony morphology and adhesion. Stem Cell Rep 9: 67–76 [DOI] [PMC free article] [PubMed] [Google Scholar]
- Nava MM, Miroshnikova YA, Biggs LC, Whitefield DB, Metge F, Boucas J, Vihinen H, Jokitalo E, Li X, García Arcos JM et al (2020) Heterochromatin‐driven nuclear softening protects the genome against mechanical stress‐induced damage. Cell 181: 800–817.e22 [DOI] [PMC free article] [PubMed] [Google Scholar]
- Notta F, Zandi S, Takayama N, Dobson S, Gan OI, Wilson G, Kaufmann KB, McLeod J, Laurenti E, Dunant CF et al (2016) Distinct routes of lineage development reshape the human blood hierarchy across ontogeny. Science 351: aab2116 [DOI] [PMC free article] [PubMed] [Google Scholar]
- Olins AL, Olins DE (2004) Cytoskeletal influences on nuclear shape in granulocytic HL‐60 cells. BMC Cell Biol 5: 1–18 [DOI] [PMC free article] [PubMed] [Google Scholar]
- Orkin SH, Zon LI (2008) Hematopoiesis: an evolving paradigm for stem cell biology. Cell 132: 631–644 [DOI] [PMC free article] [PubMed] [Google Scholar]
- Paluch E, Piel M, Prost J, Bornens M, Sykes C (2005) Cortical actomyosin breakage triggers shape oscillations in cells and cell fragments. Biophys J 89: 724–733 [DOI] [PMC free article] [PubMed] [Google Scholar]
- Pinho S, Frenette PS (2019) Haematopoietic stem cell activity and interactions with the niche. Nat Rev Mol Cell Biol 20: 303–320 [DOI] [PMC free article] [PubMed] [Google Scholar]
- Ramdas NM, Shivashankar GV (2015) Cytoskeletal control of nuclear morphology and chromatin organization. J Mol Biol 427: 695–706 [DOI] [PubMed] [Google Scholar]
- Rao J, Bhattacharya D, Banerjee B, Sarin A, Shivashankar GV (2007) Trichostatin‐A induces differential changes in histone protein dynamics and expression in HeLa cells. 363: 263–268 [DOI] [PubMed] [Google Scholar]
- Schreiner SM, Koo PK, Zhao Y, Mochrie SGJ, King MC (2015) The tethering of chromatin to the nuclear envelope supports nuclear mechanics. Nat Commun 6: 7159 [DOI] [PMC free article] [PubMed] [Google Scholar]
- Shin J‐W, Spinler KR, Swift J, Chasis JA, Mohandas N, Discher DE (2013b) Lamins regulate cell trafficking and lineage maturation of adult human hematopoietic cells. Proc Natl Acad Sci USA 1–6 [DOI] [PMC free article] [PubMed] [Google Scholar]
- Shin J‐W, Swift J, Ivanovska I, Spinler KR, Buxboim A, Discher DE (2013a) Mechanobiology of bone marrow stem cells: from myosin‐II forces to compliance of matrix and nucleus in cell forms and fates. Differentiation 86: 77–86 [DOI] [PMC free article] [PubMed] [Google Scholar]
- Shin J, Buxboim A, Spinler KR, Swift J, Christian DA, Hunter CA, Léon C, Gachet C, Dingal PCDP, Ivanovska IL et al (2014) Contractile forces sustain and polarize hematopoiesis from stem and progenitor cells. Cell Stem Cell 14: 81–93 [DOI] [PMC free article] [PubMed] [Google Scholar]
- Smyth GK (2004) Linear Models and Empirical Bayes Methods for Assessing Differential Expression in Microarray Experiments. Stat Appl Genet Mol Biol 3: 1–25 [DOI] [PubMed] [Google Scholar]
- Splinter D, Tanenbaum ME, Lindqvist A, Jaarsma D, Flotho A, Yu KL, Grigoriev I, Engelsma D, Haasdijk ED, Keijzer N et al (2010) Bicaudal D2, dynein, and kinesin‐1 associate with nuclear pore complexes and regulate centrosome and nuclear positioning during mitotic entry. PLoS Biol 8: e1000350 [DOI] [PMC free article] [PubMed] [Google Scholar]
- van Steensel B, Belmont AS (2017) Lamina‐associated domains: links with chromosome architecture, heterochromatin, and gene repression. Cell 169: 780–791 [DOI] [PMC free article] [PubMed] [Google Scholar]
- Stephens AD, Banigan EJ, Adam SA, Goldman RD, Marko JF (2017) Chromatin and lamin a determine two different mechanical response regimes of the cell nucleus. Mol Biol Cell 28: 1984–1996 [DOI] [PMC free article] [PubMed] [Google Scholar]
- Swift J, Ivanovska IL, Buxboim A, Harada T, Dingal PCDP, Pinter J, Pajerowski JD, Spinler KR, Shin J‐W, Tewari M et al (2013) Nuclear lamin‐A scales with tissue stiffness and enhances matrix‐directed differentiation. Science 341: 1240104 [DOI] [PMC free article] [PubMed] [Google Scholar]
- Szikora S, Gaspar I, Szabad J (2013) “Poking” microtubules bring about nuclear wriggling to position nuclei. J Cell Sci 126: 254–262 [DOI] [PubMed] [Google Scholar]
- Tajik A, Zhang Y, Wei F, Sun J, Jia Q, Zhou W, Singh R, Khanna N, Belmont AS, Wang N (2016) Transcription upregulation via force‐induced direct stretching of chromatin. Nat Mater 15: 1287–1296 [DOI] [PMC free article] [PubMed] [Google Scholar]
- Tariq Z, Zhang H, Chia‐Liu A, Shen Y, Gete Y, Xiong Z‐M, Tocheny C, Campanello L, Wu D, Losert W et al (2017) Lamin A and microtubules collaborate to maintain nuclear morphology. Nucleus 8: 1–14 [DOI] [PMC free article] [PubMed] [Google Scholar]
- Therizols P, Illingworth RS, Courilleau C, Boyle S, Wood AJ, Bickmore WA (2014) Chromatin decondensation is sufficient to alter nuclear organization in embryonic stem cells. Science 346: 1238–1242 [DOI] [PMC free article] [PubMed] [Google Scholar]
- Ugarte F, Sousae R, Cinquin B, Martin EW, Krietsch J, Sanchez G, Inman M, Tsang H, Warr M, Passegué E et al (2015) Progressive chromatin condensation and H3K9 methylation regulate the differentiation of embryonic and hematopoietic stem cells. Stem Cell Rep 5: 728–740 [DOI] [PMC free article] [PubMed] [Google Scholar]
- Uhler C, Shivashankar GV (2017) Regulation of genome organization and gene expression by nuclear mechanotransduction. Nat Rev Mol Cell Biol 18: 717–727 [DOI] [PubMed] [Google Scholar]
- Velten L, Haas SF, Raffel S, Blaszkiewicz S, Islam S, Hennig BP, Hirche C, Lutz C, Buss EC, Nowak D et al (2017) Human haematopoietic stem cell lineage commitment is a continuous process. Nat Cell Biol 19: 271–281 [DOI] [PMC free article] [PubMed] [Google Scholar]
- Versaevel M, Grevesse T, Gabriele S (2012) Spatial coordination between cell and nuclear shape within micropatterned endothelial cells. Nat Commun 3: 671 [DOI] [PubMed] [Google Scholar]
- Watkins NA, Foad NS, Garner SF, Jolley J, Koch K, Macaulay IC, Morley SL, Rendon A, Taylor N, Winzer T et al (2009) A HaemAtlas: characterizing gene expression in differentiated human blood cells. Blood 113: 1–10 [DOI] [PMC free article] [PubMed] [Google Scholar]
- Wilson MH, Holzbaur ELF (2015) Nesprins anchor kinesin‐1 motors to the nucleus to drive nuclear distribution in muscle cells. Development 142: 218–228 [DOI] [PMC free article] [PubMed] [Google Scholar]
- Zhu Y, Gong K, Denholtz M, Chandra V, Kamps MP, Alber F, Murre C (2017) Comprehensive characterization of neutrophil genome topology. Genes Dev 31: 141–153 [DOI] [PMC free article] [PubMed] [Google Scholar]
Associated Data
This section collects any data citations, data availability statements, or supplementary materials included in this article.
Supplementary Materials
Expanded View Figures PDF
Table EV1
Review Process File
Data Availability Statement
The RNA‐Seq data produced in this study are available in the following databases: Gene Expression Omnibus GSE157349 (https://www.ncbi.nlm.nih.gov/geo/query/acc.cgi?acc=GSE157349).