Abstract
Background
Classification of lung cancer screening CT scans depends on measurement of lung nodule size. Information about interobserver agreement is limited.
Purpose
To assess interobserver agreement in the measurements and American College of Radiology Lung CT Screening Reporting and Data System (Lung-RADS) classifications of solid lung nodules detected at lung cancer screening using manual measurements of average diameter and computer-aided semiautomated measurements of average diameter and volume (CT volumetry).
Materials and Methods
Two radiologists and one radiology resident retrospectively measured lung nodules from screening CT scans obtained between September 2016 and June 2018 with a Lung-RADS (version 1.0) classification of 2, 3, 4A, or 4B in the clinical setting. Average manual diameter and semiautomated computer-aided diameter and volume measurements were converted to the corresponding Lung-RADS categories. Interobserver agreement in raw measurements was assessed using intraclass correlation and Bland-Altman indexes, and interobserver agreement in Lung-RADS classification was assessed using bi-rater κ.
Results
One hundred twenty patients (mean age, 63 years ± 6 [standard deviation]; 67 women) were evaluated. All manual, semiautomated diameter, and semiautomated volume measurements were obtained by all three readers in 120 of 147 nodules (82%). Intraclass correlation coefficients were greater than or equal to 0.95 for all reader pairs using all measurement methods and were highest using volumetry. Bias and 95% limits of agreement for average diameter were smaller with semiautomated measurements than with manual measurements. κ values across all Lung-RADS classifications were greater than or equal to 0.81, with the lowest being for manual measurements and the highest being for volumetric measurements. Forty-three of 120 (36%) of the nodules were classified into a lower Lung-RADS category on the basis of volumetry compared with using manual diameter measurements by at least one reader, whereas the reverse occurred for four of 120 (3%) of the nodules.
Conclusion
Interobserver agreement was high with manual diameter measurements and increased with semiautomated CT volumetric measurements. Semiautomated CT volumetry enabled classification of more nodules into lower Lung CT Screening Reporting and Data System categories than manual or semiautomated diameter measurements.
© RSNA, 2020
Online supplemental material is available for this article.
See also the editorial by Nishino in this issue.
Summary
The use of semiautomated CT volumetry improved interobserver agreement and enabled classification of more nodules into lower Lung CT Screening Reporting and Data System categories than the use of manual or semiautomated diameter measurements.
Key Results
■ Intraclass correlation coefficients for lung nodule size measurements across three reader pairs were 0.95–0.98 for manual diameter, 0.98–0.99 for semiautomated diameter, and 1.00 for semiautomated CT volumetry.
■ Weighted κ values for Lung CT Screening Reporting and Data System (Lung-RADS) classification across three reader pairs were 0.81–0.87 for manual diameter, 0.94–0.98 for semiautomated diameter, and 0.98–1.00 for semiautomated CT volumetry.
■ Use of semiautomated CT volumetry resulted in all three readers classifying 66% of lung nodules into Lung-RADS category 2, whereas 48%–53% of lung nodules were classified into this category using manual or semiautomated diameter measurements.
Introduction
Current guidelines for managing indeterminate solid lung nodules in CT lung cancer screening are primarily based on risk stratified by nodule size, with larger size corresponding to greater lung cancer risk (1,2). In clinical practice, lung nodule size typically is determined as the average of bidimensional linear measurements (average diameter) made manually on a single transverse CT image with a computer mouse using an electronic ruler. Because follow-up recommendations depend on nodule size, measurement variability among observers can lead to variability in management.
Semiautomated CT measurements of lung nodule size, using computer algorithms that determine nodule boundaries and the volume contained within, may more accurately reflect nodule size than cross-sectional linear measurements, particularly for nonspherical and asymmetric nodules. In theory, as a semiautomated process, CT volumetric measurements should be more reproducible than manual measurements. Yet, small differences in the measured size of nodules near the threshold of two size ranges with different management recommendations may result in management variability and a change in the test efficacy.
The Lung CT Screening Reporting and Data System (Lung-RADS) classification and management system of the American College of Radiology (1), widely used with CT lung cancer screening in the United States, uses the average nodule diameter to distinguish different risk categories. The most recent version of Lung-RADS (version 1.1) also includes nodule volume ranges for the different risk categories, determined by the volumes of spheres having diameters corresponding to the category diameter ranges. The major purpose of Lung-RADS is to standardize management of lung nodules in CT screening, but there has been little assessment of interobserver agreement associated with its use. The purpose of this study was to evaluate the interobserver agreement in Lung-RADS classifications associated with manual average diameter, semiautomated average diameter, and semiautomated CT volumetric measurements of solid lung nodules detected at CT lung cancer screening.
Materials and Methods
Approval to perform this retrospective study and a waiver of Health Insurance Portability and Accountability Act authorization were obtained from the local Human Studies Committee. The need to obtain written informed consent was waived for the use of existing clinical data.
Selection of Patients and Nodules
The study sample was derived from consecutive patients who underwent initial CT screening examinations performed in the Siteman Cancer Center screening program at Washington University (St Louis, Mo) from September 2016 to June 2018. The screening CT studies were performed without intravenous contrast material with a Sensation 64, Somatom Definition AS 128, or Definition Edge scanner (Siemens, Erlangen, Germany) according to American Association of Physicists in Medicine guidelines, including volume CT dose index less than or equal to 3.0 mGy in a patient of standard size (3), using 120 kV and 35 mAs if the body mass index was 25–34 kg/m2, 25 mAs if the body mass index was less than 25 kg/m2, and 50 mAs if the body mass index was greater than or equal to 35 kg/m2. Images were reconstructed in the transverse plane at a 1-mm slice thickness and at 1-mm intervals using a medium-smooth (B31f or I31f) and a medium-sharp (B50f or I50f) kernel.
Patients were randomly selected after being stratified according to the Lung-RADS classification assigned to their first screening CT scan by one of 12 thoracic radiologists (less than 1 to greater than 25 years of experience) who originally read the scan for the patient’s clinical care. Only patients with a Lung-RADS classification based on the size of a solid nodule for which there were no comparison CT scans were considered. The sample size of 120 was designed to have a minimum of 10 patients in each category in decreasing frequency from Lung-RADS category 2 through Lung-RADS category 4B. It included an equal number of patients whose largest solid nodules originally measured at 3 mm, 4 mm, and 5 mm to examine the relationship between nodule size and agreement on whether a screen result was negative (Lung-RADS 2) or positive (Lung-RADS 3 or greater).
The solid nodules with size corresponding to the Lung-RADS classification assigned for each patient were measured by the study readers. If the original assignment was Lung-RADS 2 with multiple nodules recorded, then only the largest nodule or nodules were selected for the study readers to measure. If the original assignment was Lung-RADS 3, 4A, or 4B, with multiple nodules in the category assigned by the original clinical reader, then all nodules with the size corresponding to the assigned Lung-RADS category were selected for the study readers to measure. Patients in whom the Lung-RADS classification was determined by a subsolid or endobronchial nodule, patients with no nodules, patients whose largest nodule was less than 3 mm, patients who had an unspecified nodule size less than 6 mm, or patients whose CT findings were suspicious for lung cancer without lung nodules were excluded.
Readers and Measurements
The nodules were measured by three readers for this study: an attending radiologist (D.S.G.) with more than 25 years of experience as a chest radiology subspecialist (reader 1), an attending radiologist (C.E.R.) with 2.5 years of experience as a chest radiology subspecialist (reader 2), and a radiology resident (M.Z.) in the 3rd year of radiology residency (reader 3). The slice number and lobe recorded by the original radiologist were provided for each nodule to be measured. Readers were blinded to the size measurement and Lung-RADS classification recorded by the original radiologist and other study readers.
The scans were read in the same randomized order by each reader. Readers were allowed to perform the measurements at their convenience with no restrictions on the number or timing of reading sessions or number of nodules measured per session. Nodules were first measured manually with the desktop version of the clinical picture archiving and communication system (Syngo Plaza; Siemens), using images reconstructed with a B50f or I50f medium-sharp kernel. Readers were instructed to select the transverse slice for measurement they considered most appropriate and to use the electronic ruler to measure the longest and perpendicular dimensions.
Each reader then measured the same set of nodules using a desktop version of a computer software program (Syngo VIA; Siemens) connected to the clinical picture archiving and communication system, in the same nodule order as with the manual measurements. With this semiautomated method, the user draws a line across the nodule in any direction, and the software automatically outlines the nodule edges on each slice and displays the nodule volume and longest transverse and perpendicular dimensions (Fig 1). Images reconstructed with the B31f or I31f medium-smooth kernel were used for these semiautomated measurements. If the computer-generated nodule borders appeared inaccurate, then the line was redrawn in a different orientation and/or on a different slice, which can result in different computer-generated nodule outlines and measurements. If no attempts were successful, then a semiautomated volume measurement was not recorded. No manual editing of computer-generated nodule outlines was performed.
Figure 1:
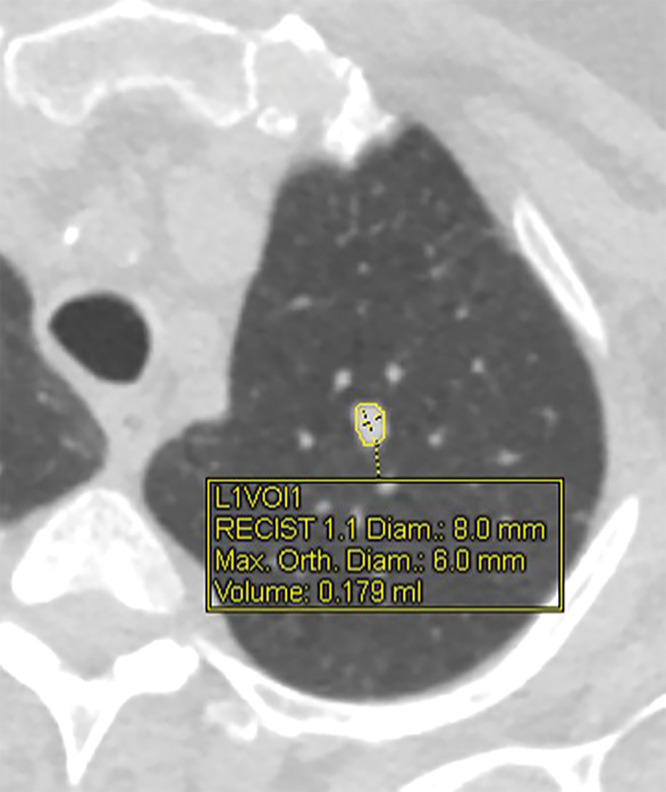
CT image shows solid left upper-lobe nodule with volumetric software processing. Display graphics include nodule margins outlined by software, location of longest and perpendicular dimensions, and corresponding linear and volume measurements. Diam = diameter; L1VOl1 = location 1, volume 1; Max = maximum; Orth = orthogonal; RECIST = Response Evaluation Criteria in Solid Tumors.
Statistical Analysis
Mean nodule diameters were calculated from the bidimensional manual and semiautomated measurements, with fractional values rounded up to the next integer, as was performed by the original clinical radiologists who used version 1.0 of Lung-RADS. Mean diameter and volume measurements were converted to the corresponding Lung-RADS categories for solid nodules (1). For patients with more than one measured nodule, the Lung-RADS classification was determined separately for each nodule.
Agreement on absolute nodule size was evaluated for each reader pair using intraclass correlation and Bland-Altman indexes (4). Agreement on Lung-RADS categories for each reader pair was determined using pairwise κ, a measure of agreement ranging from 0 to 1 that accounts for agreement due to chance (5). κ values were determined for agreement across all four Lung-RADS nodule categories separately (2, 3, 4A, and 4B); in a dichotomous manner in which Lung-RADS 2 was considered a “negative” screen result and Lung-RADS 3, 4A, and 4B were considered “positive” screen results; and with 4A and 4B grouped as a single category (2 vs 3 vs 4). Linear-weighted κ was used for determining agreement among more than two Lung-RADS categories, and simple κ was used for comparing agreement on whether screen results were positive or negative. Overall, positive, and negative agreements were determined on the basis of the aforementioned definitions of positive and negative screen results. Statistical analysis was performed by one author (L.R.) using SAS (version 9.4; SAS Institute, Cary, NC). P values less than .05 were considered to indicate statistical significance.
Results
Patient Characteristics
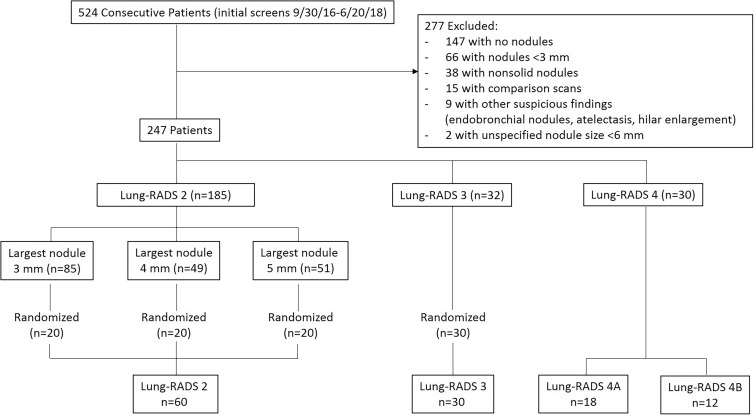
Patient characteristics and nodule size distribution with Lung-RADS conversions are shown in Tables 1 and 2. Among 524 patients who underwent an initial CT screening examination, 277 had scans that met exclusion criteria, leaving 247 patients from whom the study sample of 120 patients was obtained (Fig 2). The mean age ± standard deviation of the 120 patients in the study was 63 years ± 6 (range, 55–78 years), the minimum amount smoked was 30 pack-years, and 96 (80%) were current smokers. One hundred forty-seven nodules were identified for measurement, of which there were 80 from 60 patients classified as having Lung-RADS 2 nodules, 34 from 30 patients classified as having Lung-RADS 3 nodules, 20 from 18 patients classified as having Lung-RADS 4A nodules, and 13 from 12 patients classified as having Lung-RADS 4B nodules by the original reader.
Table 1:
Characteristics of Patients in Study Sample

Table 2:
Distribution of Lung-RADS Classifications and Nodule Sizes in Study Sample
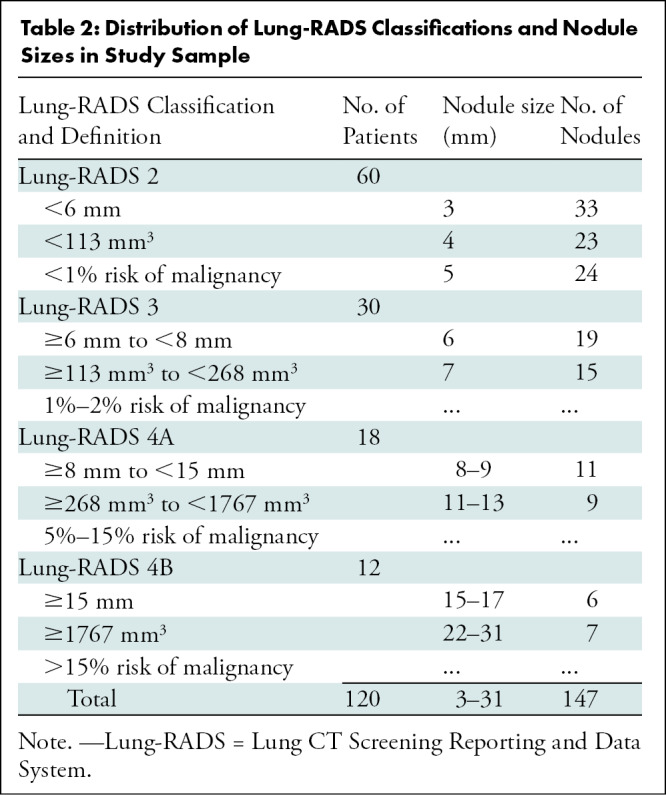
Figure 2:
Flowchart shows study sample selection. Lung-RADS = Lung CT Screening Reporting and Data System.
Reader Measurements
All 147 nodules were measured manually by all readers. Semiautomated diameter and volume measurements were obtained for 135 of 147 (92%) and 132 of 147 (90%) nodules, respectively, by reader 1; for 147 of 147 (100%) and 147 of 147 (100%) nodules by reader 2; and for 135 of 147 (92%) and 129 of 147 (88%) nodules by reader 3. All measurements were obtained by all readers for 126 of 147 (86%) nodules and were used for the analyses reported here. Of the 21 nodules not measured with the semiautomated technique by all three readers, nine were classified as Lung-RADS 2 nodules, five were classified as Lung-RADS 3 nodules, four were classified as Lung-RADS 4A nodules, and three were classified as Lung-RADS 4B nodules by the original reader.
Nodule Classifications
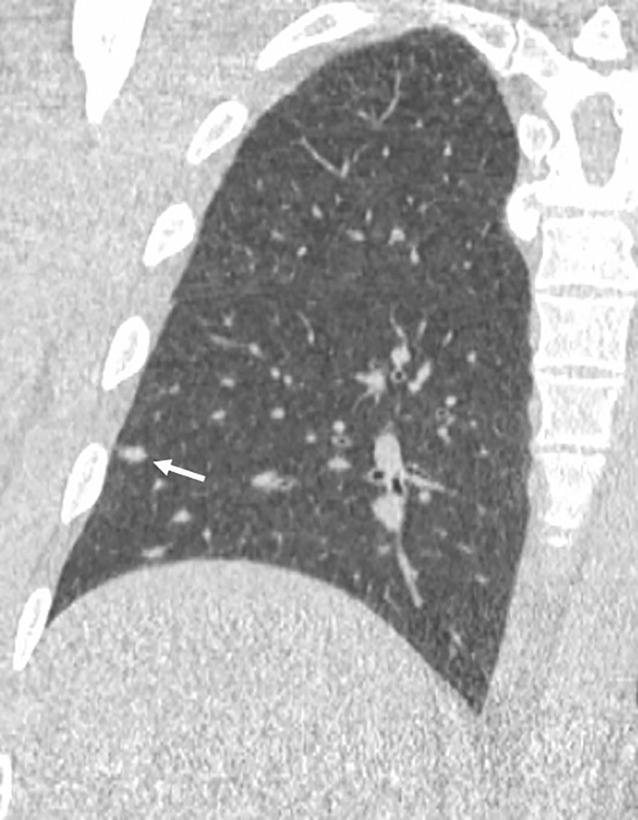
The frequency with which nodules in each size group were assigned to a specific Lung-RADS category by the study readers increased as nodule size approached that category’s size threshold and then decreased as nodule size increased beyond that category’s size threshold (Fig 3). Each average nodule diameter-size group contained some nodules that were given a Lung-RADS classification different from the one used by the original clinical radiologist by one or more readers with at least one of the measurement methods (Fig 3). Readers 1 and 3 recorded relatively more nodules as Lung-RADS 2 nodules (67 each or 53%) using manual measurement of diameter compared with reader 2 (60 or 48%) and compared with using their own semiautomated measurements of diameter (60 or 48% and 62 or 49%, respectively) (Table 3). Classifications made using volumetry were identical among all readers for all but two nodules classified as Lung-RADS 3 nodules by two readers and as Lung-RADS 4A nodules by the other reader. All three readers classified more nodules as Lung-RADS 2 nodules using volumetric measurement (83 of 126 or 66% each) than using manual diameter (60–67 of 126 or 48%–53%) or semiautomated diameter measurement (60–62 of 126 or 48%–49%) (Table 3). Among all nodules in which volumetric and diameter-based classifications differed, the Lung-RADS classification was lower using volumetry than the classification of 43 of 47 nodules measured manually and 37 of 37 nodules measured by using the semiautomated diameter (Table E1 [online] and Figs 4, 5).
Figure 3a:
Bar graphs show relative frequencies of Lung CT Screening Reporting and Data System (Lung-RADS) classifications for (a) manual measurements, (b) semiautomated average diameter measurements, and (c) semiautomated volume measurements, according to sizes originally reported by clinical radiologists. Number of study reads (in parentheses) for each nodule size category equals number of nodules in category multiplied by three study readers or reads.
Table 3:
Number of Nodules Assigned to Each Lung-RADS Category by Each Reader
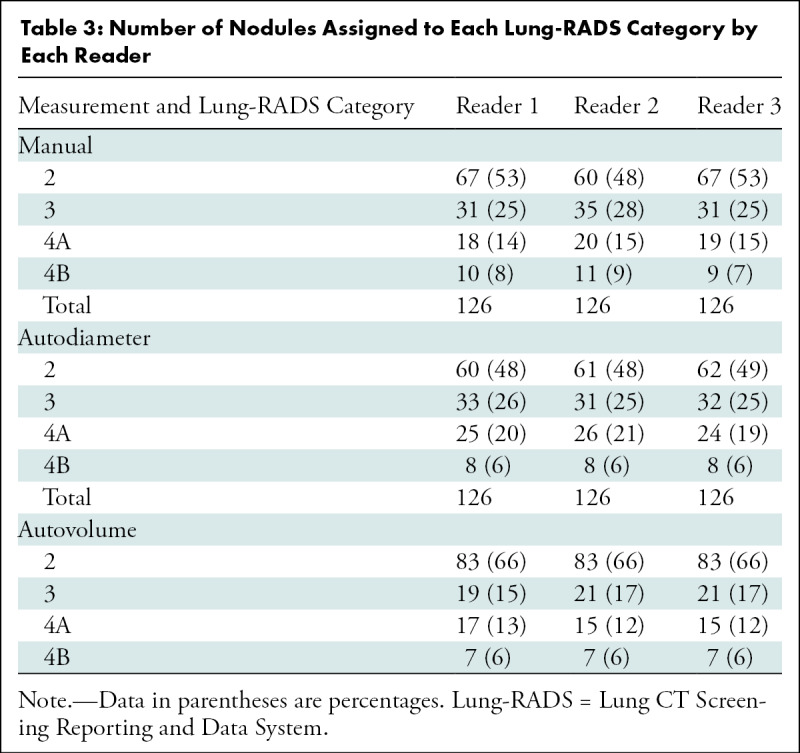
Figure 4a:
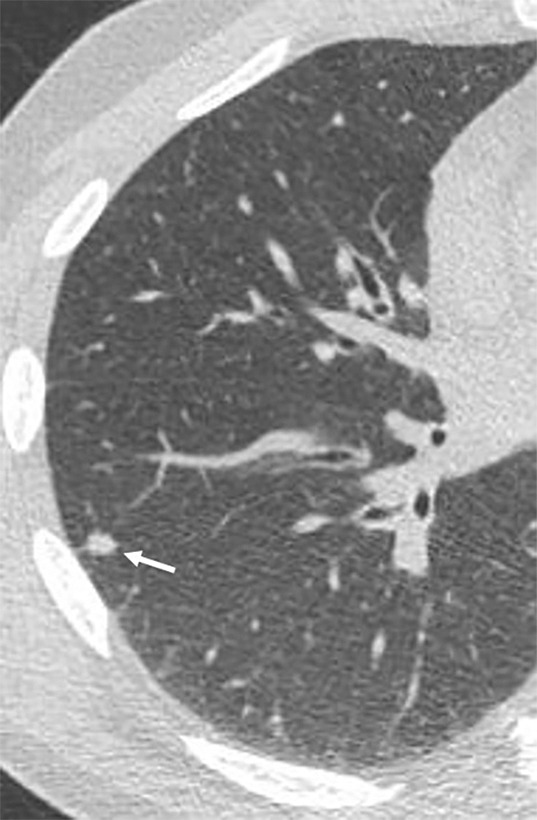
Images show lung cancer screening CT scan in 57-year-old man. (a) Axial and (b) coronal images show right lower-lobe nodule (arrow) classified as Lung CT Screening Reporting and Data System (Lung-RADS) category 3 nodule by all readers using manual measurements and as Lung-RADS 2 nodule by all readers using volumetry. Manual average diameter is 7 mm as measured by two readers and 6 mm as measured by one reader; semiautomated average diameter is 6 mm as measured by two readers and 7 mm as measured by one reader; and semiautomated volume is 91 mm3, 96 mm3, and 99 mm3 as measured by each of three readers. Note the relatively flat nonspherical shape in b. Nodule remains stable on subsequent scans up to 2.5 years later.
Figure 5a:
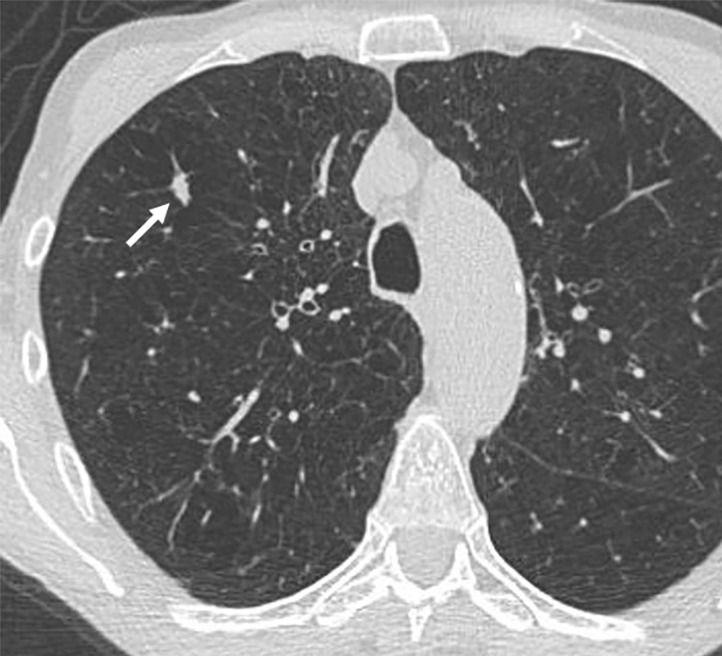
Images show lung cancer screening CT scan in 66-year-old woman. (a) Axial, (b) coronal, and (c) sagittal images show right upper-lobe nodule (arrow) classified as Lung CT Screening Reporting and Data System (Lung-RADS) category 3 nodule by one reader using manual measurements, as Lung-RADS 4A nodule by two readers using manual measurements, and as Lung-RADS 3 nodule by all three readers using volumetry. Manual average diameter is 7 mm as measured by one reader, 8 mm as measured by one reader, and 9 mm as measured by one reader; semiautomated average diameter is 7 mm as measured by two readers and 8 mm as measured by one reader; and semiautomated volume is 122 mm3 as measured by two readers and 133 mm3 as measured by one reader. Nodule remains stable on surveillance scans through 3 years of follow-up.
Figure 3b:
Bar graphs show relative frequencies of Lung CT Screening Reporting and Data System (Lung-RADS) classifications for (a) manual measurements, (b) semiautomated average diameter measurements, and (c) semiautomated volume measurements, according to sizes originally reported by clinical radiologists. Number of study reads (in parentheses) for each nodule size category equals number of nodules in category multiplied by three study readers or reads.
Figure 3c:
Bar graphs show relative frequencies of Lung CT Screening Reporting and Data System (Lung-RADS) classifications for (a) manual measurements, (b) semiautomated average diameter measurements, and (c) semiautomated volume measurements, according to sizes originally reported by clinical radiologists. Number of study reads (in parentheses) for each nodule size category equals number of nodules in category multiplied by three study readers or reads.
Figure 4b:
Images show lung cancer screening CT scan in 57-year-old man. (a) Axial and (b) coronal images show right lower-lobe nodule (arrow) classified as Lung CT Screening Reporting and Data System (Lung-RADS) category 3 nodule by all readers using manual measurements and as Lung-RADS 2 nodule by all readers using volumetry. Manual average diameter is 7 mm as measured by two readers and 6 mm as measured by one reader; semiautomated average diameter is 6 mm as measured by two readers and 7 mm as measured by one reader; and semiautomated volume is 91 mm3, 96 mm3, and 99 mm3 as measured by each of three readers. Note the relatively flat nonspherical shape in b. Nodule remains stable on subsequent scans up to 2.5 years later.
Figure 5b:

Images show lung cancer screening CT scan in 66-year-old woman. (a) Axial, (b) coronal, and (c) sagittal images show right upper-lobe nodule (arrow) classified as Lung CT Screening Reporting and Data System (Lung-RADS) category 3 nodule by one reader using manual measurements, as Lung-RADS 4A nodule by two readers using manual measurements, and as Lung-RADS 3 nodule by all three readers using volumetry. Manual average diameter is 7 mm as measured by one reader, 8 mm as measured by one reader, and 9 mm as measured by one reader; semiautomated average diameter is 7 mm as measured by two readers and 8 mm as measured by one reader; and semiautomated volume is 122 mm3 as measured by two readers and 133 mm3 as measured by one reader. Nodule remains stable on surveillance scans through 3 years of follow-up.
Figure 5c:
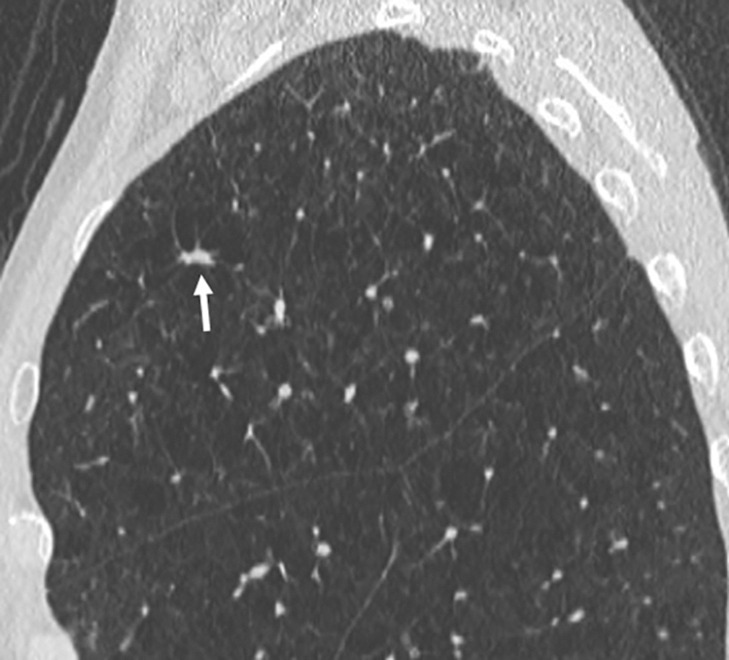
Images show lung cancer screening CT scan in 66-year-old woman. (a) Axial, (b) coronal, and (c) sagittal images show right upper-lobe nodule (arrow) classified as Lung CT Screening Reporting and Data System (Lung-RADS) category 3 nodule by one reader using manual measurements, as Lung-RADS 4A nodule by two readers using manual measurements, and as Lung-RADS 3 nodule by all three readers using volumetry. Manual average diameter is 7 mm as measured by one reader, 8 mm as measured by one reader, and 9 mm as measured by one reader; semiautomated average diameter is 7 mm as measured by two readers and 8 mm as measured by one reader; and semiautomated volume is 122 mm3 as measured by two readers and 133 mm3 as measured by one reader. Nodule remains stable on surveillance scans through 3 years of follow-up.
Reader Agreement
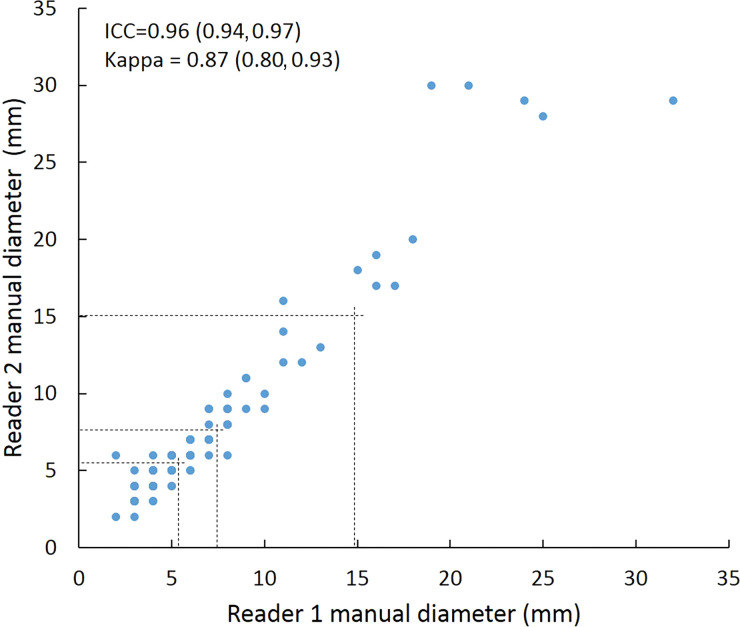
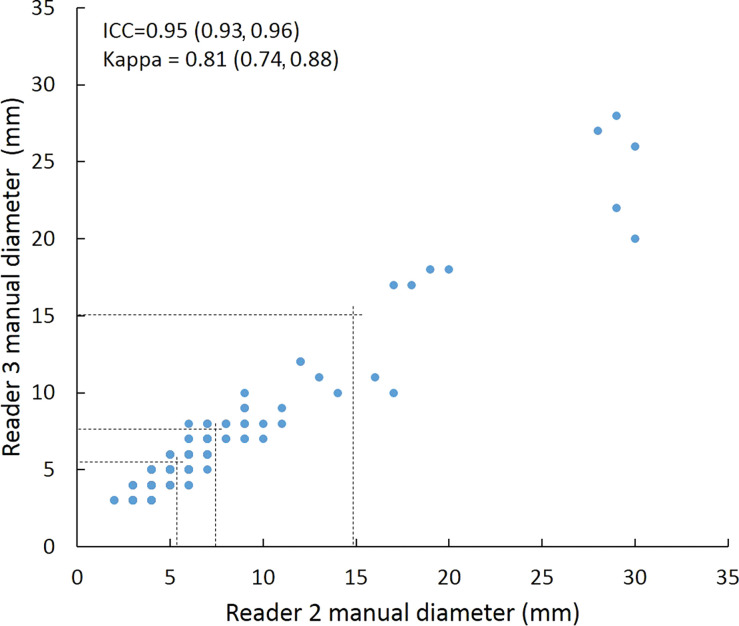
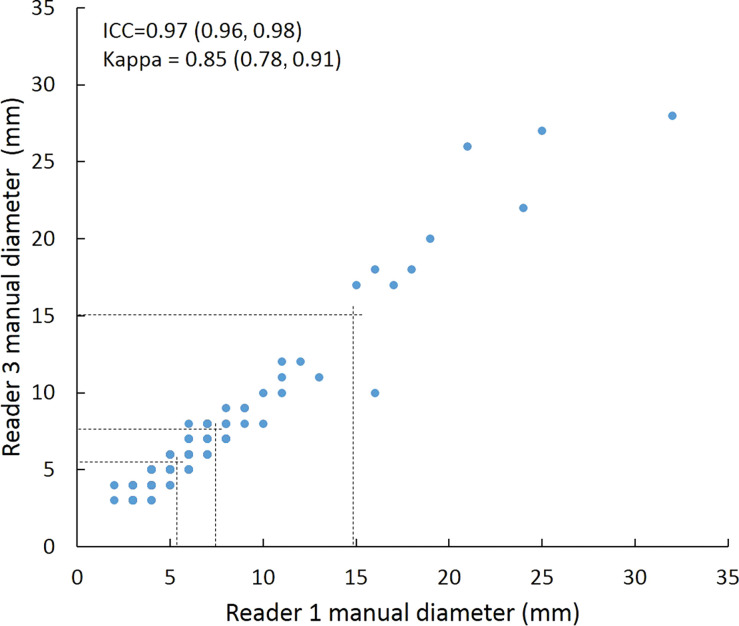
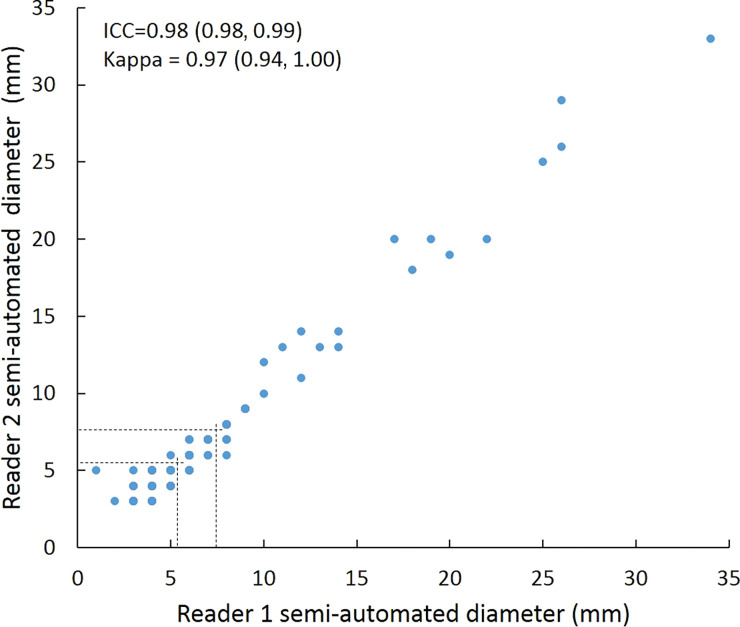
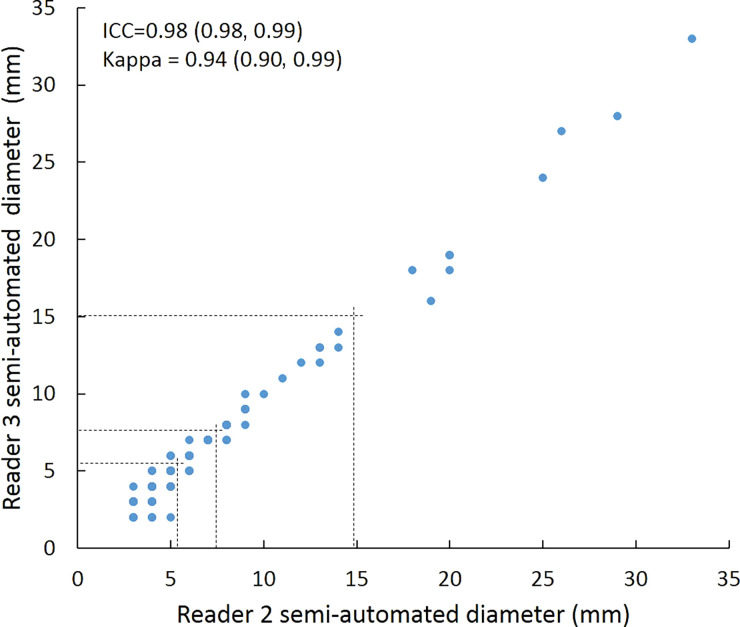
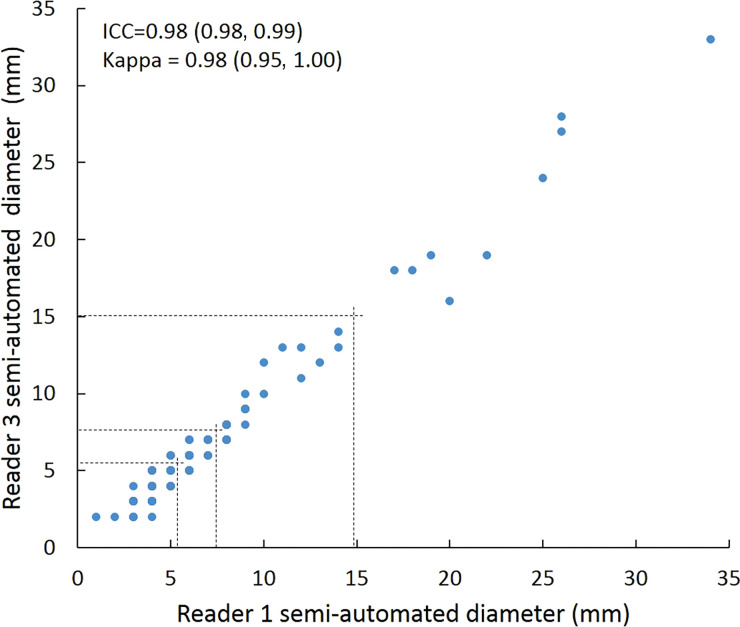
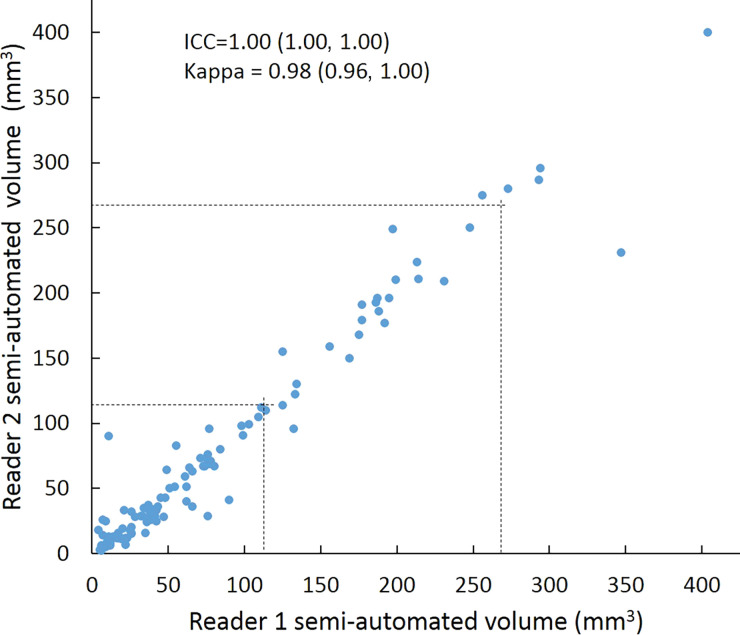
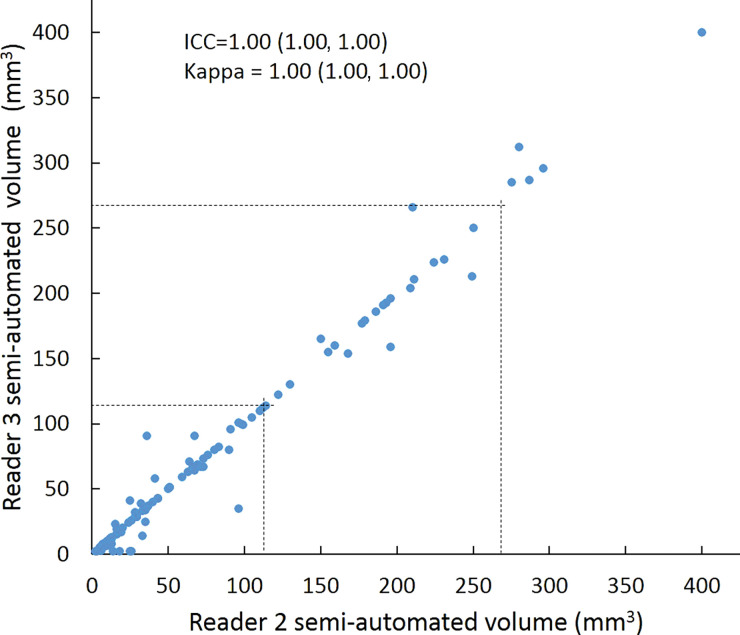
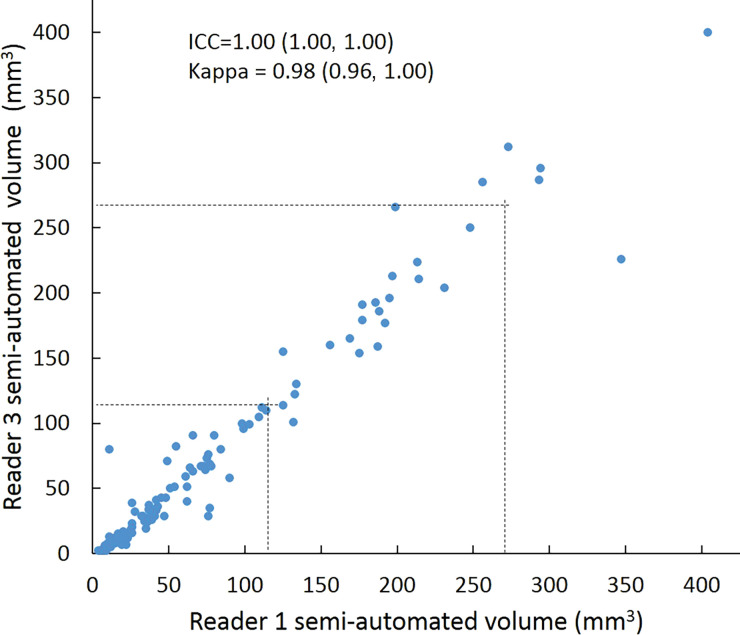
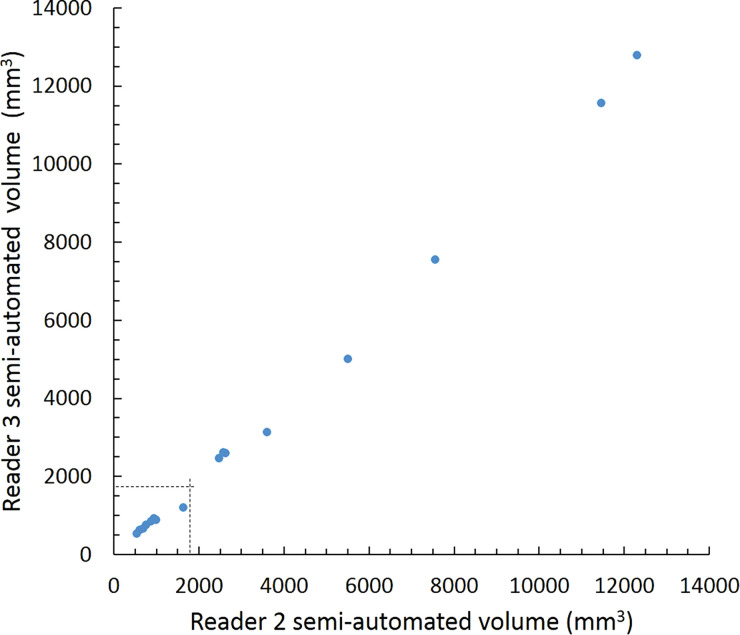
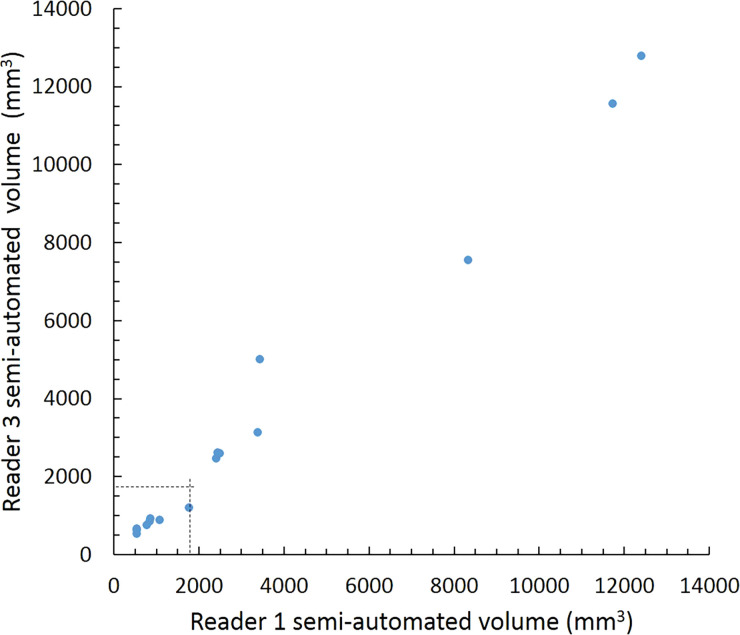
Intraclass correlation was greater than or equal to 0.95 (P < .001) for all reader pairs using all measurement methods, was lowest for manual diameter (0.95–0.97), and was highest (1.0 for all reader pairs) for semiautomated volumetry (Fig 6). Bland-Altman analysis revealed a bias toward larger manual measurements for reader 2, which were 0.6 mm larger than those of reader 1 and 0.5 mm larger than those of reader 3. However, there was less variation between reader pairs for semiautomated diameter measurements than for manual diameter measurements (Table 4). Differences between reader pairs in absolute measurements did not vary systematically across the range of nodule sizes (Fig E1 [online]).
Figure 6a:
Scatterplots show lung nodule measurements for each reader pair and measurement method. (a–c) Manual diameter measurements; (d–f) semiautomated diameter measurements; (g–i) semiautomated volume measurements for measured volumes less than 500 mm3; and (j–l) semiautomated volume measurements for measured volumes greater than or equal to 500 mm3. Dashed lines indicate upper thresholds for Lung CT Screening Reporting and Data System (Lung-RADS) category 2 (<6 mm or <113 mm3), Lung-RADS category 3 (<8 mm or <268 mm3), and Lung-RADS category 4A (<15 mm or <1767 mm3). Some points in a–f may represent more than one identical measurement pair. Numbers in parentheses are 95% confidence intervals. P values were less than .001 for all intraclass correlation coefficient (ICC) values.
Table 4:
Bland-Altman Parameters for Each Reader Pair and Measurement Method
Figure 6b:
Scatterplots show lung nodule measurements for each reader pair and measurement method. (a–c) Manual diameter measurements; (d–f) semiautomated diameter measurements; (g–i) semiautomated volume measurements for measured volumes less than 500 mm3; and (j–l) semiautomated volume measurements for measured volumes greater than or equal to 500 mm3. Dashed lines indicate upper thresholds for Lung CT Screening Reporting and Data System (Lung-RADS) category 2 (<6 mm or <113 mm3), Lung-RADS category 3 (<8 mm or <268 mm3), and Lung-RADS category 4A (<15 mm or <1767 mm3). Some points in a–f may represent more than one identical measurement pair. Numbers in parentheses are 95% confidence intervals. P values were less than .001 for all intraclass correlation coefficient (ICC) values.
Figure 6c:
Scatterplots show lung nodule measurements for each reader pair and measurement method. (a–c) Manual diameter measurements; (d–f) semiautomated diameter measurements; (g–i) semiautomated volume measurements for measured volumes less than 500 mm3; and (j–l) semiautomated volume measurements for measured volumes greater than or equal to 500 mm3. Dashed lines indicate upper thresholds for Lung CT Screening Reporting and Data System (Lung-RADS) category 2 (<6 mm or <113 mm3), Lung-RADS category 3 (<8 mm or <268 mm3), and Lung-RADS category 4A (<15 mm or <1767 mm3). Some points in a–f may represent more than one identical measurement pair. Numbers in parentheses are 95% confidence intervals. P values were less than .001 for all intraclass correlation coefficient (ICC) values.
Figure 6d:
Scatterplots show lung nodule measurements for each reader pair and measurement method. (a–c) Manual diameter measurements; (d–f) semiautomated diameter measurements; (g–i) semiautomated volume measurements for measured volumes less than 500 mm3; and (j–l) semiautomated volume measurements for measured volumes greater than or equal to 500 mm3. Dashed lines indicate upper thresholds for Lung CT Screening Reporting and Data System (Lung-RADS) category 2 (<6 mm or <113 mm3), Lung-RADS category 3 (<8 mm or <268 mm3), and Lung-RADS category 4A (<15 mm or <1767 mm3). Some points in a–f may represent more than one identical measurement pair. Numbers in parentheses are 95% confidence intervals. P values were less than .001 for all intraclass correlation coefficient (ICC) values.
Figure 6e:
Scatterplots show lung nodule measurements for each reader pair and measurement method. (a–c) Manual diameter measurements; (d–f) semiautomated diameter measurements; (g–i) semiautomated volume measurements for measured volumes less than 500 mm3; and (j–l) semiautomated volume measurements for measured volumes greater than or equal to 500 mm3. Dashed lines indicate upper thresholds for Lung CT Screening Reporting and Data System (Lung-RADS) category 2 (<6 mm or <113 mm3), Lung-RADS category 3 (<8 mm or <268 mm3), and Lung-RADS category 4A (<15 mm or <1767 mm3). Some points in a–f may represent more than one identical measurement pair. Numbers in parentheses are 95% confidence intervals. P values were less than .001 for all intraclass correlation coefficient (ICC) values.
Figure 6f:
Scatterplots show lung nodule measurements for each reader pair and measurement method. (a–c) Manual diameter measurements; (d–f) semiautomated diameter measurements; (g–i) semiautomated volume measurements for measured volumes less than 500 mm3; and (j–l) semiautomated volume measurements for measured volumes greater than or equal to 500 mm3. Dashed lines indicate upper thresholds for Lung CT Screening Reporting and Data System (Lung-RADS) category 2 (<6 mm or <113 mm3), Lung-RADS category 3 (<8 mm or <268 mm3), and Lung-RADS category 4A (<15 mm or <1767 mm3). Some points in a–f may represent more than one identical measurement pair. Numbers in parentheses are 95% confidence intervals. P values were less than .001 for all intraclass correlation coefficient (ICC) values.
Figure 6g:
Scatterplots show lung nodule measurements for each reader pair and measurement method. (a–c) Manual diameter measurements; (d–f) semiautomated diameter measurements; (g–i) semiautomated volume measurements for measured volumes less than 500 mm3; and (j–l) semiautomated volume measurements for measured volumes greater than or equal to 500 mm3. Dashed lines indicate upper thresholds for Lung CT Screening Reporting and Data System (Lung-RADS) category 2 (<6 mm or <113 mm3), Lung-RADS category 3 (<8 mm or <268 mm3), and Lung-RADS category 4A (<15 mm or <1767 mm3). Some points in a–f may represent more than one identical measurement pair. Numbers in parentheses are 95% confidence intervals. P values were less than .001 for all intraclass correlation coefficient (ICC) values.
Figure 6h:
Scatterplots show lung nodule measurements for each reader pair and measurement method. (a–c) Manual diameter measurements; (d–f) semiautomated diameter measurements; (g–i) semiautomated volume measurements for measured volumes less than 500 mm3; and (j–l) semiautomated volume measurements for measured volumes greater than or equal to 500 mm3. Dashed lines indicate upper thresholds for Lung CT Screening Reporting and Data System (Lung-RADS) category 2 (<6 mm or <113 mm3), Lung-RADS category 3 (<8 mm or <268 mm3), and Lung-RADS category 4A (<15 mm or <1767 mm3). Some points in a–f may represent more than one identical measurement pair. Numbers in parentheses are 95% confidence intervals. P values were less than .001 for all intraclass correlation coefficient (ICC) values.
Figure 6i:
Scatterplots show lung nodule measurements for each reader pair and measurement method. (a–c) Manual diameter measurements; (d–f) semiautomated diameter measurements; (g–i) semiautomated volume measurements for measured volumes less than 500 mm3; and (j–l) semiautomated volume measurements for measured volumes greater than or equal to 500 mm3. Dashed lines indicate upper thresholds for Lung CT Screening Reporting and Data System (Lung-RADS) category 2 (<6 mm or <113 mm3), Lung-RADS category 3 (<8 mm or <268 mm3), and Lung-RADS category 4A (<15 mm or <1767 mm3). Some points in a–f may represent more than one identical measurement pair. Numbers in parentheses are 95% confidence intervals. P values were less than .001 for all intraclass correlation coefficient (ICC) values.
Figure 6j:
Scatterplots show lung nodule measurements for each reader pair and measurement method. (a–c) Manual diameter measurements; (d–f) semiautomated diameter measurements; (g–i) semiautomated volume measurements for measured volumes less than 500 mm3; and (j–l) semiautomated volume measurements for measured volumes greater than or equal to 500 mm3. Dashed lines indicate upper thresholds for Lung CT Screening Reporting and Data System (Lung-RADS) category 2 (<6 mm or <113 mm3), Lung-RADS category 3 (<8 mm or <268 mm3), and Lung-RADS category 4A (<15 mm or <1767 mm3). Some points in a–f may represent more than one identical measurement pair. Numbers in parentheses are 95% confidence intervals. P values were less than .001 for all intraclass correlation coefficient (ICC) values.
Figure 6k:
Scatterplots show lung nodule measurements for each reader pair and measurement method. (a–c) Manual diameter measurements; (d–f) semiautomated diameter measurements; (g–i) semiautomated volume measurements for measured volumes less than 500 mm3; and (j–l) semiautomated volume measurements for measured volumes greater than or equal to 500 mm3. Dashed lines indicate upper thresholds for Lung CT Screening Reporting and Data System (Lung-RADS) category 2 (<6 mm or <113 mm3), Lung-RADS category 3 (<8 mm or <268 mm3), and Lung-RADS category 4A (<15 mm or <1767 mm3). Some points in a–f may represent more than one identical measurement pair. Numbers in parentheses are 95% confidence intervals. P values were less than .001 for all intraclass correlation coefficient (ICC) values.
Figure 6l:
Scatterplots show lung nodule measurements for each reader pair and measurement method. (a–c) Manual diameter measurements; (d–f) semiautomated diameter measurements; (g–i) semiautomated volume measurements for measured volumes less than 500 mm3; and (j–l) semiautomated volume measurements for measured volumes greater than or equal to 500 mm3. Dashed lines indicate upper thresholds for Lung CT Screening Reporting and Data System (Lung-RADS) category 2 (<6 mm or <113 mm3), Lung-RADS category 3 (<8 mm or <268 mm3), and Lung-RADS category 4A (<15 mm or <1767 mm3). Some points in a–f may represent more than one identical measurement pair. Numbers in parentheses are 95% confidence intervals. P values were less than .001 for all intraclass correlation coefficient (ICC) values.
For distinguishing among all four Lung-RADS categories, linear-weighted κ values for the three reader pairs (Table 5, Fig 6) ranged from 0.81 to 0.87 for manual measurements, 0.94 to 0.98 for semiautomated diameter measurements, and 0.98 to 1.0 for semiautomated volume measurements. For distinguishing between Lung-RADS 2 (negative screen result) and the other categories (positive screen result), simple κ values (Table 5) all varied by less than 0.05 compared with distinguishing among all four categories. Overall, positive and negative agreement for the three reader pairs ranged from 0.90 to 0.94, 0.86 to 0.95, and 0.85 to 0.97, respectively, for manual diameter measurements; ranged from 0.97 to 0.98, 0.97 to 1.00, and 0.97 to 0.97, respectively, for semiautomated diameter measurements; and were all 1.00 across all reader pairs for semiautomated volume measurements. The linear-weighted κ values for distinguishing among Lung-RADS 2 (malignancy rate <1%), Lung-RADS 3 (malignancy rate of 1%–2%), and Lung-RADS 4 (malignancy rate ≥5%) classifications ranged from 0.80 to 0.85 for manual measurements, 0.94 to 0.97 for semiautomated diameter measurements, and 0.98 to 1.0 for semiautomated volume measurements (Table E2 [online]).
Table 5:
Agreement on Lung-RADS Categories
Discussion
To reduce variability in CT screening patient management and outcomes, it is important to know the amount of variability associated with different steps in the CT interpretation process. But information about interobserver agreement in nodule measurement using manual or semiautomated computer-aided methods is limited. In this study, we assessed the component of interobserver agreement related to these different methods of measuring the size of solid lung nodules and the impact on resulting Lung CT Screening Reporting and Data System (Lung-RADS) classifications. The intraclass correlations for raw measurements were 0.95 or greater (P < .001) for all reader pairs, and the κ values for Lung-RADS categorization were in the range regarded as “almost perfect” (0.81–1.00) (5): 0.81–0.87 for manual diameter, 0.94–0.98 for semiautomated diameter, and 0.98–1.00 for semiautomated CT volumetry. Lack of overlap of the κ 95% confidence limits between any of the measurement methods when assessing agreement among all four Lung-RADS categories, and between manual and volumetric methods when assessing agreement on positive versus negative screens, further supports that agreement was greater with use of semiautomated volumetry.
A key feature of our study is that the same nodules were measured by the same observers with both manual and semiautomated methods, allowing direct comparison of agreement with both methods. Most studies have assessed observer variability for manual measurements or semiautomated methods alone, without comparing both methods in the same nodules and without assessing agreement in corresponding Lung-RADS classifications. In one previous study (6), the 95% limits of agreement among three readers who manually measured the largest transverse dimension of 54 nodules in the 3- to 18-mm range were −1.73 to 1.73 mm. In a study in which three readers manually measured 32 lung cancers (7), concordance correlation coefficients for bidimensional measurements ranged from 0.97 to 0.99. Another study (8) found an average κ value of 0.70 for manually classifying 80 initial screening CT scans from the National Lung Screening Trial by Lung-RADS criteria, but this study required readers to both identify and measure the risk-dominant nodule and included subsolid nodules.
By using semiautomated volumetry, one study (9) found that the 95% limits of agreement between two observers for measuring 50 pulmonary metastases were −5.5% to 6.6%. When the volumes of 430 nodules in the size range of 50–500 mm3 (4.6- to 9.8-mm diameter if spherical) from the Dutch-Belgian Lung Cancer Screening (or NELSON) trial were measured by one local site reader and one of two central readers, the Spearman correlation was 0.99 with a 0.4% mean difference as determined by Bland-Altman analysis (10). Another study (11), in which seven chest radiologists reviewed 134 CT scans from the National Lung Screening Trial, found that the κ value for classifying the scans as either positive or negative for cancer increased from 0.53 without using computer-aided detection and semiautomated measurement software compared with 0.66 with using this method, and positive agreement increased from 77% to 84%. However, this study required readers to both detect and measure nodules, which likely explains the lower κ values compared with those found in our study.
Although use of volumetry resulted in the strongest agreement, it also shifted classifications to Lung-RADS categories lower than those obtained with average diameter measurements. Some of these discrepancies may be explained by using the Lung-RADS (version 1.0) practice of rounding up diameter measurements, which would lead to classification of nodules with, for example, an average diameter of 5.5–5.9 mm as Lung-RADS 3 nodules after rounding up to 6 mm and as Lung-RADS 2 nodules (if spherical) because of volume less than 113 mm3. A similar effect was reported in another study, which found that estimating nodule volume from the mean diameter of nodules in the 50- to 500-mm3 volume range resulted in overestimation of 47% compared with direct semiautomated volume measurement, likely reflecting the nonspherical and often asymmetric shape of most nodules (12). This effect also may have contributed to the baseline negative screen result rate in the Dutch-Belgian Lung Cancer Screening trial (13) (which considered screens having only nodules smaller than 50 mm3 [4.6 mm if spherical] as demonstrating negative results) being higher, at 79.2%, than the baseline negative screen result rate of 72.7% in the National Lung Screening Trial (14), which considered nodules having a largest diameter less than 4 mm as demonstrating negative results. The largest diameter of nonspherical 50-mm3 nodules would be even greater than 4.6 mm, and thus some 4-mm and 5-mm nodules that were considered as demonstrating positive results in the National Lung Screening Trial likely would have been considered as demonstrating negative results using the NELSON trial volumetric criteria. These considerations suggest that risk-category thresholds based on actual nodule volume measurements would be preferable to thresholds based on conversion of the average diameter to the volume of a sphere. Semiautomated measurements and optimal size-classification thresholds also may depend on the type of software and segmentation algorithms used, as biases toward smaller or larger diameters and volumes have been found in previous software comparisons (15,16).
Our study had limitations. First, the assessment of agreement was limited to three reader pairs at a single institution. Second, agreement on manual measurements may have been influenced by the morphologic characteristics of nodule margins, as greater interreader variability has been found for nodules with spiculated or irregular margins (17). Although we did not evaluate nodule morphologic characteristics, our results reflect agreement for the range of nodule types encountered in clinical practice. Also, κ values may vary with the number and relative distribution of nodules (18), although the κ values stayed consistent across multiple analyses that grouped the Lung-RADS categories in different ways. Finally, we did not assess how down categorization of Lung-RADS nodule classification affects the efficacy of this method for CT lung cancer screening.
In conclusion, the findings of this study support the reliability of manual measurements in lung cancer screening. They also provide direct evidence that consistency could be further improved and nearly optimized for solid nodules by using semiautomated volumetry. Given the potential for discrepancies in Lung CT Screening Reporting and Data System classifications depending on the use of diameter or volume guidelines, further study may be warranted to better define volume-based nodule management categories and the impact that different segmentation algorithms may have on nodule measurements.
SUPPLEMENTAL TABLES
SUPPLEMENTAL FIGURES
Acknowledgments
Acknowledgment
We thank Amber Salter, PhD, for biostatistical support with manuscript revisions.
Supported by the Washington University Institute of Clinical and Translational Sciences (grant UL1TR002345) from the National Center for Advancing Translational Sciences of the National Institutes of Health.
The content is solely the responsibility of the authors and does not necessarily represent the official view of the National Institutes of Health.
Disclosures of Conflicts of Interest: D.S.G. disclosed no relevant relationships. C.E.R. disclosed no relevant relationships. M.Z. disclosed no relevant relationships. L.R. disclosed no relevant relationships.
Abbreviations:
- Lung-RADS
- Lung CT Screening Reporting and Data System
References
- 1.Lung CT Screening Reporting and Data System (Lung-RADS) version 1.1 . American College of Radiology Web site. http://www.acr.org/Quality-Safety/Resources/LungRADS. Published 2019. Accessed May 31, 2019.
- 2.National Comprehensive Cancer Network . NCCN clinical practice guidelines in oncology. Lung cancer screening version 2.2019. Plymouth Meeting, Pa: National Comprehensive Cancer Network, 2018. [DOI] [PubMed] [Google Scholar]
- 3.Lung cancer screening protocols version 4.0. American Association of Physicists in Medicine Web site. http://www.aapm.org/pubs/CTProtocols/documents/LungCancerScreeningCT.pdf. Published 2016. Accessed April 17, 2019.
- 4.Bland JM, Altman DG. Statistical methods for assessing agreement between two methods of clinical measurement. Lancet 1986;1(8476):307–310. [PubMed] [Google Scholar]
- 5.Landis JR, Koch GG. The measurement of observer agreement for categorical data. Biometrics 1977;33(1):159–174. [PubMed] [Google Scholar]
- 6.Revel MP, Bissery A, Bienvenu M, Aycard L, Lefort C, Frija G. Are two-dimensional CT measurements of small noncalcified pulmonary nodules reliable? Radiology 2004;231(2):453–458. [DOI] [PubMed] [Google Scholar]
- 7.Zhao B, James LP, Moskowitz CS, et al. Evaluating variability in tumor measurements from same-day repeat CT scans of patients with non-small cell lung cancer. Radiology 2009;252(1):263–272. [DOI] [PMC free article] [PubMed] [Google Scholar]
- 8.van Riel SJ, Jacobs C, Scholten ET, et al. Observer variability for Lung-RADS categorisation of lung cancer screening CTs: impact on patient management. Eur Radiol 2019;29(2):924–931. [DOI] [PMC free article] [PubMed] [Google Scholar]
- 9.Wormanns D, Kohl G, Klotz E, et al. Volumetric measurements of pulmonary nodules at multi-row detector CT: in vivo reproducibility. Eur Radiol 2004;14(1):86–92. [DOI] [PubMed] [Google Scholar]
- 10.Gietema HA, Wang Y, Xu D, et al. Pulmonary nodules detected at lung cancer screening: interobserver variability of semiautomated volume measurements. Radiology 2006;241(1):251–257. [DOI] [PubMed] [Google Scholar]
- 11.Jeon KN, Goo JM, Lee CH, et al. Computer-aided nodule detection and volumetry to reduce variability between radiologists in the interpretation of lung nodules at low-dose screening computed tomography. Invest Radiol 2012;47(8):457–461. [DOI] [PMC free article] [PubMed] [Google Scholar]
- 12.Heuvelmans MA, Walter JE, Vliegenthart R, et al. Disagreement of diameter and volume measurements for pulmonary nodule size estimation in CT lung cancer screening. Thorax 2018;73(8):779–781. [DOI] [PubMed] [Google Scholar]
- 13.van Klaveren RJ, Oudkerk M, Prokop M, et al. Management of lung nodules detected by volume CT scanning. N Engl J Med 2009;361(23):2221–2229. [DOI] [PubMed] [Google Scholar]
- 14.Aberle DR, Adams AM, et al. ; National Lung Screening Trial Research Team . Reduced lung-cancer mortality with low-dose computed tomographic screening. N Engl J Med 2011;365(5):395–409. [DOI] [PMC free article] [PubMed] [Google Scholar]
- 15.de Hoop B, Gietema H, van Ginneken B, Zanen P, Groenewegen G, Prokop M. A comparison of six software packages for evaluation of solid lung nodules using semi-automated volumetry: what is the minimum increase in size to detect growth in repeated CT examinations. Eur Radiol 2009;19(4):800–808. [DOI] [PubMed] [Google Scholar]
- 16.Zhao YR, van Ooijen PM, Dorrius MD, et al. Comparison of three software systems for semi-automatic volumetry of pulmonary nodules on baseline and follow-up CT examinations. Acta Radiol 2014;55(6):691–698. [DOI] [PubMed] [Google Scholar]
- 17.Han D, Heuvelmans MA, Vliegenthart R, et al. Influence of lung nodule margin on volume- and diameter-based reader variability in CT lung cancer screening. Br J Radiol 2018;91(1090):20170405. [DOI] [PMC free article] [PubMed] [Google Scholar]
- 18.Crewson PE. Reader agreement studies. AJR Am J Roentgenol 2005;184(5):1391–1397. [DOI] [PubMed] [Google Scholar]
Associated Data
This section collects any data citations, data availability statements, or supplementary materials included in this article.


