

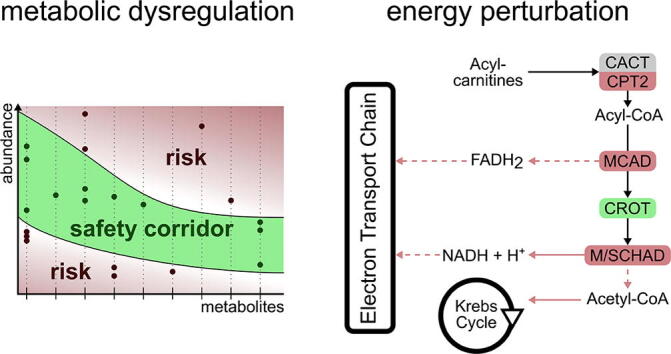
Graphical abstract
Keywords: Sepsis, Metabolomics, Safety corridor, Beta-oxidation, Fatty acid metabolism, Energy metabolism
Abstract
Sepsis remains a major cause of death despite advances in medical care. Metabolic deregulation is an important component of the survival process. Metabolomic analysis allows profiling of critical metabolic functions with the potential to classify patient outcome. Our prospective longitudinal characterization of 33 septic and non-septic critically ill patients showed that deviations, independent of direction, in plasma levels of lipid metabolites were associated with sepsis mortality. We identified a coupling of metabolic signatures between liver and plasma of a rat sepsis model that allowed us to apply a human kinetic model of mitochondrial beta-oxidation to reveal differing enzyme concentrations for medium/short-chain hydroxyacyl-CoA dehydrogenase (elevated in survivors) and crotonase (elevated in non-survivors). These data suggest a need to monitor cellular energy metabolism beyond the available biomarkers. A loss of metabolic adaptation appears to be reflected by an inability to maintain cellular (fatty acid) metabolism within a “corridor of safety”.
1. Introduction
Infection is a commonplace and usually self-limiting condition that improves either by natural host defense processes or with iatrogenic assistance with antibiotics and source control. For reasons still poorly understood, a proportion of infected patients develop sepsis, i.e. organ dysfunction through a dysregulated host response [1]. Such patients are at high risk of mortality, averaging approximately a third in developed countries and likely higher in resource-poor countries [2]. Indeed, sepsis represents one of the major causes of death worldwide even in survivors, many develop long-term or even permanent physical and/or cognitive disability [3].
Sepsis can be interpreted as a pathogen-triggered imbalance of host damage and repair processes. It is a complex condition that can originate from a wide variety of pathogens and anatomical sites of infection. The molecular basis underlying both susceptibility and prognosis remain poorly understood with many fundamental questions still unanswered. Susceptibility and outcome are influenced by various factors including age [4], gender [5], co-morbidity [6] and genetic predisposition [7], [8]. The development of individualized intervention strategies (precision medicine) requires a thorough understanding of the molecular mechanisms underlying multiple organ failure. Metabolic dysregulation, leading to organ dysfunction and eventually to overt organ failure, is increasingly recognized as an important component of this process [9]. While mechanisms underlying the inflammatory response that initially drives the pathogenesis of sepsis are fairly well understood, downstream pathways including those driving metabolic deregulation remain elusive [1].
Even though metabolomics is a relatively new approach for studying infectious diseases, metabolite signals found in biological samples can be used as infection biomarkers [10], [11], [12], [13], [14]. Metabolomics has also been used to successfully build classification models of response to therapy [15], to predict mortality [16], [17], [18] and to evaluate global differences between survivors and non-survivors after hospitalization for community-acquired pneumonia (CAP) and sepsis [19]. Metabolomic, proteomic and clinical data have been combined to develop a multi-dimensional model that could predict survival in septic patients with high accuracy [20]. However, direct comparison of findings from different metabolomic studies is difficult due to biological (sample type used, e.g. plasma, urine) and technical variations, with the consequent risk of introducing bias [21], [22].
In this study we performed a detailed metabolomic (188metabolites) and biochemical (30 biochemical parameters) characterization in septic survivors and non-survivors commencing from their admission to intensive care. A critically ill control group consisted of non-septic survivors and non-survivors. Comparison was also made against plasma and tissue samples taken from an established rat fecal peritonitis model of sepsis [23], [24], [25] that allows early prognostication [24], [25]. This enabled us to not only identify metabolic differences in septic patients related to survival, but to also reveal metabolic signatures and mechanisms specific to septic non-survivors compared to other causes of death, and to compare plasma and tissue metabolite levels.
2. Results
2.1. Patient characteristics of the study population
Thirty-three patients from the general intensive care unit (ICU) of University College London Hospitals NHS Foundation Trust were enrolled between January 2014 and April 2015. Cohort characteristics are shown in Table 1 with more detail on demographics provided in Supplementary Table S1. Twenty patients were diagnosed with sepsis whereas 13 patients had non-septic inflammatory or other non-infection related diagnoses causing organ dysfunction. Plasma samples were collected on day 0 (day of ICU admission) and on days 1, 2, 3, 5, 7, 14, 21 and 28 until death or discharge from the ICU. In total, 149 samples were collected, averaging 4–5 samples per patient and were subjected to metabolomic and biochemical analyses. 188 metabolites were identified from seven metabolite groups, including acylcarnitines, amino acids, biogenic amines, lysophosphatidylcholines (lysoPC), phosphatidylcholines (PC), sphingolipids (SM) and hexoses. Thirty biochemical parameters were quantified in addition in samples taken only from the septic patient group over days 0 to 3. An overview of the measured metabolites and biochemical parameters is shown in Supplementary Tables S2 and S3.
Table 1.
Patient cohort description.
| Septic-S | Septic-NS | non-Septic-S | non-Septic-NS | ||
|---|---|---|---|---|---|
| n = | 12 | 8 | 9 | 4 | |
| Age – yrd | 68 ± 16 | 68 ± 13 | 53 ± 18 | 50 ± 19 | |
| Weight – kg | 72.3 ± 19 | 78 ± 6 | 77 ± 8 | 79 ± 20 | |
| SOFA scorea, b | 6 ± 1 | 9 ± 3 | 7 ± 2 | 10 ± 1 | |
| APACHE II scorea | 14 ± 4 | 21 ± 5 | 16 ± 4 | 19 ± 3 | |
| Length of ICU Stay – dd | 7 ± 8 | 7 ± 10 | 17 ± 13 | 13 ± 11 | |
| Max. Noradrenaline dose at Day 0 – µg/kg/minc,d | 0.40 ± 0.29 | 0.57 ± 0.29 | 0.06 ± 0.08 | 0.18 ± 0.13 | |
| Male sex – n (%)d | 9 (75) | 7 (88) | 2 (22) | 3 (75) | |
| Co-morbidities – n (%) | Diabetesd | 5 (42) | 3 (38) | 0 (0) | 0 (0) |
| Heart Failure | 0 (0) | 2 (25) | 3 (33) | 1 (25) | |
| Hypertension | 7 (58) | 3 (38) | 2 (22) | 1 (25) | |
| IHD | 0 (0) | 1 (13) | 3 (33) | 1 (25) | |
| CKD | 2 (17) | 1 (13) | 0 (0) | 0 (0) | |
| COPDd | 4 (33) | 3 (38) | 0 (0) | 0 (0) | |
| Active cancer | 1 (8) | 0 (0) | 2 (22) | 0 (0) | |
| Medication use prior to submission – n (%) | ß-blockersa | 7 (58) | 0 (0.0) | 6 (67) | 1 (25) |
| Insulin | 3 (25) | 1 (13) | 0 (0) | 0 (0) | |
| Steroids | 0 (0) | 1 (13) | 0 (0) | 0 (0) | |
| Statin | 2 (17) | 3 (38) | 4 (44) | 1 (25) | |
| Social history – n (%) | Tobacco use | 4 (33) | 1 (13) | 3 (33) | 1 (25) |
| Alcohol abuse | 0 (0) | 0 (0) | 1 (11) | 0 (0) | |
| Illicit drug use | 0 (0) | 0 (0) | 1 (11) | 1 (25) | |
| Type of admission – n (%) | Elective | 0 (0.0) | 0 (0.0) | 3 (33) | 1 (25) |
| Emergencyd | 12 (100) | 8 (100) | 6 (67) | 3 (75) | |
| Admission source – n (%) | Emergency departmentd | 5 (42) | 3 (38) | 6 (67) | 2 (50) |
| Inpatient ward | 3 (25) | 2 (25) | 3 (33) | 1 (25) | |
| Theatres | 4 (33) | 1 (13) | 0 (0) | 1 (25) | |
| Other hospital | 0 (0) | 2 (25) | 0 (0) | 0 (0) | |
| Sepsis type - n (%) | Intra-abdominal | 5 (42) | 3 (38) | – | – |
| Community-acquired | 7 (58) | 5 (63) | – | – | |
| Other critical illness - n (%) | Femoral fracture | – | – | 2 | 0 |
| Cardiac arrest | – | – | 1 | 1 | |
| Seizures | – | – | 2 | 0 | |
| G-I bleed | – | – | 1 | 2 | |
| TTP | – | – | 0 | 1 | |
| Pulmonary embolus | – | – | 2 | 0 | |
| Myeloma-related AKI | – | – | 1 | 0 | |
Superscript characters show significant differences between patient groups by Student’s t-test (continuous variables) or Fisher’s exact test (discrete variables) without multiple hypothesis correction:
a: Septic-S vs Septic-NS; b: non-Septic-S vs non-Septic-NS; c: Septic-NS vs non-Septic-NS; d: Septic-(S + NS) vs non-Septic-(S + NS).
IHD = ischemic heart disease; CKD = chronic kidney disease; COPD = chronic obstructive pulmonary disease; TTP = thrombotic thrombo-cytopenic purpura; AKI = acute kidney injury; G-I = gastrointestinal.
For subsequent analyses, patients were categorized into four groups: patients surviving diagnosed sepsis (Septic-S), patients not surviving diagnosed sepsis (Septic-NS), patients surviving any non-sepsis diagnosis (non-Septic-S) and patients not surviving any non-sepsis diagnosis in the ICU (non-Septic-NS). To determine whether metabolites can distinguish septic from non-septic causes of illness or can provide early evidences for patient survival fate, statistical, machine learning and an adaptation of a ‘survival corridor’ based on surviving patients analyses were carried out and are described next.
2.2. Higher variance in the metabolic profiles of septic non-survivors
Eight of the 20 septic patients died. A principal component analysis (PCA) biplot was performed to evaluate potential differences in biochemical characteristics between septic survivors (Septic-S) and non-survivors (Septic-NS). The first two principal components of the biochemical profile distances show a separation of Septic-S and -NS (PERMANOVA, q = 0.0015, Fig. 1A). Levels of low-density lipoprotein (LDL) cholesterol, high density lipoprotein (HDL) cholesterol, aspartate aminotransferase (AST), alanine aminotransferase (ALT) and troponin T (TnT) had the largest influence on separation, with survivors having higher HDL and LDL cholesterol and lower AST, ALT and TnT values compared to Septic-NS.
Fig. 1.

Septic-NS (non-survivor) patients have a distinct metabolic signature and are more diverse than other patient groups. (A) Samples are labelled by patient number and day. Biochemical parameters are treated as feature vectors and the pairwise Canberra distance between feature vectors is used as an input for principal component analysis (PCA). Septic-S (survivors) differ markedly from Septic-NS. (non-survivors). Q values were calculated with a balanced bootstrapped PERMANOVA (FDR corrected together with all metabolite groups and the biochemical parameter set) as the mean of 1000 repeats. Arrows are proportionally scaled for esthetic appearance. (B) Metabolite concentrations are treated as feature vectors and the pairwise Canberra distance between feature vectors is used as an input for PCA. The non-septic group is generally not discernible from Septic-S; both differ markedly from Septic-NS. Q values where calculated as above. (C) Beta diversity of septic and non-septic patients as a measure of group spread and variance. Sorted by median spread the groups have the order non-Septic-S < Septic-S < non-Septic-NS < Septic-NS. Significance was assessed by FDR corrected t-tests between all groups. Q values not shown did not reach statistical significance.
When studying the metabolomic signatures of Septic-S and -NS patients, we also included data from the 13 patients who served in our study as non-septic (non-Septic-S and non-Septic-NS) controls. As shown in Fig. 1B, the metabolomic profiles form a ‘horseshoe shape’ where individual samples from each group are interspersed but the group centres are ordered such that Septic-S and Septic-NS patient samples tend to locate towards opposite tips. Levels of carnosine, aspartate, putrescine, C3-DC (C4-OH) and PC aa C36:0 were largely responsible for the opposite placing of Septic-S and Septic-NS patient samples within the PCA (Fig. 1B). The global metabolomic characteristics of Septic-NS patients differed significantly from Septic-S (PERMANOVA, q = 0.0011) and non-Septic patients (PERMANOVA, q = 0.015), revealing a unique signature of Septic-NS patients. The most pronounced differences between Septic-S and Septic-NS patient samples were observed in the sphingolipid, lysophoshphatidylcholine and phosphatidylcholine metabolite groups (Supplementary Fig. S1A–F). There was significantly higher variance in the metabolomic profiles of Septic-NS compared to Septic-S patients (t-test, q = 5e−4, Fig. 1C) and also in non-Septic-S (t-test, q = 8e−5, Fig. 1C), non-Septic-NS (t-test, q = 0.033, Fig. 1C) and both non-Septic groups combined (t-test, q = 9e−5, Fig. 1C), suggesting a highly individualized metabolomic signature in non-survivor septic patients.
To further study how death from sepsis differs metabolically compared to non-septic causes, we examined differences between Septic-NS and non-Septic-NS. Distinct signatures were not found in global metabolomic characteristics of Septic-NS vs non-Septic-NS (PERMANOVA, q > 0.05, Fig. 1B). However, differences were observed in metabolic subgroups such as amino acids, phosphatidylcholines and sphingolipids (PERMANOVA, q = 0.041, q = 0.046 and q = 0.046, respectively, Supplementary Fig. S1), and in single metabolites (described below in detail). In contrast to septic patients, the metabolomic profile of non-Septic-NS patients varied similarly to that of non-Septic-S patients (t-test, q > 0.05, Fig. 1C). This also suggests that Septic-NS patients may constitute a rather unique group characterized by a highly variable response to infection.
2.3. Acylcarnithine and sphingolipid concentrations associate with sepsis survival
To further elucidate specific metabolic and biochemical processes linked to sepsis survival, we performed ANOVA comparing Septic-S vs -NS groups. In total, 59 metabolites and 11 biochemical variables differed statistically significant (q value < 0.05) at days 0–3 (Fig. 2A, Supplementary Table S4). The association of different metabolite groups with survival can be clearly visualized in the analysis. Among the significantly different metabolites, 11 of 15 assayed sphingolipids were higher in Septic-S, as were 4 of 11 lysoPCs and 28 of 76 phosphatidylcholines. However, of the 17 biogenic amines measured, only putrescine was significantly different (higher in Septic-NS). The differing acylcarnitines comprised mostly of short-chain acylcarnitines and were generally higher in Septic-NS patients. This trend was also observed for amino acids (higher in Septic-NS) but the converse was seen in lipids (lysoPC, PC and SM, higher in Septic-S).
Fig. 2.

Statistical and machine learning analysis independently find C4 acylcarnitine and lysoPCs discriminative for survival from sepsis. (A) All metabolites and clinical parameters that differed significantly between Septic-S and Septic-NS, either overall on days 0–3 or at any specific day by ANOVA based on untransformed concentration values after FDR correction. The heatmap shows data between the 5th and 95th percentiles for each measurement. Grey spots mark unmeasured values. Metabolites in bold face differ also between Septic-NS and non-Septic-NS. (B/C) ROC curve and AUC values for test and validation sets after the two best features were selected by Tournament Leave Pair Out-Cross Validation-Recursive Feature Elimination (TLPOCV-RFE) using Random Forests (B) or linear Support Vector Machines (C).
Acylcarnitines are reversibly produced from their acyl-CoA counterpart by the enzymes carnitine palmitoyltransferase-1 and -2 (CPT1 and CPT2) for transport across the mitochondrial matrix. Therefore, we mapped the acylcarnitines of Septic-S vs -NS patients to their corresponding acyl-CoAs in a KEGG pathway map of lipid beta-oxidation (Supplementary Fig. S2). An increase in concentration difference with decreasing chain length was seen in the acyl-CoA metabolites as well as their downstream enoyl-CoA and hydroxyacyl-CoA molecules. C4-carnitine (butyryl-/isobutyrylcarnitine), a known biomarker for an inborn error of mitochondrial fatty acid oxidation [26], showed the highest concentration in Septic-NS (log2FC = 1.4 compared to Septic-S). Only aspartate, putrescine and the sphingolipid SM C22:3 had higher absolute fold changes (log2FC = 2.0, log2FC = 2.2 and log2FC = −1.5, respectively, compared to Septic-S at day 0).
The same general pattern of differences observed between Septic-S and -NS patients was also seen between non-Septic-S and -NS patients (Supplementary Fig. S3, Supplementary Table S4). Of note, there were no significant differences seen in lysoPCs and sphingolipids in the non-Septic groups, suggesting a possible relevance to sepsis survival. Since lysoPCs and sphingolipids are both produced from phosphatidylcholines, it is reasonable to expect that they change in tandem with phosphatidylcholine concentrations, whereas no change could indicate processes specific to infection or sepsis.
Considering individual metabolite profiles, sphingolipid SM C22:3 showed one of the largest concentration differences between Septic-S and -NS patients and also differed significantly between Septic-NS and non-Septic-NS patients (lower in Septic-NS, log2FC = −1.4, Supplementary Fig. S4, S5). This again suggests a unique metabolic process in Septic-NS patients compared to other causes of death. Similarly, lysoPC a C28:1, PC ae C32:2 and PC ae C42:1, and most of the short chain acylcarnitines also differed significantly between Septic-S and -NS patients (Fig. 2A, Supplementary Fig. S4) as well as between Septic-NS and non-Septic-NS patients (Supplementary Fig. S5). Both lysoPC a C28:1 (log2FC = −0.42) and short chain acylcarnitines in Septic-NS patients were significantly lower compared to non-Septic-NS patients. From the biochemical parameters, albumin, LDL, HDL and total cholesterol were significantly lower in Septic-NS compared to Septic-S patients (Fig. 2A, Supplementary Fig. S6, Supplementary Table S4).
2.4. Metabolomic signatures accurately predict sepsis survival
The observed differences in Septic-S and -NS patients led us to investigate whether metabolomic and biochemical profiling at day 0 could be used to accurately predict survival in septic patients. There was a perfect and near-perfect classification using Random Forest [27], [28] and linear Support Vector Machine (SVM) [29], [30] combined with leave pair out cross validation (cf. Material and Methods) on the two best features (validation AUC of 1.000 and 0.977, respectively, Fig. 2B). The Random Forest-based classification identified C4-carnitine and lysoPC a C28:1 as the most important features, while the linear SVM-based classification identified lysoPC a C28:1 and C28:0. The performance of the model for classifying non-Septic-S vs -NS patients was moderate to low with two features and even with up to six features did not exceed an AUC of 0.83 for Random Forest and 0.81 for SVM (Supplementary Table S5). This suggests that at least some of the features are not general markers for survival but specific for survival in septic patients. Although the cross-validation variant we used for validation is mathematically proven to approach the true AUC [31], the predictive power of our model remains to be confirmed in an external validation cohort to show its clinical relevance.
2.5. Deviations from a safety corridor defined by metabolomic profiles increase risk of mortality
Due to the large variability observed in Septic-NS patients we hypothesized that critical-for-survival metabolites could have been missed in the statistical comparison between Septic-S vs. -NS patients. Therefore we adopted the notion that, like glucose levels [32], an increased variability of metabolism could indicate an inappropriate host response in the critically ill. In other words, the concentration of a metabolite or a group of metabolites that deviate beyond a certain threshold from a survivor’s average range may signal metabolic dysregulation and hence an increased risk of adverse outcome.
To evaluate whether there is merit in this “safety corridor” concept, we defined the corridor as follows: for each metabolite measured in both Septic-S and non-Septic-S patients the minimum and maximum concentrations across all samples in these survival groups are determined and define the metabolite specific safety corridor. We restrict this analysis to the 125 metabolites with non-significant statistical differences between Septic-S and -NS patients. Metabolite concentrations from compared cohorts (e.g. non-surviving patients) falling outside its respective corridor range are considered deviations and are considered harmful. In fact, the number of deviations in Septic-NS patients was substantial, suggesting that important metabolites were potentially missed in our initial statistical analysis. This also confirms our above findings for a highly dysregulated metabolism in Septic-NS patients.
The dysregulation was not limited to specific components of metabolism as deviations occurred in 110 of the 125 measured metabolites, and in all metabolite groups (Supplementary Table S4). Spurious deviations caused by the small sample size might have an impact however the “safety corridor” concept appears to work similarly well when examining metabolomic data collected on septic shock patients by Ferrario et al. [16]. In fact, 65 metabolites deviated among non-surviving septic patients in both our study and that of Ferrario et al., including 3 of 4 sphingolipids, 5 of 7 lysoPCs and 2 of 3 (acyl-)carnitines, while there was little overlap in significantly differing metabolites between the two studies (Supplementary Table S6).
Some of the deviations in our patients were more common than others. Of the 125 metabolites that did not differ significantly between Septic-S and -NS patients (Supplementary Table S6) 41 deviated from the safety corridor in at least 4 of 12 NS (both septic and non-septic) patients (Fig. 3A). From these 41 metabolites, the acylcarnitine C18:1-OH and phosphatidylcholines PC ae C38:0, -C38:5, -C38:6 and -C42:0 were specific to Septic-NS and did not cross the safety corridor in any of the non-Septic-NS patients (simulation test, uncorrected p = 0.0039). There was only one metabolite group, the phosphatidylcholines, where all Septic-NS patients left the corridor. Looking at the individual metabolites 7 of 8 Septic-NS patients crossed the safety corridor for the phosphatidylcholine PC ae C42:3 (simulation test, q = 0.013) and 6 of 8 did so for PC ae C40:2 (simulation test, q = 0.013). Interestingly, there were two subsets of only two metabolites – PC ae C42:3 and C14, and PC ae C42:3 and C3:1 - where all eight Septic-NS patients crossed the safety corridor for at least one of the metabolites (simulation test, p < 0.001). For one metabolite, lysoPC a C24:0, there was a clear separation of three Septic-NS patient time courses from all other patients where the concentrations were notably above rather than below that of the survivor patients; this suggests the existence of a high-risk Septic-NS subgroup (Fig. 3B).
Fig. 3.

Deviations from a corridor of safety are abundant in lipid species even in the absence of statistical differences. Time courses of NS patients at days 0–3 where concentrations are outside the Septic- and non-Septic-NS minimum to maximum range at any day (A) in at least 4 patients and (B) for lysoPC a C 24:0. The scale in (A) is pseudo-logarithmic. Metabolites that differ significantly between the septic groups were excluded.
2.6. Data-driven beta-oxidation kinetic modelling identifies differing enzyme concentrations for Septic-NS patients
We previously demonstrated that our long-term, fluid-resuscitated fecal peritonitis rat model of sepsis can be used to predict long term survival with high accuracy as early as 3–6 h after administration of the infectious insult [24], [25]. Surviving animals show clear signs of clinical improvement at the study endpoint. Since acquiring systematically human organ data is challenging, especially with respect to living patients, but to investigate potential contributions of different organ sites to differing metabolite concentrations across different sepsis cohorts, we repeated the analyses performed on patient blood samples using samples taken from rat heart, liver and plasma at 6 h (early phase of sepsis), 24 h (established phase) and 72 h (recovery phase) (Supplementary Table S7) instead. Although no rat that died of induced sepsis could be kept alive until 72 h, several short and medium chain acylcarnitine concentrations showed the same relative difference between Septic-S and Septic-NS rats in liver and plasma already until 24 h. This indicates that plasma metabolite levels resemble to some extent liver metabolite status. Metabolites of the heart instead show this resemblance to a much lesser extent (17 out of 18 metabolites were more similar between liver and plasma than between heart and plasma at 24 h as shown by a respective lower p values derived from a t-test of ratio of means [33], Fig. 4A, Supplementary Table S8). Since rat plasma metabolite levels were indicative for liver metabolite status, and because the main (acyl-)carnitine transporter in human and rodent liver, organic cation transporter novel 2, favours acylcarnitine import from plasma [34], we parameterized a kinetic computational model of mitochondrial fatty-acid beta-oxidation with data from Septic-(NS, S) for days 0 to 3 to infer liver mitochondrial status from human plasma samples. We coupled the output of two separate versions (Septic-NS and Septic-S) of this model and fitted it to the ratio of metabolite levels for Septic-NS to the overall metabolite concentrations of Septic-NS and Septic-S (Septic-NS/(Septic-NS + Septic-S)). Computing a metabolite ratio yielded relative metabolite differences between Septic-NS and Septic-S which we assume to correlate between liver and plasma and allowed us to ignore absolute metabolite concentrations.
Fig. 4.

Acylcarnitine concentrations that correlate between plasma and liver predict consistent regulation of beta oxidation. Several acylcarnitines show the same relative change between rat Septic-S and Septic-NS in both liver and plasma; this was used in the fitting of a kinetic model of patient mitochondrial lipid beta-oxidation. (A) The relative concentration change matches for carnitine, short-chain and short/medium-chain acylcarnitines (with the exception of C4 acylcarnitine, which is an intermediate not just in beta oxidation but also in the degradation of branched chain amino acids) at both 6 h and 24 h. Error bars show the 95% confidence interval of the ratio. Only acylcarnitines present in the kinetic model of beta-oxidation are shown. We used all (acyl-)carnitine ratios to fit the model. (B) The kinetic model fitted to patient plasma concentration ratios shows regulation of the enzyme concentrations of CPT2, MCAD, CROT and MSCHAD. (C) Production of Acetyl-CoA, NADH and FADH2 is reduced in Septic-NS vs Septic-S. (D) The regulation of enzymes of mitochondrial beta-oxidation is consistent with their arrangement in the pathway. Red enzymes are downregulated, green upregulated in Septic-NS compared to Septic-S. Red arrows show reduced flux in Septic-NS. (For interpretation of the references to colour in this figure legend, the reader is referred to the web version of this article.)
By investigating fitted parameters our model predicts increased enzyme concentrations for carnitine palmitoyltransferase 2 (CPT2) and medium-chain acyl-CoA dehydrogenase (MCAD) in Septic-S for days 0 to 3 (Fig. 4B). In line with these findings hepatic mRNA expression of these two enzymes was decreased in septic compared to non-septic mice [35], [36]. In addition, we predicted substantially differing enzyme concentrations for medium/short-chain hydroxyacyl-CoA dehydrogenase (MSCHAD, elevated in Septic-S) and crotonase (CROT, elevated in Septic-NS), for which we could not find existing evidence within the literature. MSCHAD is responsible for NADH and ketoacyl-CoA production in the model, indicating reduced NADH availability in Septic-NS. In the kinetic model CROT produces hydroxyacyl-CoA of different lengths, a prerequisite to deliver NADH or acetyl-CoA for further important metabolic functions. Of note, our model predicts elevated enzyme concentrations for CROT in Septic-NS, potentially counteracting NADH and downstream acetyl-CoA deficiency, or diverting enoyl-CoAs from the alternative degradation route via the mitochondrial trifunctional protein that does not utilize short chain acyl-CoAs. In line with our enzyme concentration predictions, steady state reaction fluxes (Fig. 4C) show higher fluxes through sink reactions for acetyl-CoA, NADH, and FADH2 in Septic-S than in Septic-NS on days 1 and 2, which potentially impacts further on metabolic energy functionality (Fig. 4D).
3. Discussion
In this study we characterized and integrated biochemical and metabolomic variables in septic and non-septic cohorts and delineated differences in septic non-survivors compared to other patient groups. Although our total cohort was relatively small, we confirmed that many of the previous findings comparing early host responses in sepsis survivors and non-survivors are relatively robust. There was greater variability in the metabolomic profile of sepsis non-survivors compared to survivors using all time points (up to 28 days) hinting that negative survival fate is accompanied by dysregulated multiple metabolite concentrations. Instead of individual metabolite pertubations, this rather points to substantially impeded cellular function. This is in line with the greater metabolomic variance in septic patients who died within the first 24 h of ICU admission [20]. Examining individual metabolites and metabolic groups, concentrations of putrescine, amino acids and acylcarnitines (specifically C4-carnitine) were higher in non-survivors while lysoPCs, PCs and SMs were lower, confirming previous studies [16], [18], [20]]. In addition, Random Forest and Support Vector Machine analysis provided very good models with exceptionally high predictive accuracy to distinguish septic survivors from non-survivors using lysoPC a C28:1, C28:0 and C4-carnitine, which may be of particular importance for delineating survival risks. Of note, lysoPC a C28:1 and C28:0 have not been included as important features in previous predictive models [18], [20]. Thus, metabolomics reflect a promising avenue for “prognostic enrichment” in personalized critical care and should be studied in more depth including e.g. larger scaled patient studies.
Our predictive models had lower discriminative power when classifying non-septic survivors and non-survivors, suggesting a specific signature of metabolic features unique to septic non-survivors. While the levels of several lysoPCs and sphingolipids differed significantly between sepsis survivors and non-survivors, this was not seen in the respective non-septic groups. Sphingolipid SM C22:3 shows an exceptionally large concentration difference between sepsis survivors and non-survivors. LysoPC a C28:1, a high-ranked featured metabolite in our predictive models across different machine learning algorithms, also differed significantly in abundance between septic and non-septic non-survivors, suggesting possible unique metabolic processes in those dying from sepsis.
Furthermore, due to the large variability in metabolomic profiling of sepsis non-survivors, we hypothesized that we may have overlooked critical-for-survival biological processes within our initial statistical analyses. Therefore, we adopted the notion of a “safety corridor” where deviations from a range of concentration values for specific metabolites could have an important impact on patient outcome. Our data, as well as an analysis of a dataset in similar patients [16], suggest that septic non-survivors are outside the safety corridor for three sphingolipids (SM C16:1, SM C24:1, SM (OH) C22:1) and five lysoPCs (a C16:1, C18:0, C18:2, C20:3 and C20:4). Septic non-survivors, but none of the non-septic non-survivors, also crossed the safety corridor for seven phosphatidylcholines. To the best of our knowledge, none of these phosphatidylcholines have been previously reported to be associated with clinical outcomes in sepsis. We postulate that deviations of these phosphatidylcholines from normal levels could lead to a metabolic dysregulation in their highly-interconnected lysoPCs and sphingolipids, ultimately contributing towards outcome. Of note, for the safety corridor analysis we included only metabolites for which statistical significant differences between survivors and non-survivors could not be determined given the relatively small sample count in our study. Though this approach allowed us to investigate our data from a different angle and revealed additional more subtle signals, it also asks for further confirmation in additional, ideally larger scaled patient cohorts including also surviving and non-surviving patients with sepsis as defined in our study.
Since a primary function of the liver is enhancing energy substrate availability through oxidation of fatty acids, the idea to test lipid metabolism in patients at risk using our identified deviating lipid metabolite concentrations is appealing. Accessing the liver directly is however challenging in humans whereas metabolite levels in plasma, a much more accessible media, could serve as a proxy for liver metabolism. Using a long-term rodent model of sepsis we indeed found that plasma metabolites resemble liver metabolites substantially better than heart-associated metabolites (Fig. 4A). This led us to the idea to parameterize a kinetic model of beta-oxidation with patient data where we predicted substantially deviating concentrations for enzymes involved in producing energy relevant metabolites, such as acetyl-CoA, NADH, and FADH2. These metabolites serve as important energy donors; we previously reported that mitochondrial respiratory enzymes utilizing these substrates were significantly reduced in skeletal muscle sampled from eventual non-survivor septic patients [37]. The decreased metabolite levels suggest perturbed Krebs’ cycle activity in bioenergetically-active tissues such as liver and muscle and reflect down-regulation of key enzymes such as carnitine palmitoyltransferase or medium chain acyl-CoA-dehydrogenase at the site of infection or in remote organs. Indeed, we observed similar changes in acylcarnitines and glycerophospholipids in liver and lung homogenates in models of pneumococcal disease [38]. These metabolite levels in plasma or MSCHAD or CROT enzyme concentrations in septic patients may be biomarkers of liver mitochondrial activity and hence show potential to contribute to the accuracy of risk assessment in septic patients.
Our study has limitations in terms of the number of patients enrolled, however the cost of the large number of biochemical and metabolomic tests performed on multiple samples per patient precluded enrolment of a much larger cohort. Hence, a certain care is necessary when following up on our results, which should include confirmation in larger study cohorts. Machine learning can be used to derive biological phenotypes from routine data collected on septic patients. For example, Seymour et al. identified four clinical phenotypes that correlated with host-response patterns and clinical outcomes; subsequent simulations suggested these phenotypes could predict treatment effects [39]. Of note, and as reflective of routine clinical practice, metabolism barely featured in this analysis and was essentially limited to monitoring blood glucose, lactate, and blood urea nitrogen levels. However, a loss of metabolic homeostasis, most notably lipid and lipoprotein metabolism, is a commonplace event in critical illness [40]. Some overlap between these two distinct cohorts was however evident as the delta-phenotype described by Seymour et al [39], characterized by a greater degree of liver dysfunction and hyperlactatemia, and a poorer prognosis mirrors the conventional blood chemistry profile in our current study in those septic patients who ultimately died. As such, we extend this clinical delta-phenotype identifying metabolic derangements to the concept of metabolic ‘instability’ regarding key pathways, most notably mitochondrial and peroxisomal handling of medium and long-chain fatty acids. Fluctuations of these pathways outside the “corridor of safety” predict a poor outcome.
In conclusion, our study confirms and substantially extends the concept of a central role for (energy) metabolism to facilitate survival in sepsis (Fig. 4D). While this concept is increasingly accepted, several landmark studies targeting metabolism through enhancing oxygen availability [41], [42] or nutritional support [43] have failed to yield clear benefit. Our study provides compelling evidence for a need to monitor these critical cellular functions beyond the currently available yet highly restricted portfolio of molecules, most notably glucose, urea and lactate. Furthermore, a loss of metabolic adaptation to sepsis appears to be reflected by an instability of cellular metabolism of fatty acids as characterized by falling outside a “corridor of safety” (Fig. 5).
Fig. 5.
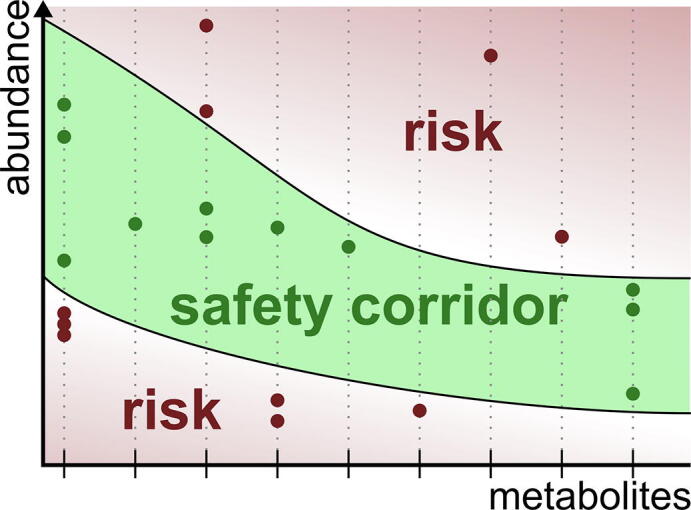
The metabolic safety corridor concept. Metabolite concentrations falling outside a corridor of safety are associated with an increased risk of mortality.
4. Materials and methods
4.1. Patients
Patients enrolled participated in the STudying Responses of the Stress System in critical illness (STRESS) study. The study was approved by the NRES Committee East of England – Norfolk, REC reference 11/EE/0180. Written consent was given by the patient, if mentally competent, or by their next-of-kin with retrospective consent gained from surviving patients after they regained mental capacity. All patients admitted to the intensive care unit (ICU) were screened on a daily basis to assess those meeting entry and exclusion criteria.
Inclusion criteria
-
•
Multi-organ failure (at least 2 organ systems involved)
-
•
Initial SOFA score >3
-
•
Predicted length of ICU stay >3 days
Exclusion criteria
-
•
>24 h hospital admission prior to ICU admission
-
•
Paediatric patients (age <18 years)
-
•
Pregnant patients
-
•
Severe psychiatric illness (patients at risk of suicide, those with schizophrenia, or those prescribed >1 anti-depressant medication)
-
•
Patients who have used cortisol altering drugs within the preceding 6 weeks prior to admission (e.g. corticosteroids)
-
•
Cirrhosis (Child Pugh B or C classification)
-
•
Severe brain injury (e.g. trauma, stroke, prolonged cardiac arrest)
Following ICU admission and enrolment into the study, clinical management was at the discretion of the treating clinicians. No treatment interventions were undertaken, and patients therefore received ‘usual’ ICU care. The patient sample size cohort characteristics can be found in Table 1.
4.2. Patients – blood sampling protocol
Blood samples were withdrawn from pre-inserted arterial lines within 6 h of ICU admission (day 0), and then repeated on days 1, 2, 3, 5 and 7 and weekly thereafter until day 28. A blood sample was also collected on the day of ICU discharge. Other than admission blood samples, all remaining samples were collected between 08:00 and 09:00 h each morning. In patients who did not have a patent arterial line, blood was instead aspirated from a central venous catheter (if present), or by venepuncture. Each blood sample consisted of 20 ml whole blood collected into previously sterilized collection vials and commercially available blood collection tubes (BCT). These consisted of one 5 ml BCT containing clot activator and gel for serum separation (BD Vacutainer Gold, BD Diagnostics, Franklin Lakes, New Jersey, USA) and one 4 ml BCT containing 4.2 mg spray-dried K2EDTA vial (BD Vacutainer Lavender). Additional 2.2 ml blood samples were collected into four sterile Eppendorf tubes; two plain tubes were used for serum samples (and allowed to clot for 30 min) and two tubes containing 2.2 mg EDTA di-potassium salt (Sigma- Aldrich, St Louis, MO, USA) for EDTA-plasma samples. An additional 1 ml blood sample was drawn into a chilled sterile Eppendorf tube containing 500 KIU/ml aprotinin (Trasylol, Bayer, Newbury, Berks, UK) and 1 mg EDTA to measure vasopressin. An additional 1 ml blood sample was drawn into a sterile Eppendorf tube containing 1 ml of the serine protease inhibitor AEBSF (Sigma-Aldrich) for measurement of unstable hormones. Hydrochloric acid (Sigma-Aldrich) was added to the AEBSF sample to a final concentration of 0.05 M post-centrifugation.
All samples except that for vasopressin were stored on ice immediately after collection and subsequently centrifuged at 6500 g for 10 min. The plasma or serum supernatants were then decanted into 200 μL aliquots, snap- frozen in liquid nitrogen and stored at −80 °C.
4.3. Patients – biochemical measurements and assays
For the measurement of biochemical parameters a range of instruments and techniques was employed. Urea, creatinine, ALT, AST, ALP, albumin, total cholesterol, HDL, LDL, triglycerides, TSH, free T3 and T4 were analyzed in clinical chemistry system (AU5800 analyzer, Beckman Coulter, Brea, California, USA). BNP, ACTH, glucagon, adrenaline and noradrenaline levels were measured by competitive ELISA (EELH0598, EELH0137, EELH2237, EELH0045 and EELH0047 respectively, Elabscience), as well as aldosterone (ADI-900-173, Enzo Life Sciences), TNT by electrochemiluminescence immunoassy (Roche Diagnostics, Basel, Switzerland), Prolactin, growth hormone, IL6, IL10 and Leptin by sandwich ELISA (EELH0141, EELR0029, Elabscience, OptEIA Sets IL-6 & IL-10, BD Biosciences Pharmingen, San Diego, CA, USA, and KHC2281, Invitrogen, respectively).
For vasopressin measurements samples were centrifuged at 1600g for 15 min at 4 °C and then frozen at −80 °C. After thawing twice the volume of ice-cold acetone was added to the sample, mixed, and then centrifuged at 12,000g for 20 min. The supernatant was transferred to a new tube. 5x the total volume of ice-cold petroleum ether was added and the solution then centrifuged at 10,000g for a further 10 min. The top layer of ether was discarded. The remaining aqueous layer was transferred to a glass tube and dried down with gaseous nitrogen. The samples were then reconstituted with assay buffer (Tris-buffered saline, TBS) and analyzed with competitive ELISA (ADI-900-017A, Enzo Life Sciences, Exeter, Devon, UK).
For testosterone measurements frozen serum samples were thawed. 1 ml of diethyl ether (Sigma-Aldrich) was added to 1 ml of serum sample. The tube was left in a fume hood and layers were allowed to separate, following which the top organic layered was siphoned off into a clean tube. This procedure was repeated three times. The diethyl ether was then evaporated under a stream of gaseous nitrogen. The extracted testosterone was dissolved in 250 μL of TBS. The reconstituted samples were analyzed with competitive ELISA (ab108666, Abcam). The same method was applied for estradiol. DHEA and cortisol were extracted using the same method and quantified using competitive ELISA (ADI-900-093, Enzo Life Sciences, and ab108665, Abcam, Cambridge, UK, respectively).
4.4. Rat sepsis model
Animal experiments were conducted using a long-term fluid-resuscitated rat fecal peritonitis model of sepsis. The study was undertaken following local ethics committee approval and a project licence granted by the UK Home Office (PPL70/7029: Organ dysfunction in critical illness states). Male Wistar rats (RGD Cat#13508588, RRID:RGD_13508588) (Charles River, Margate, Kent, UK) weighing between 325 and 375 g were housed in cages of four for a week prior to experimentation. Animals were sacrificed at either 6, 24 or 72 h with blood, liver and heart tissue sampled. These timepoints correspond to infection, established sepsis and recovery phases, respectively in this model; mortality generally occurs between 18 and 40 h with surviving animals showing clinical and biochemical signs of recovery at the study endpoint (72 h) [23], [24], [25].
All rats were assessed regularly using a validated clinical severity scoring system. A score ≥ 4 on two consecutive readings was deemed to be an indicator of excessive animal discomfort; due to welfare reasons such animals were sacrificed.
4.5. Rat model – Blood sampling protocol
Rats underwent instrumentation and echocardiography under brief general anaesthesia using isoflurane (Baxter Healthcare, Thetford, Norfolk, UK). An anaesthetic vaporiser (Vet-Tech Solutions, Congleton, Cheshire, UK) and air pump (TetraTec APS400, Tetra GmbH, Melle, Germany) were used to administer the anaesthetic. Rats were placed in a plastic induction chamber and anaesthesia induced using 5% isoflurane. Maintenance anaesthesia was achieved using 2% isoflurane with animals spontaneously breathing through a nose cone. Rats were then positioned supine on a heated mat with continuous monitoring of core temperature via a rectal thermometer (TES 1319, TES Electrical Electronic Corp, Taipei, Taiwan). Body temperature was maintained between 36.0 and 37.5 °C while under anaesthesia.
A chemical depilatory cream was used to remove hair from the neck and chest (Nair, Church and Dwight, Folkestone, Kent, UK). Preoperative skin preparation was completed using a commercially available mix of 2% chlorhexidine gluconate and 70% isopropyl alcohol (ChloraPrep, CareFusion, San Diego, CA, USA). A sterile skin drape was used and all surgical procedures performed with strict aseptic technique. A 2 cm vertical incision in the centre of the neck was used to obtain access to the right internal jugular vein and the left common carotid artery. Both vessels were cannulated with 0.96 mm outer diameter PVC tubing (Biocorp Ltd, Huntingdale, NSW, Australia) and secured in place with two 3–0 silk sutures. This allowed continuous blood pressure monitoring and blood sampling through the arterial line, and fluid resuscitation through the venous line. Both lines were tunnelled subcutaneously to the nape of the neck and attached to a dual channel swivel and button tether system (InsTech Solomon, Plymouth Meeting, PA, USA) which was secured to the skin using four 2–0 silk sutures. The skin incision site was sutured using 3–0 silk sutures. To provide analgesia rats were given a subcutaneous injection of 0.05 mg/kg buprenorphine (Vetergesic, Reckitt Benckiser, York, UK) prior to recovery.
Following recovery from anaesthesia, animals were individually housed in metabolic cages with the swivel-tether system attached to a balancing arm. This allowed the rats unfettered movement in their cages with access to food and water ad libitum. Room temperature was kept at 21.1 ± 1.1 °C, humidity between 40 and 70%, and a 12-hour light–dark cycle was maintained.
Both venous and arterial lines were flushed continuously to maintain patency with 0.1 ml/h of 0.9% saline (Baxter Healthcare, Thetford, Norfolk, UK). The arterial line was connected to a pressure transducer (SensoNOR SP844, Memscap, Skoppum, Norway) and blood pressure recorded continuously onto a Powerlab system (AD Instruments, Chalgrove, Oxon, UK).
4.6. Fecal peritonitis
Stool samples were obtained from six healthy non-vegetarian human volunteers and pooled together. Samples were collected in styrofoam containers, weighed and stored on ice. Collected faecal material was continuously fumigated with nitrogen in order to maintain an anaerobic environment. The collected material was diluted 1:1 with a suspension of thioglycolate (14.5 g/500 ml distilled water) and catalase (0.19 mg/100 ml) to optimize bacterial growth and inactivate reactive oxygen species. For cryoconservation 10% glycerine was added and the suspension homogenized under anaerobic conditions. The resulting material was divided into 0.5 ml aliquots and frozen at −80 °C. Prior to use each aliquot was thawed and diluted 1:7 with 0.9% saline to form faecal slurry. Sepsis was induced in the rats by intraperitoneal (i.p.) injection of faecal slurry using a 19-gauge needle injected in the right lower quadrant of the abdomen. This was performed prior to recovery from anaesthesia, but after instrumentation. Sham operated controls received no i.p. placebo injection to avoid inadvertent bowel perforation. An initial pilot study ascertained the dose of fecal slurry producing a 24 h mortality rate of approximately 40%. This mortality rate was selected as it reflects the mortality rate of human fecal peritonitis. It would also allow sufficient group sizes for comparisons between survivors and non-survivors for at least 24 h.
4.7. Fluid regimen
Fluid resuscitation (10 ml/kg/h) was initiated at two hours post-injection of faecal slurry. A 50:50 mix of Hartmann’s solution (a crystalloid solution closely isotonic to blood, containing sodium, chloride, potassium and calcium ions, and lactate) and 5% glucose were infused via the indwelling venous catheter. This fluid infusion rate was reduced to 5 ml/kg/h at 48 h. An identical fluid regimen was used for control animals. Glucose was added to avoid hypoglycemia.
4.8. Echocardiography
All rats underwent baseline transthoracic echocardiography (TTE) prior to insertion of vascular catheters. TTE was also performed at 6 h after induction of sepsis and a final examination at the end-point of the experiment. TTE was performed using a Vivid 7 Dimension device (GE Healthcare, Bedford, Beds, UK) and a 10 MHz sector transducer (Vivid 10S, GE Healthcare). All variables were recorded under a brief period of 1.2% isoflurane anaesthesia. Stroke Volume and Cardiac Output used for prediction of Sepsis outcome was calculated as described elsewhere [24].
4.9. Rat model – biochemical measurements and assays
For arterial blood gas measurements we collected a 0.2 ml baseline blood sample from the arterial line into a heparinized capillary tube. Subsequent samples were collected at 6, 24 and 72 h. A 0.4 ml fluid bolus of 50:50 Hartmann’s and 5% glucose was administered to the animal after each sampling. The arterial blood was used to measure pH, PaO2, PaCO2, bicarbonate, base excess, total haemoglobin, sodium, potassium, ionized calcium, chloride and lactate (ABL-700, Radiometer, Copenhagen, Denmark). Rat troponin levels were measured by sandwich ELISA (EELR0151, Elabscience Biotechnology Co, Beijing, China). BNP levels were measured by competitive ELISA in rat samples (RAB0386, Sigma-Aldrich). Measurement of cystatin C was performed using a sandwich ELISA technique (EELR0304, Elabscience).
Markers of liver dysfunction were measured in rat samples by the biochemistry laboratory in the Royal Free Hospital, as mentioned earlier for patient samples. These markers included measurement of liver transaminases, alkaline phosphatase, bilirubin and albumin. To assess the anterior pituitary hormone, ACTH, measurement in serum samples was undertaken using a competitive ELISA technique (EELR0048, Elabscience). TSH was measured in rat samples using a sandwich ELISA (EELR0976, Elabscience). Rat growth hormone was analysed using a solid phase sandwich ELISA (Rat GH EIA Kit, Invitrogen Corporation, Camarillo, California, USA). Prolactin measurement was also performed using a sandwich ELISA method (EELR0052, Elabscience). Vasopressin and oxytocin were extracted is in patient samples. For determination of rat oxytocin levels, a competitive ELISA kit was used (CSB-E14197R, Cusabio Biotech, Maryland, USA). Levels of free T3 and T4 in rat samples were measured using competitive ELISA kits (EELR1097 and EELR0390, Elabscience). Aldosterone levels were measured in EDTA plasma samples using competitive ELISA kits (ADI-900-173, Enzo Life Sciences). For measurement of rat levels of corticosterone (or cortisol) we followed the same procedure as for patient samples. Rat corticosterone levels were measured using a competitive ELISA kit (ADI-900-097, Enzo Life Sciences). Progesterone levels were determined using a competitive ELISA technique (CSB-E07282r, Cusabio). The procedure for testosterone measurement is the same as in patients. Rat testosterone levels were measured using a competitive ELISA kit (ADI-900-065, Enzo Life Sciences), 17β-estradiol measurements also involved an extraction procedure - identical to that described for testosterone. Measurement in rat samples was undertaken using a competitive ELISA method (ADI-900-008, Enzo Life Sciences). Similarly, DHEA also required hormone extraction from blood samples (again using the same technique). DHEA levels were measured using competitive ELISA kits (ADI-900-093, Enzo Life Sciences). For ghrelin measurements blood samples were drawn into pre-chilled tubes containing AEBSF to a final concentration of 1 mg/mL. These samples were centrifuged at 3000 g for 15 min at 4 °C. Serum was then transferred to separate tubes and acidified with HCl (Sigma-Aldrich) to a final concentration of 0.05 M. Samples were then snap frozen in liquid nitrogen and stored at −80 °C for later analysis by ELISA. Ghrelin was measured in rat samples using commercially available sandwich ELISA kits (EMD Millipore). Leptin was measured in rat and human samples using a sandwich ELISA method (KRC2281 and KHC2281, Invitrogen). Epinephrine measurement in EDTA plasma samples was performed using competitive ELISA kits (EELR0045, Elabscience). For determining levels of norepinephrine, a similar kit was used (EELR0047, Elabscience) Measurement of the cytokines IL-6 and IL-10 was undertaken using sandwich ELISA kits (OptEIA Sets IL-6 & IL-10, BD Biosciences Pharmingen, San Diego, CA, USA). Measurement of both complement C3a and C5a in rat samples was performed using sandwich ELISA (EELR0255 and EELR0257, Elabscience). Glucose and lactate measurements were performed using arterial blood samples that were analysed in a commercially available blood gas machine (ABL-700, Radiometer, Copenhagen, Denmark). Insulin levels were measured in EDTA plasma samples using sandwich ELISA methods (EZRMI-13K and EZHI-14K, EMD Millipore). For measurement of glucagon competitive ELISA methods were used for both rat and patient studies (EELR0425, Elabscience).
Measurement of ketone bodies (total, 3-hydroxybutyrate and aceto-acetone) was performed using a cyclic enzymatic method (Wako Chemicals GmbH, Neuss, Germany). Samples were measured on a 96-well microtitre plate in triplicate. To each sample, a buffer mixture was added (containing phosphate buffer pH7.0 and acetoacetate decarboxylase), resulting in acetoacetone breakdown to acetone. Subsequent addition of thionicotinamide adenine dinucleotide (Thio-NAD) and the enzyme 3-hydroxybutyrate dehydrogenase (3-HBDH) resulted in oxidation of 3-HB. Since the original acetoacetone in the sample had been removed, only 3-HB was assayed by measuring the rate of Thio-NADH production spectrophotometrically.
For measuring glycerol and free fatty acids coupled enzymatic reactions were used in commercially available kits (Cayman Chemical Company, Michigan, USA). The glycerol assay involved a series of enzymatic chemical reactions that resulted in glycerol phosphorylation, and subsequent oxidation, ultimately producing hydrogen peroxide. The hydrogen peroxide then reacted with 4-aminoantipyrine (4-AAP) and N-ethyl-N-(3-sulfopropyl)-m-anisidine (ESPA) resulting in production of a brilliant purple product, which could be measured in the wells of a microtitre plate using a plate reader set at 540 nm. A standard curve using glycerol reference standards was used to calculate sample glycerol concentrations.
Free fatty acids (FFA) were measured in a fluorometric assay that involved a series of coupled enzymatic reactions (Cayman Chemical Company, Michigan, USA). Acyl CoA synthetase first catalysed FFA acylation of coenzyme A. The acyl CoA produced was oxidised by acyl CoA oxidase and generated hydrogen peroxide. Hydrogen peroxide reacted with horseradish peroxidase to generate the highly fluorescent product resorufin. Resorufin fluorescence was measured using a fluorometric plate reader, with an excitation wavelength of 530–540 nm and an emission wavelength of 585–595 nm. A standard curve using FFA reference standards was used to calculate sample FFA concentrations.
HDL cholesterol, LDL cholesterol and triglycerides were measured on an industrial clinical chemistry system (AU5800 analyzer, Beckman Coulter, Brea, California, USA).
4.10. Metabolomic measurements
For targeted metabolomics of patient and rat samples, in brief, 188 metabolites (acylcarnitines, amino acids, biogenic amines, glycerophospholipids, sphingolipids, and sugars) were quantified in plasma using the AbsoluteIDQ™ kit p180 (Biocrates Life Science AG, Innsbruck, Austria) according to the manufacturer‘s protocol on an API4000 liquid chromatography tandem mass spectrometry (LC-MS/MS) system (AB Sciex, Framingam, MA) equipped with an electrospray ionization source, a CTC PAL autosampler (CTC Analytics AG, Switzerland), and the Analyst 1.6.2 software (AB Sciex). Further treatment details are described elsewhere [44]. The MetIQ software package, which is an integral part of the AbsoluteIDQ™ kit (Biocrates Life Science AG, Innsbruck, Austria), was used for evaluation of calibration curves, quality controls and samples. For statistical analysis concentrations were exported. Using nonphysiological or similar standards some of the metabolites, especially glycerophospholipids, were determined only semiquantitatively.
4.11. Quantification and statistical analysis
Dimensionality reduction was done with PCA based on the sample distance matrix. We chose the Canberra distance as the distance metric to deal with the skewness common within metabolomics data [45]. The significance of group differences in the resulting PCA biplots and patient centroids was calculated using PERMANOVA with the vegan package with euclidean distance on the reduced data points. The bias from group imbalance was circumvented by averaging p-values over at least 1000 repeats of random sampling with equal proportions.
For patients, statistical analysis of biochemical parameter and metabolite time courses at days 0–3 was performed using repeated measures two-way mixed effects type-III ANOVA [46] with the categorical effects day, survival and their interaction. We controlled for multiple hypotheses testing using FDR correction for each metabolite. We reported metabolites and biochemical parameters when the q value for the survival effect or its interaction with day was < 0.05. To further find those days at which significant differences occurred we used Tukey HSD from the multcomp package [47]. For rat samples, statistical analysis of biochemical parameter and metabolite time courses at times 6 h and 24 h was done using repeated two-way mixed effects type-III ANOVA [46] with the categorical effects timepoint, survival and their interaction. We controlled for multiple hypotheses testing using FDR correction for each metabolite. We report metabolites and biochemical parameters when the q value for the survival effect or its interaction with timepoint was below 0.05. To further find the time points at which significant differences occur we used Tukey HSD from the multcomp package [47].
Survival prediction was done with Random Forests and linear support vector machines (SVMs) from the ranger [28] and e1073 [48] packages, respectively. Tournament Leave Pair Out Cross Validation (TLPO-CV) procedure [31] together with recursive feature elimination in an inner TLPO-CV loop was used to most effectively use given samples for feature selection and validation. Briefly, for each sample pair in the outer TLPO-CV loop, TLPO-CV was performed on all sample pairs that do not use the samples from the outer sample pair and the variable importance was averaged across all inner sample pairs. The least important variables were removed stepwise until two variables remained. The classification performance obtained in the inner TLPO-CV loop was then validated in the outer TLPO-CV loop on sample pairs not used in the inner TLPO-CV loops.
Augmented KEGG pathway maps [49] were created with the Pathview package [50].
Significance tests of the number of deviations from the corridor of safety for patients and for metabolites were done by simulation tests as follows. All measurement values were replaced by random lognormal values from the same distribution and the number of deviations counted. This was repeated 1000 times and the fraction of occurrence of deviation counts calculated. P values were then calculated as the sum of fractional occurrences for deviations as extreme or more extreme and assigned to each metabolite according to their true deviation count. Q values were calculated from the p values of all metabolites as the FDR.
Kinetic metabolic modelling was done by combining COPASI 4.25 (COPASI, RRID:SCR_014260) [51] and the COPASI R Connector version 0.5. The parameter fit was set up in COPASI with a five-fold increase and decrease from the preset Vmax values [52] as upper and lower bounds for Vmax parameters, and a two-fold increase and decrease as upper and lower bounds for the initial concentrations to support the physiological relevance of the model. For each day we fitted the ratio of Septic-S concentration to total concentrations of Septic-S and Septic-NS on the actual day and the next day. Every consecutive day reused the fitting outcome of the previous day. The fitting itself was done by first applying an evolutionary strategy and, secondly, the Hooke-Jeeves algorithm. To deduce enzyme concentrations from model simulations we allowed the model to fit maximum velocity parameters (Vmax) which are a product of total enzyme concentration and the fixed velocity constant of a single enzyme molecule. Hence, higher fitted Vmax values indicate increased enzyme concentrations as enzymatic maximum turnover rates are limited. We deduced reaction fluxes and concentrations from steady state analysis. To ensure robustness we repeated the parameter fitting 100 times with random start values.
5. Data and code availability
The published article includes all datasets generated and analysed during this study. The complete code used to analyse the data generated during this study is available at github (https://github.com/SchSascha/KhaliqGrossmann2020_sepsis_metabolomics).
CRediT authorship contribution statement
Waqas Khaliq: Conceptualization, Data curation, Investigation, Methodology, Project administration, Validation, Writing - review & editing. Peter Großmann: Formal analysis, Methodology, Visualization, Writing - original draft, Writing - review & editing. Sophie Neugebauer: Data curation, Formal analysis, Investigation, Writing - review & editing. Anna Kleyman: Investigation, Writing - review & editing. Roberta Domizi: Data curation, Investigation, Writing - review & editing. Sara Calcinaro: Data curation, Investigation, Writing - review & editing. David Brealey: Data curation, Investigation, Methodology, Project administration, Writing - review & editing. Markus Gräler: Supervision, Writing - review & editing. Michael Kiehntopf: Methodology, Supervision, Writing - review & editing. Sascha Schäuble: Methodology, Supervision, Visualization, Writing - review & editing. Mervyn Singer: Conceptualization, Funding acquisition, Methodology, Project administration, Resources, Supervision, Writing - original draft, Writing - review & editing. Gianni Panagiotou: Project administration, Resources, Supervision, Writing - original draft, Writing - review & editing. Michael Bauer: Conceptualization, Funding acquisition, Project administration, Resources, Supervision, Writing - original draft, Writing - review & editing.
Declaration of Competing Interest
The authors declare that they have no known competing financial interests or personal relationships that could have appeared to influence the work reported in this paper.
Acknowledgements
GPA, MB and PG would like to thank Deutsche Forschungsgemeinschaft (DFG – www.dfg.de) CRC/Transregio 124 “Pathogenic fungi and their human host: Networks of interaction”, subproject INF. GPA and MB would like to thank the Deutsche Forschungsgemeinschaft (DFG – www.dfg.de) cluster of excellence “Balance of the Microverse” DFG-EXC 2051. The funders had no role in study design, data collection and analysis, decision to publish, or preparation of the manuscript.
Footnotes
Supplementary data to this article can be found online at https://doi.org/10.1016/j.csbj.2020.11.009.
Contributor Information
Mervyn Singer, Email: m.singer@ucl.ac.uk.
Gianni Panagiotou, Email: Gianni.Panagiotou@leibniz-hki.de.
Michael Bauer, Email: Michael.Bauer@med.uni-jena.de.
Appendix A. Supplementary data
The following are the Supplementary data to this article:
Supplementary figure 1.

Global metabolic signatures in metabolic groups. PCA biplots per metabolite group show the same order as that in Fig. 1B for lysophosphatidylcholins, phosphatydilcholines and sphingolipids. Arrows show correlations of biplot scores with single metabolites. Only the 5 strongest correlating metabolites are shown. Arrows are scaled for legibility. (A) C3-DC (C4-OH): Malonylcarnitine (Hydroxybutyrylcarnitine), C14:2: Tetradecadienoylcarnitine, C16: Palmitoylcarnitine, C18:1: Octadecenoylcarnitine, C18:2: Octadecadienoylcarnitine. (B) Asp: Asparagin, Met: Methionine, Trp: Tryptophan, Pro: Prolin, Val:Valin. (C) DOPA: Dihydroxyphenylalanine. (D) LysoPC a: acyl lysophosphatidylcholine. (E) PC aa: diacyl phosphatidylcholine, PC ae: acyl-alkyl phosphatidylcholine. (F) SM: sphingomyelin, SM (OH): hydroxysphingomyelin.
Supplementary figure 2.
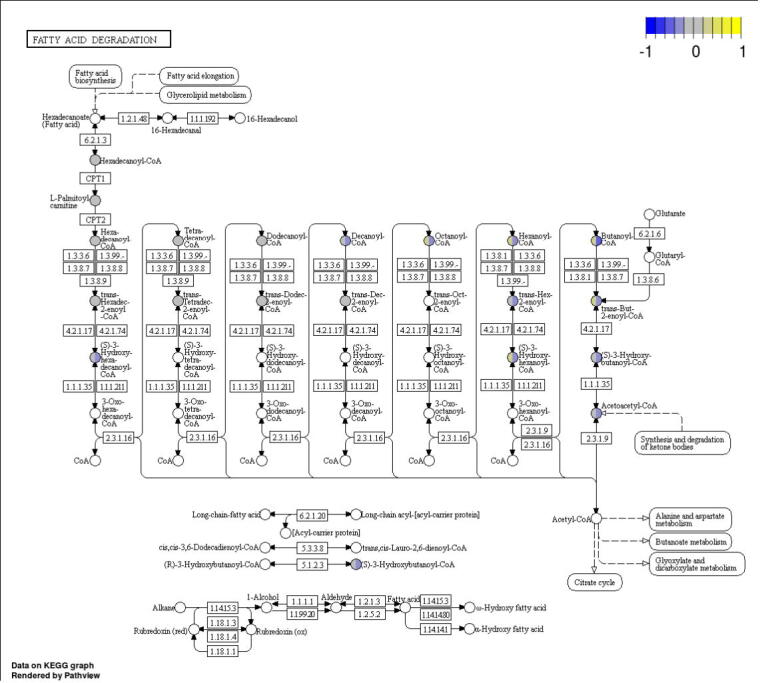
Acylcarnitine difference between Septic-S and Septic-NS increases with decreasing fatty acid chain length. Acylcarnitines show an increasing concentration difference between Septic-S and Septic-NS with decreasing chain length when mapped to their corresponding acyl-CoA in the KEGG pathway map of mitochondrial beta-oxidation (map00071). Left halves correspond to Septic-NS, right halves to Septic-S. Concentrations were z-scored, tanh-transformed to map into the [−1, +1]-interval and averaged by mean for both patient groups.
Supplementary figure 3.

Time courses of individual metabolites showing significant differences between non-Septic-S and non-Septic-NS. Statistical significance is determined by repeated measures ANOVA. Lines indicate the mean. The grey section indicates the 25th and 75th percentile (grey line the mean) of considered metabolites in a healthy French population of 800 volunteers [53]. Only day 0–3 data are shown.
Supplementary figure 4.

Time courses of individual metabolites in Septic-S and Septic-NS showing significant differences between groups. Statistical significance is determined by repeated measures ANOVA. Lines indicate mean. Stars indicate significance in a Tukey HSD post-hoc test for a specific day. The grey section indicates the 25th and 75th percentile (grey line the mean) of considered metabolites in a healthy French population of 800 volunteers [53]. Only day 0–3 data are shown.
Supplementary figure 5.

Time courses of individual metabolites in Septic-NS and non-Septic-NS showing significant differences between groups. Statistical significance is determined by repeated measures ANOVA. Lines indicate mean. The grey section indicates the 25th and 75th percentile (grey line the mean) of considered metabolites in a healthy French population of 800 volunteers [53]. Only days 0–3 are shown.
Supplementary figure 6.

Time courses of individual biochemical parameters showing significant differences between Septic-S and Septic-NS. Statistical significance is determined by repeated measures ANOVA. Lines indicate mean.
Detailed patient characteristics.
Overview of measured metabolite, their name, metabolite group and concentration unit, and overview biochemical parameters and their concentrations unit.
Patient biochemical and metabolomic data.
Comparison of Septic-S vs Septic-NS, and non-Septic (-S + -NS) vs Septic (-S + -NS), and of Septic-NS vs non-Septic-NS and non-Septic-S vs non-Septic-NS. P values from repeated measures ANOVA for each experimental factor and the corresponding q values after FDR correction.
Machine Learning Model performance on non-Septic patients. Performance of Random Forest and SVM trained on Septic-S vs Septic-NS on a test set of non-Septic-S and non-Septic-NS with 2–6 features.
Number of patients deviating for each metabolite in our study and that of Ferrario et al. [16].
Rat sepsis model biochemical and metabolomic data.
Comparison of concentration ratios of Septic-S vs Septic-NS in plasma and liver, and in plasma and heart.
References
- 1.Singer M., Deutschman C.S., Seymour C.W., Shankar-Hari M., Annane D., Bauer M. The third international consensus definitions for sepsis and septic shock (Sepsis-3) JAMA. 2016;315(8):801. doi: 10.1001/jama.2016.0287. [DOI] [PMC free article] [PubMed] [Google Scholar]
- 2.Fleischmann C., Scherag A., Adhikari N.K.J., Hartog C.S., Tsaganos T., Schlattmann P. Assessment of global incidence and mortality of hospital-treated sepsis. Current estimates and limitations. Am J Respiratory Crit Care Med. 2016;193(3):259–272. doi: 10.1164/rccm.201504-0781OC. [DOI] [PubMed] [Google Scholar]
- 3.Prescott H.C., Angus D.C. Enhancing recovery from sepsis: a review. JAMA. 2018;319(1):62–75. doi: 10.1001/jama.2017.17687. [DOI] [PMC free article] [PubMed] [Google Scholar]
- 4.Martin G.S., Mannino D.M., Moss M. The effect of age on the development and outcome of adult sepsis. Crit Care Med. 2006;34(1):15–21. doi: 10.1097/01.ccm.0000194535.82812.ba. [DOI] [PubMed] [Google Scholar]
- 5.Marriott I., Huet-Hudson Y.M. Sexual dimorphism in innate immune responses to infectious organisms. Immunol Res. 2006;34(3):177–192. doi: 10.1385/IR:34:3:177. [DOI] [PubMed] [Google Scholar]
- 6.Sinapidis D., Kosmas V., Vittoros V., Koutelidakis I.M., Pantazi A., Stefos A. Progression into sepsis: an individualized process varying by the interaction of comorbidities with the underlying infection. BMC Infect Dis. 2018;18(1):242. doi: 10.1186/s12879-018-3156-z. [DOI] [PMC free article] [PubMed] [Google Scholar]
- 7.Rautanen A., Mills T.C., Gordon A.C., Hutton P., Steffens M., Nuamah R. Genome-wide association study of survival from sepsis due to pneumonia: an observational cohort study. Lancet Resp Med. 2015;3(1):53–60. doi: 10.1016/S2213-2600(14)70290-5. [DOI] [PMC free article] [PubMed] [Google Scholar]
- 8.Schrag SJ, Farley MM, Petit S, Reingold A, Weston EJ, Pondo T, et al. Epidemiology of invasive early-onset neonatal sepsis, 2005 to 2014. Pediatrics. 2016;138(6):e20162013-e. [DOI] [PubMed]
- 9.Angus D.C., van der Poll T. Severe sepsis and septic shock. N Engl J Med. 2013;369(9):840–851. doi: 10.1056/NEJMra1208623. [DOI] [PubMed] [Google Scholar]
- 10.Antti H., Fahlgren A., Näsström E., Kouremenos K., Sundén-Cullberg J., Guo Y. Metabolic profiling for detection of Staphylococcus aureus infection and antibiotic resistance. PLoS ONE. 2013;8 doi: 10.1371/journal.pone.0056971. [DOI] [PMC free article] [PubMed] [Google Scholar]
- 11.Lv H., Liu L., Zhang Y., Song T., Lu J., Chen X. Ingenuity pathways analysis of urine metabonomics phenotypes toxicity of gentamicin in multiple organs. Mol BioSyst. 2010;6(10):2056–2067. doi: 10.1039/c0mb00064g. [DOI] [PubMed] [Google Scholar]
- 12.Zhu J., Zhang M., Han T., Wu H., Xiao Z., Lin S. Exploring the biomarkers of sepsis-associated encephalopathy (SAE): metabolomics evidence from gas chromatography-mass spectrometry. Biomed Res Int. 2019 doi: 10.1155/2019/2612849. [DOI] [PMC free article] [PubMed] [Google Scholar]
- 13.Lee J, Banerjee D. Metabolomics and the Microbiome as Biomarkers in Sepsis. Crit Care Clin. 2020 Jan;36(1):105–113. doi: 10.1016/j.ccc.2019.08.008. [DOI] [PubMed] [Google Scholar]
- 14.Fernández-García M, Rojo D, Rey-Stolle F, García A, Barbas C. Metabolomic-Based Methods in Diagnosis and Monitoring Infection Progression. Experientia Supplementum. Springer International Publishing; 2018. pp. 283–315. [DOI] [PMC free article] [PubMed] [Google Scholar]
- 15.Cambiaghi A., Pinto B.B., Brunelli L., Falcetta F., Aletti F., Bendjelid K. Characterization of a metabolomic profile associated with responsiveness to therapy in the acute phase of septic shock. Sci Rep. 2017;7(1):9748. doi: 10.1038/s41598-017-09619-x. [DOI] [PMC free article] [PubMed] [Google Scholar]
- 16.Ferrario M., Cambiaghi A., Brunelli L., Giordano S., Caironi P., Guatteri L. Mortality prediction in patients with severe septic shock: a pilot study using a target metabolomics approach. Sci Rep. 2016;6(1):20391. doi: 10.1038/srep20391. [DOI] [PMC free article] [PubMed] [Google Scholar]
- 17.Garcia-Simon M., Morales J.M., Modesto-Alapont V., Gonzalez-Marrachelli V., Vento-Rehues R., Jorda-Miñana A. Prognosis biomarkers of severe sepsis and septic shock by 1H NMR urine metabolomics in the intensive care unit. PLoS ONE. 2015;10(26565633) doi: 10.1371/journal.pone.0140993. [DOI] [PMC free article] [PubMed] [Google Scholar]
- 18.Liu Y., Hou J.-h., Li Q., Chen K.-j., Wang S.-N., Wang J.-m. Biomarkers for diagnosis of sepsis in patients with systemic inflammatory response syndrome: a systematic review and meta-analysis. SpringerPlus. 2016;5(1):2091. doi: 10.1186/s40064-016-3591-5. [DOI] [PMC free article] [PubMed] [Google Scholar]
- 19.Seymour C.W., Yende S., Scott M.J., Pribis J., Mohney R.P., Bell L.N. Metabolomics in pneumonia and sepsis: an analysis of the GenIMS cohort study. Intensive Care Med. 2013;39:1423–1434. doi: 10.1007/s00134-013-2935-7. [DOI] [PMC free article] [PubMed] [Google Scholar]
- 20.Langley R.J., Tsalik E.L., van Velkinburgh J.C., Glickman S.W., Rice B.J., Wang C. An integrated clinico-metabolomic model improves prediction of death in sepsis. Sci Transl Med. 2013;5(195) doi: 10.1126/scitranslmed.3005893. 195ra95-ra95. [DOI] [PMC free article] [PubMed] [Google Scholar]
- 21.Bowden J.A., Heckert A., Ulmer C.Z., Jones C.M., Koelmel J.P., Abdullah L. Harmonizing lipidomics: NIST interlaboratory comparison exercise for lipidomics using SRM 1950 metabolites in frozen human plasma. J Lipid Res. 2017;58(12):2275–2288. doi: 10.1194/jlr.M079012. [DOI] [PMC free article] [PubMed] [Google Scholar]
- 22.Simón-Manso Y., Lowenthal M.S., Kilpatrick L.E., Sampson M.L., Telu K.H., Rudnick P.A. Metabolite profiling of a NIST standard reference material for human plasma (SRM 1950): GC-MS, LC-MS, NMR, and clinical laboratory analyses, libraries, and web-based resources. Anal Chem. 2013;85(24):11725–11731. doi: 10.1021/ac402503m. [DOI] [PubMed] [Google Scholar]
- 23.Brealey D., Karyampudi S., Jacques T.S., Novelli M., Stidwill R., Taylor V. Mitochondrial dysfunction in a long-term rodent model of sepsis and organ failure. Am J Physiol-Regulatory, Integr Comp Physiol. 2004;286(3):R491–R497. doi: 10.1152/ajpregu.00432.2003. [DOI] [PubMed] [Google Scholar]
- 24.Rudiger A., Dyson A., Felsmann K., CJ E., Taylor V., Hughes S. Early functional and transcriptomic changes in the myocardium predict outcome in a long-term rat model of sepsis. Clin Sci. 2013;124(6):391–401. doi: 10.1042/CS20120334. [DOI] [PubMed] [Google Scholar]
- 25.Zolfaghari P.S., Pinto B.B., Dyson A., Singer M. The metabolic phenotype of rodent sepsis: cause for concern? Intensive Care Med Exp. 2013;1(1):6. doi: 10.1186/2197-425X-1-6. [DOI] [PMC free article] [PubMed] [Google Scholar]
- 26.van Maldegem B.T., Wanders R.J.A., Wijburg F.A. Clinical aspects of short-chain acyl-CoA dehydrogenase deficiency. J Inherit Metab Dis. 2010;33(5):507–511. doi: 10.1007/s10545-010-9080-z. [DOI] [PMC free article] [PubMed] [Google Scholar]
- 27.Breiman L. Random forests. Machine Learn. 2001;45(1):5–32. [Google Scholar]
- 28.Wright M.N., Ziegler A. ranger: a fast implementation of random forests for high dimensional data in C++ and R. J Stat Softw. 2017;77(1):1–17. [Google Scholar]
- 29.Cortes C., Vapnik V. Support-vector networks. Machine Learn. 1995;20(3):273–297. [Google Scholar]
- 30.Meier M.A., Ottiger M., Vögeli A., Steuer C., Bernasconi L., Thomann R. Activation of the tryptophan/serotonin pathway is associated with severity and predicts outcomes in pneumonia: results of a long-term cohort study. Clin Chem Lab Med. 2017;55:1060. doi: 10.1515/cclm-2016-0912. [DOI] [PubMed] [Google Scholar]
- 31.Perez I.M., Airola A., Boström P.J., Jambor I., Pahikkala T. Tournament leave-pair-out cross-validation for receiver operating characteristic analysis. Stat Methods Med Res. 2019;28(10–11):2975–2991. doi: 10.1177/0962280218795190. [DOI] [PMC free article] [PubMed] [Google Scholar]
- 32.Bagshaw S.M., Bellomo R., Jacka M.J., Egi M., Hart G.K., George C. The impact of early hypoglycemia and blood glucose variability on outcome in critical illness. Crit Care. 2009;13(3):R91. doi: 10.1186/cc7921. [DOI] [PMC free article] [PubMed] [Google Scholar]
- 33.Tamhane A.C., Logan B.R. Finding the maximum safe dose level for heteroscedastic data. J Biopharm Stat. 2004;14(4):843–856. doi: 10.1081/BIP-200035413. [DOI] [PubMed] [Google Scholar]
- 34.Pochini L., Scalise M., Galluccio M., Indiveri C. OCTN cation transporters in health and disease. J Biomol Screen. 2013;18(8):851–867. doi: 10.1177/1087057113493006. [DOI] [PubMed] [Google Scholar]
- 35.Feingold K.R., Moser A., Patzek S.M., Shigenaga J.K., Grunfeld C. Infection decreases fatty acid oxidation and nuclear hormone receptors in the diaphragm. J Lipid Res. 2009;50:2055–2063. doi: 10.1194/jlr.M800655-JLR200. [DOI] [PMC free article] [PubMed] [Google Scholar]
- 36.Maitra U., Chang S., Singh N., Li L. Molecular mechanism underlying the suppression of lipid oxidation during endotoxemia. Mol Immunol. 2009;47:420–425. doi: 10.1016/j.molimm.2009.08.023. [DOI] [PMC free article] [PubMed] [Google Scholar]
- 37.Carré J.E., Orban J.-C., Re L., Felsmann K., Iffert W., Bauer M. Survival in critical illness is associated with early activation of mitochondrial biogenesis. Am J Respir Crit Care Med. 2010;182(6):745–751. doi: 10.1164/rccm.201003-0326OC. [DOI] [PMC free article] [PubMed] [Google Scholar]
- 38.Weber M., Lambeck S., Ding N., Henken S., Kohl M., Deigner H.P. Hepatic induction of cholesterol biosynthesis reflects a remote adaptive response to pneumococcal pneumonia. FASEB J. 2012;26(6):2424–2436. doi: 10.1096/fj.11-191957. [DOI] [PubMed] [Google Scholar]
- 39.Seymour C.W., Kennedy J.N., Wang S., Chang C.-C.H., Elliott C.F., Xu Z. Derivation, validation, and potential treatment implications of novel clinical phenotypes for sepsis. JAMA. 2019;321(20):2003–2017. doi: 10.1001/jama.2019.5791. [DOI] [PMC free article] [PubMed] [Google Scholar]
- 40.Kiehntopf M., Nin N., Bauer M. Metabolism, metabolome, and metabolomics in intensive care: is it time to move beyond monitoring of glucose and lactate? Am J Respir Crit Care Med. 2013;187(9):906–907. doi: 10.1164/rccm.201303-0414ED. [DOI] [PubMed] [Google Scholar]
- 41.Rivers E., Nguyen B., Havstad S., Ressler J., Muzzin A., Knoblich B. Early goal-directed therapy in the treatment of severe sepsis and septic shock. N Engl J Med. 2001;345(19):1368–1377. doi: 10.1056/NEJMoa010307. [DOI] [PubMed] [Google Scholar]
- 42.PRISM Investigators Early, goal-directed therapy for septic shock. A patient-level meta-analysis. N Engl J Med. 2017;376(23):2223–2234. doi: 10.1056/NEJMoa1701380. [DOI] [PubMed] [Google Scholar]
- 43.Casaer M.P., den Berghe G.V. Nutrition in the acute phase of critical illness. N Engl J Med. 2014;370(13):1227–1236. doi: 10.1056/NEJMra1304623. [DOI] [PubMed] [Google Scholar]
- 44.Schmerler D., Neugebauer S., Ludewig K., Bremer-Streck S., Brunkhorst F.M., Kiehntopf M. Targeted metabolomics for discrimination of systemic inflammatory disorders in critically ill patients. J Lipid Res. 2012;53:1369–1375. doi: 10.1194/jlr.P023309. [DOI] [PMC free article] [PubMed] [Google Scholar]
- 45.Dixon P.M., Wu L., Widrlechner M.P., Wurtele E.S. Iowa State University; IA: 2009. Weighted Distance Measures for Metabolomic Data. [Google Scholar]
- 46.Fox J., Weisberg S. 2nd ed. Sage; Thousand Oaks CA: 2011. An R companion to applied regression. [Google Scholar]
- 47.Hothorn T., Bretz F., Westfall P. Simultaneous inference in general parametric models. Biometrical J. 2008;50(3):346–363. doi: 10.1002/bimj.200810425. [DOI] [PubMed] [Google Scholar]
- 48.Meyer D, Dimitriadou E, Hornik K, Weingessel A, Leisch F. e1071: Misc Functions of the Department of Statistics, Probability Theory Group (Formerly: E1071), TU Wien. 2018.
- 49.Kanehisa M., Furumichi M., Tanabe M., Sato Y., Morishima K. KEGG: new perspectives on genomes, pathways, diseases and drugs. Nucleic Acids Res. 2016;45(D1):D353–D361. doi: 10.1093/nar/gkw1092. [DOI] [PMC free article] [PubMed] [Google Scholar]
- 50.Luo W., Brouwer C. Pathview: an R/Bioconductor package for pathway-based data integration and visualization. Bioinformatics. 2013;29(14):1830–1831. doi: 10.1093/bioinformatics/btt285. [DOI] [PMC free article] [PubMed] [Google Scholar]
- 51.Hoops S., Sahle S., Gauges R., Lee C., Pahle J., Simus N. COPASI – a COmplex PAthway SImulator. Bioinformatics. 2006;22(24):3067–3074. doi: 10.1093/bioinformatics/btl485. [DOI] [PubMed] [Google Scholar]
- 52.van Eunen K., Volker-Touw C.M.L., Gerding A., Bleeker A., Wolters J.C., van Rijt W.J. Living on the edge: substrate competition explains loss of robustness in mitochondrial fatty-acid oxidation disorders. BMC Biol. 2016;14(1):107. doi: 10.1186/s12915-016-0327-5. [DOI] [PMC free article] [PubMed] [Google Scholar]
- 53.Trabado S., Al-Salameh A., Croixmarie V., Masson P., Corruble E., Fève B. The human plasma-metabolome: Reference values in 800 French healthy volunteers; impact of cholesterol, gender and age. PLoS ONE. 2017;12 doi: 10.1371/journal.pone.0173615. [DOI] [PMC free article] [PubMed] [Google Scholar]
Associated Data
This section collects any data citations, data availability statements, or supplementary materials included in this article.
Supplementary Materials
Detailed patient characteristics.
Overview of measured metabolite, their name, metabolite group and concentration unit, and overview biochemical parameters and their concentrations unit.
Patient biochemical and metabolomic data.
Comparison of Septic-S vs Septic-NS, and non-Septic (-S + -NS) vs Septic (-S + -NS), and of Septic-NS vs non-Septic-NS and non-Septic-S vs non-Septic-NS. P values from repeated measures ANOVA for each experimental factor and the corresponding q values after FDR correction.
Machine Learning Model performance on non-Septic patients. Performance of Random Forest and SVM trained on Septic-S vs Septic-NS on a test set of non-Septic-S and non-Septic-NS with 2–6 features.
Number of patients deviating for each metabolite in our study and that of Ferrario et al. [16].
Rat sepsis model biochemical and metabolomic data.
Comparison of concentration ratios of Septic-S vs Septic-NS in plasma and liver, and in plasma and heart.
Data Availability Statement
The published article includes all datasets generated and analysed during this study. The complete code used to analyse the data generated during this study is available at github (https://github.com/SchSascha/KhaliqGrossmann2020_sepsis_metabolomics).