

Abstract
PURPOSE
Hepatocellular carcinoma (HCC) is characterized by a poor prognosis and a high recurrence rate. The tumor immune microenvironment in HCC has been characterized as shifted toward immunosuppression. We conducted a genomic data-driven classification of immune microenvironment HCC subtypes. In addition, we demonstrated their prognostic value and suggested a potential therapeutic targeting strategy.
METHODS
RNA sequencing data from The Cancer Genome Atlas–Liver Hepatocellular Carcinoma was used (n = 366). Abundance of immune cells was imputed using CIBERSORT and visualized using unsupervised hierarchic clustering. Overall survival (OS) was analyzed using Kaplan-Meier estimates and Cox regression. Differential expression and gene set enrichment analyses were conducted on immune clusters with poor OS and high programmed death-1 (PD-1)/programmed death-ligand 1 (PD-L1) coexpression. A scoring metric combining differentially expressed genes and immune cell content was created, and its prognostic value and immune checkpoint blockade response prediction was evaluated.
RESULTS
Two clusters were characterized by macrophage enrichment, with distinct M0Hi and M2Hi subtypes. M2Hi (P = .038) and M0Hi (P = .018) were independently prognostic for OS on multivariable analysis. Kaplan-Meier estimates demonstrated that patients in M0Hi and M2Hi treated with sorafenib had decreased OS (P = .041), and angiogenesis hallmark genes were enriched in the M0Hi group. CXCL6 and POSTN were overexpressed in both the M0Hi and the PD-1Hi/PD-L1Hi groups. A score consisting of CXCL6 and POSTN expression and absolute M0 macrophage content was discriminatory for OS (intermediate: hazard ratio [HR], 1.59; P ≤ .001; unfavorable: HR, 2.08; P = .04).
CONCLUSION
Distinct immune cell clusters with macrophage predominance characterize an aggressive HCC phenotype, defined molecularly by angiogenic gene enrichment and clinically by poor prognosis and sorafenib response. This novel immunogenomic signature may aid in stratification of unresectable patients to receive checkpoint inhibitor and antiangiogenic therapy combinations.
Context
Key Objective
To leverage robust bioinformatics techniques that enable characterization of the tumor immune microenvironment in a hepatocellular carcinoma (HCC) cohort and ultimately integrate matched clinical data to identify immune phenotypes associated with poor survival and therapeutic response.
Knowledge Generated
Distinct macrophage-enriched clusters were identified, and these patients demonstrated worse survival both irrespective of adjuvant treatment and in the setting of adjuvant sorafenib. Furthermore, angiogenesis-related genes were overexpressed, especially in M0 macrophage-enriched and programmed death-1Hi/programmed death-ligand 1Hi (PD-L1Hi) subgroups, and two of these genes—CXCL6 and POSTN—were combined with M0 macrophage content to create a signature predictive of poor overall survival and response to immune checkpoint blockade.
Relevance
Patients with HCC are in need of more effective treatment strategies in the first-line unresectable and recurrent settings. This immunogenomic profiling approach could inform a predictive biomarker strategy to identify patients better suited to receive anti-angiogenic and anti–PD-L1 therapy in combination, rather than either as monotherapy.
INTRODUCTION
Of all cancers, hepatocellular carcinoma (HCC) has the most rapidly increasing incidence of new patients1 despite its risk factors being mostly modifiable.2-4 Incidence rates in the United States are projected to continue increasing through 2030,2 and HCC has the second-lowest 5-year survival rate of all cancers.1 Cirrhosis progressively reduces liver function, which limits definitive surgical treatment options and contributes to poor prognosis.5 In those with resectable disease, median overall survival (OS) is 48 and 44 months for women and men, respectively.6 Patients treated with resection display a 5-year survival rate of 70%, but a 5-year recurrence rate of 68%.7 Recurrence is thus a significant cause of morbidity and mortality in patients with HCC and is classified as either intrahepatic metastasis (IM) or de novo lesions. IM is tied to tumor factors such as size and vascular invasion, and de novo recurrence is linked to patient factors such as cirrhosis and Ishak inflammatory activity.7
In a meta-analysis evaluating adjuvant therapy, Wang et al8 found a 5-year recurrence rate of 82% (55%-94%) after resection, transplantation, or ablation and a 5-year OS of 48% (29%-75%), regardless of agent or mode of administration. The high recurrence rate of HCC necessitates the development of more effective adjuvant therapies. Therapeutic modalities effective for advanced primary disease have not demonstrated the same efficacy after hepatectomy with curative intent. Sorafenib is the standard of care for advanced disease,9 but when investigated in the postresection setting in the STORM trial, it failed to improve recurrence-free survival (RFS) compared with placebo.10 Identification of new HCC subclasses based on the tumor microenvironment is a promising approach to inform an effective biomarker and therapeutic targeting paradigm.11
The advent of genomic sequencing has enabled more detailed characterization of the HCC tumor microenvironment at a molecular and cellular level. In a landmark article describing the HCC molecular landscape, the Cancer Genome Atlas (TCGA) research network 12 characterized the immune microenvironment in HCC as shifted from cytotoxic T cells (CD8+ T cells) to immune-suppressive CD4+ regulatory T cells (T regs). In addition, tumor tissues were found to display enrichment of resting mast cells, dendritic cells, and undifferentiated M0 macrophages, regardless of hepatitis status.12
The aggressive nature of HCC and poor outcomes in the postresection setting coupled with the necessity to better characterize the inflammatory microenvironment to inform future treatment strategies motivated this study. We leveraged publicly available RNA sequencing (RNASeq) data from TCGA to impute immune cell subsets within the HCC cohort using CIBERSORT. We then conducted unsupervised hierarchic clustering on the individual samples and identify two macrophage-enriched subgroups, both of which were found to be prognostic of poor survival and sorafenib response. We then identified hallmark gene sets overexpressed in these clusters and used members of these gene sets and immune content to create a composite score predictive of immunotherapy response.
METHODS
Study Design and Data Retrieval
We conducted a retrospective analysis of all patients with a diagnosis of HCC in the TCGA–Liver Hepatocellular Carcinoma (LIHC) project cohort with available mRNA expression data (n = 366). No patient with metastatic disease at the time of pathologic diagnosis was included in the study. All analyses were performed using the R software for statistical computing (R Version 3.6.3, Vienna, Austria).
The TCGAbiolinks package was used to retrieve data from the National Cancer Institute Genomic Data Commons repository.13-15 Clinical and drug treatment data were retrieved using the same process.
Clustering Based on Immune Cell Subpopulations
The TCGA-LIHC dataset contains clinical, genetic, and pathologic data. A mixture file containing RNASeq analysis by Expectation-Maximization (RSEM) gene expression data from the samples in TCGA-LIHC was downloaded from cBioPortal and processed with the CIBERSORTx in silico flow cytometry tool.16-18 Configuration for running CIBERSORTx is outlined in the Data Supplement. The R package ComplexHeatmap 19 was used to perform hierarchic clustering on the individual samples in the dataset; the clustering distance metric was set to maximum distance between rows, and the clustering method chosen was Ward’s minimum variance. Additional visualization of immune cell composition of the samples was accomplished via the ggplot2 package, and a correlation matrix was constructed using the ggcorrplot package.
Survival Analysis by Clusters
The primary outcome was OS, defined as the time since pathologic diagnosis to death or loss to follow-up. Information concerning adjuvant treatment course included drug name and time elapsed between pathologic diagnosis and beginning and end of a treatment course. OS after conclusion of a treatment course was calculated by subtracting end date from date of death or loss to follow-up. Patients still alive were censored at the time of last follow-up. Each endpoint was assessed using the Kaplan-Meier method, and survival curves were compared using the Mantel-Cox log-rank test. Multivariable Cox proportional hazard regression analysis was performed with an endpoint of OS and visualized by forest plot. Adjuvant drug therapies received by patients in the TCGA-LIHC cohort are outlined in the Data Supplement.
Gene Set Enrichment Analysis
Differentially expressed gene (DEG) analysis was performed using the Shiny web application, GENAVI.20 Raw count and metadata files were created, and DEG analysis was performed using the DESeq2 method, with cluster 1 as reference. Log twofold change values were used for downstream gene set enrichment analysis (GSEA) analysis with MSigDb pathways, specifically the H: hallmark gene sets collection.21 The ranked gene list was derived using logtwofold change. The P value cutoff for the GSEA enrichment score was set at .05. The GSEA was repeated using this methodology for clusters 2-4, and gene sets that achieved significance were extracted. The ComplexHeatmap package was then used to visualize the enrichment scores of significantly over-represented or underrepresented gene sets in each cluster.
Development of Immunogenomic Signature
To expand the analytic pipeline, the iGEAK tool kit was leveraged.22 DEG analysis was performed using the limma package and voom function. Two separate analyses were performed, one of which used clusters 3 and 4, and the other used high coexpression of programmed death-1 (PD-1) and programmed-ligand 1 (PD-L1) as the experimental groups. Cutoffs for DEG analysis were a fold change of 2 and P value of .05 (default), adjusted by the Benjamini-Hochberg procedure. Variables selected for the immunogenomic signature included M0 macrophages as well as CXCL6 and POSTN. This scoring methodology was modeled after the Sullivan’s scoring system, as outlined by Chen et al.23 Additional information is included in the Data Supplement.
Prediction of Immunotherapy Response
To overcome the limited publicly available matched transcriptome and immune checkpoint blockade (ICB) treatment data, the Tumor Immune Dysfunction and Exclusion (TIDE) tool was used. TIDE uses a gene expression signature to predict response to ICB.24 Z-score transformed RSEM data were input into the tool. TIDE performance has been validated on melanoma and non–small-cell lung cancer datasets, and can be extrapolated to other cancer types based on the theoretical underlying assumptions of the model. Output included prediction of immunotherapy response and scores correlating with expression of gene signatures associated with immune dysfunction.
RESULTS
Hierarchic Clustering Based on Immune Cell Subsets Identifies Macrophage-Enriched Clusters
Patients were clustered based on relative fractions of immune cell subsets: cluster 1 (macrophageMid, C4Hi; n = 125; 34%), cluster 2 (macrophageMid, CD8Hi; n = 46; 13%), cluster 3 (macrophageHi, M2Hi; n = 125; 34%), and cluster 4 (macrophageHi, M0Hi; n = 68; 19%), as shown in Figure 1A. Absolute immune content is displayed in Figure 1B. M0 macrophages comprise 29% of total immune content in cluster 4, whereas mean M2 macrophage content in cluster 3 is 34%. The mean absolute immune content score in clusters 3 (2.83) and 4 (2.63) is lower than in clusters 1 (2.93) and 2 (3.12). Figure 1C displays a correlation matrix between the immune cell subsets. M0 macrophage content was found to be positively correlated with T regs (R2 = 0.3; P = 1.1 × 10⁻⁶) and negatively correlated with natural killer cells (R2 = −0.2; P = 1.7 × 10⁻³]. These same relationships were not observed for other macrophage classes.
FIG 1.
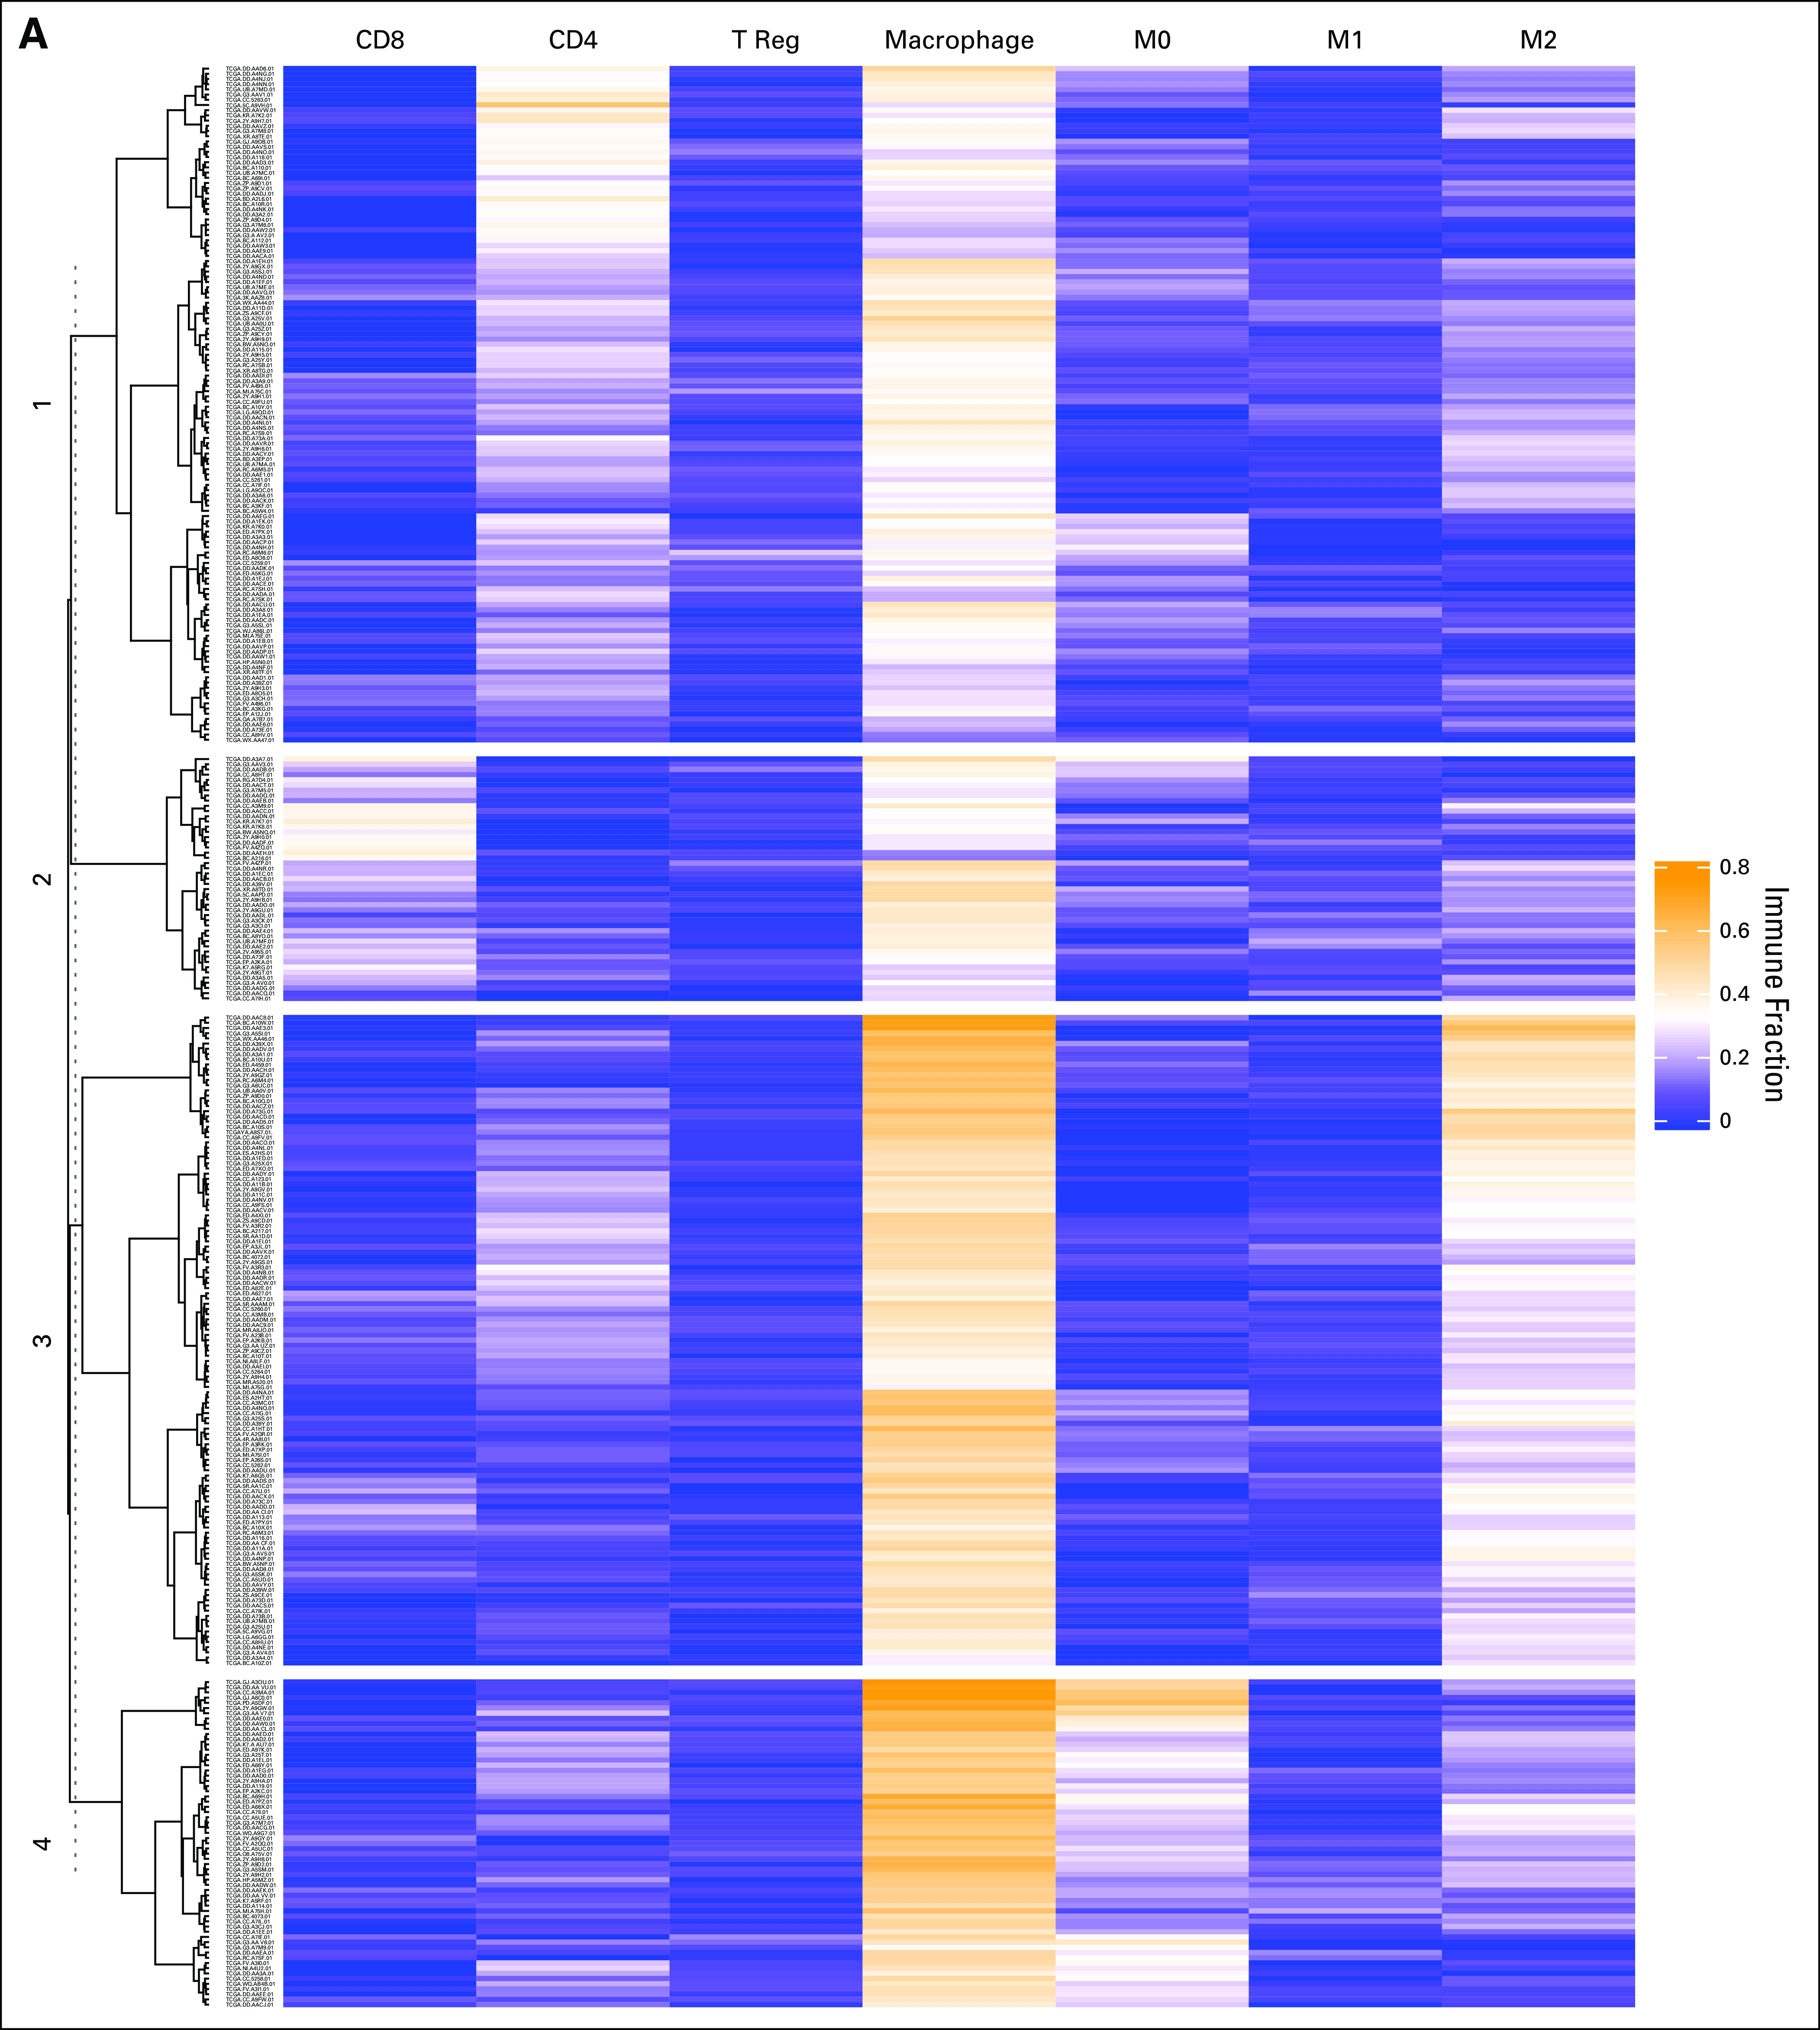
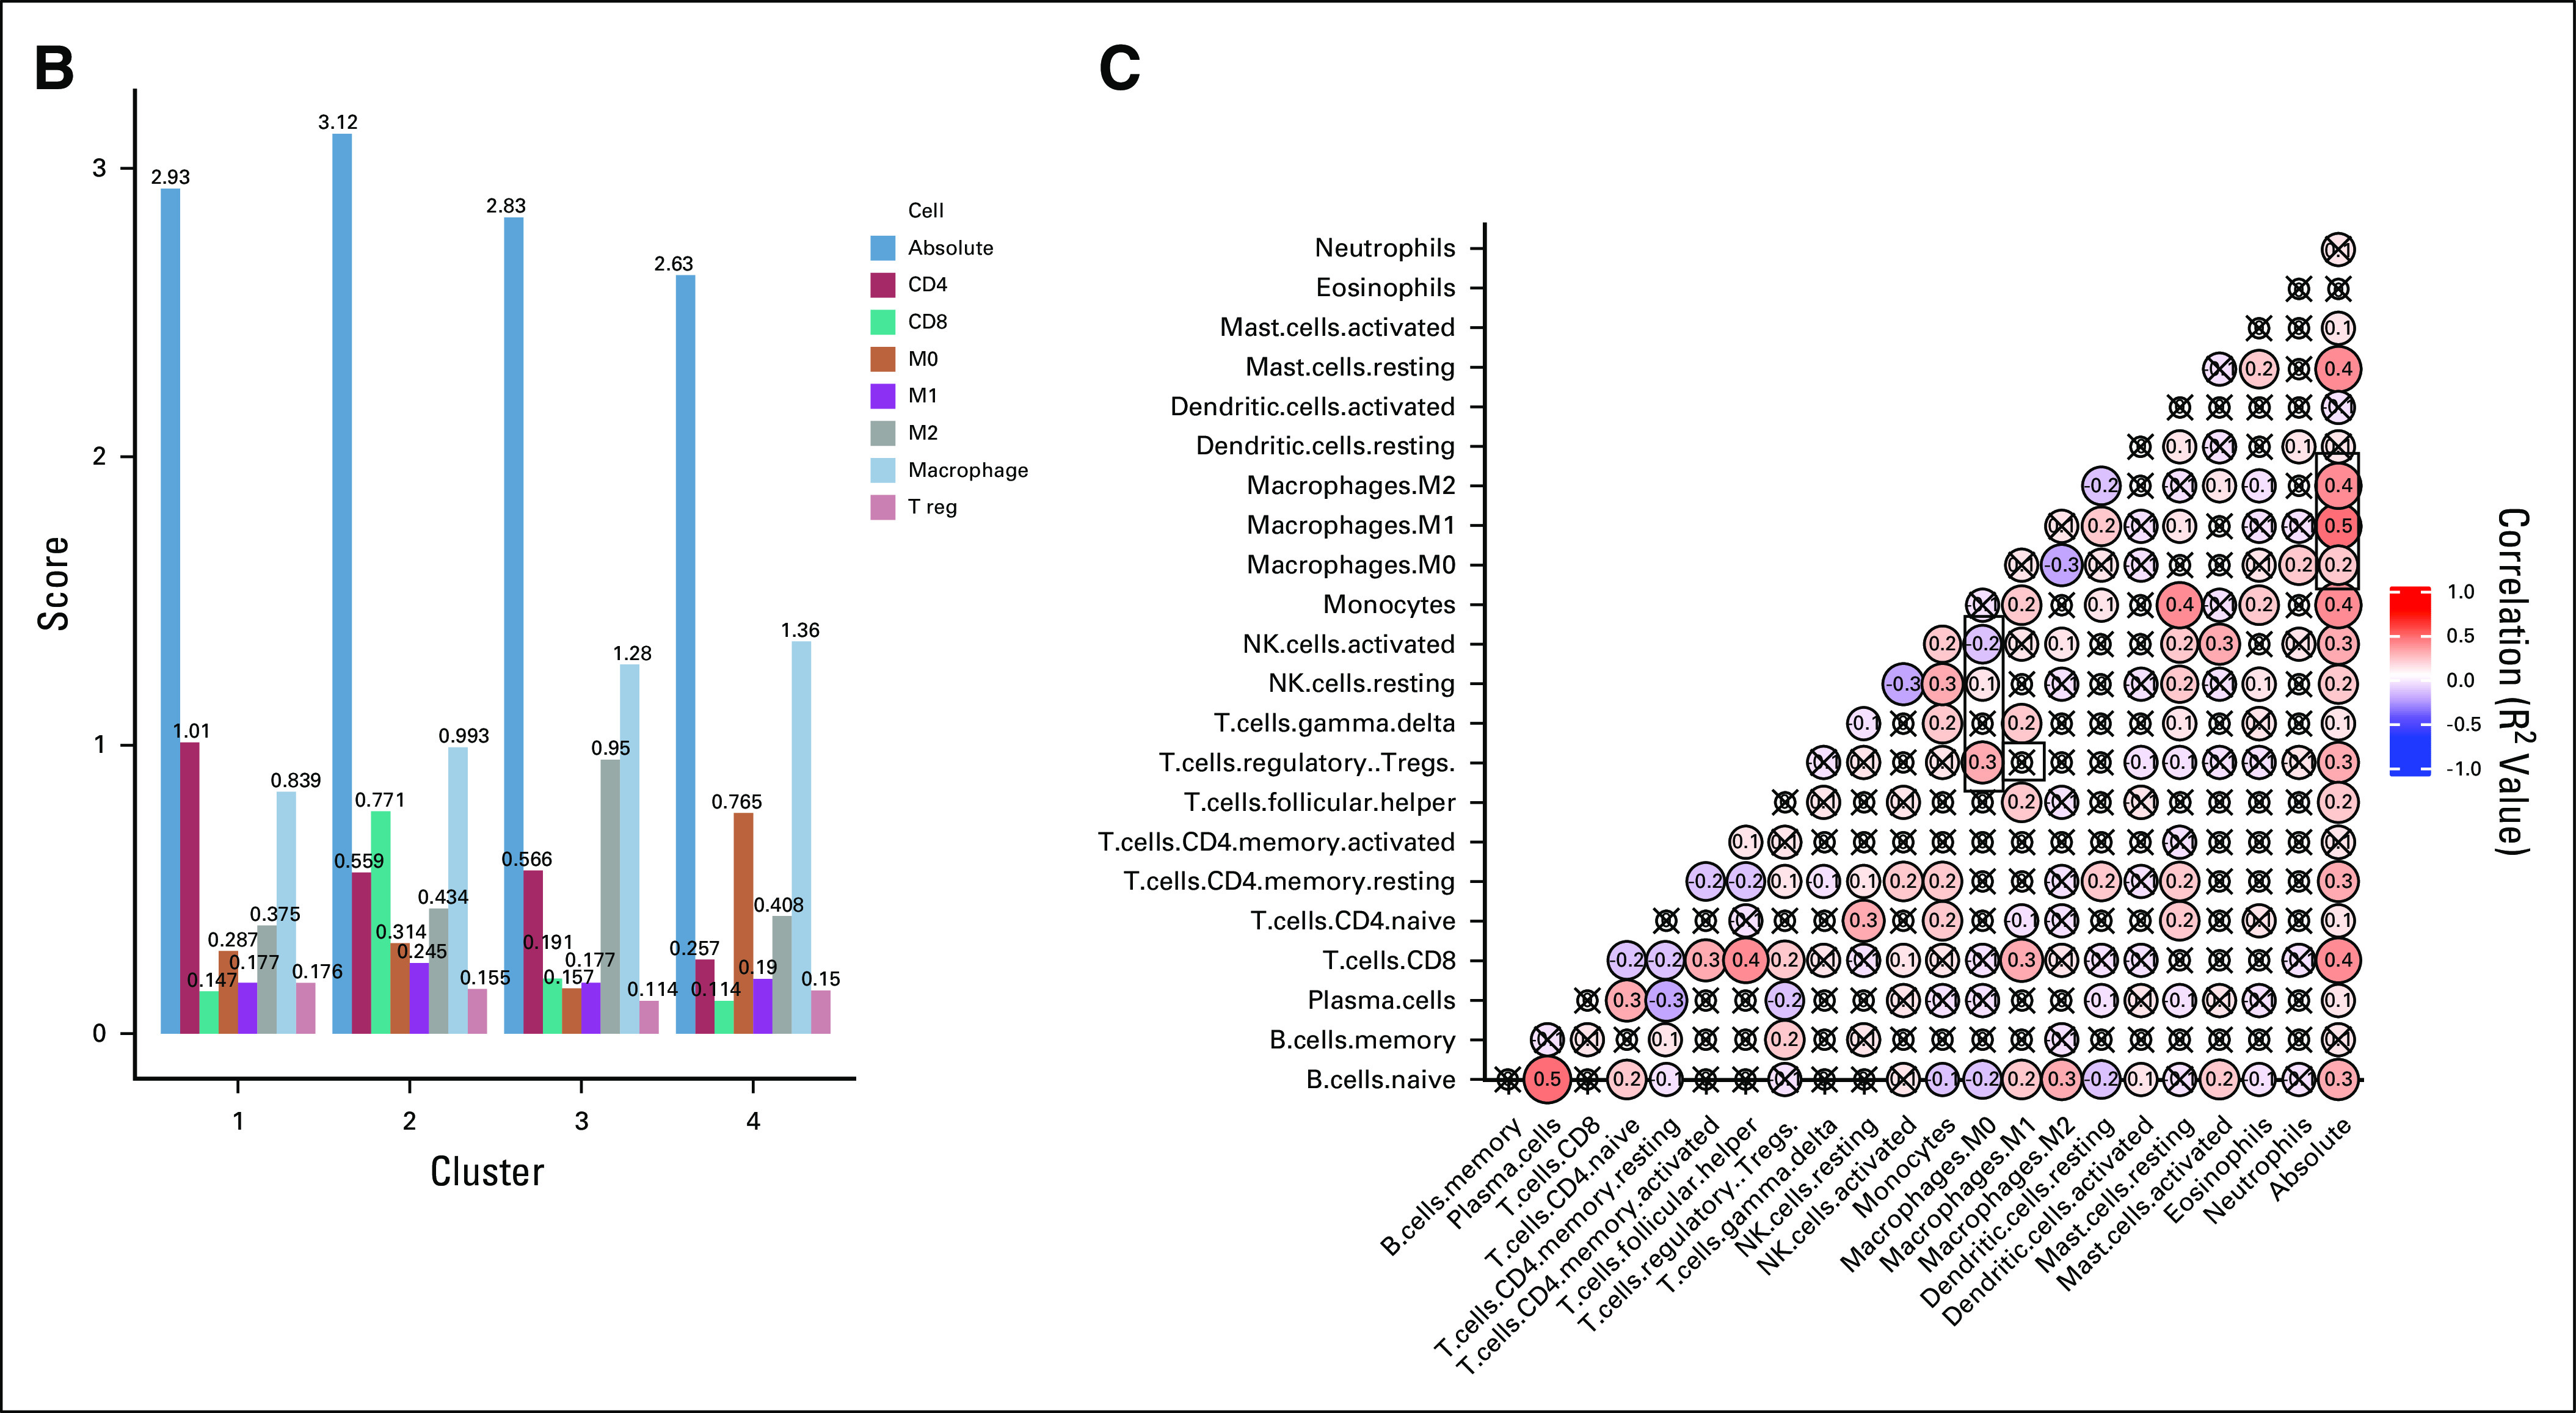
Hierarchic clustering based on immune cell subsets identifies macrophage-enriched clusters. (A) The results of unsupervised hierarchic clustering based on immune cell subsets comprising each sample in the Cancer Genome Atlas–Liver Hepatocellular Carcinoma (TCGA-LIHC) dataset. The columns correspond with immune cell subsets, and the rows represent patient sample IDs. Yellow shading represents higher relative fraction, whereas blue shading represents lower relative fraction. The clusters are defined as follows: cluster 1: macrophageMid and C4Hi; cluster 2: macrophageMid and CD8Hi; cluster 3: macrophageHi and M2Hi; and cluster 4: macrophageHi and M0Hi. (B) The mean absolute immune scores, derived from CIBERSORT, presented as a barplot grouped by clusters. Bars are colored according to the corresponding immune cell. (C) A correlation matrix of correlation coefficients for all possible immune cell subset pairings. Red shading represents positive correlation, whereas blue shading represents negative correlation. The size of each bubble and the intensity of the shading correspond to the magnitude of the correlation coefficient. Correlations that did not meet significance are marked with an x. T reg, regulatory T cells.
M0 Macrophage Enrichment is Associated With Decreased OS and Response to Adjuvant Therapy, Including Sorafenib
A multivariable model including clustering results and clinical characteristics (Table 1) such as sex, weight, race, alpha-fetoprotein (AFP), albumin-bilirubin score, and risk factors including alcohol, hepatitis B and C, and nonalcoholic fatty liver disease revealed that cluster 3 (hazard ratio [HR], 2.04; 95% CI, 1.04 to 3.99; P = .04) and cluster 4 (HR, 2.62; 95% CI, 1.18 to 5.84; P = .02) are associated with increased hazard of death. Other significant covariates were pathologic stage IVA-B (HR, 5.99; 95% CI, 1.55 to 23.23); P = .01), Asian race (HR, 0.32; 95% CI, 0.14 to 0.75; P = .009), and hepatitis C (HR, 2.28; 95% CI, 1.10 to 4.73; P = .027; Fig 2A). Although AFP was not independently associated with significantly increased hazard of death (Fig 2A), when combined with cluster, the group with AFP > 400 and belonging to cluster 4 displayed an increased hazard of death (HR, 4.10; 95% CI, 1.77 to 9.5; P < .001; Fig 2B).
TABLE 1.
Clinical and Pathologic Characteristics of TCGA-LIHC Patients by Cluster

FIG 2.

Macrophage enrichment is associated with decreased overall survival and response to adjuvant therapy, including sorafenib. (A) Multivariable analysis with hazard ratio (HR) represented as a forest plot adjusting for key covariates, including clinical and pathologic characteristics, risk factors, and immune cluster. The covariates are listed in the left column, whereas HRs, CIs, and P values are in the right column. (B) A multivariable analysis for the combination of alpha-fetoprotein (AFP) and cluster. The left column lists the various combinations, with A representing an AFP < 400 ng/mL and B representing an AFP > 400 ng/mL. The corresponding number represents the cluster. AIC, Aikake information criterion. * P = .01-.05; ** P = .001-.01; *** P = .0-.001.
The median follow-up time for all patients was 26.5 months and was similar across clusters (30, 28.2, 25.2, 21) for clusters 1-4, respectively. Overall, 129 patients (35%) had died at the time of this study as a result of their HCC. Median time since pathologic diagnosis to death was 80.7, 81.7, 46.8, and 41.8 months in cluster 1-4, respectively (P = .019; Fig 3A). When clusters were grouped, median survival was 80.7 months in cluster 1-2 and 45.6 months in cluster 3-4 (P = .0025; Fig 3B). In the subset of patients treated with adjuvant drug therapy (n = 40; 62 unique treatment events), median time since conclusion of treatment course to death was 33.2 months in cluster 1-2 and 4.4 months in cluster 3-4 (P = .003; Fig 3C). In those treated with sorafenib (n = 28; 29 unique treatment events), median time since conclusion of treatment to death was 29.9 months for cluster 1-2 and 2.6 months for cluster 3-4 (P = .041; Fig 3D).
FIG 3.
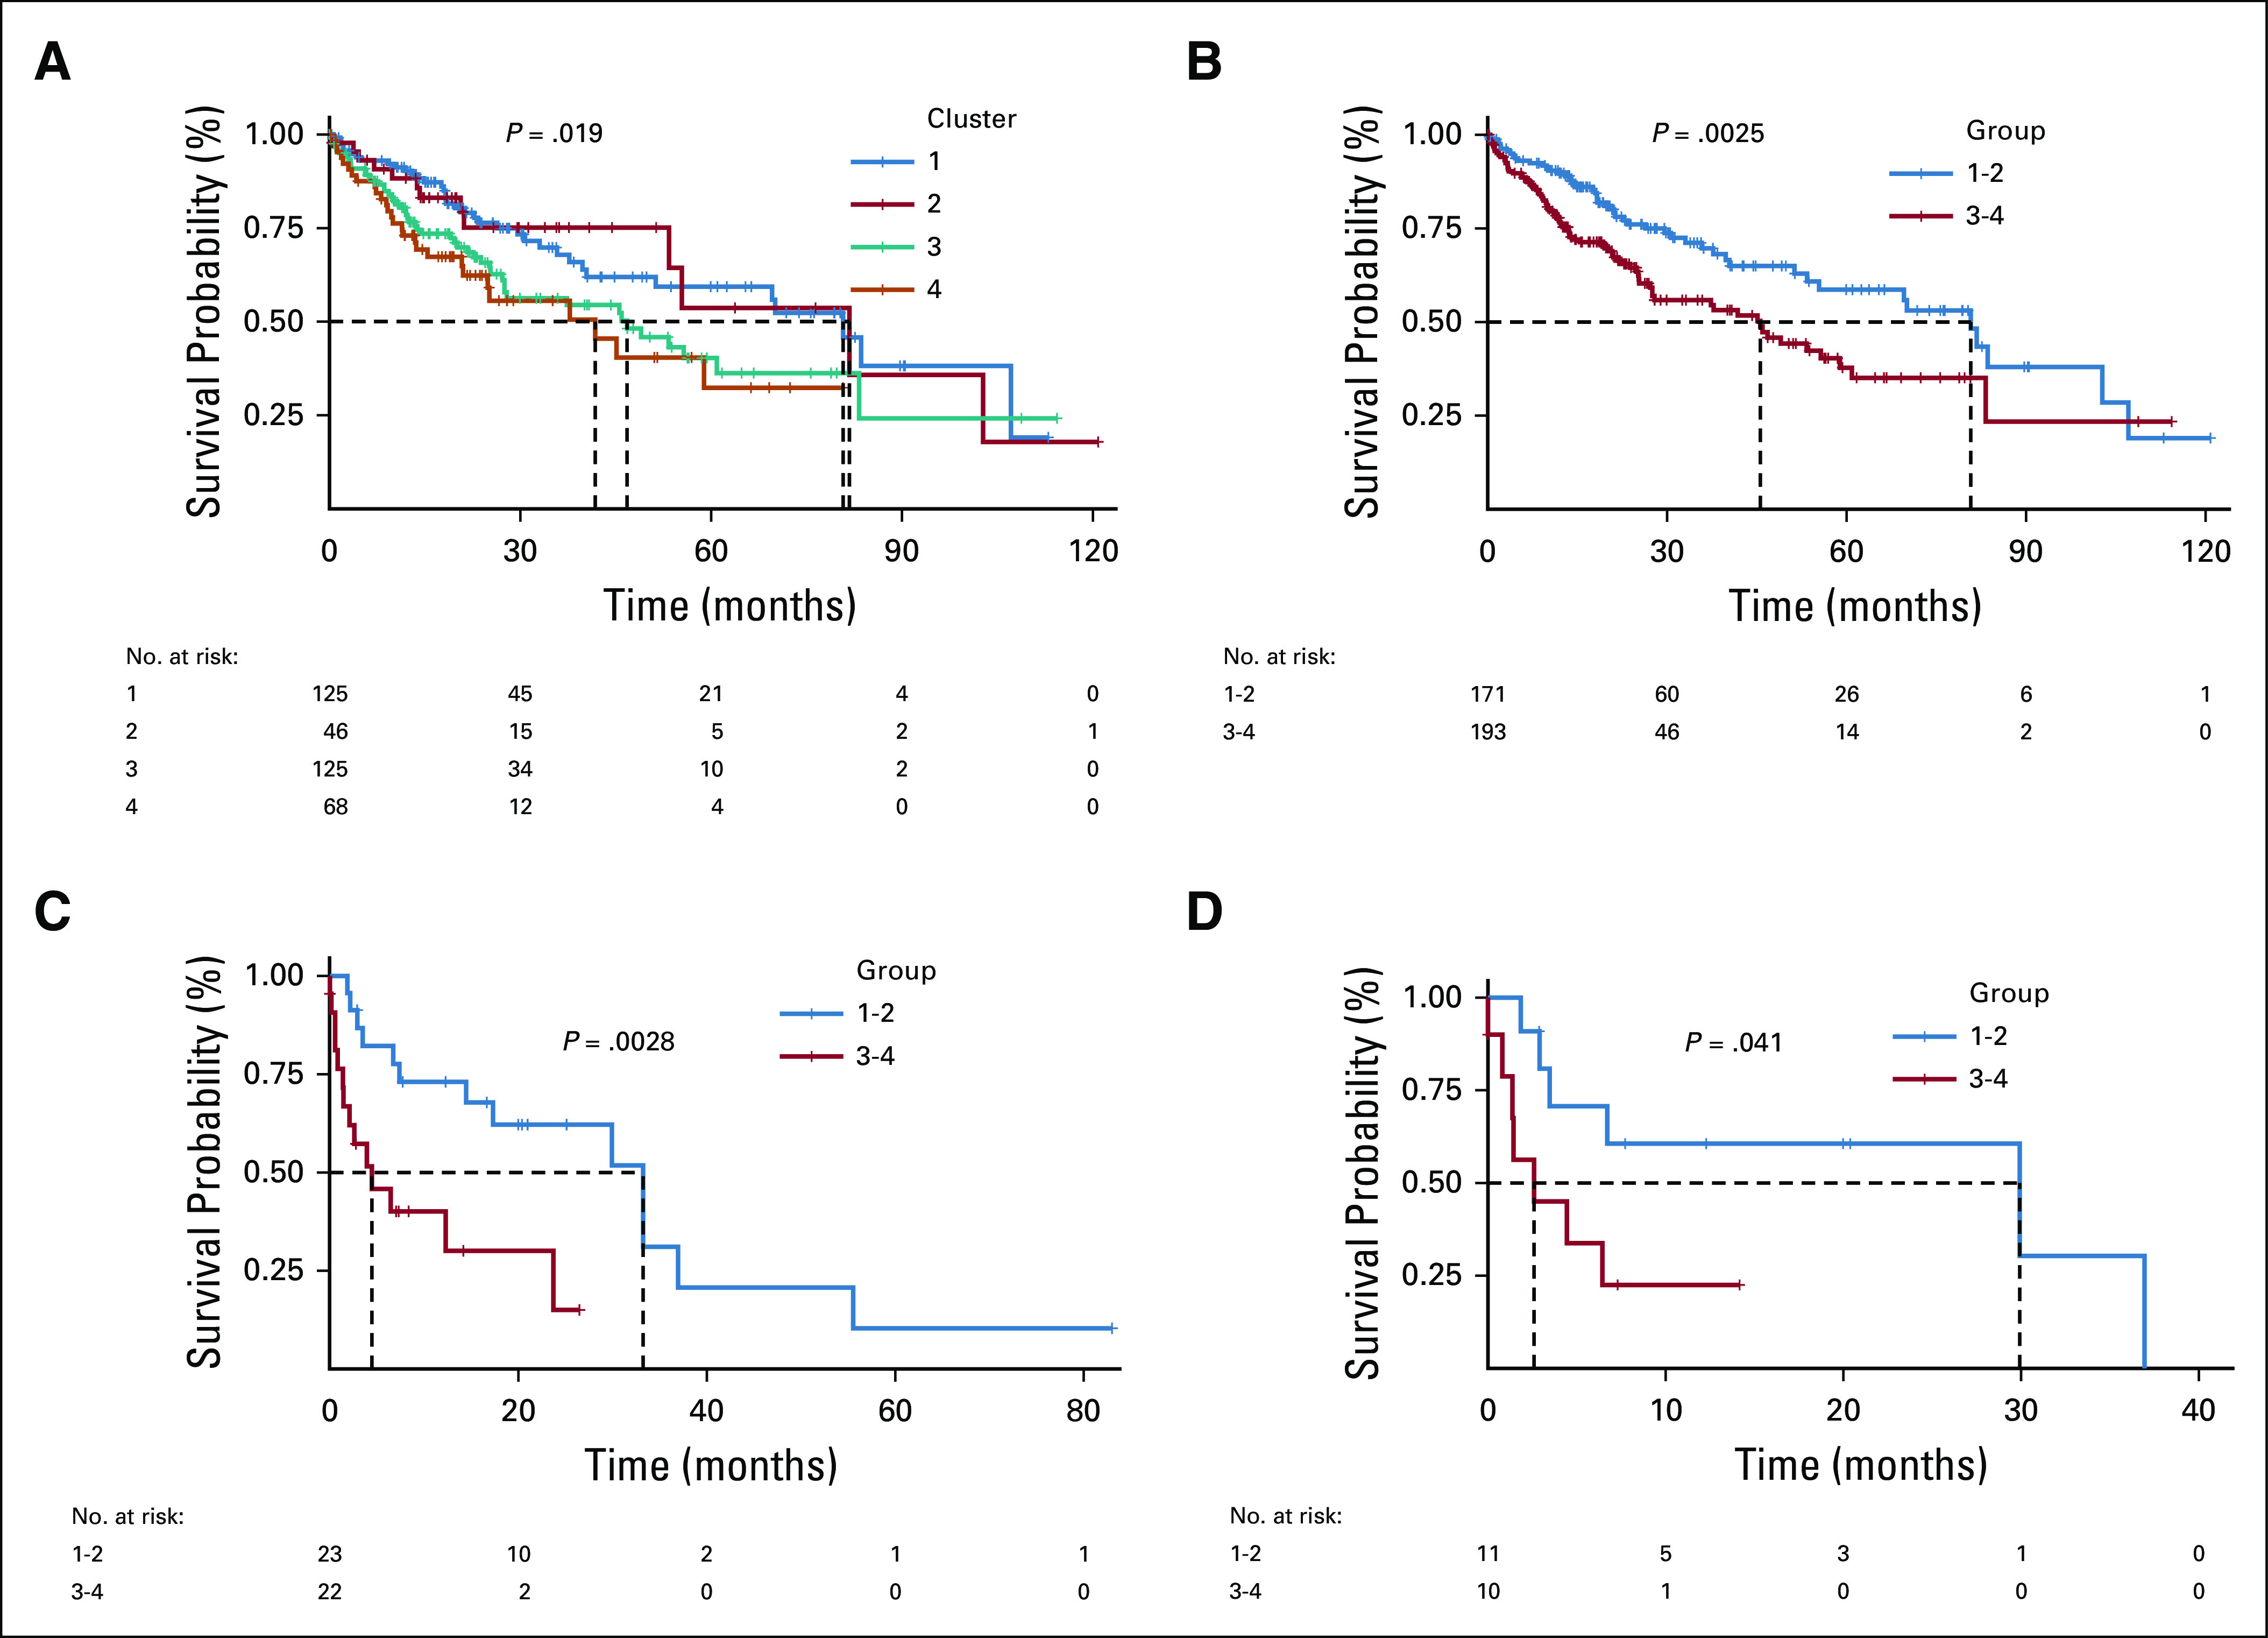
Macrophage enrichment is associated with decreased overall survival and response to adjuvant therapy, including sorafenib. (A) The Kaplan-Meier curve for overall survival for each of the clusters in The Cancer Genome Atlas–Liver Hepatocellular Carcinoma (TCGA-LIHC) cohort. Clusters are color coded with a legend at the top of the figure. A risk table is displayed at the bottom of the table. (B) The Kaplan-Meier curve for overall survival for combined clusters (1 and 2, 3 and 4). (C) The Kaplan-Meier curve for post-treatment survival for combined clusters receiving any adjuvant drug therapy. (D) The Kaplan-Meier curve for post-treatment survival for combined clusters receiving adjuvant sorafenib.
GSEA Identifies Enrichment of Angiogenesis Hallmark Genes in Cluster 4 and Informs Development of an Immunogenomic Signature
After identifying that macrophage predominance confers a poor prognosis, GSEA was performed for clusters 2-4, with cluster 1 as the reference. Angiogenesis-related genes were over-represented in clusters 3 and 4, whereas genes associated with metabolic processes were under-represented (Fig 4). Angiogenesis hallmark genes that were overexpressed in both cluster 4 and PD-1Hi/PD-L1Hi were CXCL6 and POSTN. Absolute M0 macrophage content, CXCL6 expression, and POSTN expression were combined to create a prognostic immunogenomic signature. Patients were then divided into the following score groups: A (low), B (intermediate), and C (high). Patients in score group C were found to have a decreased median survival (30.6 months) compared with those in score groups A (70.1 months) and B (58.9 months; P = .003; Fig 5A). The T-cell dysfunction (Fig 5C) and cancer-associated fibroblast (CAF) signatures (Fig 5D) calculated using the TIDE tool were higher in group C than group A (T-cell dysfunction, P = .001; CAF, P = .04). The score methodology was validated using a GEO dataset—GSE14520. Again, patients in score group C were found to have a decreased median survival (53 months) compared with those in score groups A and B (P = .03). TIDE was used to classify patients as predicted responders or nonresponders to ICB. There were fewer responders in score category B and C (A = 69, B = 39, C = 39; P = .05), but there were no meaningful differences in responders and nonresponders within the same score category (Data Supplement).
FIG 4.
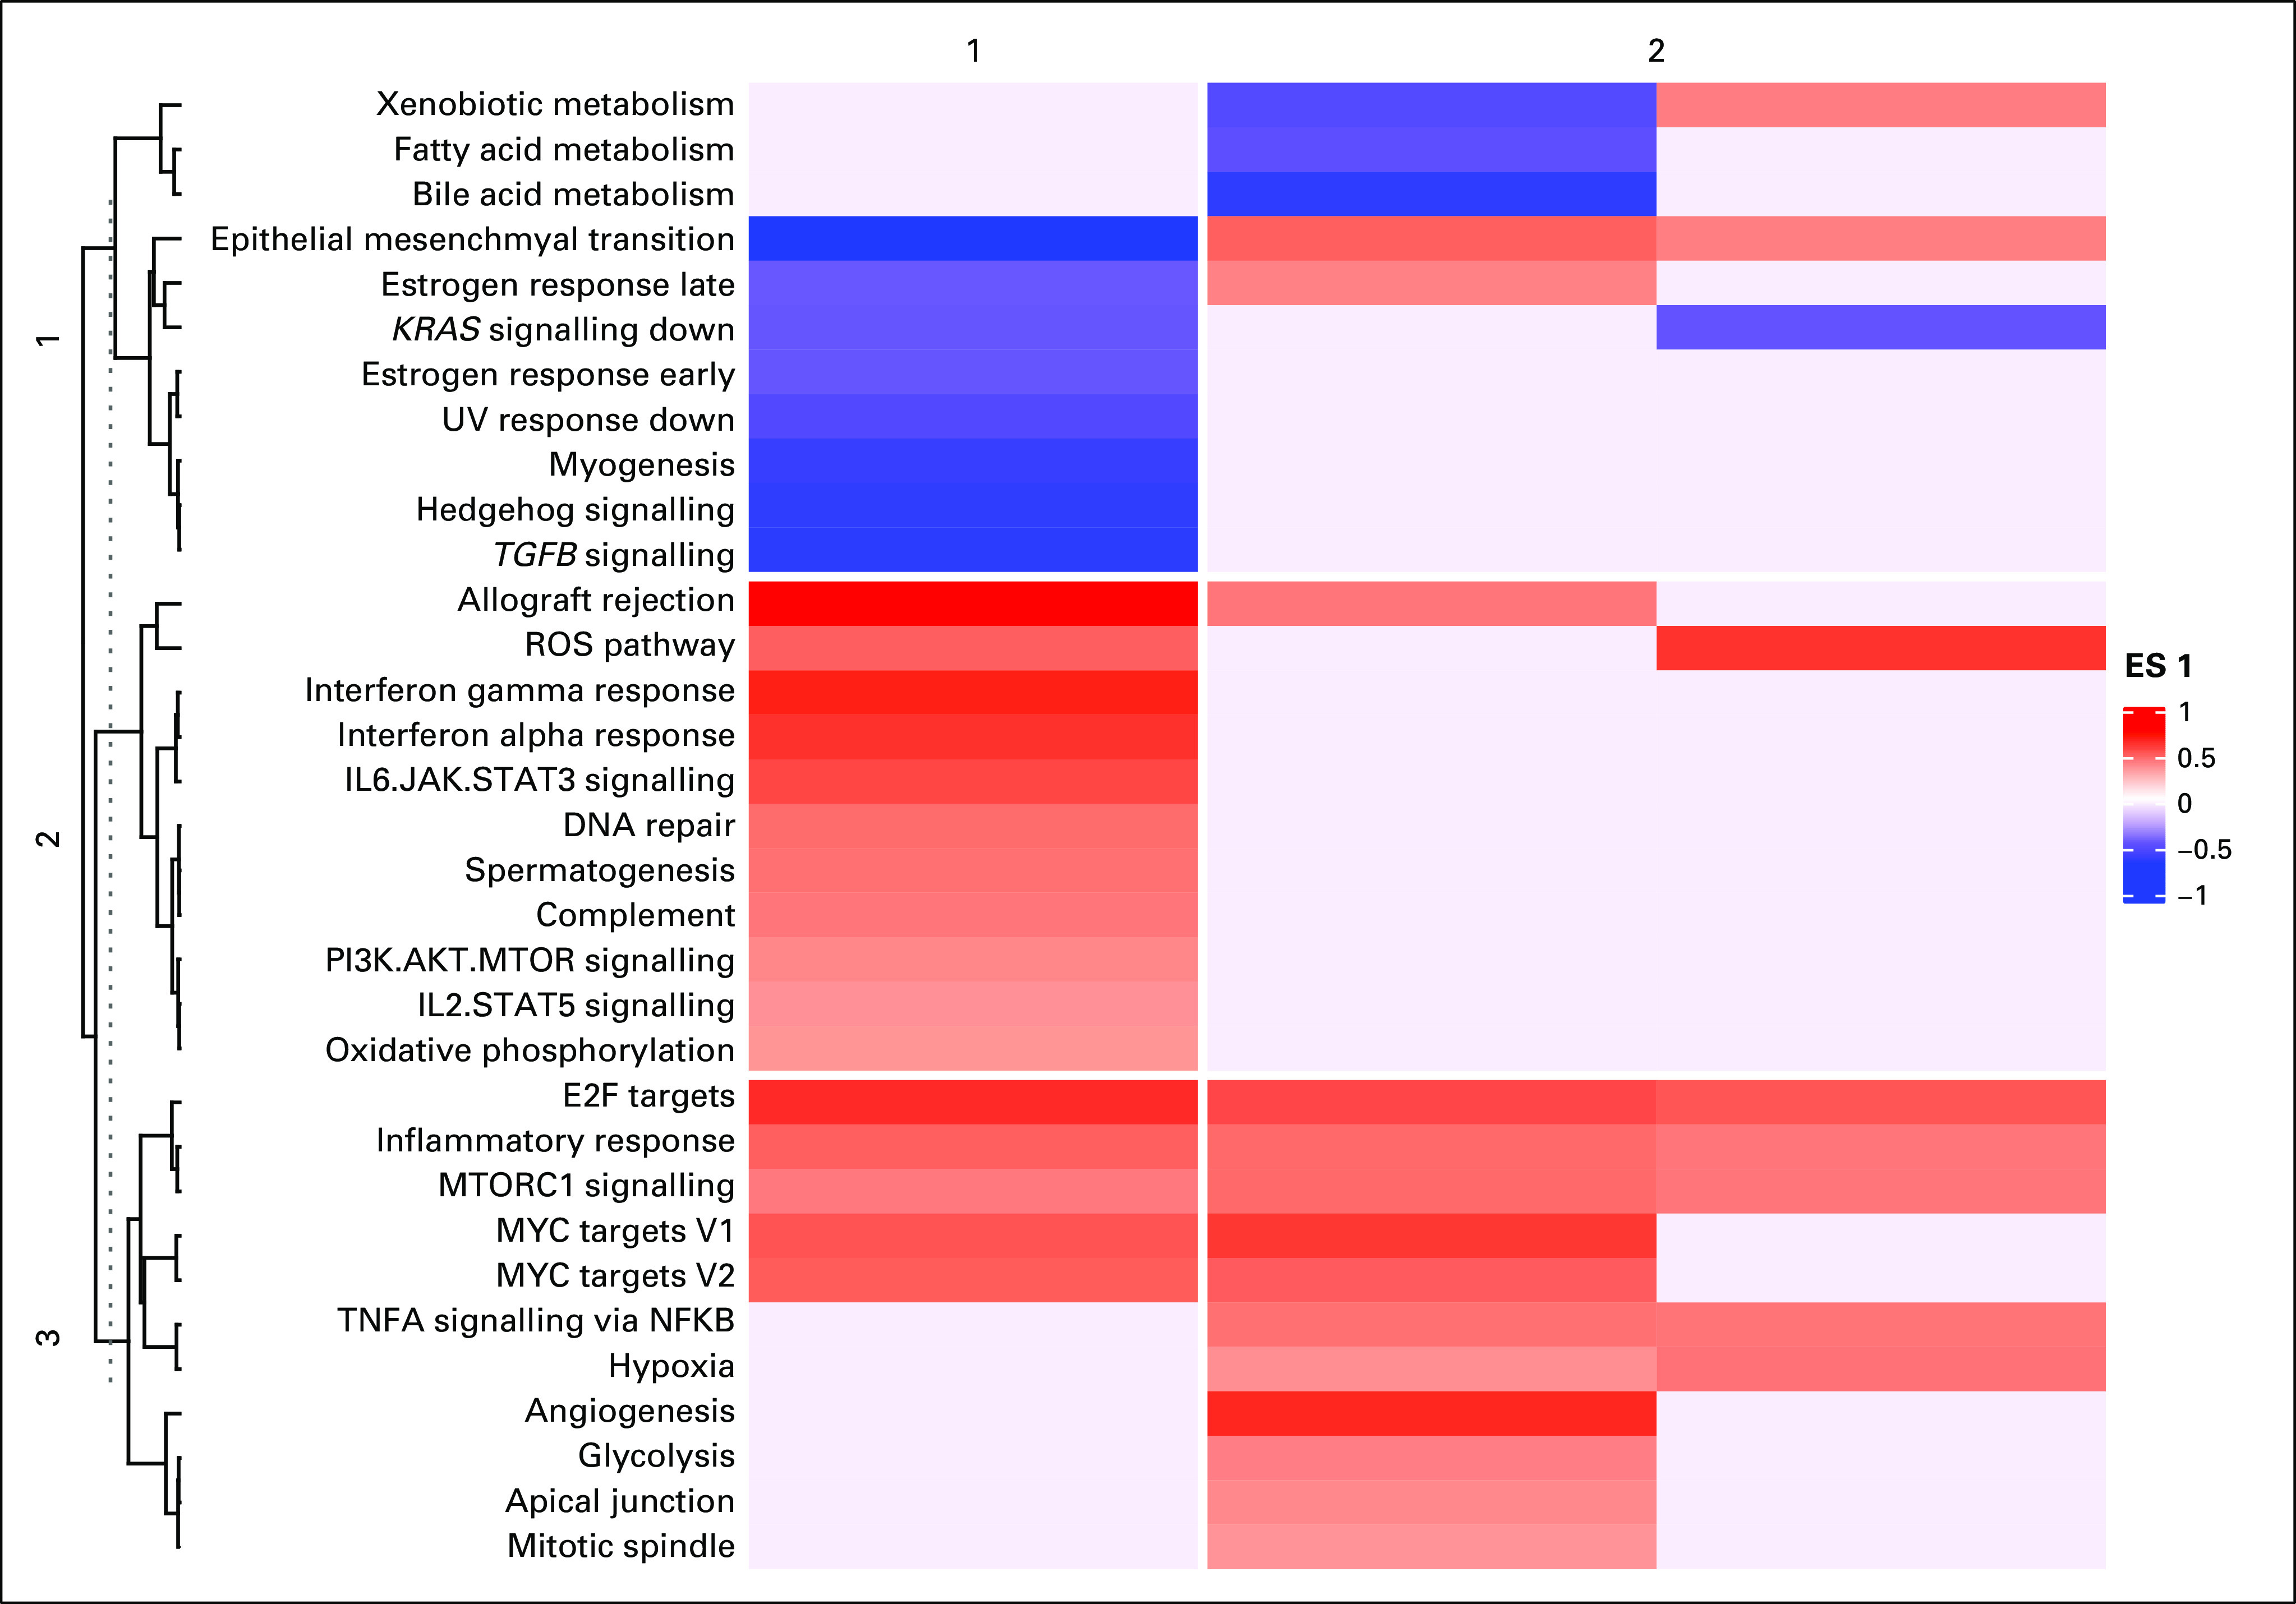
Gene set enrichment analyses (GSEA) identifies enrichment of angiogenesis hallmark genes. Heatmap representing the enrichment scores of MSigDB cancer hallmarks. A red shade represents a gene set that is overenriched and a blue shade represents a gene set that is underenriched. The intensity of the shade corresponds to the magnitude of the enrichment score. Blanks in the heatmap represent gene sets that were not significantly overenriched or underenriched. Clustering was performed on both rows (hallmark gene sets, n = 3), and columns (clusters, n = 2). ES, enrichment score.
FIG 5.
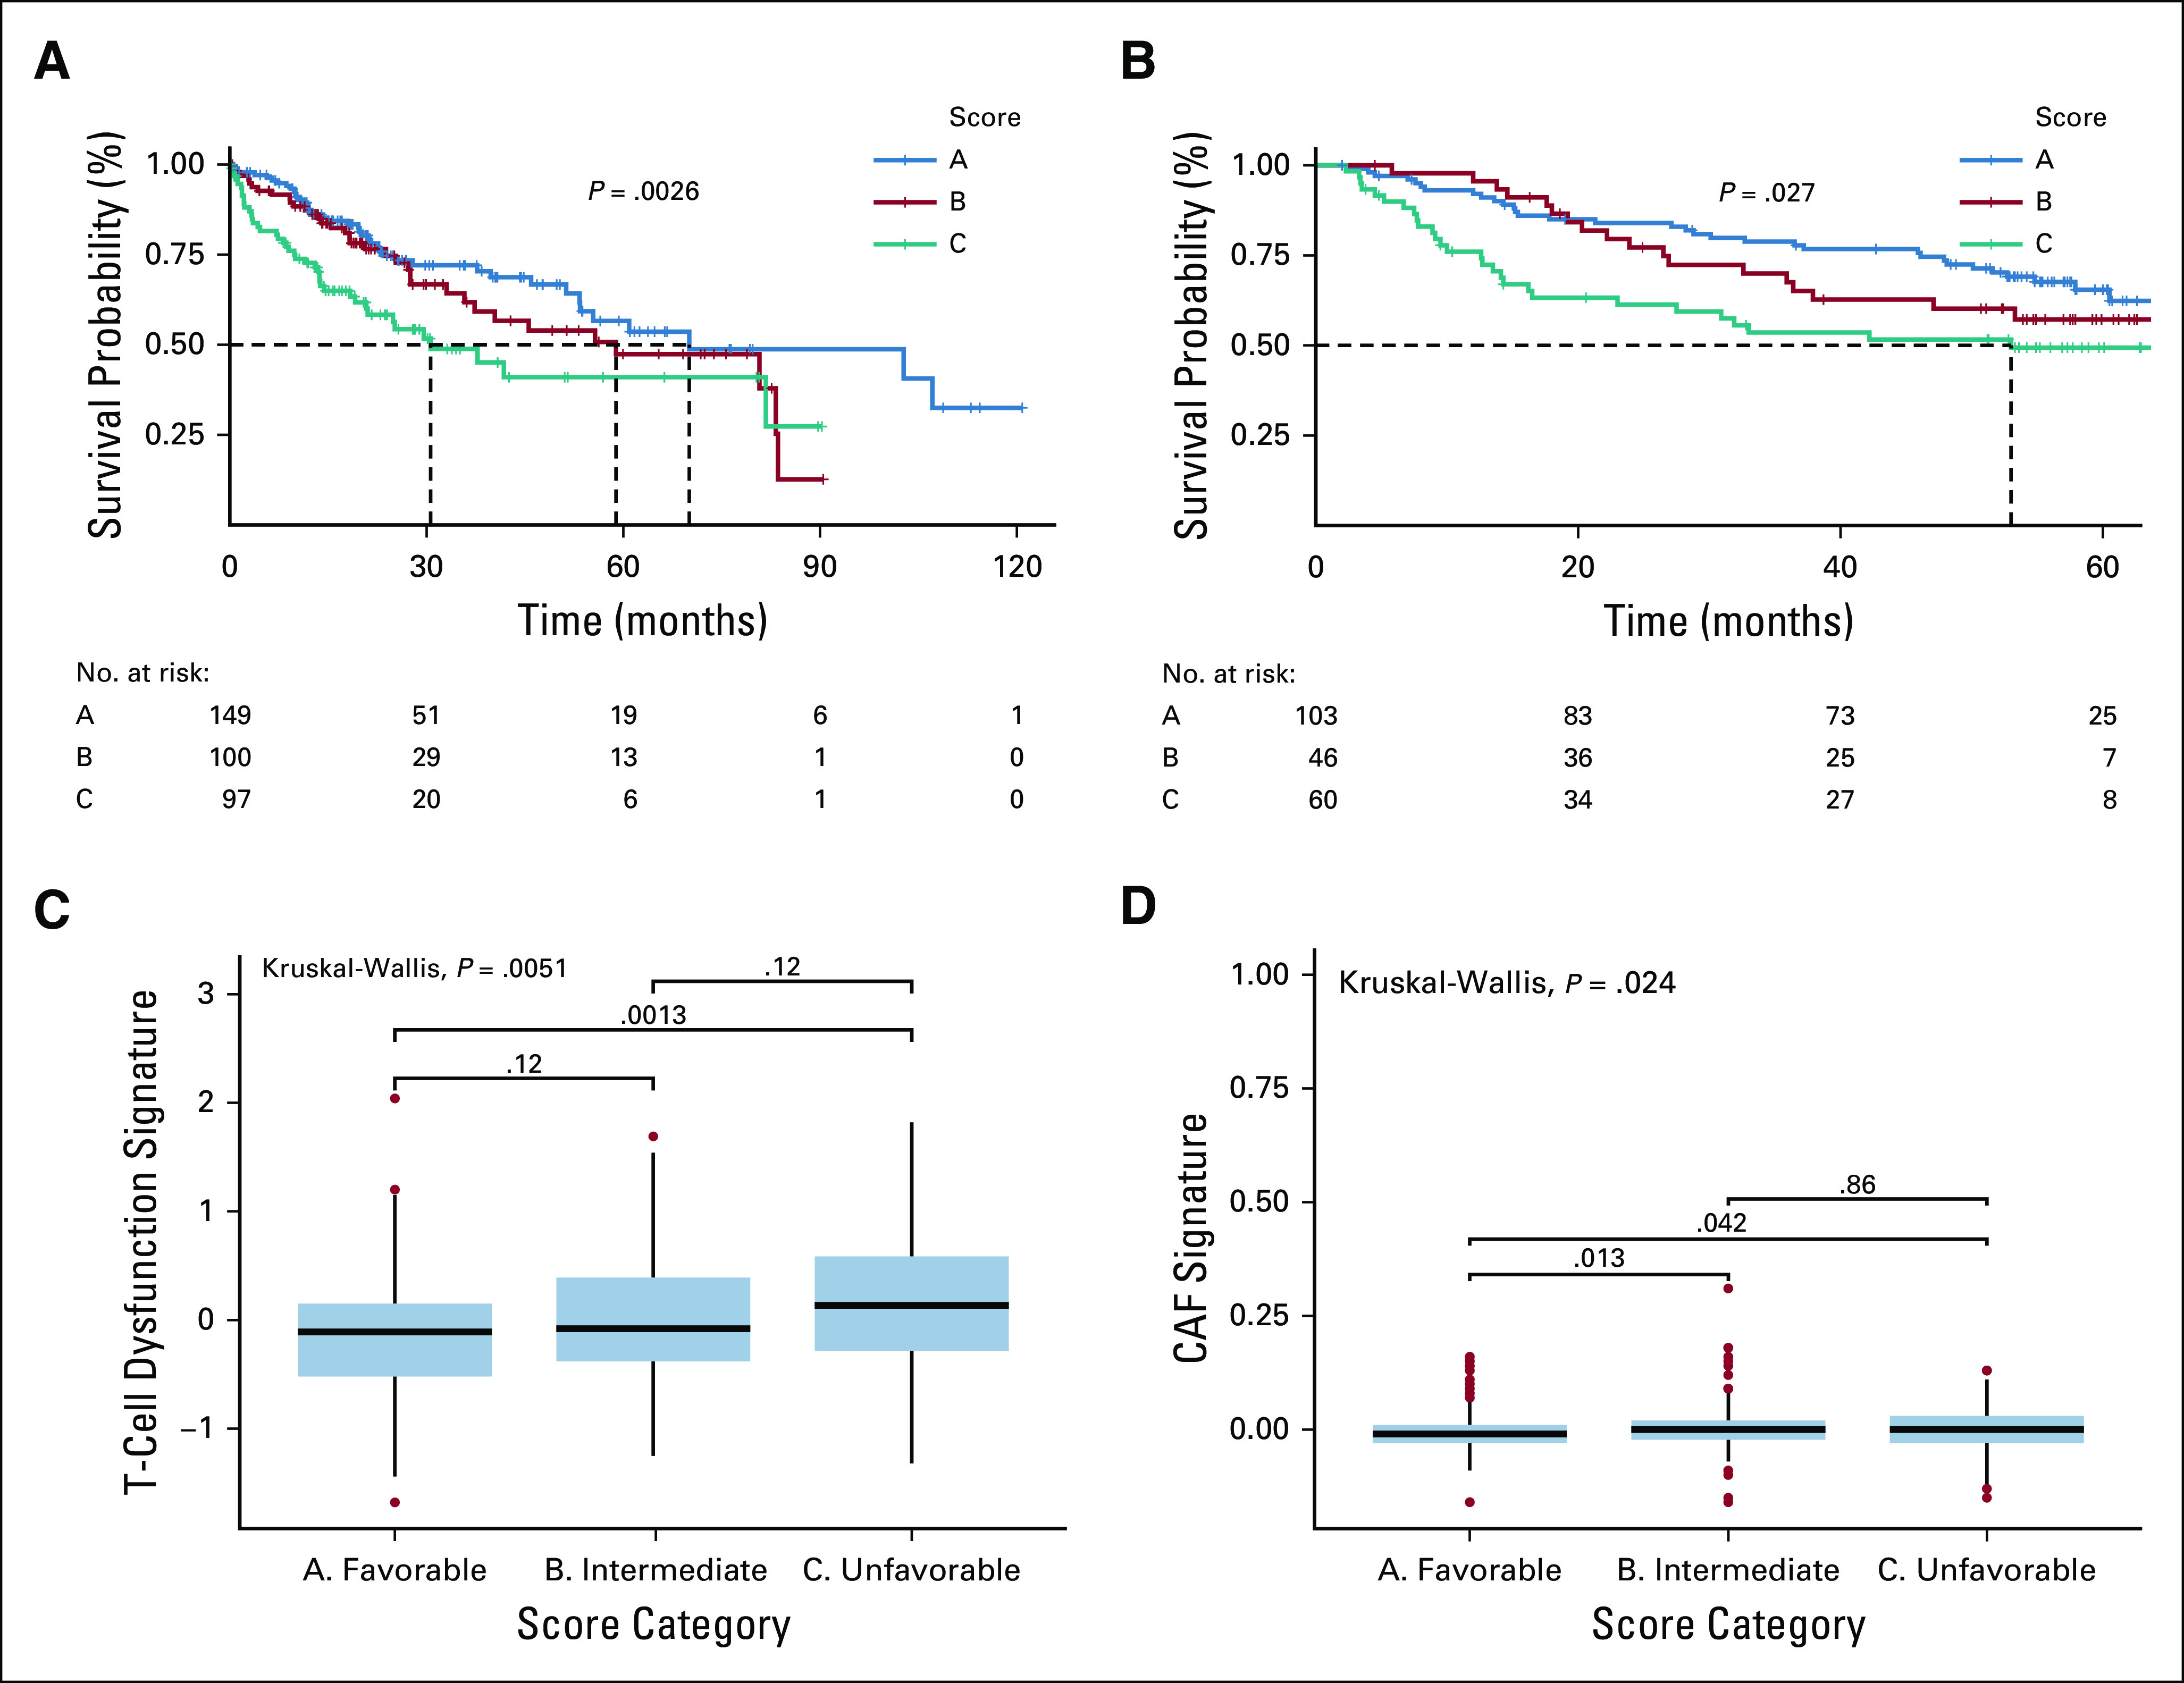
Immunogenomic signature is prognostic for overall survival in both The Cancer Genome Atlas (TCGA) and FSE14520. (A) The Kaplan-Meier curve for overall survival for each of the score groupings in the TCGA–Liver Hepatocellular Carcinoma (LIHC) cohort. Clusters are color coded with a legend at the top of the figure. A risk table is displayed at the bottom of the table. (B) The Kaplan-Meier curve for overall survival for the score groupings in the GSE14520. (C) A box plot representation of T-cell dysfunction scores (y-axis) by score grouping (x-axis). Global Kruskal-Wallis P value is displayed along with Mann-Whitney pairwise comparisons. (D) A box plot representation of cancer-associated fibroblast signature (y-axis) by score grouping (x-axis). Kruskal-Wallis and Mann-Whitney P values are displayed.
DISCUSSION
In this study, we identified two macrophage-enriched HCC clusters, both of which were prognostic of poor survival and response to adjuvant therapy, including sorafenib. GSEA analysis found that overenrichment of angiogenesis hallmark genes characterized the M0Hi cluster. Absolute M0 content as well as expression of two angiogenesis-related genes found to be significantly overexpressed in M0Hi and PD-1Hi/PD-L1Hi cohorts—CXCL6 and POSTN—were combined to generate a score demonstrated to be prognostic of poor survival in both the TCGA cohort and an independent microarray cohort. Higher scores corresponded to T-cell dysfunction and fewer ICB responders, as calculated by the TIDE tool, suggesting that this immunogenomic signature could be used for patient risk stratification and treatment selection, because both sorafenib and monotherapy with ICB may not be appropriate for this cohort.
Tumor-associated macrophages (TAMs) are regarded as orchestrators of key events necessary for cancer progression, including skewing adaptive responses, cell growth, angiogenesis, and extracellular matrix remodeling, changes that all lead to a premetastatic niche.25,26 Additional subclassification of TAMs is necessary because their polarization influences their behavior. At a basic level, macrophages are separated into the M1 subtype, which is proinflammatory, antifibrotic, and activated by LPS, TNF, and IFN-Y, and the M2 subtype, which is anti-inflammatory, profibrotic, and stimulated by interleukin (IL) 4 and IL13.27,28 Given the dynamic nature of the tumor microenvironment and the numerous stimuli within it,27 emerging classification paradigms describe TAMs on a continuum of many subtypes or a mixed phenotype that is neither M1 nor M2.29 Regardless of the phenotype, all TAMs participate in some degree of immunosuppression.30
In ovarian cancer and glioblastoma, transcriptomic profiling demonstrated that M0 macrophages do not fit into the canonical M1 or M2 model, but M0 macrophages demonstrated a transcriptional profile more similar to M2 macrophages.31,32 Ultimately, M0s may represent another type of TAM or an incompletely differentiated M2.31 Angiogenesis was also found to be a highly overenriched process in the M0Hi cluster (Fig 4). MMP9 plays a critical role in tumor angiogenesis by turning on the angiogenic switch in avascular tumors,33 and in the development of LM22 signature gene matrix, MMP9 was found to be differentially expressed only in M0 macrophages. Thus, a key role of the M0 subtype appears to be key to flipping the angiogenic switch in HCC, in part, via MMP9 overexpression.
In a pancancer meta-analysis, 80% of studies demonstrated that TAMs are generally associated with a poor prognosis.34 But defining TAMs nonspecifically may undermine their prognostic value, necessitating an exploration of the role of TAMs beyond the traditional M1/M2 dichotomy, namely, the role of M0 macrophages. M0 macrophages were strongly associated with poor outcome in breast35 and lung 36 cancer, whereas reduced M0 content has been associated with better prognosis in bladder cancer.37 In a comprehensive analysis of digestive system cancers, M0 macrophages were among the most prevalent immune cell fractions, with M0 enriched clusters associated with decreased RFS and worse prognostic immune score.38 In HCC, M0 macrophages are enriched in tumor tissues, both in unspecified HCC and hepatitis C–associated HCC,39 an HCC subtype shown in this analysis to be associated with worse prognosis (Fig 2A).
Sorafenib is approved in the first-line setting for unresectable HCC, but it only prolonged OS by 3 months, and it failed to offer superiority over placebo in the STORM trial. Sorafenib resistance appears to be mediated in part by neovascularization stimulated by TAMs recruited to the tumor microenvironment.40 In fact, depletion of TAMs with the macrophage-targeted agent zolendronic acid led to inhibition of tumor angiogenesis and thus tumor progression in HCC mouse models.41 The association of TAMs with poor sorafenib response was supported by the data presented in this study (Fig 3D). Considering the modest survival benefit, adverse effects, and this resistance mechanism, ICB is a promising alternative to sorafenib in appropriately selected patients.
Recently, the number of approved indications for immune checkpoint inhibitors has greatly expanded,42 and HCC is no exception. Nivolumab was approved in 2017 for use in the second-line setting after progression on sorafenib.43 Anti–PD-L1, anti–CTLA-4, and newer agents targeting LAG-3 and Tim-3 are also being investigated in HCC.44 Despite nivolumab’s approval, the objective response rate was still only 20% in the CheckMate-040 trial,45 and superiority to sorafenib was not shown in the CheckMate 459 trial. Recently, the combination of atezolizumab (anti–PD-L1) and the antiangiogenic agent bevacizumab has demonstrated promising results in the first-line setting, with a 13% increase in OS at 12 months compared with sorafenib for unresectable HCC in the IMBrave150 trial.46
Risk scores to predict prognosis in HCC are becoming increasingly prevalent. Such scores are based on genetic, clinical, and immune data.23,47-50 In addition to M0 macrophage content, our signature incorporates CXCL6 and POSTN gene expression. CXCL6 is an oncogenic chemokine, which mediates angiogenesis, invasion, and progression in HCC through activation of angiogenic switch gene MMP9.51 POSTN is part of the sulfatase 2 (SULF2)-TGFB1-SMAD signaling axis, which is also involved in angiogenesis, and SULF2 and POSTN expression correlates with poor prognosis in HCC. POSTN may serve as a biomarker for more aggressive disease and a therapeutic target for antiangiogenic approaches.52 Furthermore, POSTN has been implicated in the recruitment of tumor-supportive M2 macrophages in glioblastoma,53 and CXCL6 has been found to play a key role in driving liver fibrosis by stimulating the release of TGF-B by Kupffer cells.54 CXCL6 and POSTN were selected because they were significantly overexpressed in both the M0 macrophage-enriched PD-1Hi/PD-L1Hi cohorts. Considering the roles of the signature’s members, it effectively captures key players in establishing a tumor-promoting stromal environment in HCC via promotion of immune escape, angiogenesis, and fibrosis. Furthermore, this signature offers a foundation to build on with respect to development of a predictive biomarker strategy for those patients who are more likely to benefit from administration of ICB and antiangiogenic tyrosine kinase inhibitors in combination rather than as monotherapies.
The availability of sequencing data has outpaced the availability of matched treatment data, Only a fraction of the patients in the TCGA-LIHC cohort had available drug treatment data and the full complement of survival data, limiting the power to detect differences between the groups analyzed, despite significance by statistical testing seen in this study. In addition, ICB response data with matched whole transcriptome data for HCC is not publically available, thus preventing validation of ICB response prediction.
Our analysis is a snapshot in time, reflecting when the tumor was resected and sequenced. As a result, the dynamic influences on macrophage polarization and the changing tumor microenvironment were not captured. In addition, bulk tumor specimen analysis does not capture the immune contexture that is critical to macrophage behavior. Single-cell approaches may address these issues; however, they are subject to a bias toward more highly expressed genes, they require optimally preserved specimens, and their high cost limits profiling of large numbers of patients.55 For these reasons, in a clinical decision-making context, an exclusively single-cell approach is not feasible. Thus, it is important to use single-cell approaches to augment bulk tumor profiling from databases such as TCGA by validating findings from larger scale analyses of bulk specimens.
We further elucidate the prognostic significance and molecular influences of TAMs and specifically the M0 subtype in HCC. The immunogenomic signature methodology was demonstrated to be prognostic in two separate cohorts sequenced on two different platforms. It was also associated with fewer responders to ICB. Future work should seek to further refine the score methodology, perhaps generating universal cutoff values and a nomogram incorporating more variables. Additionally, prospectively validating the predictive nature of the score in ICB monotherapy or combination trials will be essential.
SUPPORT
Supported by the National Institutes of Health (NIH) T35 Grant No. HL00796035 (M.F., N.K.J.) and NIH grant R01-CA233487.
EQUAL CONTRIBUTION
M.F. and N.K.J. contributed equally to this work.
DATA SHARING STATEMENT
Supplementary data files and R code repository are available online at https://osf.io/fcpwr/?view_only=f333e4d8158e466ba8f17117972f8406.
AUTHOR CONTRIBUTIONS
Conception and design: All authors
Collection and assembly of data: Mark Farha, Neil K. Jairath
Data analysis and interpretation: All authors
Manuscript writing: All authors
Final approval of manuscript: All authors
Accountable for all aspects of the work: All authors
AUTHORS' DISCLOSURES OF POTENTIAL CONFLICTS OF INTEREST
The following represents disclosure information provided by authors of this manuscript. All relationships are considered compensated unless otherwise noted. Relationships are self-held unless noted. I = Immediate Family Member, Inst = My Institution. Relationships may not relate to the subject matter of this manuscript. For more information about ASCO's conflict of interest policy, please refer to www.asco.org/rwc or ascopubs.org/cci/author-center.
Open Payments is a public database containing information reported by companies about payments made to US-licensed physicians (Open Payments).
Issam El Naqa
Consulting or Advisory Role: Endectra
Patents, Royalties, Other Intellectual Property: Patent pending on an optical probe for radiation (Inst), patent pending on new computing technology for decision making (Inst)
No other potential conflicts of interest were reported.
REFERENCES
- 1.Siegel RL, Miller KD, Jemal A. Cancer statistics, 2020. CA Cancer J Clin. 2020;70:7–30. doi: 10.3322/caac.21590. [DOI] [PubMed] [Google Scholar]
- 2.Center MM, Jemal A. International trends in liver cancer incidence rates. Cancer Epidemiol Biomarkers Prev. 2011;20:2362–2368. doi: 10.1158/1055-9965.EPI-11-0643. [DOI] [PubMed] [Google Scholar]
- 3.Perz JF, Armstrong GL, Farrington LA, et al. The contributions of hepatitis B virus and hepatitis C virus infections to cirrhosis and primary liver cancer worldwide. J Hepatol. 2006;45:529–538. doi: 10.1016/j.jhep.2006.05.013. [DOI] [PubMed] [Google Scholar]
- 4.Blonski W, Kotlyar DS, Forde KA. Non-viral causes of hepatocellular carcinoma. World J Gastroenterol. 2010;16:3603–3615. doi: 10.3748/wjg.v16.i29.3603. [DOI] [PMC free article] [PubMed] [Google Scholar]
- 5.Sanyal AJ, Yoon SK, Lencioni R. The etiology of hepatocellular carcinoma and consequences for treatment. Oncologist. 2010;15(suppl 4):14–22. doi: 10.1634/theoncologist.2010-S4-14. [DOI] [PubMed] [Google Scholar]
- 6.Yang D, Hanna DL, Usher J, et al. Impact of sex on the survival of patients with hepatocellular carcinoma: A Surveillance, Epidemiology, and End Results analysis. Cancer. 2014;120:3707–3716. doi: 10.1002/cncr.28912. [DOI] [PMC free article] [PubMed] [Google Scholar]
- 7.Mazzaferro V, Lencioni R, Majno P. Early hepatocellular carcinoma on the procrustean bed of ablation, resection, and transplantation. Semin Liver Dis. 2014;34:415–426. doi: 10.1055/s-0034-1394365. [DOI] [PubMed] [Google Scholar]
- 8.Wang J, He XD, Yao N, et al. A meta-analysis of adjuvant therapy after potentially curative treatment for hepatocellular carcinoma. Can J Gastroenterol. 2013;27:351–363. doi: 10.1155/2013/417894. [DOI] [PMC free article] [PubMed] [Google Scholar]
- 9.Llovet JM, Ricci S, Mazzaferro V, et al. Sorafenib in advanced hepatocellular carcinoma. N Engl J Med. 2008;359:378–390. doi: 10.1056/NEJMoa0708857. [DOI] [PubMed] [Google Scholar]
- 10.Bruix J, Takayama T, Mazzaferro V, et al. Adjuvant sorafenib for hepatocellular carcinoma after resection or ablation (STORM): A phase 3, randomised, double-blind, placebo-controlled trial. Lancet Oncol. 2015;16:1344–1354. doi: 10.1016/S1470-2045(15)00198-9. [DOI] [PubMed] [Google Scholar]
- 11.Zhang W. Sorafenib in adjuvant setting: Call for precise and personalized therapy. Transl Gastroenterol Hepatol. 2016;1:13. doi: 10.21037/tgh.2016.03.13. [DOI] [PMC free article] [PubMed] [Google Scholar]
- 12.Cancer Genome Atlas Research Network Comprehensive and integrative genomic characterization of hepatocellular carcinoma. Cell. 2017;169:1327–1341.e23. doi: 10.1016/j.cell.2017.05.046. [DOI] [PMC free article] [PubMed] [Google Scholar]
- 13.Colaprico A, Silva TC, Olsen C, et al. TCGAbiolinks: An R/Bioconductor package for integrative analysis of TCGA data. Nucleic Acids Res. 2016;44:e71. doi: 10.1093/nar/gkv1507. [DOI] [PMC free article] [PubMed] [Google Scholar]
- 14.Silva TC, Colaprico A, Olsen C, et al. TCGA Workflow: Analyze cancer genomics and epigenomics data using Bioconductor packages. F1000 Res. 2016;5:1542. doi: 10.12688/f1000research.8923.2. [DOI] [PMC free article] [PubMed] [Google Scholar]
- 15.Mounir M, Lucchetta M, Silva TC, et al. New functionalities in the TCGAbiolinks package for the study and integration of cancer data from GDC and GTEx. PLOS Comput Biol. 2019;15:e1006701. doi: 10.1371/journal.pcbi.1006701. [DOI] [PMC free article] [PubMed] [Google Scholar]
- 16.Newman AM, Steen CB, Liu CL, et al. Determining cell type abundance and expression from bulk tissues with digital cytometry. Nat Biotechnol. 2019;37:773–782. doi: 10.1038/s41587-019-0114-2. [DOI] [PMC free article] [PubMed] [Google Scholar]
- 17.Cerami E, Gao J, Dogrusoz U, et al. The cBio cancer genomics portal: An open platform for exploring multidimensional cancer genomics data. Cancer Discov. 2012;2:401–404. doi: 10.1158/2159-8290.CD-12-0095. [DOI] [PMC free article] [PubMed] [Google Scholar]
- 18.Gao J, Aksoy BA, Dogrusoz U, et al. Integrative analysis of complex cancer genomics and clinical profiles using the cBioPortal. Sci Signal. 2013;6:pl1. doi: 10.1126/scisignal.2004088. [DOI] [PMC free article] [PubMed] [Google Scholar]
- 19.Gu Z, Eils R, Schlesner M. Complex heatmaps reveal patterns and correlations in multidimensional genomic data. Bioinformatics. 2016;32:2847–2849. doi: 10.1093/bioinformatics/btw313. [DOI] [PubMed] [Google Scholar]
- 20.Reyes ALP, Silva TC, Coetzee SG, et al. GENAVi: A shiny web application for gene expression normalization, analysis and visualization. BMC Genomics. 2019;20:745. doi: 10.1186/s12864-019-6073-7. [DOI] [PMC free article] [PubMed] [Google Scholar]
- 21.Liberzon A, Birger C, Thorvaldsdóttir H, et al. The Molecular Signatures Database (MSigDB) hallmark gene set collection. Cell Syst. 2015;1:417–425. doi: 10.1016/j.cels.2015.12.004. [DOI] [PMC free article] [PubMed] [Google Scholar]
- 22.Choi K, Ratner N. iGEAK: An interactive gene expression analysis kit for seamless workflow using the R/shiny platform. BMC Genomics. 2019;20:177. doi: 10.1186/s12864-019-5548-x. [DOI] [PMC free article] [PubMed] [Google Scholar]
- 23.Chen S, Wang C, Cui A, et al. Development of a genetic and clinical data-based (GC) risk score for predicting survival of hepatocellular carcinoma patients after tumor resection. Cell Physiol Biochem. 2018;48:491–502. doi: 10.1159/000491779. [DOI] [PubMed] [Google Scholar]
- 24.Jiang P, Gu S, Pan D, et al. Signatures of T cell dysfunction and exclusion predict cancer immunotherapy response. Nat Med. 2018;24:1550–1558. doi: 10.1038/s41591-018-0136-1. [DOI] [PMC free article] [PubMed] [Google Scholar]
- 25.Solinas G, Germano G, Mantovani A, et al. Tumor-associated macrophages (TAM) as major players of the cancer-related inflammation. J Leukoc Biol. 2009;86:1065–1073. doi: 10.1189/jlb.0609385. [DOI] [PubMed] [Google Scholar]
- 26.Mantovani A, Sica A. Macrophages, innate immunity and cancer: Balance, tolerance, and diversity. Curr Opin Immunol. 2010;22:231–237. doi: 10.1016/j.coi.2010.01.009. [DOI] [PubMed] [Google Scholar]
- 27.Xue J, Schmidt SV, Sander J, et al. Transcriptome-based network analysis reveals a spectrum model of human macrophage activation. Immunity. 2014;40:274–288. doi: 10.1016/j.immuni.2014.01.006. [DOI] [PMC free article] [PubMed] [Google Scholar]
- 28.Capece D, Fischietti M, Verzella D, et al. The inflammatory microenvironment in hepatocellular carcinoma: A pivotal role for tumor-associated macrophages. BioMed Res Int. 2013;2013:187204. doi: 10.1155/2013/187204. [DOI] [PMC free article] [PubMed] [Google Scholar]
- 29.Torroella-Kouri M, Silvera R, Rodriguez D, et al. Identification of a subpopulation of macrophages in mammary tumor-bearing mice that are neither M1 nor M2 and are less differentiated. Cancer Res. 2009;69:4800–4809. doi: 10.1158/0008-5472.CAN-08-3427. [DOI] [PubMed] [Google Scholar]
- 30.Laoui D, Van Overmeire E, Movahedi K, et al. Mononuclear phagocyte heterogeneity in cancer: Different subsets and activation states reaching out at the tumor site. Immunobiology. 2011;216:1192–1202. doi: 10.1016/j.imbio.2011.06.007. [DOI] [PubMed] [Google Scholar]
- 31.Zhang Q, Li H, Mao Y, et al. Apoptotic SKOV3 cells stimulate M0 macrophages to differentiate into M2 macrophages and promote the proliferation and migration of ovarian cancer cells by activating the ERK signaling pathway. Int J Mol Med. 2020;45:10–22. doi: 10.3892/ijmm.2019.4408. [DOI] [PMC free article] [PubMed] [Google Scholar]
- 32.Gabrusiewicz K, Rodriguez B, Wei J, et al. Glioblastoma-infiltrated innate immune cells resemble M0 macrophage phenotype. JCI Insight. 2016;1:e85841. doi: 10.1172/jci.insight.85841. [DOI] [PMC free article] [PubMed] [Google Scholar]
- 33.Bergers G, Benjamin LE. Tumorigenesis and the angiogenic switch. Nat Rev Cancer. 2003;3:401–410. doi: 10.1038/nrc1093. [DOI] [PubMed] [Google Scholar]
- 34.Bingle L, Brown NJ, Lewis CE. The role of tumour-associated macrophages in tumour progression: Implications for new anticancer therapies. J Pathol. 2002;196:254–265. doi: 10.1002/path.1027. [DOI] [PubMed] [Google Scholar]
- 35.Ali HR, Chlon L, Pharoah PD, et al. Patterns of immune infiltration in breast cancer and their clinical implications: A gene-expression-based retrospective study. PLoS Med. 2016;13:e1002194. doi: 10.1371/journal.pmed.1002194. [DOI] [PMC free article] [PubMed] [Google Scholar]
- 36.Liu X, Wu S, Yang Y, et al. The prognostic landscape of tumor-infiltrating immune cell and immunomodulators in lung cancer. Biomed Pharmacother. 2017;95:55–61. doi: 10.1016/j.biopha.2017.08.003. [DOI] [PubMed] [Google Scholar]
- 37.Li W, Zeng J, Luo B, et al. High expression of activated CD4+ memory T cells and CD8+ T cells and low expression of M0 macrophage are associated with better clinical prognosis in bladder cancer patients [in Chinese] Xibao Yu Fenzi Mianyixue Zazhi. 2020;36:97–103. [PubMed] [Google Scholar]
- 38.Yang S, Liu T, Cheng Y, et al. Immune cell infiltration as a biomarker for the diagnosis and prognosis of digestive system cancer. Cancer Sci. 2019;110:3639–3649. doi: 10.1111/cas.14216. [DOI] [PMC free article] [PubMed] [Google Scholar]
- 39.Hsiao YW, Chiu LT, Chen CH, et al. Tumor-infiltrating leukocyte composition and prognostic power in hepatitis B- and hepatitis C-related hepatocellular carcinomas. Genes (Basel) 2019;10:630. doi: 10.3390/genes10080630. [DOI] [PMC free article] [PubMed] [Google Scholar]
- 40. Zhou SL, Zhou ZJ, Hu ZQ, et al. Tumor-associated neutrophils recruit macrophages and T-regulatory cells to promote progression of hepatocellular carcinoma and resistance to sorafenib. Gastroenterology 150(7):1646-1658.e1617, 2016. [DOI] [PubMed]
- 41.Zhang W, Zhu XD, Sun HC, et al. Depletion of tumor-associated macrophages enhances the effect of sorafenib in metastatic liver cancer models by antimetastatic and antiangiogenic effects. Clin Cancer Res. 2010;16:3420–3430. doi: 10.1158/1078-0432.CCR-09-2904. [DOI] [PubMed] [Google Scholar]
- 42.Gong J, Chehrazi-Raffle A, Reddi S, et al. Development of PD-1 and PD-L1 inhibitors as a form of cancer immunotherapy: A comprehensive review of registration trials and future considerations. J Immunother Cancer. 2018;6:8. doi: 10.1186/s40425-018-0316-z. [DOI] [PMC free article] [PubMed] [Google Scholar]
- 43.Marrero JA, Kulik LM, Sirlin CB, et al. Diagnosis, staging, and management of hepatocellular carcinoma: 2018 practice guidance by the American Association for the Study of Liver Diseases. Hepatology. 2018;68:723–750. doi: 10.1002/hep.29913. [DOI] [PubMed] [Google Scholar]
- 44.Johnston MP, Khakoo SI. Immunotherapy for hepatocellular carcinoma: Current and future. World J Gastroenterol. 2019;25:2977–2989. doi: 10.3748/wjg.v25.i24.2977. [DOI] [PMC free article] [PubMed] [Google Scholar]
- 45.El-Khoueiry AB, Sangro B, Yau T, et al. Nivolumab in patients with advanced hepatocellular carcinoma (CheckMate 040): An open-label, non-comparative, phase 1/2 dose escalation and expansion trial. Lancet. 2017;389:2492–2502. doi: 10.1016/S0140-6736(17)31046-2. [DOI] [PMC free article] [PubMed] [Google Scholar]
- 46.Finn RS, Qin S, Ikeda M, et al. Atezolizumab plus bevacizumab in unresectable hepatocellular carcinoma. N Engl J Med. 2020;382:1894–1905. doi: 10.1056/NEJMoa1915745. [DOI] [PubMed] [Google Scholar]
- 47.Yan Y, Lu Y, Mao K, et al. Identification and validation of a prognostic four-genes signature for hepatocellular carcinoma: Integrated ceRNA network analysis. Hepatol Int. 2019;13:618–630. doi: 10.1007/s12072-019-09962-3. [DOI] [PMC free article] [PubMed] [Google Scholar]
- 48.Lu M, Kong X, Wang H, et al. A novel microRNAs expression signature for hepatocellular carcinoma diagnosis and prognosis. Oncotarget. 2017;8:8775–8784. doi: 10.18632/oncotarget.14452. [DOI] [PMC free article] [PubMed] [Google Scholar]
- 49.Long J, Wang A, Bai Y, et al. Development and validation of a TP53-associated immune prognostic model for hepatocellular carcinoma. EBioMedicine. 2019;42:363–374. doi: 10.1016/j.ebiom.2019.03.022. [DOI] [PMC free article] [PubMed] [Google Scholar]
- 50. doi: 10.1002/jcp.29730. Zhang Y, Zhang L, Xu Y, et al: Immune-related long noncoding RNA signature for predicting survival and immune checkpoint blockade in hepatocellular carcinoma. J Cell Physiol . [epub ahead of print on April 24, 2020] [DOI] [PubMed] [Google Scholar]
- 51. Zheng Y-W, Ma M-Z, Xu Y-T, et al: CXCL6 is upregulated in hepatocellular carcinoma and promotes invasion of liver cancer cells via targeting MMP9. Int J Clin Exp Pathol 9:4661-4672, 2016. [Google Scholar]
- 52.Chen G, Nakamura I, Dhanasekaran R, et al. Transcriptional induction of periostin by a sulfatase 2-TGFβ1-SMAD signaling axis mediates tumor angiogenesis in hepatocellular carcinoma. Cancer Res. 2017;77:632–645. doi: 10.1158/0008-5472.CAN-15-2556. [DOI] [PMC free article] [PubMed] [Google Scholar]
- 53.Zhou W, Ke SQ, Huang Z, et al. Periostin secreted by glioblastoma stem cells recruits M2 tumour-associated macrophages and promotes malignant growth. Nat Cell Biol. 2015;17:170–182. doi: 10.1038/ncb3090. [DOI] [PMC free article] [PubMed] [Google Scholar]
- 54.Cai X, Li Z, Zhang Q, et al. CXCL6-EGFR-induced Kupffer cells secrete TGF-β1 promoting hepatic stellate cell activation via the SMAD2/BRD4/C-MYC/EZH2 pathway in liver fibrosis. J Cell Mol Med. 2018;22:5050–5061. doi: 10.1111/jcmm.13787. [DOI] [PMC free article] [PubMed] [Google Scholar]
- 55.Suvà ML, Tirosh I. Single-cell RNA sequencing in cancer: Lessons learned and emerging challenges. Mol Cell. 2019;75:7–12. doi: 10.1016/j.molcel.2019.05.003. [DOI] [PubMed] [Google Scholar]
Associated Data
This section collects any data citations, data availability statements, or supplementary materials included in this article.
Data Availability Statement
Supplementary data files and R code repository are available online at https://osf.io/fcpwr/?view_only=f333e4d8158e466ba8f17117972f8406.