Abstract
Fluid intake is an essential innate behavior mainly caused by two distinct types of thirst1–3. Increased blood osmolality induces osmotic thirst that drives animals to consume pure water. Conversely, the loss of body fluid induces hypovolemic thirst in which animals seek both water and minerals (salts) to recover blood volume. Circumventricular organs (CVOs) in the lamina terminalis (LT) are critical sites for sensing both types of thirst-inducing stimuli4–6. However, how different thirst modalities are encoded in the brain remains unknown. Here, we employed stimulus to cell-type mapping using single-cell RNA-seq (scRNA-seq) to determine the cellular substrate underlying distinct types of thirst. These studies revealed diverse excitatory and inhibitory neuron types in each CVO structure. Among them, we show that unique combinations of neuron types are activated under osmotic and hypovolemic stresses. These results elucidate the cellular logic underlying distinct thirst modalities. Furthermore, optogenetic gain-of-function in thirst-modality-specific cell types recapitulated water-specific and non-specific fluid appetite caused by the two distinct dipsogenic stimuli. Taken together, this study demonstrates that thirst is a multimodal physiological state, and that different thirst states are mediated by specific neuron types in the mammalian brain.
In the mammalian brain, fluid imbalance is detected by LT CVOs, the sensory organs of the brain that lack the normal blood-brain barrier7. The subfornical organ (SFO) and organum vasculosum lamina terminalis (OVLT) are the forebrain CVOs that sense internal fluid status and regulate drinking behavior through their downstream brain sites. The majority of excitatory neurons in these CVOs are activated under dehydration, and acute stimulation of the same population instantly drives thirst8–10, highlighting the causal relationship between SFO and OVLT excitatory neurons with thirst.
Peripheral sensory systems such as taste and olfaction can detect multiple stimuli through unique cell types. Similarly, the brain can detect at least two distinct thirst-inducing stimuli: osmolality increase and volume decrease in the systemic circulation. Moreover, these two thirst types, osmotic and hypovolemic thirst drive quite different fluid intake patterns1. When the brain detects osmolality elevation, animals only consume water to alleviate hyperosmotic stress. Conversely, reduced systemic volume induces vigorous intake of both water and salts to recover blood volume at the appropriate osmolality. Natural dehydration is a combination of these two stimuli. Therefore, while both types of thirst trigger drinking behavior, solute preference is drastically different to achieve distinct internal consequences. The work in the past several decades revealed histological and behavioral aspects of individual thirst stimuli in exquisite detail11. Nevertheless, the neural basis underlying distinct thirst modalities remain unexplored. Here, we employ single-cell transcriptomic, neural manipulation, and genetic approaches to demonstrate that each dipsogenic stimulus is represented by a unique combination of CVO neurons of the LT. Furthermore, optogenetic activation of these neural populations triggered distinct drinking outputs corresponding to respective thirst states.
Elevation of blood osmolality and/or loss of body fluid induces robust c-Fos expression in the SFO and OVLT as a proxy of neural activation (Fig. 1a, Extended Data Fig. 1a). Consistent with previous studies1, acute osmotic stress by intraperitoneal (i.p.) injection of hypertonic solutes triggered selective consumption of water over sodium chloride solution (Fig. 1b and c, Extended Data Fig. 1b). Acute hypovolemia by polyethylene glycol (PEG) or furosemide injection resulted in an increased appetite toward both water and salt solutions (Fig. 1b and c, Extended Data Fig. 1b). Notably, the preference toward salt was not selective to NaCl, but animals accepted other salts such as KCl12 (Extended Data Fig. 1c). Water-deprived animals showed preference toward water over salts, and sodium-deprived mice selectively consumed sodium demonstrating specific fluid appetite under distinct internal states (Fig. 1b). We next asked whether osmotic and hypovolemic stresses are detected by the same neurons in CVOs. To test this, we employed an activity-dependent genetic labeling strategy where c-Fos positive neurons can be permanently labeled (TRAP213: Extended Data Fig. 1d). Injection of hypertonic saline induced robust labeling in the SFO and OVLT (Osm-TRAP, Fig. 1d, Extended Data Fig. 1e). A majority of these Osm-TRAP neurons overlapped with hyperosmolality-induced acute c-Fos expression (Fig. 1d, e, and Extended Data Fig. 1e–g). By contrast, much less Osm-TRAP cells were labeled by hypovolemia-induced c-Fos. These results suggest that osmotic thirst and hypovolemic thirst activate unique sets of cells in CVOs.
Figure 1. Fluid consumption, physiological changes, and neural activation pattern under distinct thirst states.
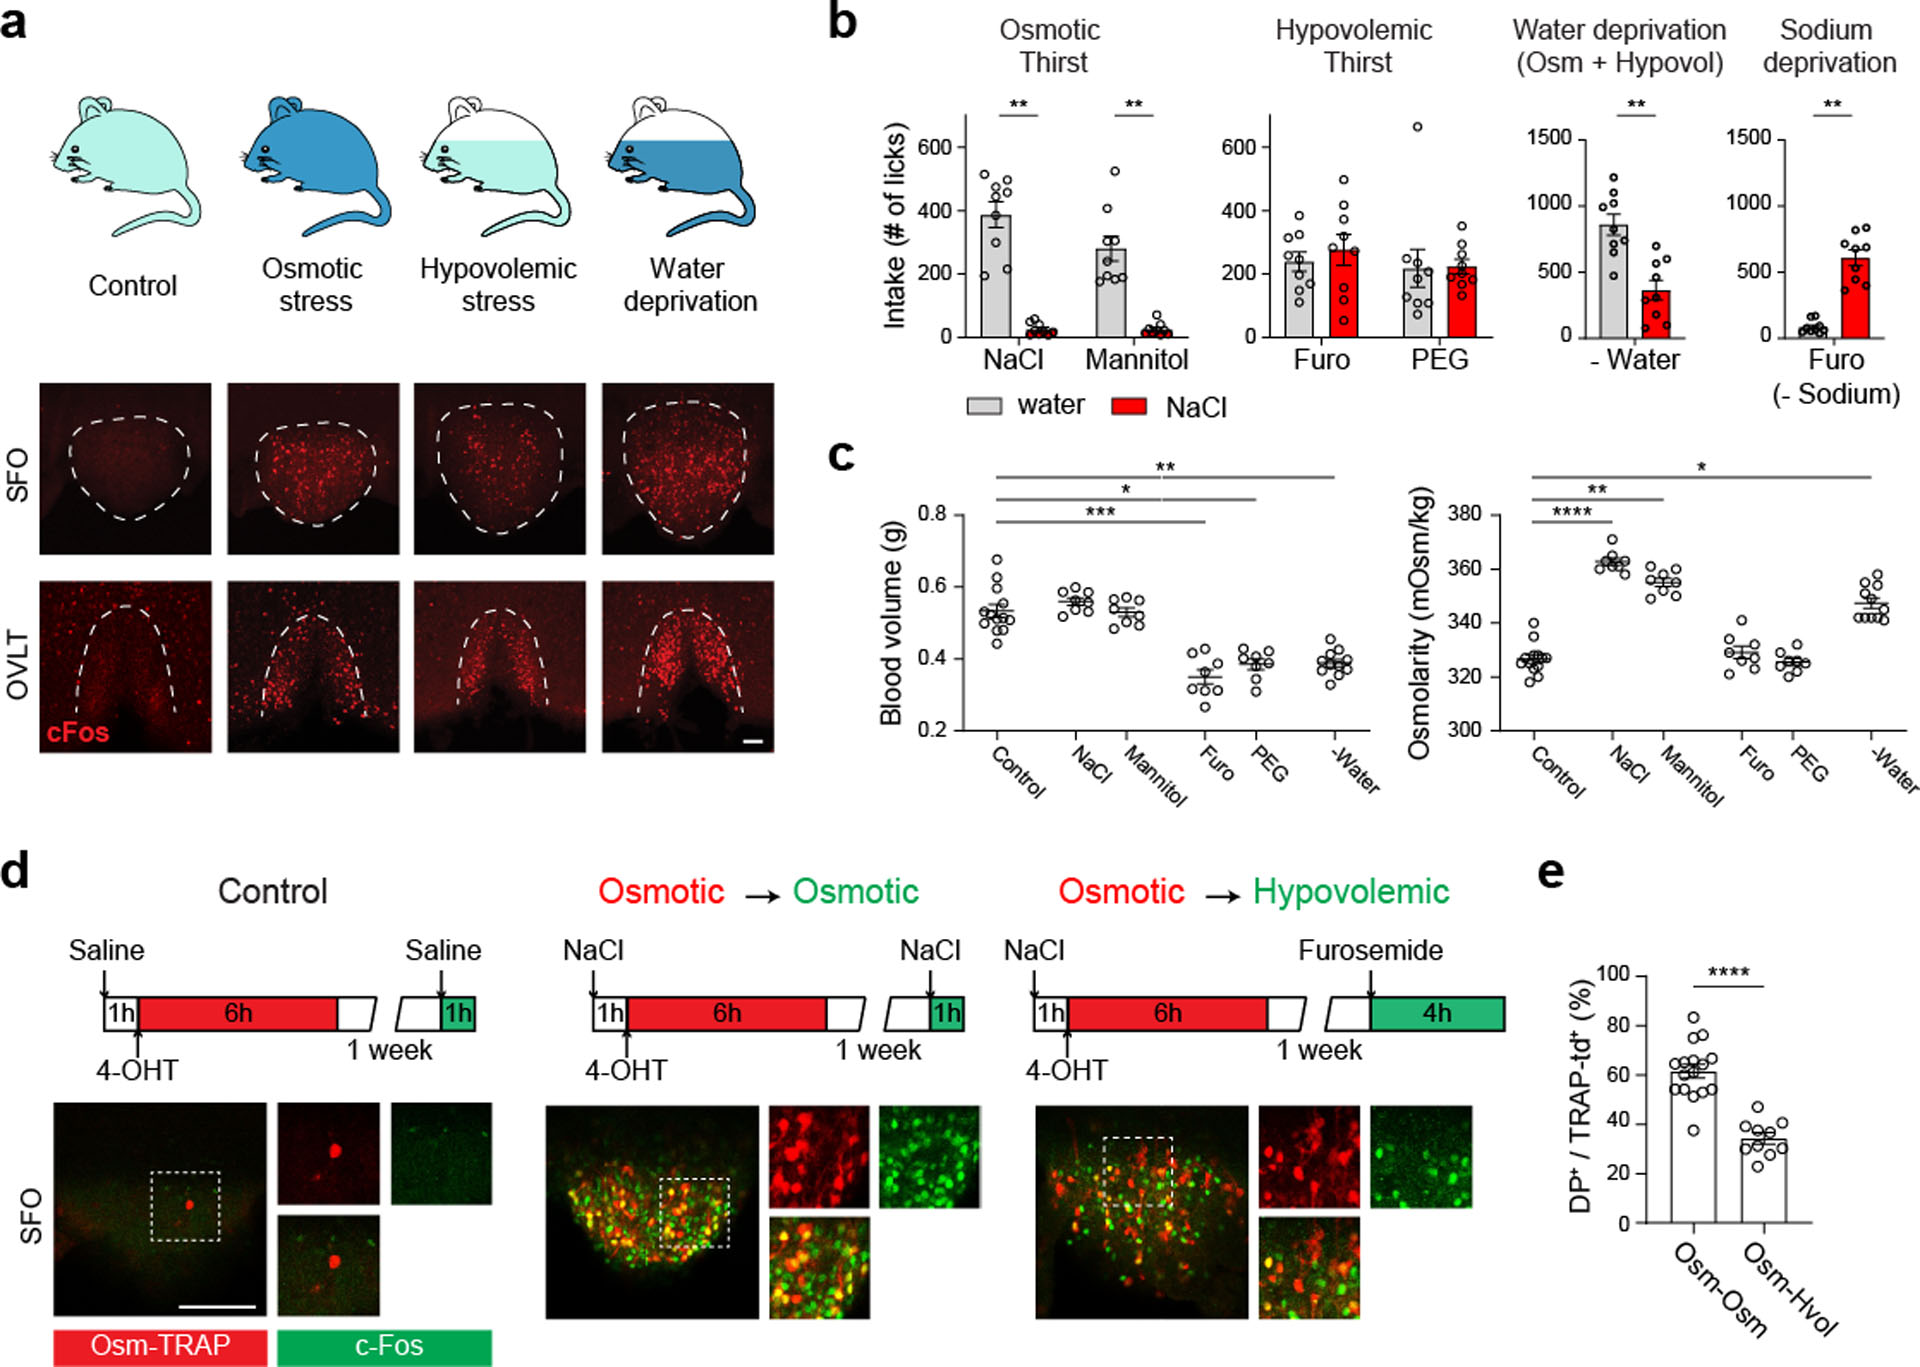
a, Schematic of different thirst states (top): sated (control), osmotic stress, hypovolemic stress, and water-deprivation. Representative images of c-Fos expression are shown for the SFO (middle) and OVLT (bottom, one from 6 mice). b, Water (grey) and hypertonic saline intake (0.3 M NaCl, red) under different thirst states during a one-hour session (n = 9 mice). c, Blood volume and osmolality under different thirst states (n = 13 mice for control, 8 for NaCl, Mannitol, Furo, and PEG, and 11 for water deprivation). d, Genetic labeling of thirst-sensitive neurons in TRAP2/Ai14 mice (top). Osmolality sensitive neurons (Osm-TRAP, red) in the SFO (bottom) overlapped with NaCl-induced acute c-Fos expression (green). By contrast, significantly smaller fractions of Osm-TRAP neurons were co-labeled with hypovolemia-induced c-Fos. e, Quantification of TRAP2 experiments (n = 16 sections from 8 mice for Osm-Osm, 10 sections from 5 mice for Osm-Hvol). * p < 0.05, ** p < 0.01, *** p < 0.001, **** p < 0.0001 by two-tailed Wilcoxon matched-pairs signed rank test, Kruskal-Wallis test followed by a Dunn’s post test or Mann-Whitney test. Data are shown as mean ± s.e.m. Scale bars, 50 μm.
The LT contains many cell types and regulates a broad range of physiological functions including water and salt balance, blood pressure, cardiovascular function, and neuroendocrine outputs14,15. However, our understanding of the molecular and cellular organization of this important brain structure is still limited13. To tackle this bottleneck, we employed high throughput droplet-based scRNA-seq analysis on the 10X Genomics platform to reveal the cellular diversity of CVOs. We surgically isolated the SFO and OVLT from fresh brain tissue, prepared cell suspensions, and generated scRNA-seq libraries with 7950 and 6161 single-cell transcriptomes, respectively. To identify major cell classes, we performed unsupervised clustering on a graph-based representation of the highly variable gene expression space and visualized the outcome in a UMAP-embedding16,17 (Fig. 2a and b). These analyses revealed 12 and 13 major cell classes in the SFO and OVLT, respectively (Fig. 2a, b, Extended Data Fig. 2a–d). Notably, we found a few uncommon cell types present in CVOs. For example, both the SFO and OVLT harbor a specialized endothelial cell class that is labeled by the expression of Plvap (Extended Data Fig. 2a, b). Moreover, both CVOs contain a specialized LT astrocyte class labeled by Ucma (Extended Data Fig 2a–d). These cell types may play an important role in the tissue function such as vasculature permeability18. Our analysis also revealed the gene expression patterns of previously-proposed osmosensory ion channels, peptide hormones and hormone receptors implicated in fluid homeostasis1,19,20 (Extended Data Fig. 3).
Figure 2. Major cell classes and neuron types in the SFO and OVLT.
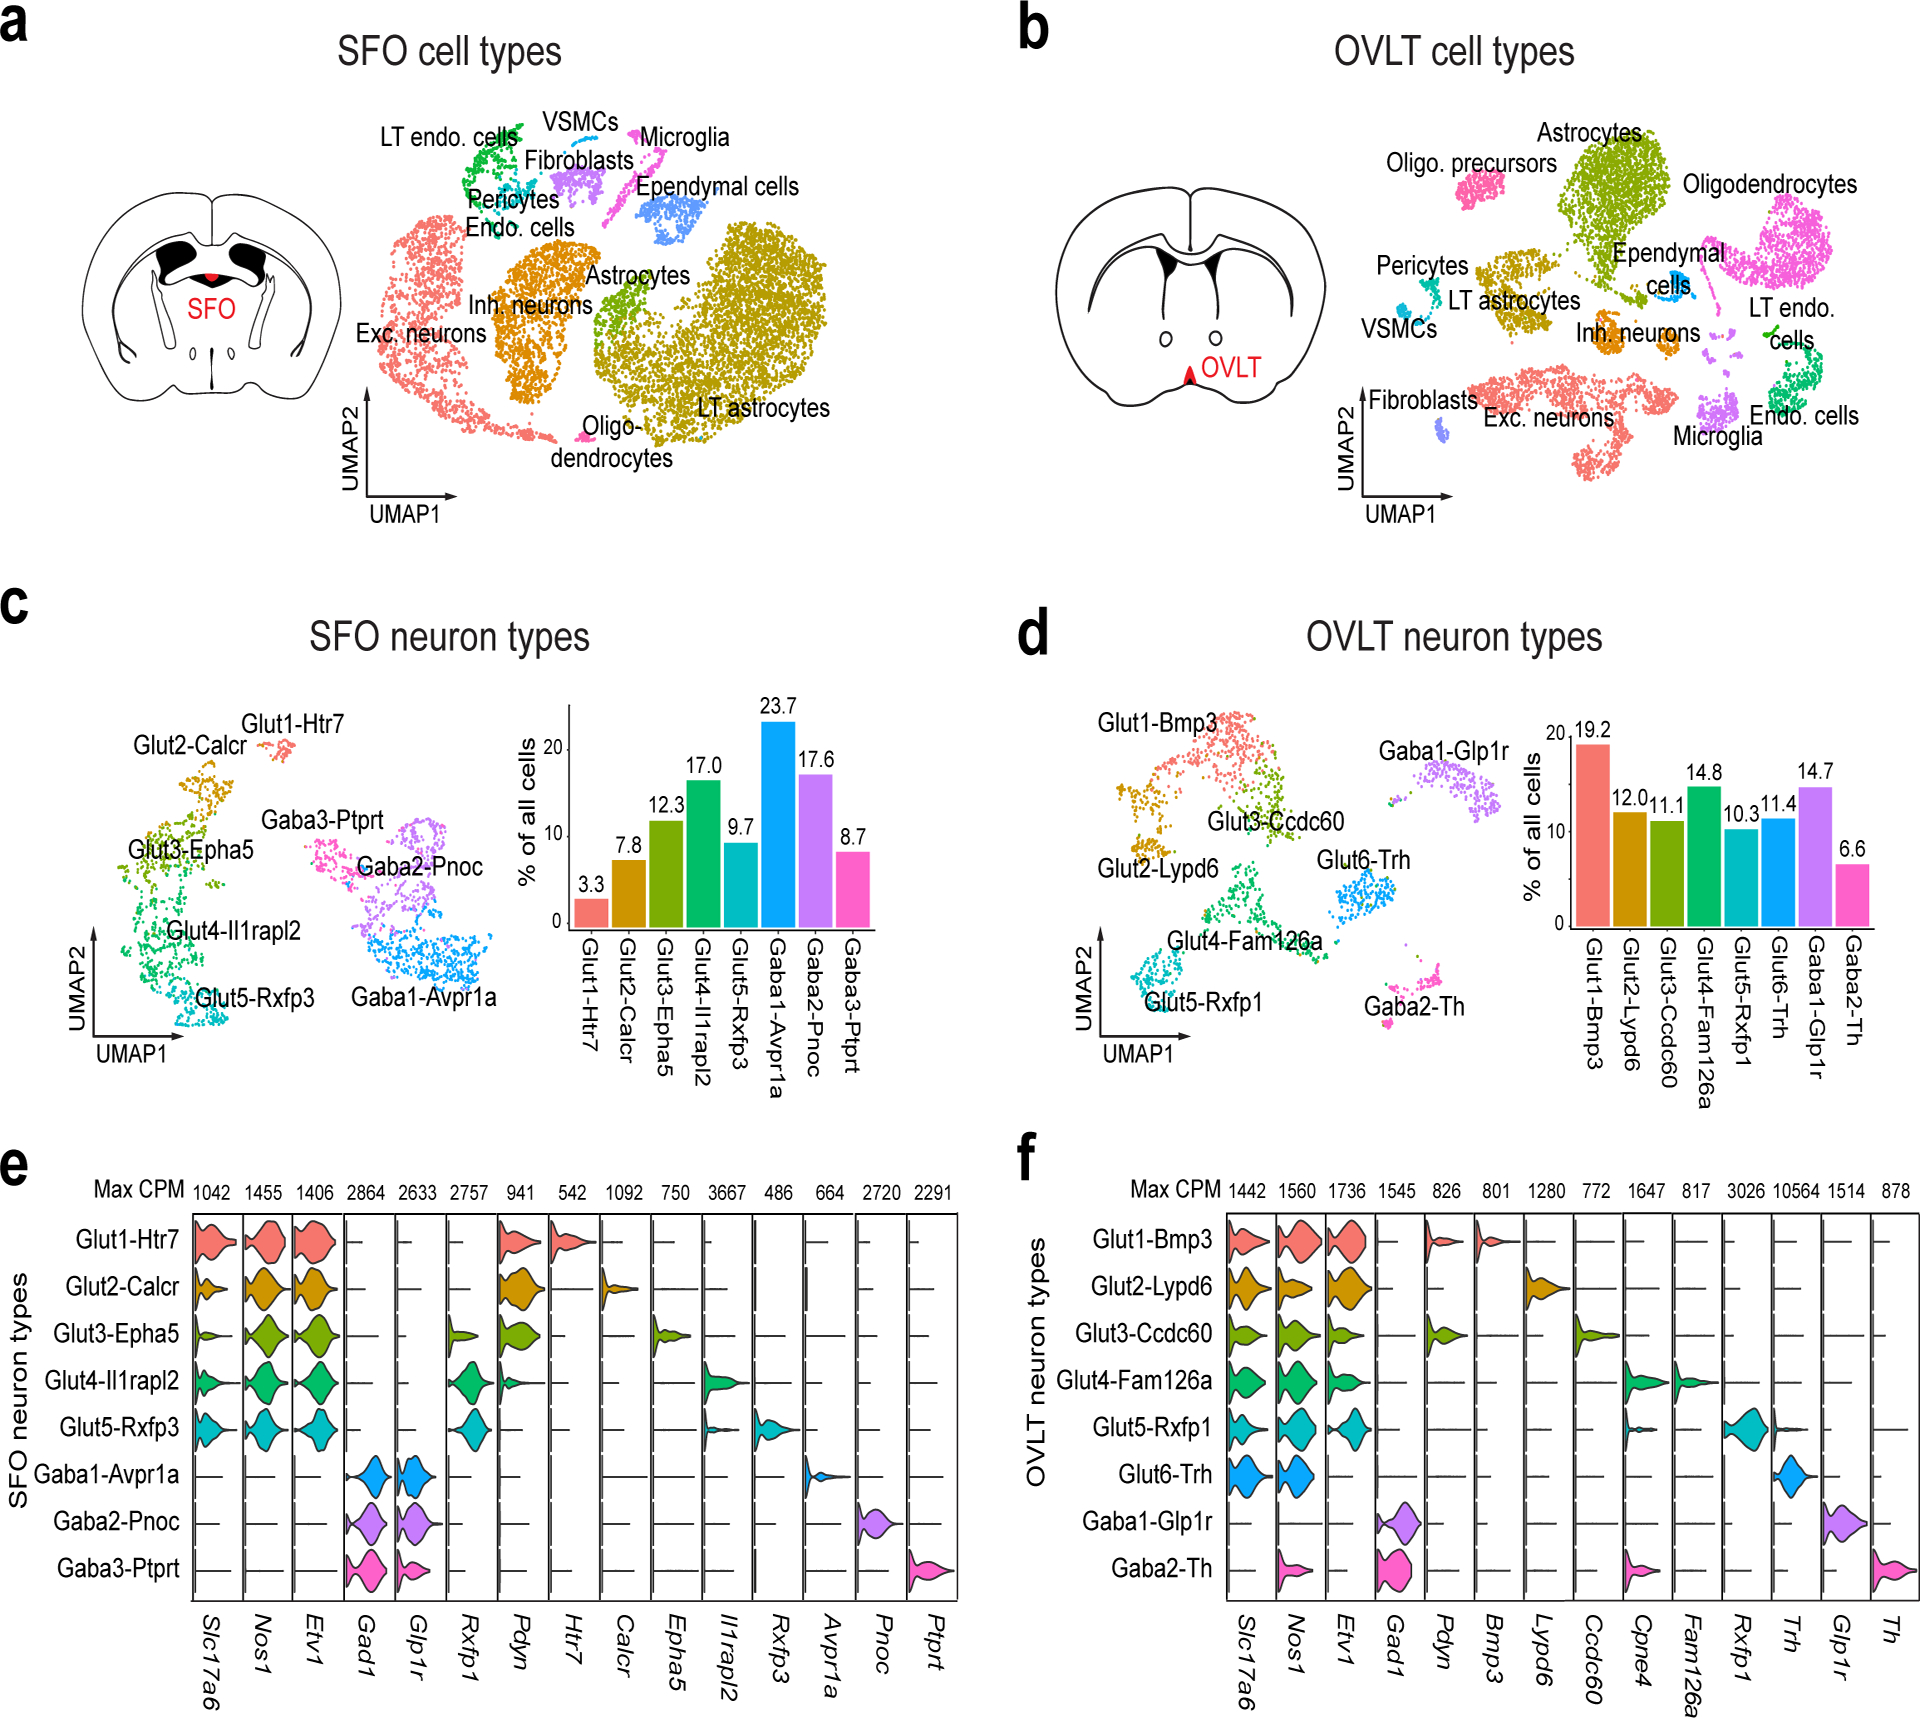
a and b, Transcriptomic analyses of the SFO and OVLT. The SFO contains 12 transcriptomic cell classes shown in a UMAP embedding of 7950 cells with color-coded cell identity (a), OVLT contains 13 transcriptomic cell classes (n= 6161 cells) (b). c and d, Transcriptomic analyses of neuron types in the SFO and OVLT. The SFO contains 5 transcriptionally distinct excitatory and 3 inhibitory neuron types shown in a UMAP embedding with color-coded cell identity (c, left, n=2642 cells). The prevalence of each neuron type is shown (c, right). The OVLT contains 6 excitatory and 2 inhibitory neuron types (d, n=1511 cells). e and f, Violin plot of log-normalized expression of cell-type-defining genes for SFO (e) and OVLT (f) neuron types with maximum counts per million (max CPM).
We further analyzed 2642 SFO and 1511 OVLT single-cell neuronal transcriptomes (Fig. 2c–f). We found remarkable diversity among excitatory neurons with less pronounced differences among inhibitory neurons. We found 5 excitatory and 3 inhibitory neuron types in the SFO (Fig. 2c and e) and 6 excitatory and 2 inhibitory neuron types in the OVLT (Fig. 2d, f, Extended Data Fig. 2e–h). In accordance with previous findings, all SFO excitatory neurons and 5 of 6 OVLT excitatory neurons expressed Etv1, a genetic marker that labels dehydration-sensitive neurons10.
To identify specific cell types involved in distinct thirst modalities, we functionally mapped thirst-activated neurons using immediate early gene (IEG) expression21,22. To this end, we developed and optimized a 10x Chromium-based stimulus to cell-type mapping approach. We performed scRNA-seq experiments in the presence of a transcription blocker under four different conditions: sated, osmotic stress, hypovolemic stress, and water-deprivation (Fig. 3a). This enabled us to eliminate dissociation-related IEG upregulation observed in canonical scRNA-seq experiments and revealed the stimulus-induced activation pattern at a cell-type level (Extended Data Fig. 4 and 5). Similar to regular scRNA-seq, we identified corresponding neuron subtypes in all four conditions (Extended Data Fig. 5d and e). Almost no IEG expression was observed in sated animals in any neuron types whereas most excitatory neurons exhibited robust c-Fos expression after water deprivation8,10,23 (Fig. 3b and c). Interestingly, we found different sets of neuron types activated under osmotic- and hypovolemic-thirst (Fig. 3c and Extended Data Fig. 4e). One excitatory neuron type in each structure (SFO: Glut1-Htr7 and OVLT: Glut1-Bmp3) was robustly activated under hypovolemic but not under osmotic thirst. Conversely, other neuron types were selectively activated by osmotic stress (SFO: Glut5-Rxfp3 and OVLT: Glut4-Fam126a, and Glut5-Rxfp1). We also found a few cell types activated under both osmotic and hypovolemic stresses (SFO: Glut4-IIrap1l2, OVLT: Glut2-Lypd6). Thus, distinct thirst states activate a unique combination of cell types in CVOs. Importantly, natural water-deprivation activated both osmotic- and hypovolemic-sensitive cell types (Fig. 3c).
Figure 3. Stimulus to cell-type mapping reveals neuron types tuned to distinct thirst states.
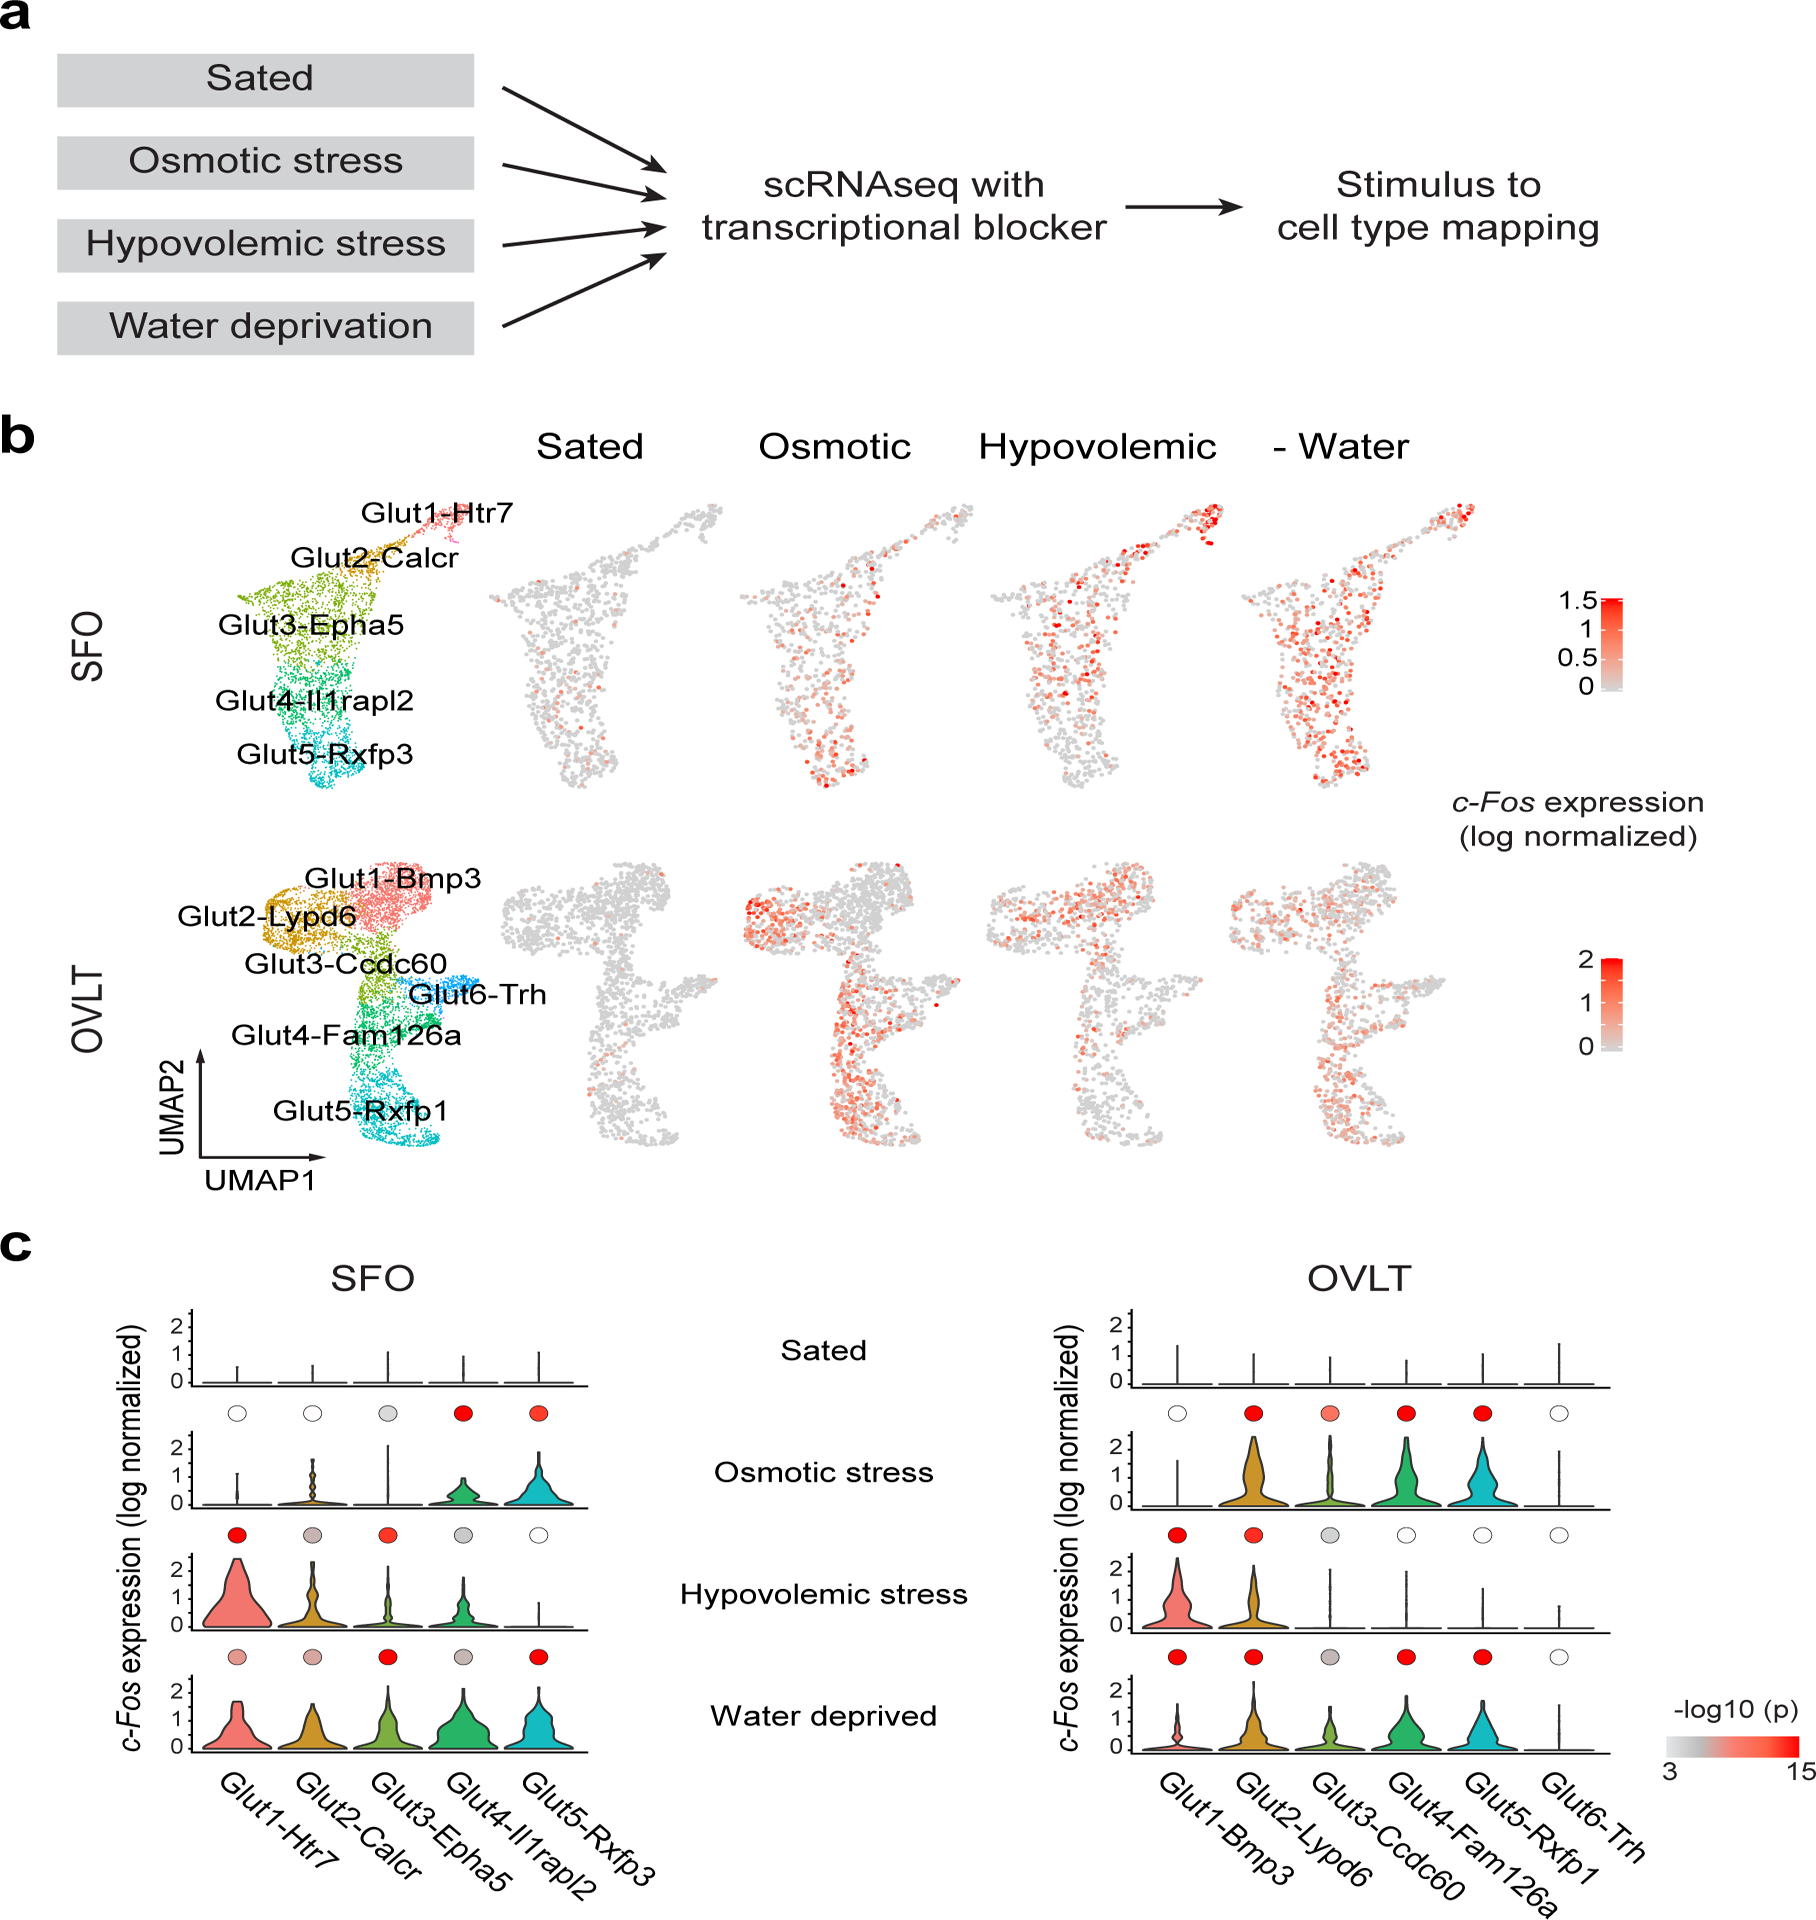
a, Experimental design for identifying active neurons under distinct thirst states. scRNA-seq was performed in the presence of actinomycin D, a transcriptional blocker. Activated neuron types were mapped based on IEG expression. b, Neuronal data from the SFO (top) and OVLT (bottom) under four physiological conditions were aligned using Canonical Correlation Analysis (CCA) and mapped on a UMAP embedding (n= 6540 and n = 7206 neurons for SFO and OVLT, respectively). Expression of c-Fos is plotted on a log-normalized scale as a proxy for neural activation (red). 1866, 1403, 1772 and 1499 neurons (SFO), and 1841, 2257, 1461 and 1647 neurons (OVLT) were analyzed For control, osmotic stress, hypovolemic stress and water deprivation states. c, Violin plot of log-normalized c-Fos expression under different thirst states with color-coded log scaled p-values (–log10p). Two-tailed Kruskal-Wallis test with Dunn’s post test was used to compare cell type specific gene expression under control conditions to corresponding cell types in three experimental conditions. White color indicates p>0.001.
Next, we validated our transcriptomic clustering by fluorescent in situ hybridization (Extended Data Fig. 6). We focused on a pair of neuron types activated by different dipsogenic stimuli (SFO: Glut1-Htr7 and Glut4-Il1rapl2/Glut5-Rxfp3 labeled by Rxfp1 and OVLT: Glut1-Bmp3 and Glut5-Rxfp1). As predicted from our scRNA-seq data, each pair of genes were expressed in distinct cells. We further validated thirst-state-specific activation of single neuron classes (SFO: Glut1-Htr7, Glut5-Rxfp3; OVLT: Glut1-Bmp3 and Glut4-Fam126a labeled by Cpne4). Taken together, our transcriptomic analyses on CVOs revealed that 1) each sensory nucleus contains multiple classes of thirst neurons, and 2) distinct dipsogenic stimuli are encoded by unique combinations of neuron types.
Recent transcriptomic studies have successfully revealed cell types, spatial organization, and their putative functions24,25. Few cases, however, examined the causal relationship between the activity of functionally-relevant cell types and behavioral consequences. To fill this gap, we utilized the transcriptomic information to identify genetic markers that best correlate with the c-Fos activation pattern using Spearman correlation. These analyses found that Rxfp1 and prodynorphin (Pdyn) expression strongly correlate with neural activation patterns under osmotic and hypovolemic thirst, respectively (Fig. 4a–c and Extended Data Fig. 7a). The expression of these two genes are largely non-overlapping in the SFO and OVLT (Extended Data Fig. 7b). If osmolality-sensitive Rxfp1 neurons (SFO: Glut4–5 and OVLT: Glut5) indeed mediate osmotic thirst, we predict that stimulation of this neural population should drive pure water consumption. To test this hypothesis directly, we generated knock-in mice expressing Cre-recombinase after the coding sequence of Rxfp1 (Rxfp1-Cre, Extended Data Fig. 7c and d). For manipulation experiments, we injected adeno-associated virus (AAV) encoding Cre-dependent channelrhodopsin2 (AAV-DIO-ChR2-EYFP) into the CVOs of Rxfp1-Cre animals (Fig. 4d left panels). We then implanted an optic fiber above the SFO or OVLT for light delivery. Upon stimulation of Rxfp1 neurons with blue light, sated animals exhibited vigorous appetite toward water, but refused to consume hypertonic NaCl and other salts (Fig. 4d middle panels, Extended Data Fig. 8a, b, and Supplemental Video 1). This specific appetite recapitulates the natural drinking behavior under osmotic stress.
Figure 4. Activation of thirst-state-specific cell populations in the SFO and OVLT recapitulates thirst modality specific drinking patterns.
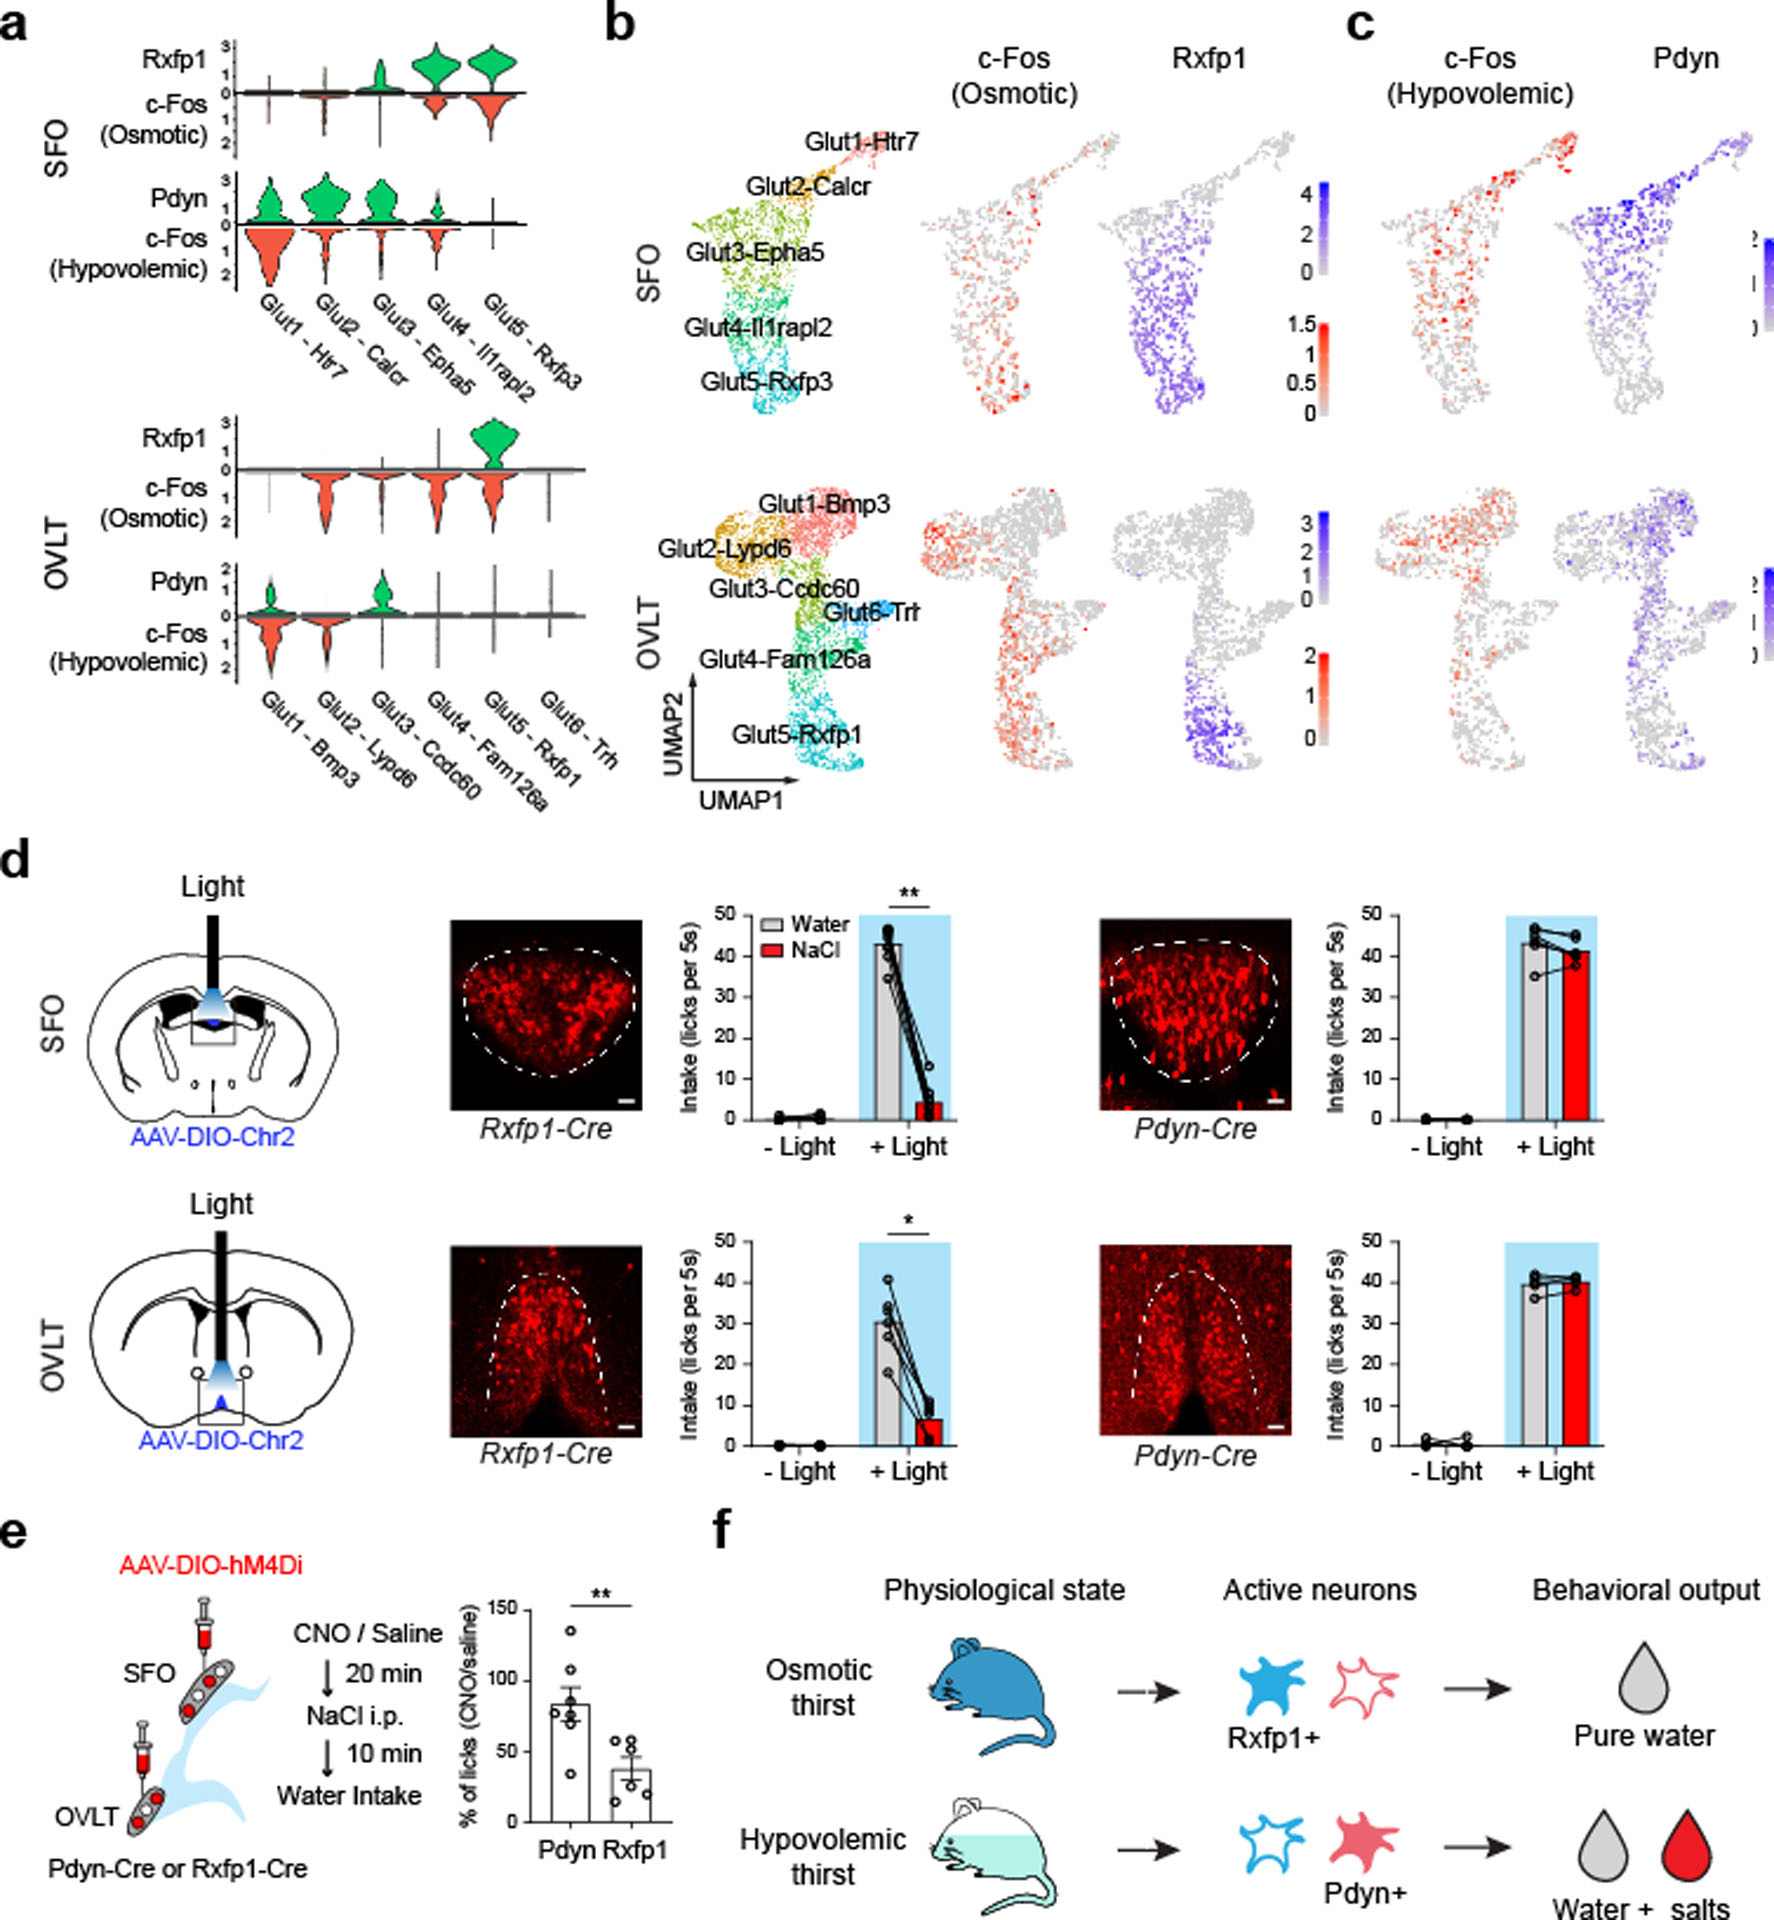
a, Violin plot of Rxfp1 and Pdyn log-normalized expression in SFO and OVLT excitatory neuron types (green) compared to thirst-state-specific c-Fos expression (red) in corresponding cell types. The data were reanalyzed from Fig. 2 and 3. b and c, UMAP embedding for Rxfp1 and Pdyn expression (blue) in SFO (top) and OVLT (bottom) excitatory neuron types. C-Fos data are replotted for reference from Fig. 3b. d, Optogenetic activation of osmotic and hypovolemic stress sensitive neurons in the SFO (top) and OVLT (bottom). Diagram of optogenetic gain-of-function experiments for distinct thirst neuron subtypes (left). Representative images of Rxfp1-Cre labeled cells (middle, Rxfp1-Cre/Ai14). Consumption of pure water (grey) and 0.5M NaCl (red) were quantified from 9 mice for SFO and 6 mice for OVLT. Conversely, stimulation of Pdyn neurons drives consumption of both water and hyperosmotic salt solution (right), Data are quantified from 6 mice for SFO and 5 mice for OVLT. Scale bar = 10 um. e, Schematic of chemogenetic inhibition of Rxfp1- and Pdyn-positive neurons under osmotic thirst (left). NaCl (i.p.)-induced drinking was significantly suppressed by the inhibition of Rxfp1-positive neurons (n = 6 mice), but not by Pdyn-positive neurons (n = 7 mice). f, Diagram depicting the cellular logic underlying distinct thirst states. * p < 0.05, ** p < 0.01, *** p < 0.001, **** p < 0.0001, by two-tailed Wilcoxon matched-pairs signed rank test or Mann-Whitney test. All data are shown as mean ± s.e.m.
Similarly, Pdyn expression (SFO: Glut1–3 and OVLT: Glut1 and 3) partially correlates with hypovolemia-sensitive neurons (Fig. 4a–c, and Extended Data Fig. 7a). Consistent with hypovolemia-induced drinking, optogenetic stimulation of Pdyn neurons in the SFO and OVLT triggered non-specific drinking behavior toward both water and hyperosmotic salt solutions (Fig. 4d right panels and Extended Data Fig. 8a, b, and Supplemental Video 2). Note that appetite selectivity is unrelated to fluid consumption levels (i.e., craving levels) because stimulation of both Rxfp1 and Pdyn neurons induced similar levels of total fluid intake (Extended Data Fig. 8c). Finally, chemogenetic inhibition of Rxfp1- but not Pdyn-positive neurons strongly suppressed osmotic-stress-induced water intake (Fig. 4e). Together, these results show that distinct thirst modalities are mediated by a unique set of thirst neurons, activation of which induces specific drinking patterns. Importantly, optogenetic stimulation of Pdyn neurons did not drive sodium-eating behavior, a typical behavior induced by sodium appetite (Extended Data Fig. 8d). Moreover, hypovolemic stress did not activate sodium appetite neurons in the hindbrain26,27 (Extended Data Fig. 8e). Thus, hypovolemia-induced mineral ingestion is unlikely to be a consequence of the activation of sodium appetite circuits.
In the past half-century, it has been well established that CVOs play a pivotal role in fluid homeostasis7,28. However, the precise molecular census has not been established to date. Our single-cell transcriptomic study revealed comprehensive cell types in the SFO and OVLT, two critical sensory organs that monitor internal water balance. ScRNA-seq-based stimulus to cell-type mapping further unveiled cell types involved in two distinct thirst states caused by either systemic hyperosmolality or hypovolemia. These results elucidated the cellular basis of two thirst modalities (Fig. 4f).
One of the common functions of peripheral sensory systems is to distinguish among different stimulus qualities (e.g., sweet vs bitter). This enables animals to react and behave appropriately toward different stimuli. Our study shows that this principle is also true for central sensory systems where distinct cell types are uniquely tuned to internal stimuli. We show anatomical and functional evidence that thirst consists of two distinct modalities represented by unique neural ensembles in the brain. Stimulation of osmolality- and hypovolemia-sensitive neurons drives different drinking patterns to restore the deficits caused by each stress. Furthermore, these two types of thirst neurons are housed in the same brain structures, which highlights the similar coding principles employed by peripheral sensory systems.
In mammals, the brain has two osmosensory organs, the SFO and OVLT, which are functionally redundant for sensing internal water balance. Our transcriptomic analyses enabled a systematic comparison between these two structures at both molecular and cellular levels. Two CVOs largely share corresponding major cell classes and neuron types, and gene expression patterns related to potential osmoregulatory molecules29 (Extended Data Fig. 3). These results suggest that the SFO and OVLT are parallel entry points that independently sense fluid balance, and drive dedicated downstream behaviors. However, we found that astrocytes in the SFO, but not OVLT are strongly activated by osmotic stress. Thus, SFO astrocytes may have a dedicated function in fluid regulation30.
Previous studies defined excitatory neurons in the LT as thirst neurons using two criteria. First, they are activated under dehydration, and second, stimulation of these neurons drives drinking behavior8–10. However, we show that these neurons contain at least two functionally distinct components: one for water-specific appetite, and another for non-specific fluid appetite. These neuron groups are labeled by the expression of Rxfp1 and Pdyn. Interestingly, Rxfp1 and Pdyn neurons mostly comprise multiple transcriptomic cell types among excitatory neurons. Interestingly, Rxfp1 labels a single osmotic thirst activated cell type in the OVLT, the activation of which drives water appetite. It would be important to investigate how other individual cell types contribute to different thirst states. Our results stress the importance of dissecting neural circuit function at the level of transcriptomic cell types and that functionally-defined neuronal groups often contain subpopulations that have related but distinct functions to achieve a given behavior.
Methods
Animals
All animal care and experimental procedures were carried out in accordance with the US NIH guidance for the care and use of laboratory animals and approved by California Institute of Technology Animal Care and Use Committee (protocol #1694–14). Mice used for behavioral experiments were both male and female, at least eight weeks of age. For scRNA-seq experiments determining SFO and OVLT cellular nomenclature we used 7.5 – 8 week old C57BL/6J male mice with tissue accumulated from 8–12 animals per structure. For stimulus to cell-type mapping related scRNA-seq experiments we used 48 C57BL/6J animals (24 male and 24 female divided in equal counts between 4 experimental batches) at 7.5–8 weeks of age. The following mice were purchased from the Jackson Laboratory: C57BL/6J (JAX strain 000664); Ai3, (JAX strain 007903); Ai14 (JAX strain 007914). Pdyn–Cre mice were a gift from B. Lowell and M. Krashes. TRAP2 mice were a gift from Liqun Luo. Mice were housed in temperature- and humidity-controlled rooms with a 13 hours:11 hours light:dark cycle with ad libitum access to chow and water.
Generation of Rxfp1-P2A-Cre mouse line
Rxfp1-P2A-Cre animals were created by nucleofection of 106 v6.5 mouse embryonic stem cells (C57/BL6;129/sv; a gift from R. Jaenisch) with ribonucleoprotein (RNP) complexes composed of SpCas9-NLS protein and in vitro transcribed sgRNA (ACTCAATTCTTATTCGTAAC). To enable homology directed repair (HDR), a repair construct in which P2A-Cre was flanked with sequences homologous to the target site was cotransfected with RNP complexes. Colonies grown from transfected cells were directly screened for successful integration. The inserted transgene was fully sequenced from positive clones. Candidate lines were also analyzed for normal karyotype. The first line passing quality control was aggregated with albino morula and implanted into pseudopregnant females, which produced germ line competent chimeric founders.
Viral constructs
The following AAV viruses were purchased from Addgene: AAV5-EF1a-DIO-ChR2-EYFP (Addgene #20298-AAV5), 3.0·1013 viral genomes per ml. AAV8-DIO-hM4Di-mCherry (Addgene #44362), 1.9·1013 viral genomes per ml.
Surgery
Surgery procedures were performed as previously described8,10. Briefly, animals were anesthetized with a mixture of ketamine (1 mg/ml) and xylazine (10 mg/ml) in isotonic saline, injected intraperitoneally (i.p.) at a dose of 10 μl/g bodyweight. Ketoprofen was also subcutaneously administered at 5 μl/g bodyweight. The mouse was then placed in a stereotaxic apparatus (Narishige #SR-5M-HT) on a heating pad at 37 °C. Mouse skull was exposed by an incision of the scalp followed by application of the topical analgesic bupivacaine (2.5 mg/ml). A small craniotomy, less than 1 mm, was made using a hand drill at the regions of interest. Virus injections were performed with pulled glass pipettes using a microprocessor-controlled injection system (World Precision Instruments, Nanoliter 2000) at 100 nl/min. SFO virus injections were performed using the following stereotaxic coordinates with respect to the lambda aligned bregma point: + 800 μm A/P, 0 μm M/L, +2800 μm below the surface of the skull. OVLT virus injections were performed using the following stereotaxic coordinates: −500 μm A/P, 0 μm M/L, +5260 μm below the surface of the skull. Total of 50 – 90 nL of virus was delivered per injection. For optogenetics experiments, optogenetic implants were prepared by gluing a 200-μm diameter optic fiber (Thorlabs, FT200EMT) to a ceramic ferrule (CF230–10, Thorlabs) with epoxy glue. The implants were placed 300 μm above the virus injection site and attached to the skull with Vetbond (SCB, sc-361931) and dental cement (Lang Dental Mfg. Co, #4720FIB, #Jet Liquid). All mice were placed in a clean cage on a heating pad overnight to recover, and were then housed in the animal facility. Behavioral tests were performed after at least 10 days of recovery. At the end of experiments, all animals were euthanized and histologically examined for virus expression as well as the fiber implant position.
Optogenetic manipulation
For optogenetic photostimulation, 473-nm laser pulse sequences (20 ms, 20 Hz, 30 sec pulse sequence) were delivered via an optic cable (MFP-FC-ZF, Doric Lenses) using a pulse generator (World Precision Instruments, SYS-A310) for all behavioral assays performed in the custom gustometer (Dialog Instruments). For rock salt experiments, pulse sequences (20 ms, 20 Hz, repeated pulse sequence of 1 sec on, 3 sec off) were generated by a pulse generator (Quantum Composers, Sapphire 9200). The laser intensity was maintained at 5 mW at the tip of the fiber.
Induction of physiological states
Osmotic thirst was induced by an intraperitoneal (i.p.) injection of either 2 M NaCl (5 μl/g bodyweight) or 2 M mannitol solution (10 μl/g bodyweight). After 10 min in the home cage without food or water, animal behavior was tested. For immunohistochemistry or scRNA-seq, animals were kept in the home cage without access to food or water for one hour to allow for stimulus induced expression of immediate early genes.
Hypovolemic thirst was induced either by an i.p. injection of furosemide (Sigma, F4381) at a dose of 50 mg/kg bodyweight or subcutaneous (s.c.) injection of 40% polyethylene glycol (PEG, Sigma, 89510) at a dose of 10 mL/kg body weight. Mice stayed in a clean cage without food or water for either 3 hours after furosemide injection or 6 hours after PEG administration followed by behavioral testing. Tissue collection for immunohistochemistry or scRNA-seq was done either 4 hours after furosemide or 7 hours after PEG administration.
For water deprivation experiments, animals were kept in their home cages without water for 36 hours, and were provided with food and 1 ml of water daily. For sodium-restriction experiments, a low-sodium diet (Envigo, TD. 90228) and water were provided for one day after furosemide injection at a dose of 50 mg/kg bodyweight. After that, animals were tested for behavior or sacrificed for scRNA-seq as well as immunohistochemistry experiments. All animals were given at least two days on the normal diet to recover after each treatment.
Behavioral assays
All behavioral assays were performed in a custom gustometer (Dialog Instruments) system with different paradigms, unless otherwise noted. Animals used were water deprived 24 hours for training in the gustometer before behavioral assays. For two-choice consumption preference assay, one bottle of water and one bottle of mineral solution (0.3 M or 0.5 M NaCl, 0.3 M or 0.5 M KCl, 0.05 M MgCl2, or 0.05 M CaCl2) were presented in sequence during the same session as previously described, measuring the number of licks towards different solutions10. For Fig. 1 and Extended Data Fig. 1, mice of different thirst states were recorded for an hour containing a number of 60-sec trials. After the first lick of each trial, mice had ad libitum access to the spout for 5 sec. There is a 10-sec interval between each trial.
For optogenetics experiments, 30 sec of photostimulation was delivered to sated animals for each trial, with an inter-trial-interval of 60 sec. Animals were given 5 sec access to solution within one trial. Using the same two-choice preference assay, we measured animal consumption preference for 10 trials in total. To evaluate total fluid intake caused by photostimulation, one bottle of water was presented to the same testing animals for 20 trials.
For chemogenetic inhibition experiments, CNO was administrated at 10 mg/kg body weight, 20 min before osmotic thirst induction. Animals were then provided with a bottle of water for 30 min.
During the training session of rock salt experiments, sodium deprived animals were accustomed for an hour in a transparent acrylic box (50 cm x 25 cm x 25 cm) with a rock salt (Halite Himalayan Crystal Salt) fixed in one corner. Lick events of animals were monitored for 30 min using a webcam under sated, photostimulated and sodium-deprived conditions, and bout frequency was manually quantified. For the photostimulation experiments, animals received pulses for one second every four seconds during the entire 30-min session.
Immunohistochemistry
Mice were euthanized with CO2 and perfused with PBS followed by 4% paraformaldehyde (PFA, pH=7.4). Mouse brains were extracted, post-fixed overnight at 4°C in 4% PFA and coronally sectioned at 100 μm intervals on a vibratome (Leica, VT-1000s). Brain sections were blocked (10% donkey serum, 0.2% Triton X-100 in PBS) for an hour at room temperature followed by overnight primary antibody incubation in block buffer at 4°C. The following primary antibodies were used: rabbit anti-c-Fos (1:500, Cell Signaling, #2250), sheep anti-FOXP2 (1:2000, R&D Systems, AF5647), rabbit-anti-ETV1 (1:500, Abcam, ab81086), chicken anti-GFP (1:1000, Abcam, ab13970), rat anti-mCherry (1:500, Invitrogen, 16D7). After washing 3 times with PBS, the brain sections were stained with secondary antibodies (1:500, Jackson Immunoresearch) and DAPI (2 μg/ml) for 4 hours at room temperature. After another 3 PBS washes, sections were mounted on glass slides and imaged on a confocal microscope (TCS SP8, Leica, using Leica Application Suite X 3.5.5.19976).
Genetic labeling of stimulus activated cell types (TRAP2)
Detailed generation and characterization of TRAP2 animals were described in previous studies13,43. We crossed TRAP2 animals with Ai14 animals and used double-positive mice for genetic labeling experiments. Food and water were removed after inducing osmotic thirst by injecting hypertonic saline (i.p.) as described above. 4-hydroxytamoxifen (4-OHT) (Sigma H6278) was dissolved at 20 mg/ml in pure ethanol by shaking at 37 °C for 15 min. The dissolved 4-OHT was mixed with double volume of corn oil (Sigma C8267) at room temperature for 15 min. Ethanol was evaporated in vacuum centrifugation. The final 10 mg/ml 4-OHT solution was injected (i.p.) at a dose of 50 mg/kg an hour later. Water and food were returned 6 hours after 4-OHT administration. Mice were given 1 week for fluorescent reporter expression before subjecting them to either osmotic thirst or hypovolemic thirst induction followed by immunohistochemistry for c-Fos expression.
Blood volume and osmolality measurements
8-week old C57BL/6J male mice were used for blood volume and osmolality measurements. After inducing different thirst states, animals were euthanized with CO2 and trunk blood was collected. . Extracted blood volume was quantified by weight. Plasma was then separated by centrifugation at 1600 g for 20 min. Plasma osmolality was measured using a Vapro 5520 osmometer.
Tissue processing into single cell suspensions and sequencing library construction for 10x scRNA-seq
7.5–8 week old animals were anaesthetized with isoflurane in an isolated plexiglass chamber. Brains were rapidly extracted and dropped into ice cold carbogenated (95% O2, 5% CO2) NMDG-HEPES-ACSF (93 mM NMDG, 2.5 mM KCl, 1.2 mM NaH2PO4, 30 mM NaHCO3, 20 mM HEPES, 25 mM glucose, 10 mM MgSO4, 1 mM CaCl2, 1 mM kynurenic-acid Na salt, 5 mM Na-ascorbate, 2 mM Thiourea, 3 mM Na-pyruvate, pH adjusted to 7.4, osmolarity ranging 300 – 310 mOsm). 2 mm brain sections containing either SFO or OVLT were cut with a razor blade on a stainless steel brain matrix (Stoelting #51392) and transferred to a dissection dish on ice containing NMDG-HEPES-ACSF. For SFO microdissections, the surface of the fornix was exposed and SFO was peeled off with forceps by grabbing the posterior end of the SFO and extracting the structure. For OVLT, the abdominal anterior surface of the 3rd ventricle containing the OVLT was exposed with forceps and OVLT was extracted by cutting out a triangular shape of tissue (height ~350 microns, base ~350 microns, depth 150 microns from the surface of the 3rd ventricle) with microsurgical stab knife (Surgical Specialties #72–1501). Microdissected tissue was aggregated from 8–12 animals per scRNA-seq run (12 animals for SFO and 8 animals for OVLT) in a collection tube on ice containing NMDG-HEPES-ACSF. For enzymatic digestion of tissue NMDG-HEPES-ACSF was replaced by Trehalose-HEPES-ACSF (92 mM NaCl, 2.5 mM KCl, 1.25 mM NaH2PO4, 30 mM NaHCO3, 20 mM HEPES, 25 mM glucose, 2 mM MgSO4, 2 mM CaCl2, 1 mM kynurenic-acid Na salt, 2.5 wt/vol trehalose, pH adjusted to 7.4, osmolarity ranging 330 – 340 mOsm) containing papain (60 U/ml Sigma Aldrich #P3125, pre-activated with 2.5 mM cysteine and a 30 min incubation at 34 ⁰C and supplemented with 0.5 mM EDTA). Extracted SFO and OVLT tissue was incubated at 34 ⁰C with gentle carbogenation for 1 hour 20 min and 50 min, respectively. During enzymatic digestion the tissue was pipetted periodically every 10 min. At the end of enzymatic digestion, the medium was replaced with 200 μl of room temperature Trehalose-HEPES-ACSF containing 3 mg/ml ovomucoid inhibitor (Worthington #OI-BSA) 25 U/ml DNAse I (Thermo Scientific #90083) and tissue was gently triturated into a uniform single cell suspension with consecutive rounds of trituration with fire-polished glass Pasteur pipettes with tip diameters of 600, 300 and 150 μm. Resulting cell suspension volume was brought up to 1 ml with Trehalose-HEPES-ACSF with 3 mg/ml ovomucoid inhibitor and pipetted through a 40 μm cell strainer (Falcon #352340) into a new microcentrifuge tube. Thereafter, the single cell suspension was centrifuged down at 300 g for 5 min at 4 ⁰C and the supernatant replaced with fresh ice cold Trehalose-HEPES-ACSF and cell pellet resuspended. Cells were pelleted again and resuspended in 100 μl of ice-cold Resuspension-ACSF (117 mM NaCl, 2.5 mM KCl, 1.25 mM NaH2PO4, 30 mM NaHCO3, 20 mM HEPES, 25 mM glucose, 1 mM MgSO4, 2 mM CaCl2, 1 mM kynurenic-acid Na salt, 0.05% BSA, pH adjusted to 7.4, osmolarity ranging 330 – 340 mOsm) compatible with 10x reverse transcription chemistry (i.e. lacking trehalose and with reduced Mg2+). Cell suspensions were kept on ice while cell densities were quantified with a hemocytometer and final cell densities were verified to be in the range of 300 – 1000 cells/μl. Cell suspension volumes estimated to retrieve ~8000 single-cell transcriptomes were added to the 10x Genomics RT reaction mix and loaded to the 10X Single Cell A chip (10x Genomics #230027) per manufacturer’s protocol. We used the Chromium Single Cell 3’ Library and Gel Bead Kit v2 (10x Genomics #120237) and Chromium i7 Multiplex Kit (#120262) to prepare Illumina sequencing libraries downstream of reverse transcription following manufacturer’s protocol applying 12 rounds of cDNA library amplification and 11 rounds of sequencing library amplification.
Tissue processing into single cell suspensions and sequencing library construction for neural activity to cell-type mapping
In order to reveal endogenous immediate early gene expression with 10x Genomics based scRNA-seq and block tissue processing related artificial induction of IEG levels, a number of changes were made to single cell suspension generation protocol. Brains were extracted from 12 animals following respective physiological state induction as described above. 3 mm tissue sections containing both SFO and OVLT were cut out on a stainless steel brain matrix and both structures were microdissected. Extracted SFO and OVLT tissues were collected into separate microcentrifuge tubes on ice containing NMDG-HEPES-ACSF and 30 μM actinomycin D. For enzymatic digestion of tissue NMDG-HEPES-ACSF was replaced by Trehalose-HEPES-ACSF containing papain (80U/ml Sigma Aldrich #P3125, pre-activated with 2.5 mM cysteine and a 30 min incubation at 34⁰C and supplemented with 0.5 mM EDTA) and 15 μM actinomycin D. Extracted SFO and OVLT tissue was incubated at room temperature with gentle carbogenation for 1 hour 45 min and 1 hour 15 min for SFO and OVLT, respectively. During enzymatic digestion the tissue was pipetted periodically every 10 min. At the end of enzymatic digestion, the medium was replaced with 200 μl of room temperature Trehalose-HEPES-ACSF containing 3 mg/ml ovomuccoid inhibitor, 25 U/ml DNAse I and 15 μM actinomycin D. Tissue was gently tritruted into a uniform single cell suspension with consecutive rounds of trituration with fire polished glass Pasteur pipettes with tip diameters of 600, 300 and 150 μm. Resulting cell suspension volume was brought up to 1 ml with Trehalose-HEPES-ACSF containing 3 mg/ml ovomuccoid inhibitor and pipetted through a 40 μm cell strainer (Falcon #352340) into a new microcentrifuge tube. Thereafter, the single cell suspension was centrifuged down at 300 g for 5 min at 4 ⁰C and the supernatant replaced with fresh ice-cold Trehalose-HEPES-ACSF and cell pellet resuspended. Cells were pelleted again and resuspended in 100 μl of ice-cold Resuspension-ACSF. Cell suspensions were kept on ice while cell densities were quantified with a hemocytometer and final cell densities were verified to be in the range of 300 – 1000 cells/μl. Cell suspension volumes estimated to retrieve ~10 000 single cell transcriptomes were added to the 10x Genomics RT reaction mix and loaded to the 10X Single Cell B chip (10x Genomics #1000074) per manufacturer’s protocol. We used the Chromium™ Single Cell 3’ GEM, Library & Gel Bead Kit v3.0 (10x Genomics #1000075) and Chromium i7 Multiplex Kit (#120262) to prepare Illumina sequencing libraries downstream of reverse transcription following manufacturer’s protocol applying 11 rounds of cDNA library amplification and 12 rounds of sequencing library amplification applied to 70 ng of cDNA library input to library synthesis.
Sequencing, read-mapping and generation of digital expression data
For mapping sequencing reads to the transcriptome, we assembled a custom pre-mRNA transcriptome reference to capture reads mapping to exons, introns and un-annotated 3’ UTRs of select neuronal genes. To this end we modified the genome annotation of the Mus musculus Ensemble genome reference release 93 for GRCm38 (mm10) genome build by defining transcript spans as exons. Furthermore, to prevent losing reads due to newly overlapping exonic regions, we removed 294 pseudogenes with little to no exonic read mapping from the genome annotation and reverted 450 genes back to exonic annotation. Finally, for several dozen genes, we observed high levels of read mapping just 3’ of annotated gene regions that occasionally spliced to known exons and are therefore likely to be derived from unannotated 3’ UTR regions. In order to capture those reads, we manually modified the genome annotation for 18 genes (e.g. Etv1, Glp1r) to include the unannotated 3’ regions. The transcriptomic reference was assembled with 10x Genomics Cell Ranger v. 3.0.1 mkref pipeline based on the modified genome annotation file and mm10 genome sequence.
ScRNA-seq sequencing libraries were sequenced on an Illumina HiSeq4000 or NovaSeq6000 sequencers (paired-end 150). Illumina sequencing data were aligned to the custom made pre-mRNA reference transcriptome and digital gene-cell matrices were generated with 10x Genomics Cell Ranger v.3.0.1 count pipeline with anticipated cell count parameter set at 10 000. Regular scRNA-seq samples generated with 10x Genomics v2 kit yielded an average of 49 331 reads/cell for SFO and 33 247 reads per cell for the OVLT library. Stimulus to cell-type mapping data sets generated by 10x Genomics v3 kit had a mean read depth ranging from 44 628 – 78 429 reads/cell.
Sequencing data pre-processing
For the scRNA-seq data generated with 10x genomics v2, expression data were further filtered to exclude cells with fewer than 1000 or more than 35 000 unique transcripts (potential doublets), as well as cells exhibiting more than 15% of mitochondrial transcripts (stressed cells). In order to eliminate doublets, we excluded cell clusters co-expressing two or more markers for canonical cell classes (Ndrg4 for neurons, Ntsr2 for astrocytes, Ucma for lamina terminalis astrocytes, Slco1c1 for endothelial cells, Fcer1g for microglia, Mag for oligodendrocytes). Finally, we eliminated a low transcript abundance neuronal cluster in SFO datasets (stressed cells emerging in samples requiring long enzymatic digestion times). This yielded an SFO dataset with 7950 cells with a median profiling resolution of 2951/4123 genes per cell for all cells and neurons respectively. The resulting OVLT dataset contained 6161 cells with a median profiling resolution of 1729/3353 genes per cell for cells and neurons respectively.
For the stimulus to cell-type mapping datasets generated with 10x Genomics v3.0, the data were processed as described above with minor modifications. Expression data were filtered to exclude cells with fewer than 1000 or more than 45 000 unique transcripts, as well as cells exhibiting more than 15% of mitochondrial transcripts. Furthermore, cells co-expressing female specific (Xist) and one or more Y-chromosome derived male specific genes (Ddx3y, Eif2s3y, Gm29650, Kdm5d, Uty) were excluded as potential doublets. This yielded median profiling resolutions ranging from 3046.5/4330.5 to 4826/5925 genes per cell for all cell types and neurons respectively.
Analysis of scRNA-seq data
Transcriptomic cell types were determined by analyzing the scRNA-seq data in R (3.5.1) using Seurat (v.3.0.3.9019) as previously described16. Briefly, genes expressed in fewer than 10 cells were discarded from digital expression data. SFO and OVLT data were analyzed separately. Expression data from the 4 physiological conditions in neural activation to cell-type mapping experiments were merged into a single gene expression matrix for SFO and OVLT, respectively. Gene expression count data were normalized to 10 000 reads and log transformed [ ln((gene count+1)·10 000/total transcript count per cell) ] which was used for most downstream analyses. In order to identify transcriptomic cell classes, we identified genes with most variable expression across the entire data set while controlling for the relationship between mean expression and dispersion. To determine major cell classes, we identified top 850 differentially expressed genes as largest outliers in the mean expression and dispersion space using the vst method in Seurat::FindVariableFeatures function. In order to identify different neural subtypes, we proceeded with top 200 differentially expressed genes. To reduce the effects of cell health on clustering results, we used linear regression to remove the effects of mitochondrial read fraction from expression data and the resulting residuals for the most variable features were then scaled (mean centered and normalized to std. deviation for each gene). We performed dimensionality reduction with principal component analysis on the scaled gene expression data and used the PC-s accounting for most variance (as determined by the “elbow” in the Scree plot ranging from 15 – 20 PCs for major cell classes and 9–15 PCs for neuronal subtypes) as input to clustering analysis. We compiled the shared nearest neighbor graph and identified transcriptomic clusters by optimizing the graph modularity function with the Louvain algorithm as implemented by Seurat::FindNeighbors and Seurat::FindClusters (resolution parameter ranging from 1.5 – 1.7 for major cell classes and 0.4 – 0.8 for neurons) functions respectively. The results of clustering were visualized in a two dimensional UMAP embedding and gene expression programs defining cell types were identified by Wilcoxon Rank Sum test.
OVLT scRNA-seq datasets contain cells that are present both in and around OVLT. To restrict single cell analysis to neurons that are only present in the OVLT, we identified neuron types and cell type specific genetic programs in the OVLT scRNA-seq dataset as described above (Extended Data Fig. 2h). We determined whether specific neuron types were exclusively present in the OVLT, present both inside and outside OVLT or exclusively outside OVLT based on in situ hybridization data from the Allen Brain Institute (https://mouse.brain-map.org/44). Transcriptomic analysis on cell classes and neuron types (Fig. 2, 3) was performed on OVLT datasets excluding neurons that were not anatomically located within the OVLT.
In order to overcome misalignment of transcriptomic neuron types due to physiological state derived transcriptional changes, we used canonical correlation analysis implemented in Seurat16,17 (Extended Data Fig. 5). To this end we log-normalized gene expression data in SFO and OVLT stimulus to cell-type mapping datasets and identified integration anchors based on the top 150 differentially expressed gene sets from the untreated neuronal datasets from SFO and OVLT respectively. Based on the latter, we generated joint batch corrected gene-cell matrices using the Seurat::IntegrateData function separately for SFO neurons and OVLT neurons. We identified the previously described neuron types by carrying out clustering analysis on the batch corrected gene cell matrices as described above enabling us to ascribe immediate early gene induction patterns to distinct neuron types in the SFO and OVLT.
Transcriptional homology between SFO and OVLT cell classes and neuron types was evaluated by Spearman correlation of averaged gene expression data per cell type. Here, we used single cell data generated by the 10x Genomics v2 focusing on the union of top 850 differentially expressed genes from SFO and OVLT for major cell classes (total 1224 genes) and top 200 differentially expressed genes from SFO and OVLT neuron types (total 315 genes). First, we estimated the average expression of the joint genes for each cell type. Next we calculated the cross-correlation matrix based on the average gene expression values between the major SFO and OVLT cell classes as well as neuron types respectively using the Spearman correlation. The correlation coefficients between cell types were visualized in a heatmap using the heatmap.2 function in the R gplots library. The cell types were hierarchically clustered by calculating a Euclidean distance matrix based on the correlation values using the hclust function in R and hierarchical clustering was performed using the Ward agglomeration method.
Correlation analysis for genetic targeting of state specific neural populations
Genetic markers that show best correlation with c-Fos expression under distinct thirst state were identified by Spearman correlation. To this end, we calculated the average expression of the top 1500 most variable genes in the SFO and OVLT as identified by the vst method implemented in Seurat. We correlated the cell type averaged expression of the most variable genes to either cell averaged c-Fos expression under osmotic or hypovolemic stresses for each structure and ordered the genes in descending order according to their Spearman correlation coefficient yielding a list of marker genes that best correlate with the state specific c-Fos expression pattern.
RNA-Scope based multicolor in situ hybridization
In situ hybridization was performed with RNAscope Multiplex Fluorescent Assay (Advanced Cell Diagnostics, #320850). Fixed frozen brains under sated, water deprived, osmotic, or hypovolemic thirst state from C57BL/6, Pdyn-ires-Cre, or Rxfp1-P2A-Cre animals were prepared following the manufacturer’s instructions. Briefly, 20 μm cryosectioned slices were mounted on Superfrost Plus slides (Fischer Scientific, 22–037-246). The tissue sections were pre-treated with Target Retrieval solution and Protease III. In the SFO, gene expression was visualized with Htr7 (#401321), Rxfp1 (#458001), Pdyn (#318771), Rxfp3 (#439381), Cre (#312281) and Fos (#316921) probes. For OVLT, the tissue was probed for Bmp3 (#428461), Rxfp1, Pdyn, Cpne4 (#474721), Cre and Fos probes. Following target probe hybridization, the sections were treated with Hybridize Amp 1–4 and stained with DAPI. The sections were imaged with confocal microscopy and probe labeling was manually quantified from 40x z-stacks.
Statistics
Data were processed and analyzed using either R, Python 3 or Prism 8. The applied statistical tests with respective experiments and sample sizes are detailed in the Statistical Analysis Summary Table.
No statistical methods were used to predetermine sample sizes. Data collection and analysis were not performed blind to the condition of the experiments. The sample sizes and statistically significant effects are reported in each figure/figure legend. The significance threshold was held at α = 0.05 (p>0.05; * p < 0.05, ** p < 0.01, *** p < 0.001, **** p < 0.0001) or color coded as specified in the figure legend.
Data analysis and visualization software
ScRNA-seq data were processed in R 3.5.1 using the following analysis and data visualization packages: Seurat v.3.0.3.9019, gplots 3.0.1.1, Hmisc 4.2–0, ggplot2 3.2.0, viridis 0.5.1., scales 1.0.0., spatstat 1.62–2, Matrix 1.2–14, dplyr 0.8.3, cowplot 1.0.0, psych 1.9.12.31.
Data availability
The behavioral and histology data that support the findings are available from the corresponding author upon reasonable request. Raw and fully processed scRNA-seq data is available at the NCBI Gene Expression Omnibus (GEO accession # GSE154048).
Code availability
R code used to perform single cell RNA-seq analysis is available from the corresponding author upon reasonable request.
Extended Data
Extended Data Figure 1. Thirst-state-dependent drinking behavior and genetic labeling of active neurons.
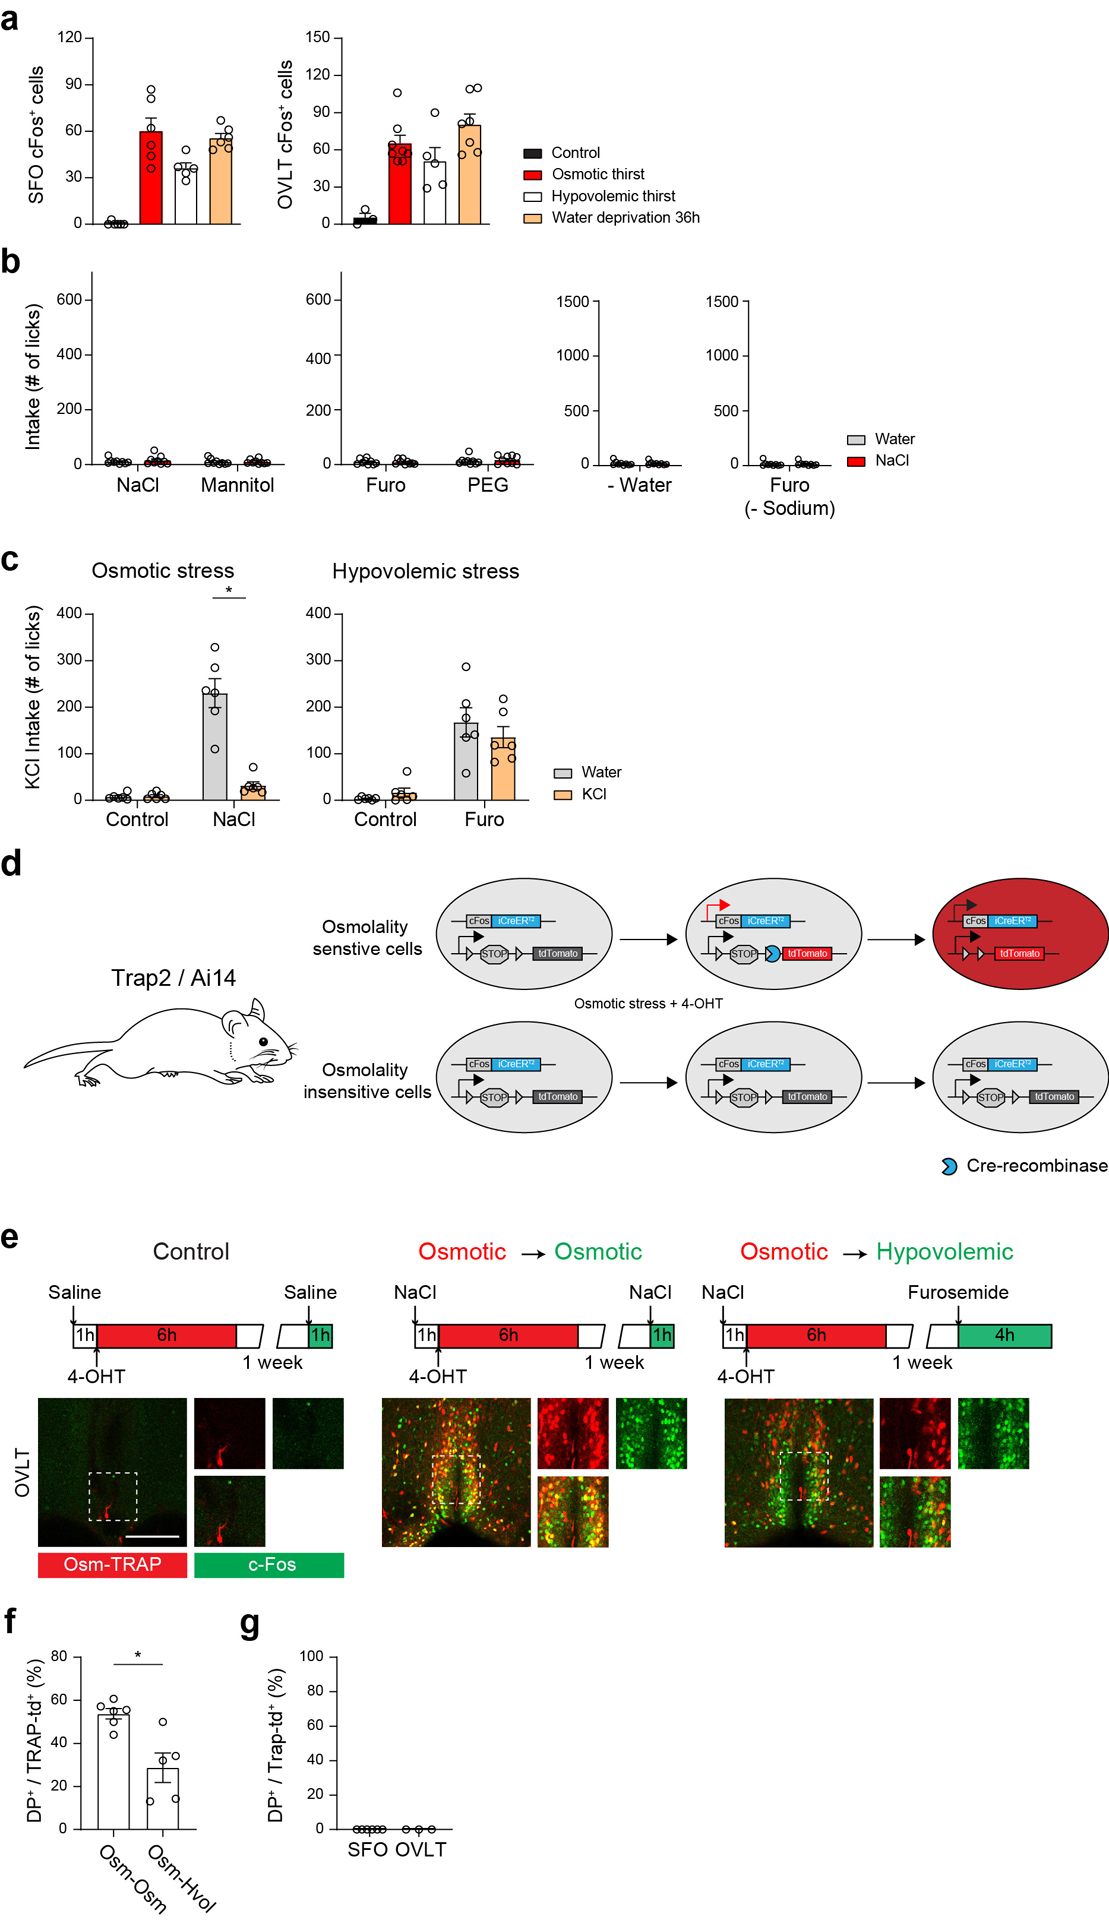
a, c-Fos expression in the SFO (left) and OVLT (right) under the five conditions (SFO: n = 6 mice for control, osmotic thirst, and water deprivation 36 hours, 5 for hypovolemic thirst; OVLT: n = 3 for control, 8 for osmotic thirst, 5 for hypovolemic thirst, 7 for water deprivation 36 hours). b, Water and 0.3M NaCl consumption in sated control animals. The number of total licks for water (grey) and 0.3M saline (red) were quantified during a one-hour session (n = 9 mice for each group). c, Water (grey) and 0.3M KCl intake (orange) under osmotic and hypovolemic thirst states. The number of total licks was quantified during a one-hour session (n = 6 mice). d, Experimental diagram for TRAP2 activity-dependent genetic labeling. TRAP2/Ai14 double transgenic animals were challenged with osmotic stress by i.p. injection of NaCl solution in the presence of 4-hydroxytamoxifen (4-OHT). Osmolality sensitive cells (upper) express Cre-ER under the promoter of c-Fos gene, which turns on tdTomato expression (red). In osmolality insensitive cells, the same stimulus does not induce tdTomato expression (bottom). e, Genetic labeling of thirst-sensitive neurons in the OVLT of TRAP2/Ai14 mice. Experimental design to label activated neurons under osmotic thirst and hypovolemic thirst (top). Osmolality sensitive neurons (Osm-TRAP, red) in the OVLT (bottom) overlapped with NaCl-induced acute c-Fos expression (green). Individual labeling and merged images are shown. By contrast, a significantly smaller fraction of Osm-TRAP neurons was co-labeled with hypovolemia-induced c-Fos. Scale bars, 50 μm. f, Quantification of OVLT TRAP2 experiments (n = 6 from 4 mice for Osm-Osm, n = 5 from 4 mice for Osm-Hvol). g, TRAP labeling in the SFO and OVLT of sated control animals (n = 6 from 3 mice for SFO, n = 3 from 2 mice for OVLT). * p < 0.05, ** p < 0.01, *** p < 0.001 by two-tailed Wilcoxon matched-pairs signed rank test or Mann-Whitney test. Data are shown as mean ± s.e.m.
Extended Data Figure 2. Profiling of cell and neuron types in the SFO and OVLT.
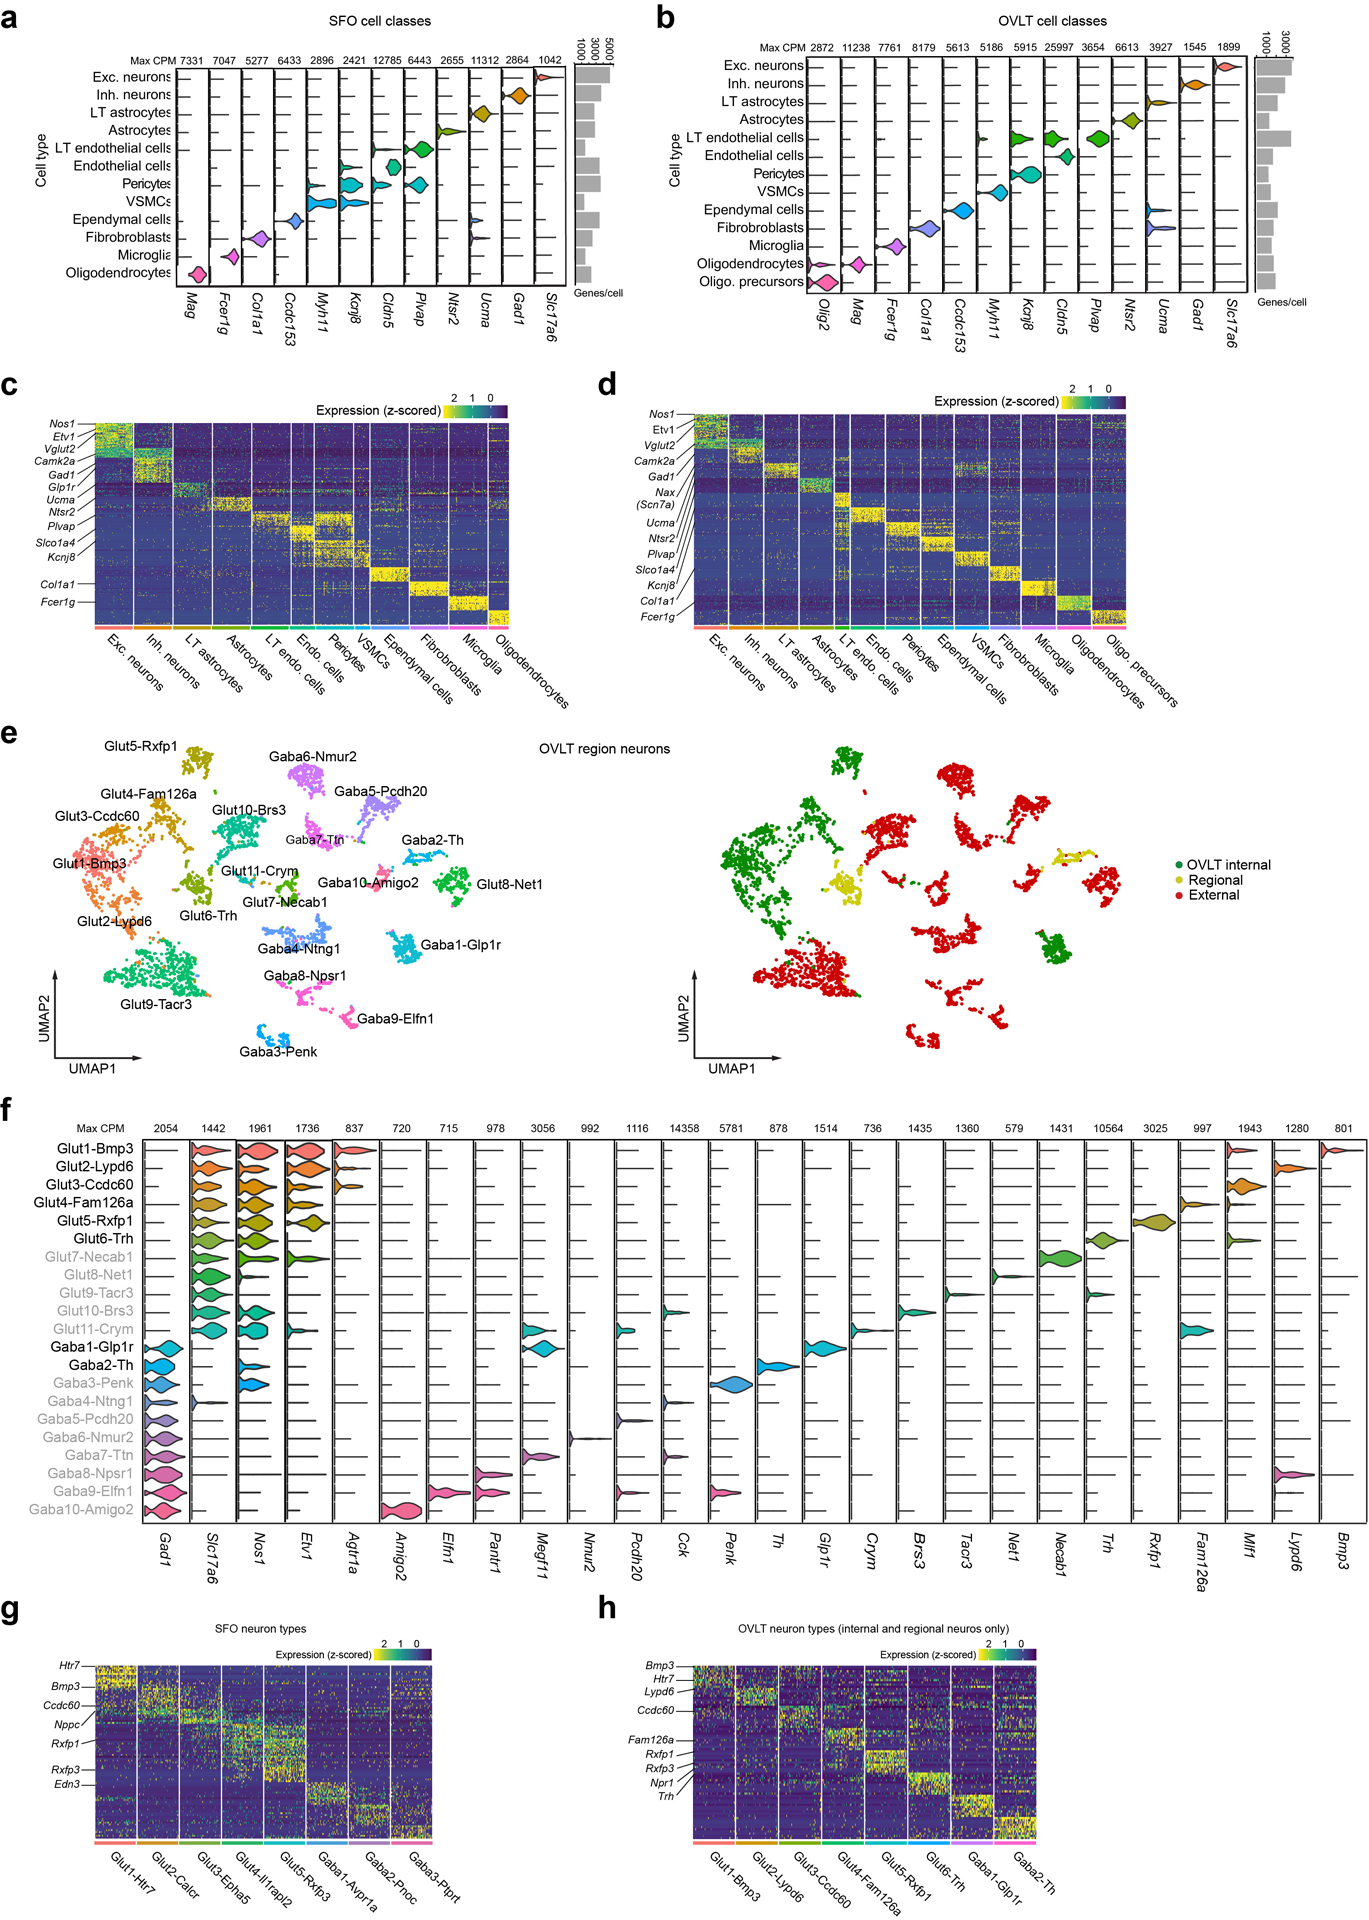
a and b, Violin plots of log-normalized expression of cell-type-defining genes for SFO (a) and OVLT (b) major cell classes with maximum counts per million (max CPM). Bar graph shows profiling resolution per cell type in median genes/cell. c and d, Heat maps of cell-type-specific gene expression in the major cell classes of SFO (c) and OVLT (d). Gene expression data are z-scored with warmer colors indicating higher gene expression. e, Transcriptomic neuron types in the OVLT region (n = 4109 cells) shown in a UMAP embedding (left). Based on Allen In Situ Brain Atlas, cell types were annotated into three anatomic classes: OVLT internal (green), external(red), and regional (both inside and outside of the OVLT) (yellow). We excluded non-OVLT cell types (red) for further analyses (Fig. 2, Extended Data Fig. 2e). f, Violin plot of log-normalized gene expression for all neuron types in the OVLT area. Neuron types outside the OVLT are shown in grey. g and h, Heat map of neuron-type-specific gene expression in the SFO (g) and OVLT (h).
Extended Data Figure 3. Expression of putative osmoregulatory channels/hormone receptors and cellular comparison between the SFO and OVLT.
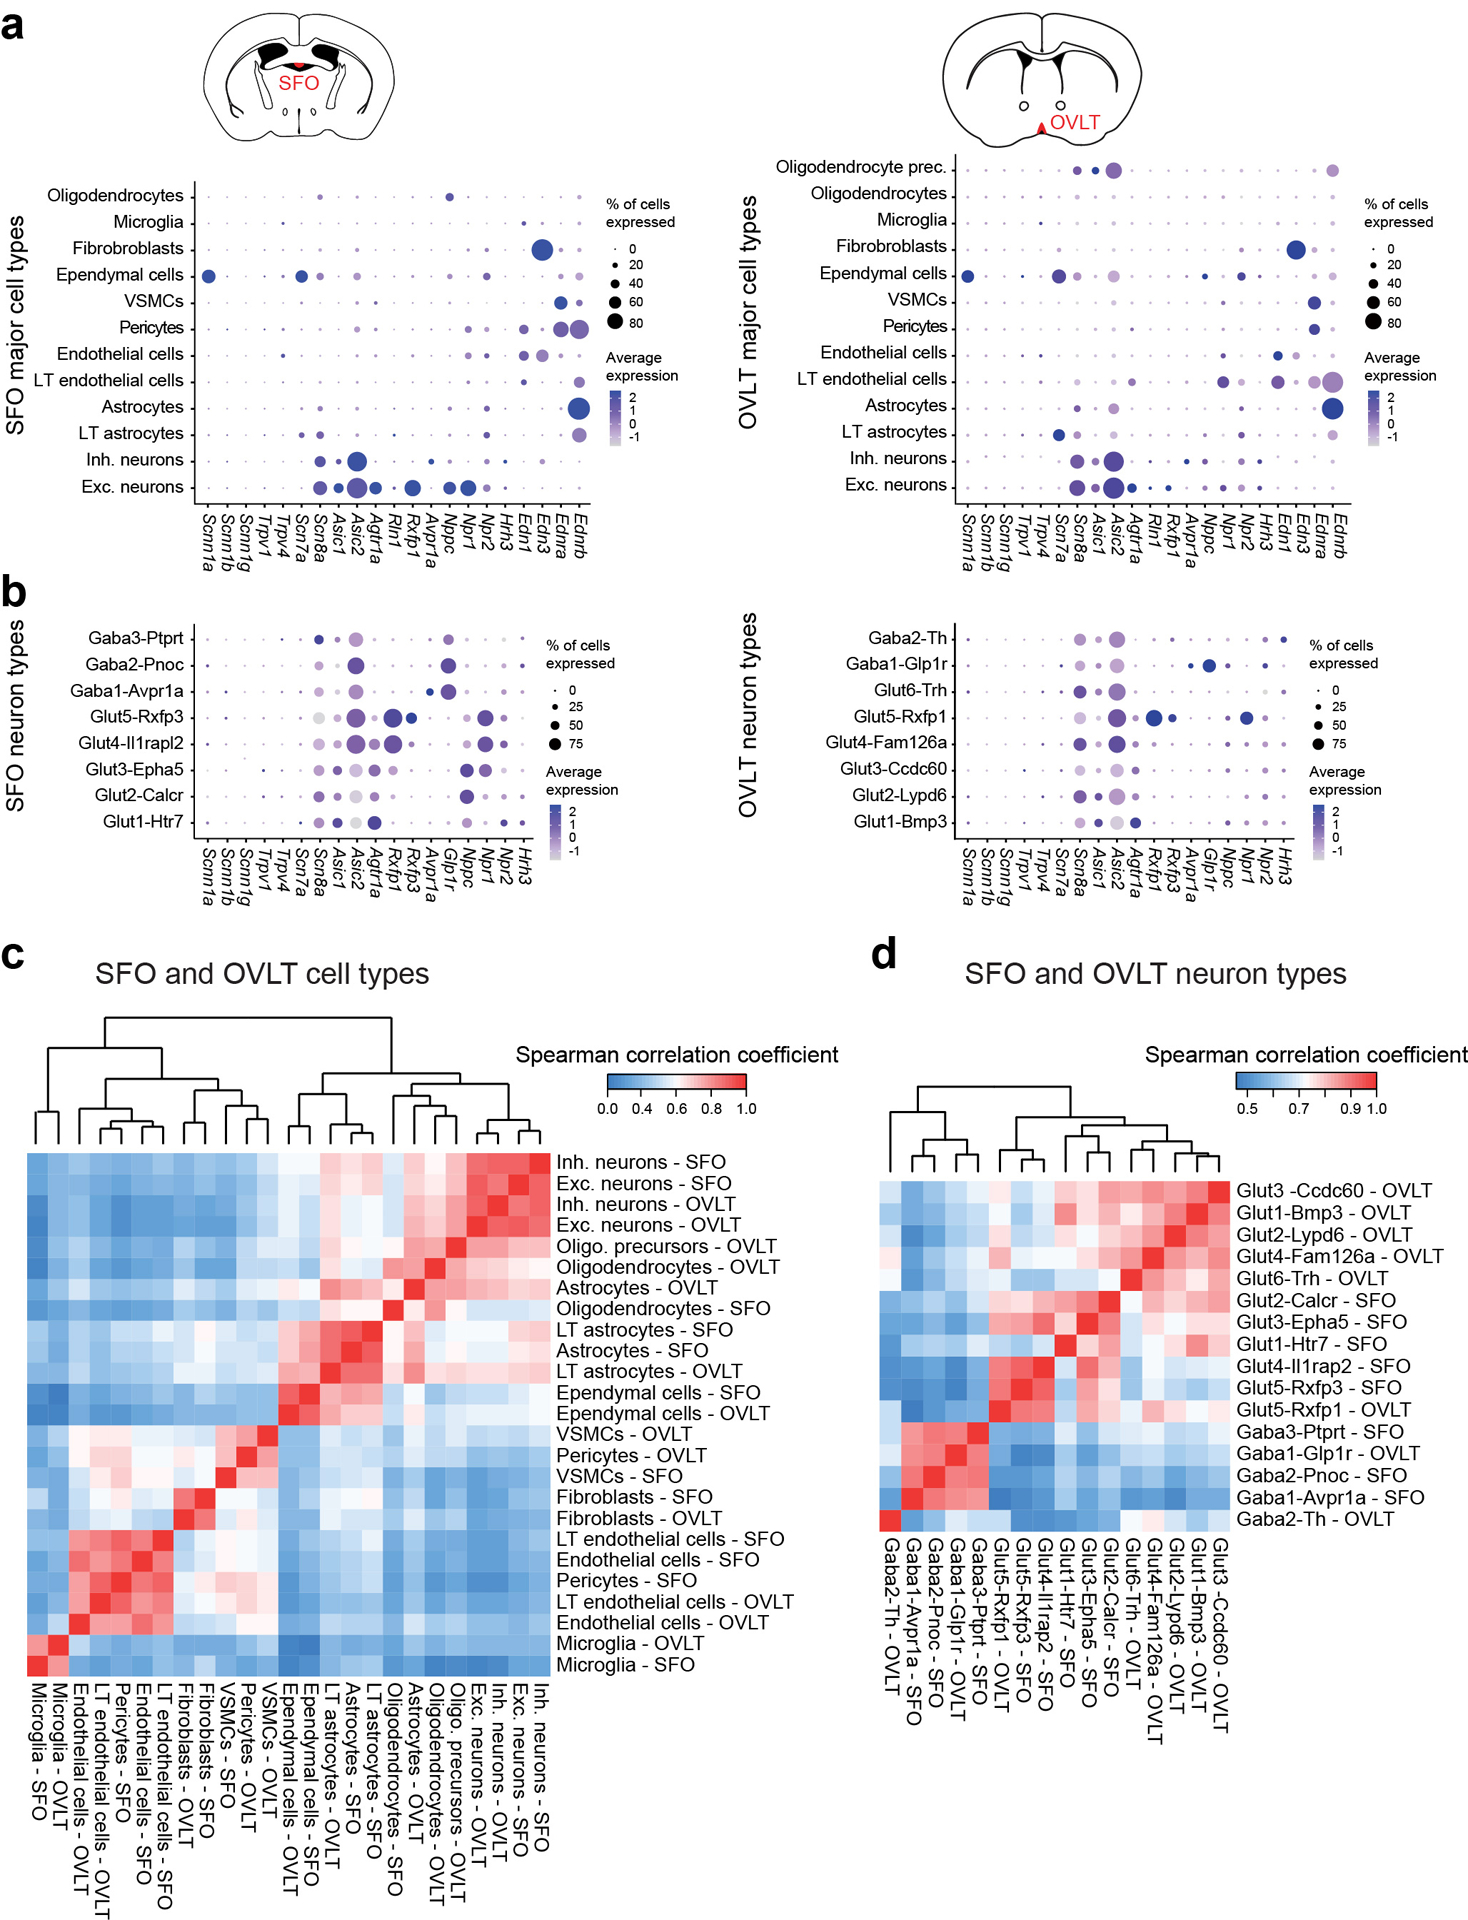
a, Dotplot of cell-type-specific expression for putative osmosensory ion channels and receptor genes for osmoregulatory hormone systems in major cell types in the SFO and OVLT (dot size is proportional to % of cells with transcript count > 0 expression, color scale represents z-scored average gene expression, n = 7950 and 6161 cells for SFO and OVLT respectively). b, Dotplot of neuron-type-specific expression for putative osmosensory ion channels and receptor genes for osmoregulatory hormone systems in neuron types in the SFO and OVLT30–42. Although some of the putative genes are not enriched in the SFO or OVLT, they may function outside the LT to regulate thirst (n = 2642 and 1511 neurons for SFO and OVLT respectively). c, Evaluation of transcriptional homology between SFO and OVLT cell types based on Spearman correlation between average expression of top 850 most variable genes from the SFO and OVLT, respectively (n = 1224 genes total). Euclidean distance matrix between cell types was calculated based on the Spearman correlation coefficients between cell types, which were then hierarchically clustered using Ward agglomeration. d, Same analysis on transcriptional homology between SFO and OVLT neuron types based on top 200 most variable genes from the SFO and OVLT (n = 315 genes total).
Extended Data Figure 4. Stimulus to cell-type mapping in SFO and OVLT.
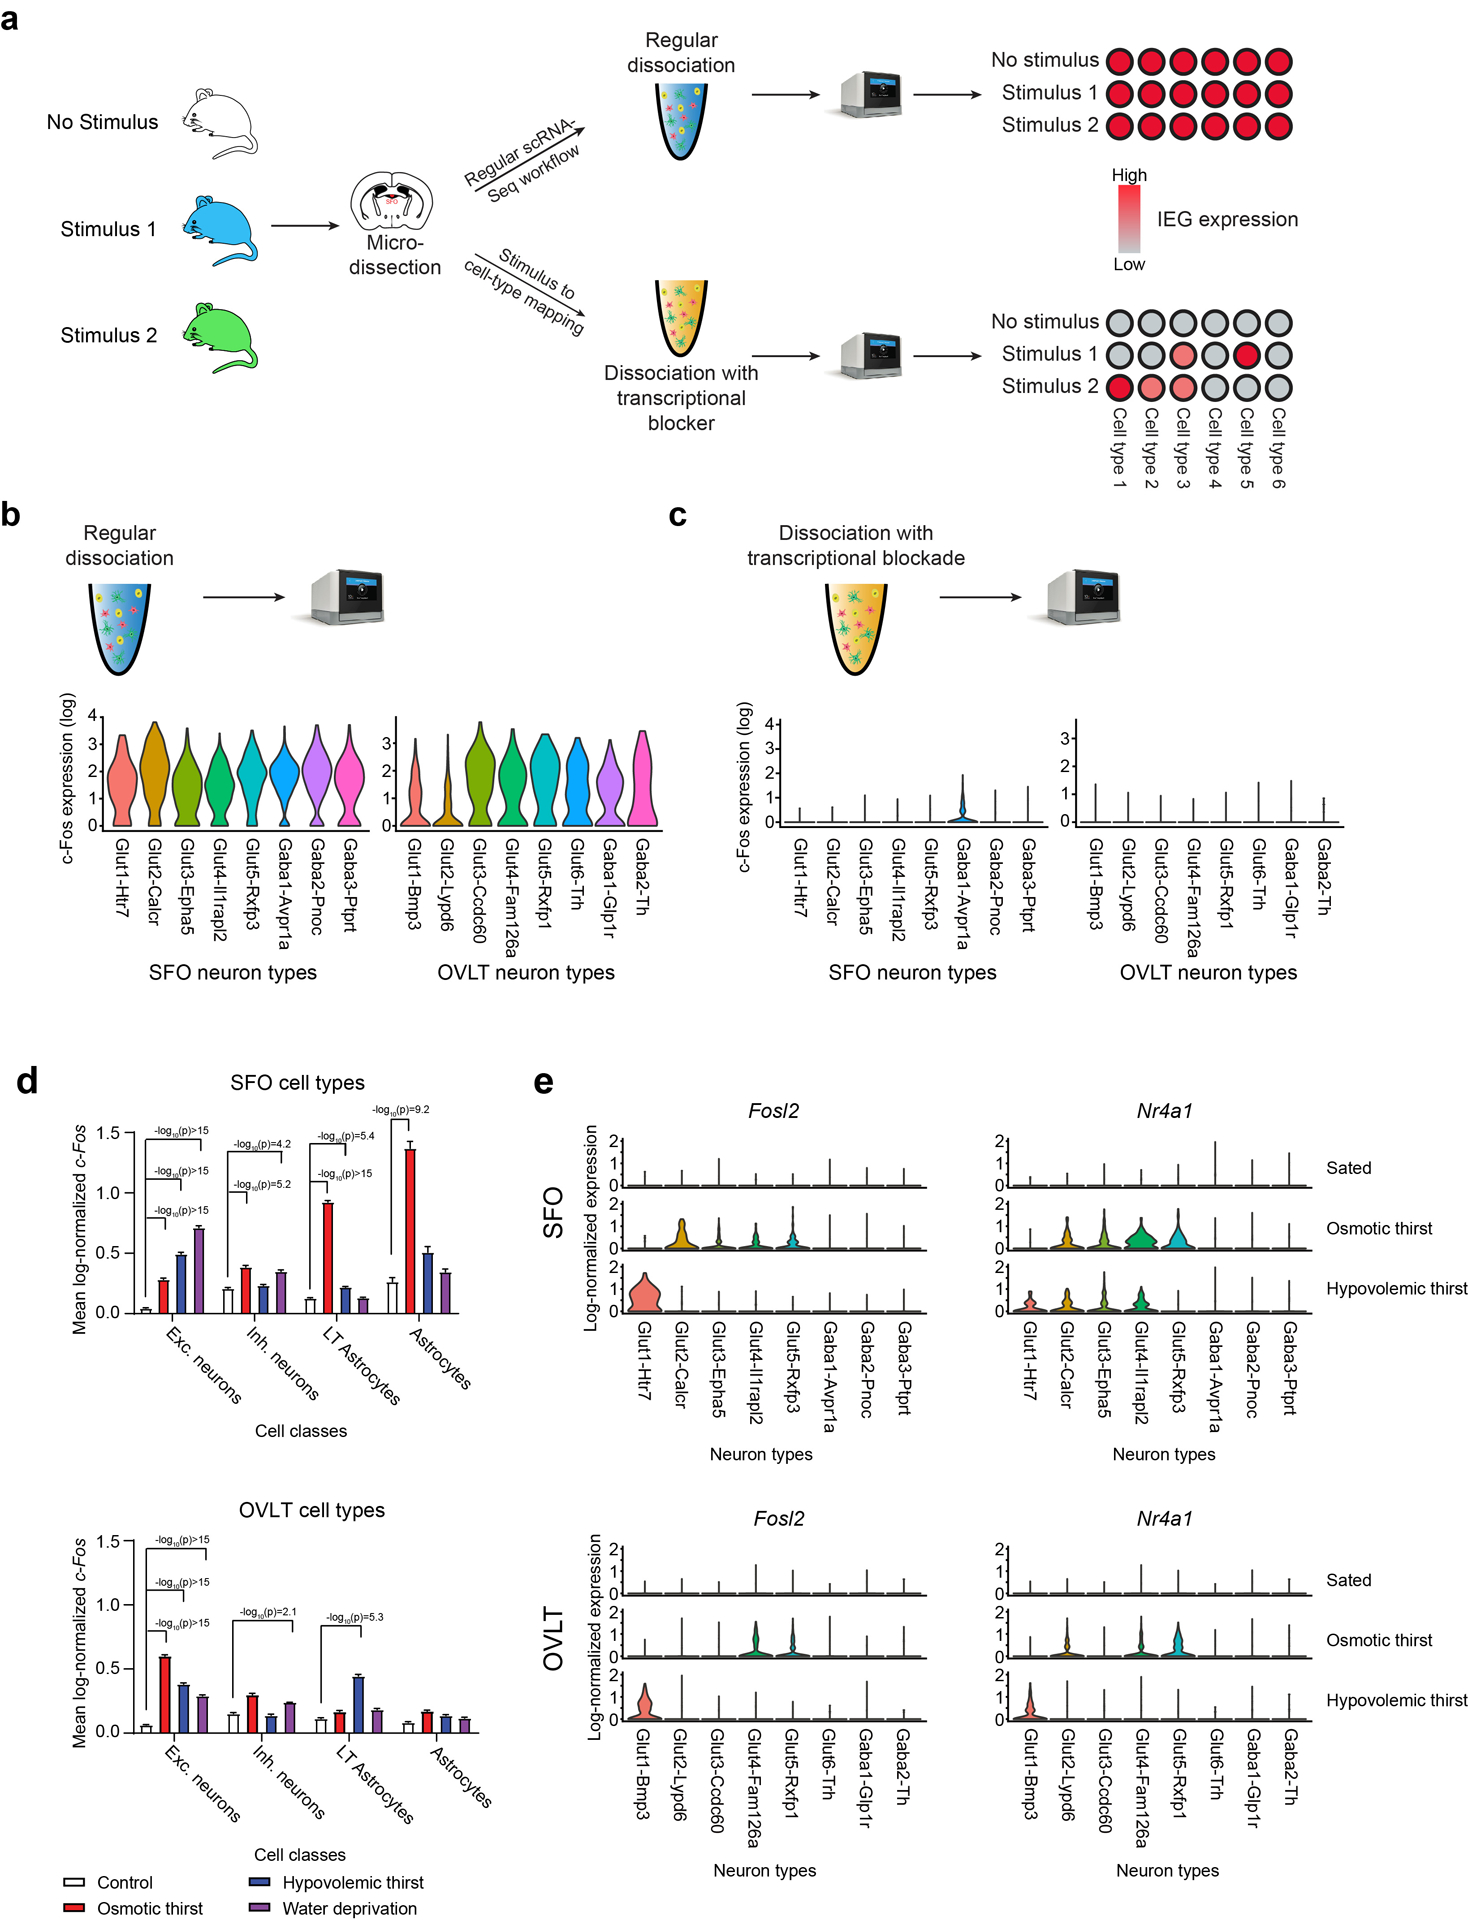
a, A diagram of scRNA-seq-based stimulus to cell-type mapping protocol. As previously reported, regular scRNA-seq results in artificial induction of IEGs in all neuron types stemming from tissue dissociation21,22. Performing scRNA-seq with a transcriptional blocker during tissue dissociation suppresses artificial induction of IEGs revealing the stimulus or behavior induced IEG expression pattern. b, Regular scRNA-seq induces high levels of c-Fos expression in all SFO and OVLT neuron types. Data are shown as a violin plot of log-normalized c-Fos transcript count data. c, In the presence of actinomycin D, artificial induction of IEGs in non-stimulated SFO and OVLT neurons is abolished. Images were provided by 10x Genomics. d, Expression of c-Fos in SFO and OVLT major cell classes under distinct thirst states (SFO excitatory neurons n = 931, 689, 775, 706; SFO inhibitory neurons n = 935, 714, 997, 793; SFO LT astrocytes n = 2085, 1907, 2544, 3177; SFO astrocytes n = 110, 138, 97, 265; OVLT excitatory neurons n = 2623, 3027, 2115, 2489; OVLT inhibitory neurons n = 853, 831, 661, 773; OVLT LT astrocytes n = 1229, 1087, 1133, 1238; OVLT astrocytes n = 1736, 1225, 1384, 1353). Data are shown as mean ± s.e.m. e, Expression of other IEGs (Nr4a1 and Fosl2) in SFO and OVLT neuron types under distinct thirst states. All data were analyzed with two-tailed Kruskal-Wallis test with Dunn’s post test. P -values are shown on a log10(p) scale.
Extended Data Figure 5. Canonical correlation analysis (CCA) based alignment of transcriptomic neuron types under different physiological conditions.
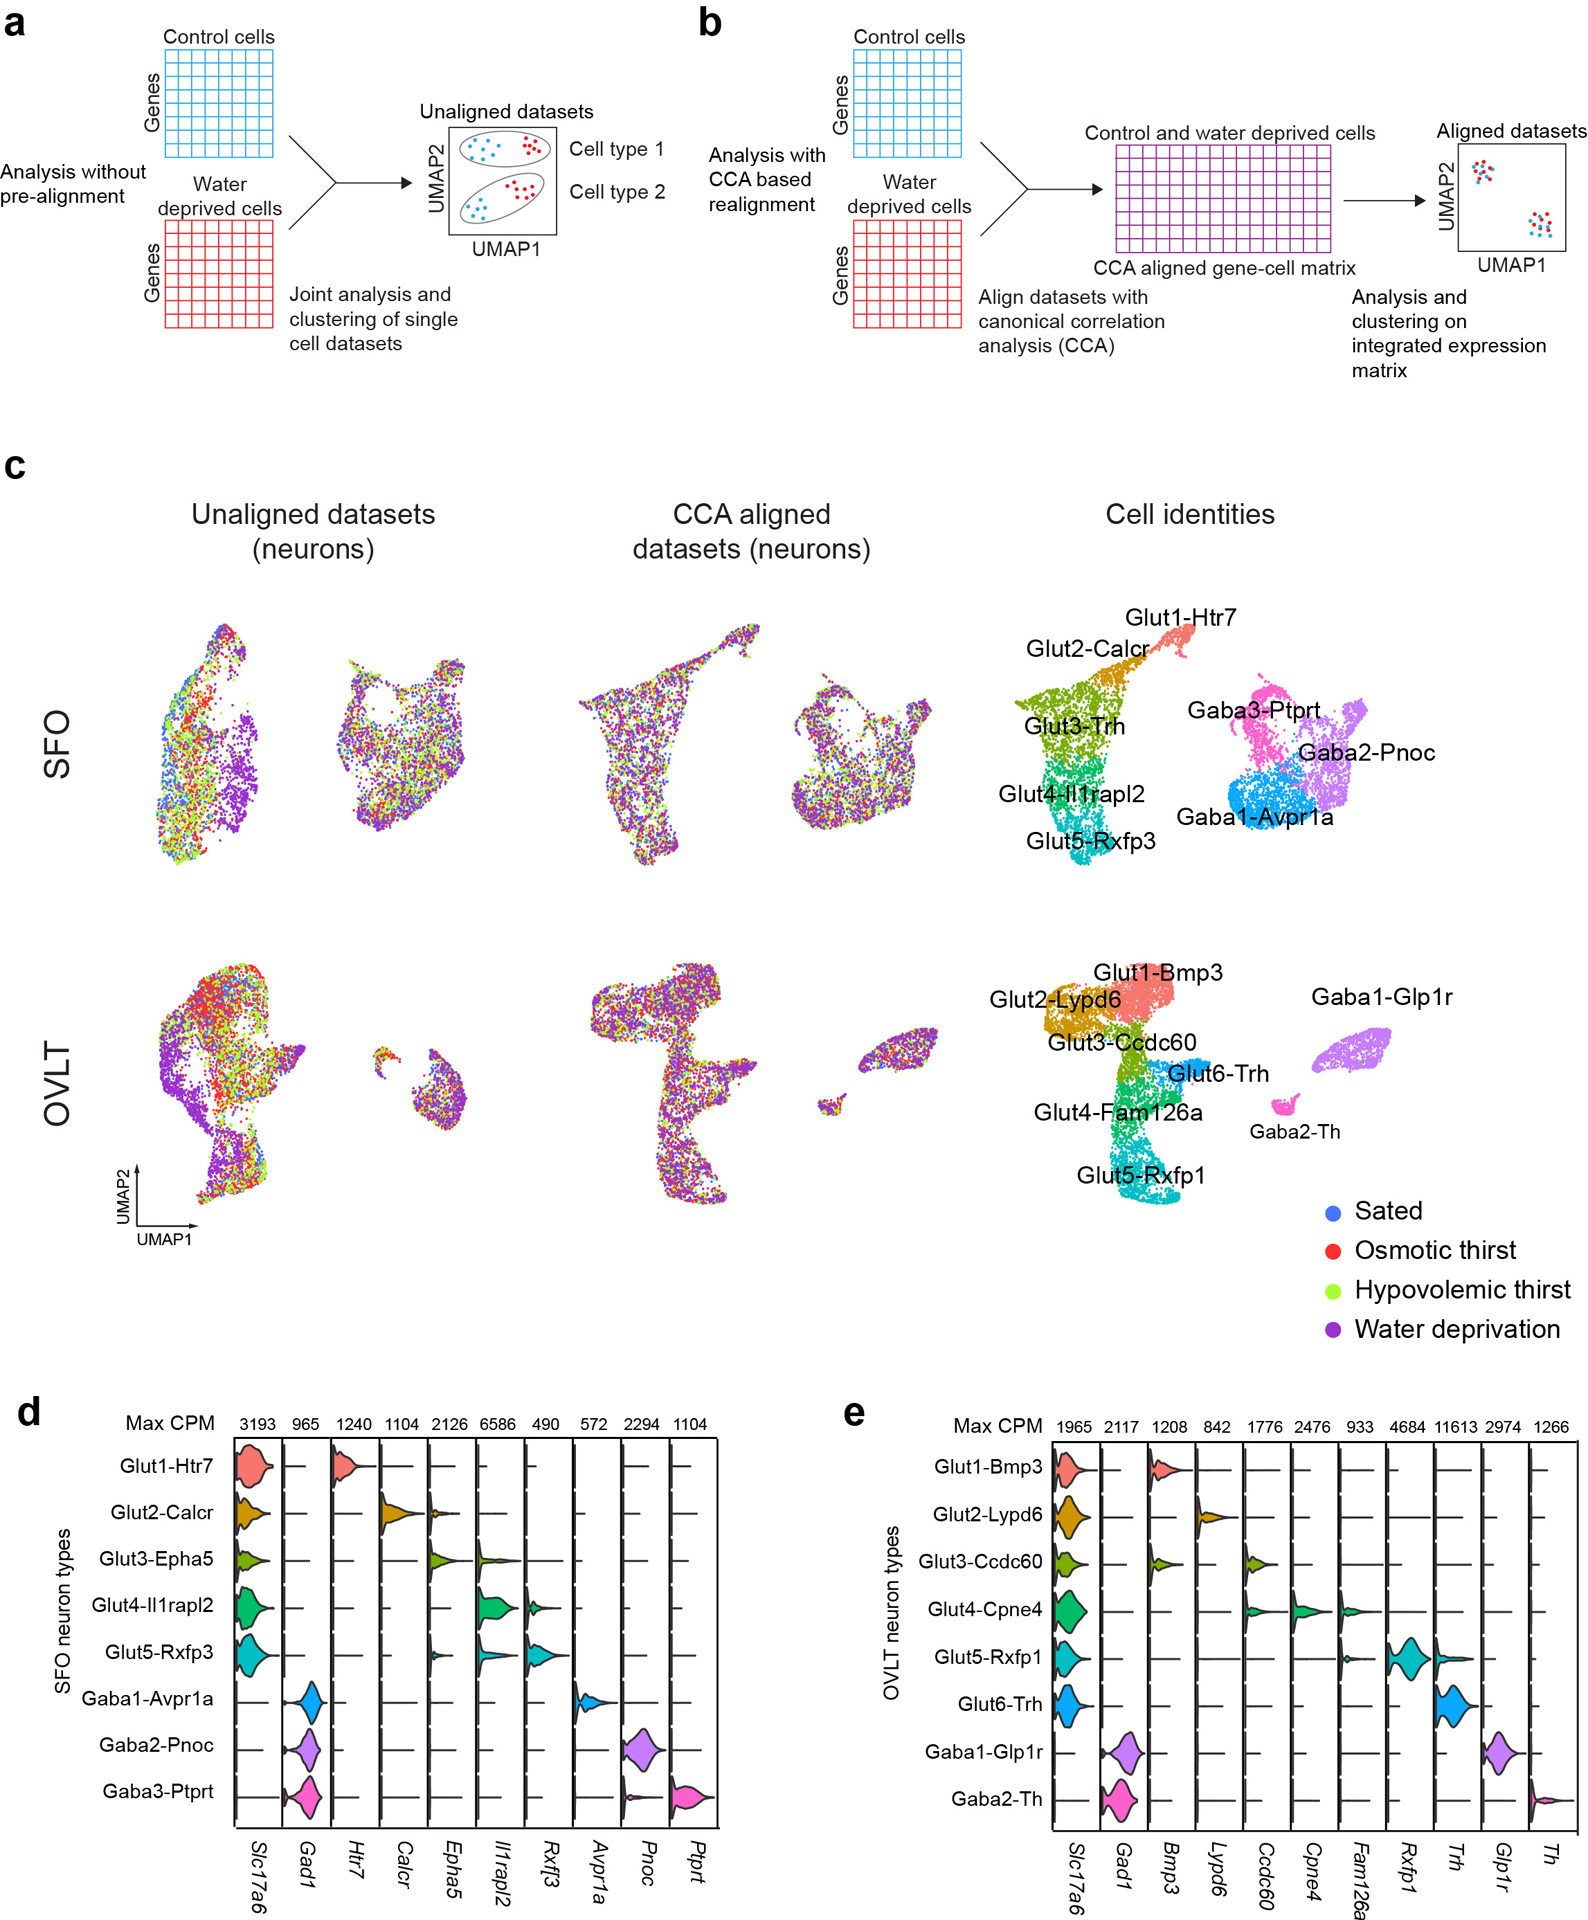
a, A diagram illustrating the misalignment of cell types under distinct physiological states with regular graph-based clustering analysis. b, The CCA workflow for realigning cell types for joint analysis of transcriptomic datasets. c, UMAP embedded scRNA-seq data from SFO and OVLT neurons under distinct thirst states without alignment (left panel), with CCA alignment (middle panel) and cell type identification on CCA aligned data (right panel). d, e, Violin plots of cell-type defining marker genes in CCA aligned stimulus to cell-type mapping datasets for SFO and OVLT respectively.
Extended Data Figure 6. ulti-color in situ hybridization for anatomical validation of transcriptomic cell-types.

M a, Quantification of SFO Htr7- and Rxfp1-positive cells and their overlap in the SFO (n=12 slices from 4 animals). Scale bar 20 μm. Nuclei are visualized by DAPI staining (white). b, Quantification of Bmp3- and Rxfp1-positive cells and their overlap in the OVLT (n=15 slices from 8 animals). Scale bar 20 μm. c, Rxfp1-and Pdyn-positive cells co-express c-Fos under water deprived conditions. Representative images from 8, 4, 8 and 4 sections from 2 independent experiments for SFO Rxfp1/c-Fos, OVLT Rxfp1/c-Fos, SFO Pdyn/c-Fos and OVLT Pdyn/c-Fos stains respectively. Scale bar 10 μm. d, Cell types labeled by Rxfp3 (SFO) and Cpne4 (OVLT) express c-Fos under osmotic thirst conditions (left). Cell types labeled by Htr7 (SFO) and Bmp3 (OVLT) express c-Fos under hypovolemic thirst (right). Representative images from 2, 2, 3 and 2 sections from 2 independent experiments for SFO Rxfp3/c-Fos, OVLT Cpne4/c-Fos, SFO Htr7/c-Fos and OVLT Bmp3/c-Fos stains respectively. Scale bar 10 μm.
Extended Data Figure 7. Genetic targeting of osmotic and hypovolemic thirst activated cell populations in the SFO and OVLT.
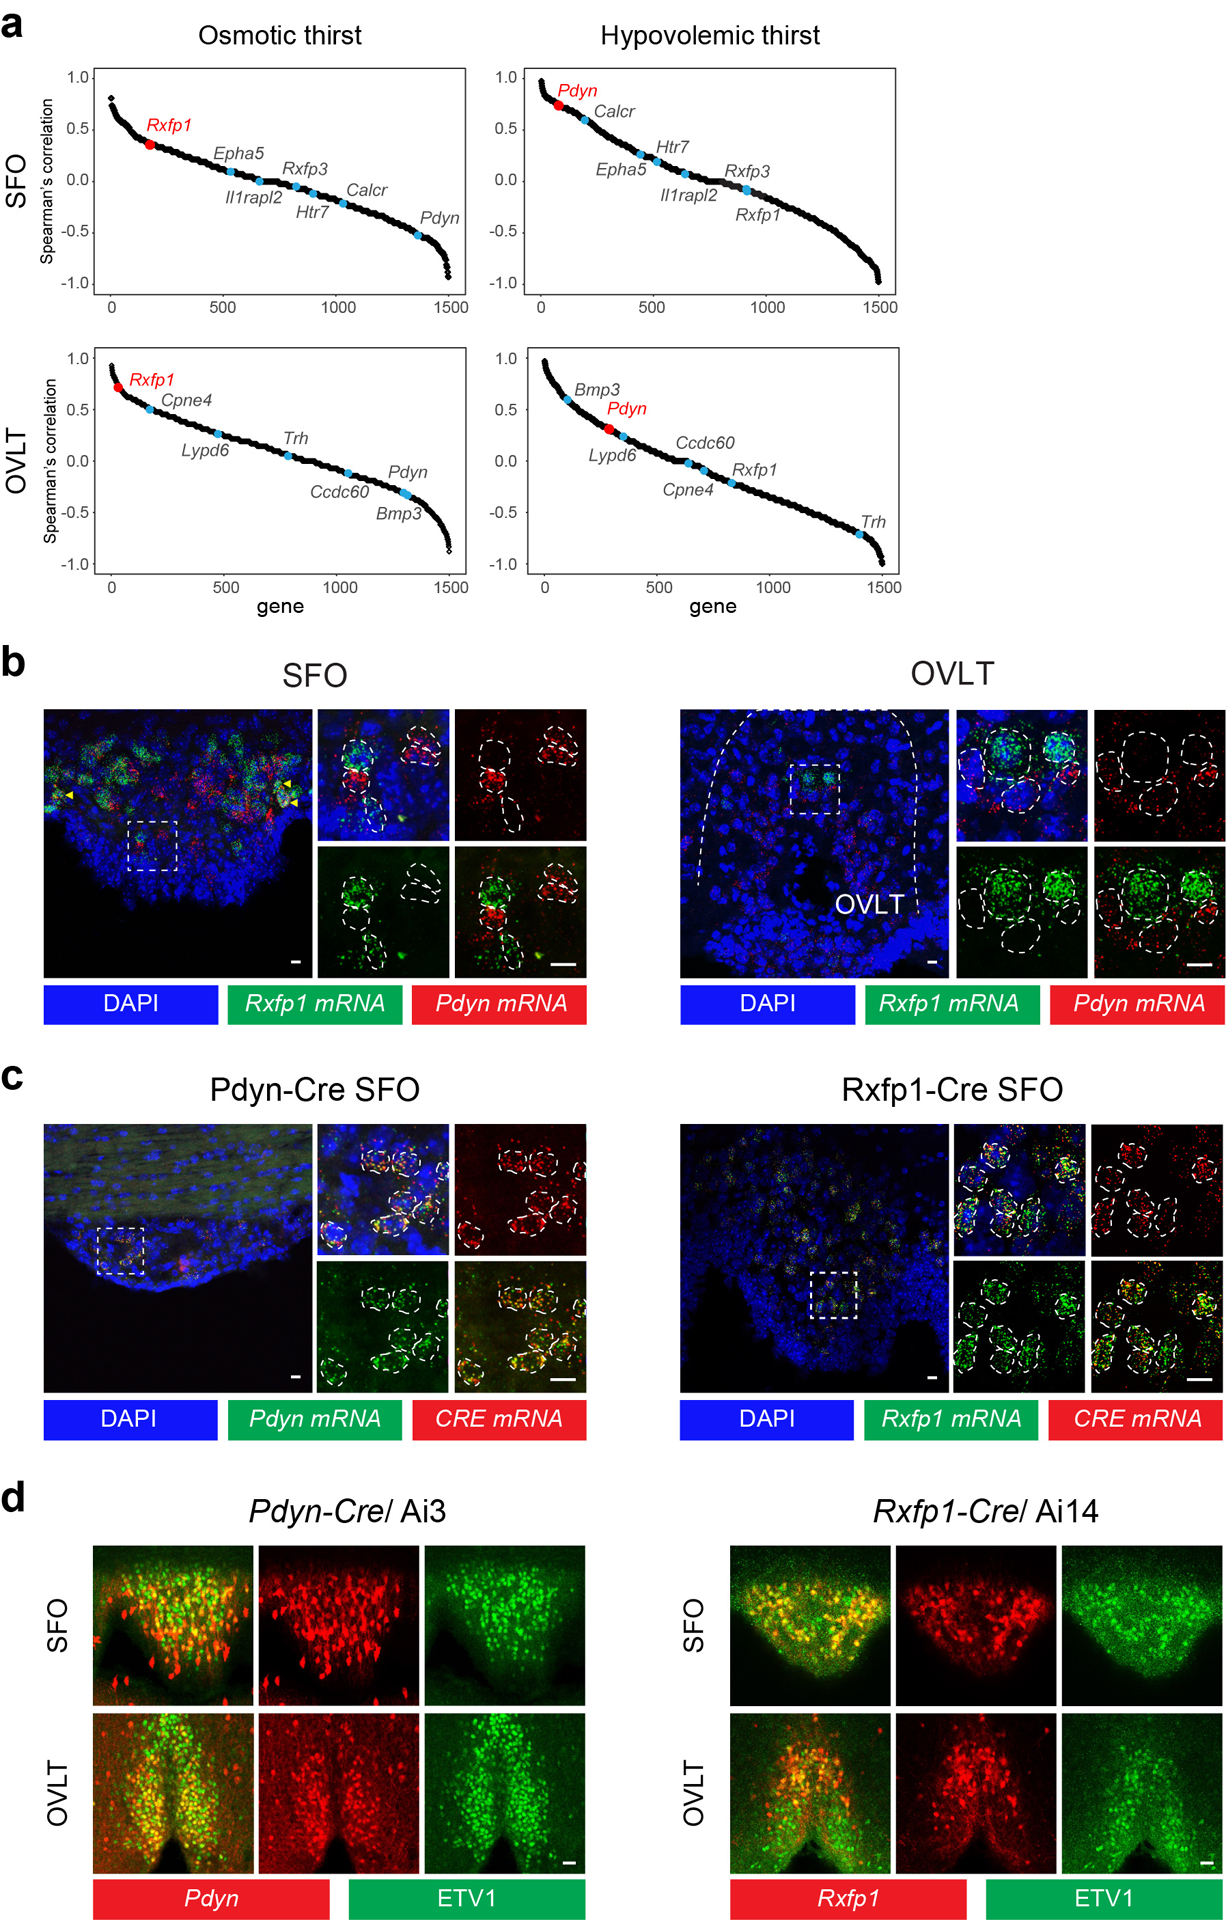
a, Spearman correlation between c-Fos expression under distinct thirst states and cell-type-specific and thirst-state-specific marker genes. Thirst-state-specific marker genes (Rxfp1 and Pdyn) show higher correlation with c-Fos expression compared to cell-type-specific genes. b, Two-color in situ hybridization of Pdyn and Rxfp1. These gene expression patterns are mostly distinct with minor overlap (arrowhead). Representative images from 8 and 2 slices from 2 independent experiments for SFO (left) and OVLT (right) respectively. Scale bar 10 μm. c, Validation of Cre expression in Pdyn-Cre and Rxfp1-Cre lines. 95.5% of Pdyn-Cre and 100% of Rxfp1-Cre expression matched endogenous gene expression. Representative images from 3 slices from 2 independent experiments for both Pdyn/Cre and Rxfp1/Cre stains. Scale bar 10 μm. d, Immunostaining of the SFO (top) and OVLT (bottom). Shown are Pdyn-positive neurons in Pdyn-Cre/Ai3 animals (representative images out of 8 slices from 4 mice for both SFO and OVLT, left) and Rxfp1-positive neurons in Rxfp1-Cre/Ai14 animals (representative images out of 6 slices from 3 mice for both SFO and OVLT, right). Pdyn- and Rxfp1-positive neurons (red) are a partial population of Etv1-positive excitatory neurons (green). Almost all (>90%) Pdyn- and Rxfp1-positive neurons expressed Etv1. Rxfp1 and Pdyn data are from Fig. 4d. Scale bar 10 μm.
Extended Data Figure 8. Characterization of Rxfp1-Cre and Pdyn-Cre activation derived consumption phenotypes.
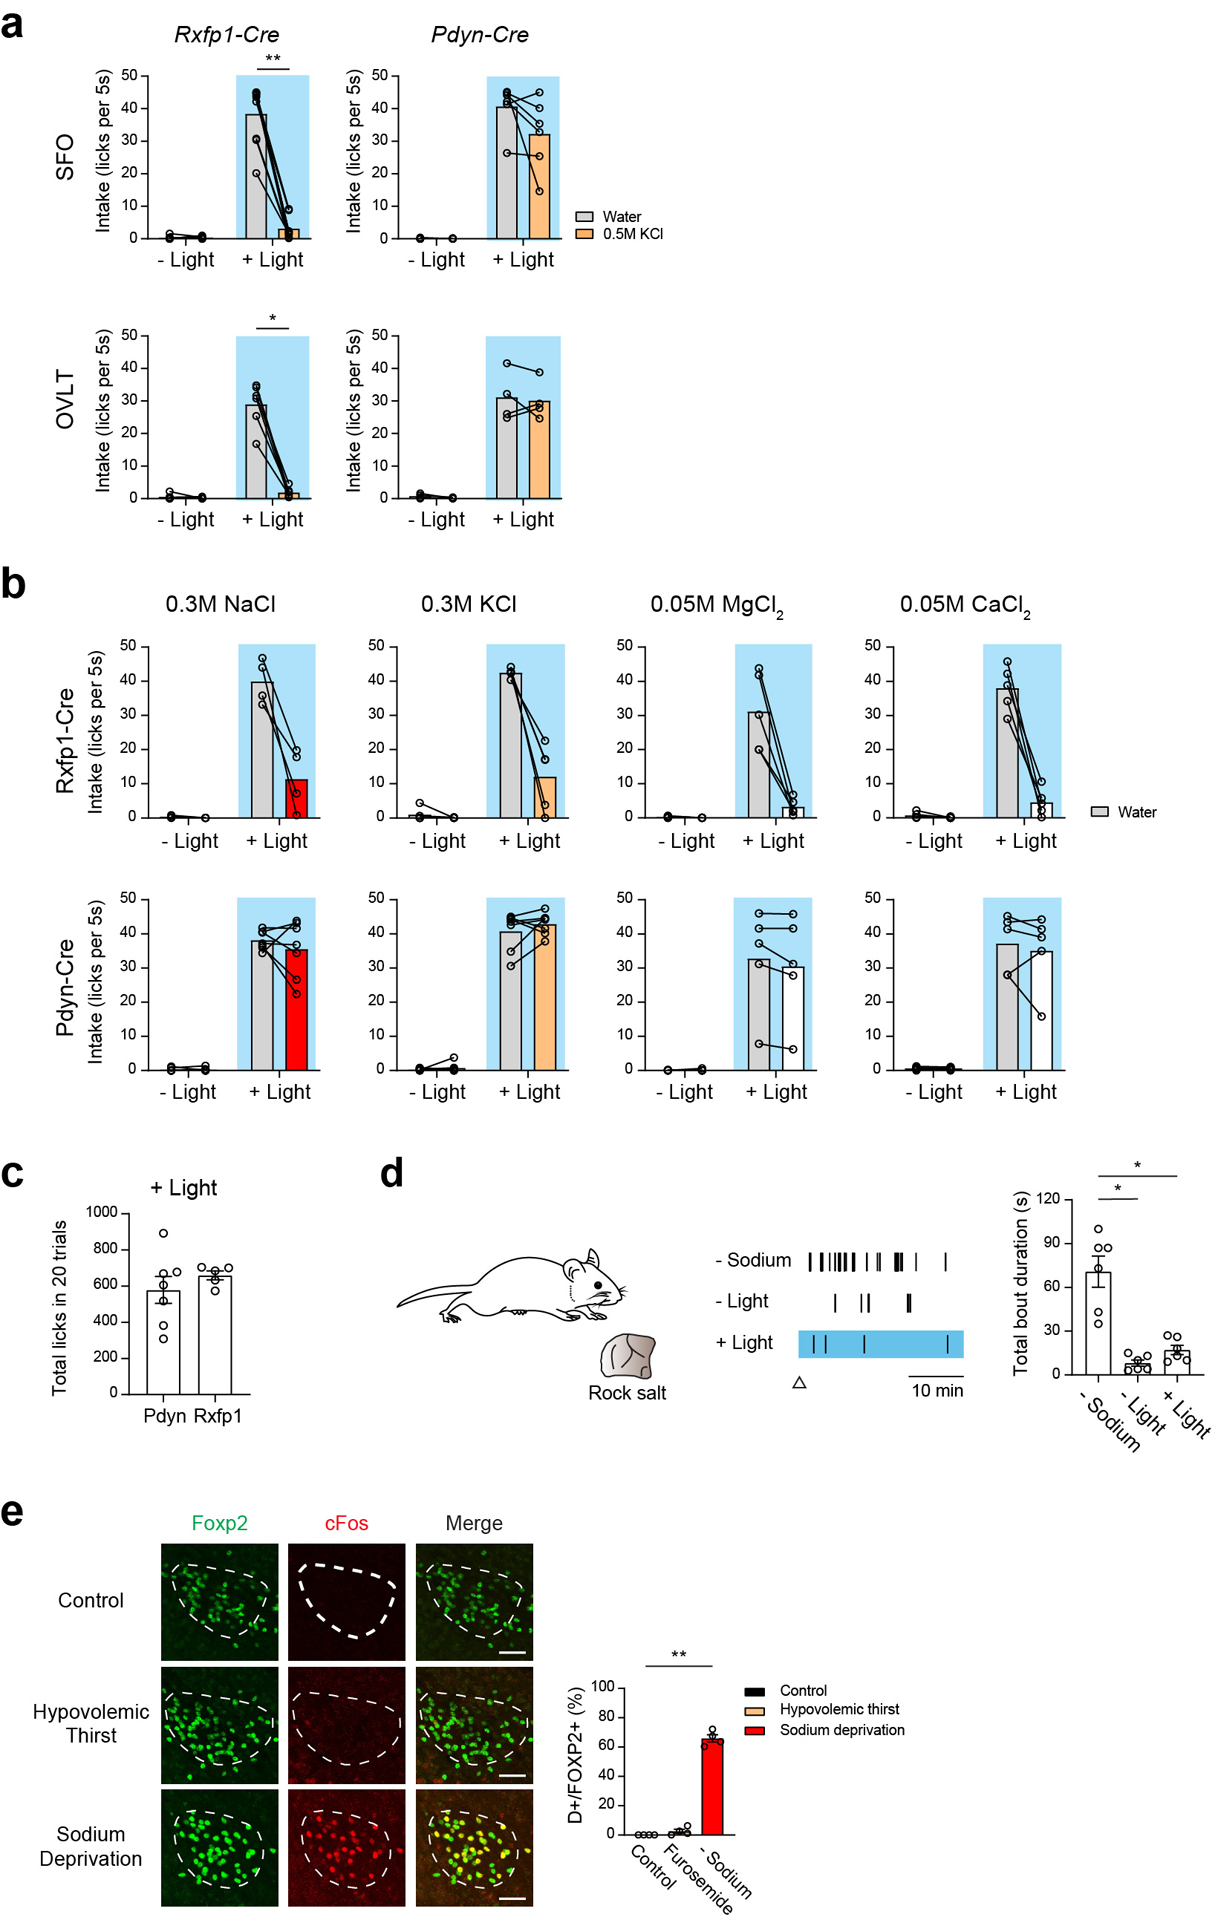
a, Photostimulation of Rxfp1 neurons in the SFO triggered robust drinking preference to pure water (middle panel, n = 9 mice), while photostimulation of SFOPdyn neurons induced indiscriminate intake of both water and 0.5 M KCl (n = 6 mice). We observed similar preference in OVLT neurons (n = 6 mice for Rxfp1-Cre, and n = 4 mice for Pdyn-Cre). b, Drinking patterns of Rxfp1-Cre and Pdyn-Cre animals to different concentrations and various salts. Photoactivation of SFORxfp1 induced robust pure water drinking, while the same animal avoided NaCl (0.3 M, n = 4 mice), KCl (0.3 M, n = 5 mice), MgCl2 (0.05 M, n = 5) and CaCl2 (0.05M, n = 5). Animals that receive stimulation in SFOPdyn neurons accepted all of the above solutions (n = 7 mice for NaCl and KCl, 5 mice for MgCl2 and CaCl2). c, Photostimulation of SFOPdyn and SFORxfp1 neurons triggered comparable total fluid intake (n = 7 mice for SFOPdyn, n = 5 mice for SFORxfp1). The total lick number over 20 trials was quantified. d, Photostimulation of SFOPdyn neurons did not drive sodium-licking behavior (n = 6 animals). Schematic of rock salt behavior test (left). Representative salt licking raster plots under sodium deprivation (-Sodium), sated (- Light) and photostimulation (+ Light) are presented (middle). Triangle marks the start time of recording. The total bout duration is quantified (right). e, Hypovolemic stress failed to activate sodium appetite neurons in Pre-LC. Representative images of c-Fos (red) and Foxp2 expression (a genetic marker for sodium appetite neurons, green) under sated (Control), hypovolemic thirst (Furosemide) and sodium deprived conditions (Sodium deprivation). Quantification shows percentage of activated sodium appetite neurons (double positive / Foxp2 positive neurons, right, n = 4 mice per group). Scale bar, 50 μm. * p < 0.05, ** p < 0.01, *** p < 0.001, **** p < 0.0001, by two-tailed Wilcoxon matched-pairs signed rank test, Mann-Whitney test, Friedman test or Kruskal-Wallis test followed by a Dunn’s post test. Data are shown as mean ± s.e.m.
Supplementary Material
Acknowledgements
We thank the members of the Oka laboratory, D.J. Anderson, M. Thomson, S. Chen for helpful discussion and comments. We thank B. Ho and A. Koranne for maintaining and genotyping animal lines. We thank Jeff Park and Single-Cell Profiling Center (SPEC) in the Beckman Institute at Caltech for technical assistance with single-cell RNA-seq. We thank B. Lowell and M. Krashes for generously sharing Pdyn-Cre mice. We thank L. Luo for a generous gift of TRAP2 mice. This work was supported by Startup funds from the President and Provost of California Institute of Technology and the Biology and Biological Engineering Division of California Institute of Technology. Y.O. is also supported by the Searle Scholars Program, the Mallinckrodt Foundation, the McKnight Foundation, and the Klingenstein-Simons Foundation, New York Stem Cell Foundation and NIH (R56MH113030, R01NS109997). J.N. is supported by NIH (U19MH114830).
Footnotes
The authors declare no competing financial interests.
References
- 1.Fitzsimons JT The physiology of thirst and sodium appetite. Monogr Physiol Soc, 83–122 (1979). [PubMed] [Google Scholar]
- 2.Leib DE, Zimmerman CA & Knight ZA Thirst. Curr Biol 26, R1260–R1265, doi: 10.1016/j.cub.2016.11.019 (2016). [DOI] [PMC free article] [PubMed] [Google Scholar]
- 3.McKinley MJ & Johnson AK The physiological regulation of thirst and fluid intake. News Physiol Sci 19, 1–6 (2004). [DOI] [PubMed] [Google Scholar]
- 4.Augustine V, Lee S & Oka Y Neural Control and Modulation of Thirst, Sodium Appetite, and Hunger. Cell 180, 25–32, doi: 10.1016/j.cell.2019.11.040 (2020). [DOI] [PMC free article] [PubMed] [Google Scholar]
- 5.Bourque CW Central mechanisms of osmosensation and systemic osmoregulation. Nature reviews. Neuroscience 9, 519–531, doi: 10.1038/nrn2400 (2008). [DOI] [PubMed] [Google Scholar]
- 6.Zimmerman CA, Leib DE & Knight ZA Neural circuits underlying thirst and fluid homeostasis. Nature reviews. Neuroscience 18, 459–469, doi: 10.1038/nrn.2017.71 (2017). [DOI] [PMC free article] [PubMed] [Google Scholar]
- 7.McKinley MJ et al. The sensory circumventricular organs of the mammalian brain. Advances in anatomy, embryology, and cell biology 172, 1–122 (2003). [DOI] [PubMed] [Google Scholar]
- 8.Augustine V et al. Hierarchical neural architecture underlying thirst regulation. Nature 555, 204–209, doi: 10.1038/nature25488 (2018). [DOI] [PMC free article] [PubMed] [Google Scholar]
- 9.Leib DE et al. The Forebrain Thirst Circuit Drives Drinking through Negative Reinforcement. Neuron 96, 1272–1281 e1274, doi: 10.1016/j.neuron.2017.11.041 (2017). [DOI] [PMC free article] [PubMed] [Google Scholar]
- 10.Oka Y, Ye M & Zuker CS Thirst driving and suppressing signals encoded by distinct neural populations in the brain. Nature 520, 349–352, doi: 10.1038/nature14108 (2015). [DOI] [PMC free article] [PubMed] [Google Scholar]
- 11.Stricker EM Osmoregulation and volume regulation in rats: inhibition of hypovolemic thirst by water. The American journal of physiology 217, 98–105, doi: 10.1152/ajplegacy.1969.217.1.98 (1969). [DOI] [PubMed] [Google Scholar]
- 12.Jalowiec JE, Crapanzano JE & Stricker EM Specificity of salt appetite elicited by hypovolemia. Psychon. Sci 6, 331–332 (1966). [Google Scholar]
- 13.Allen WE et al. Thirst-associated preoptic neurons encode an aversive motivational drive. Science 357, 1149–1155, doi: 10.1126/science.aan6747 (2017). [DOI] [PMC free article] [PubMed] [Google Scholar]
- 14.Johnson AK & Gross PM Sensory circumventricular organs and brain homeostatic pathways. FASEB journal : official publication of the Federation of American Societies for Experimental Biology 7, 678–686 (1993). [DOI] [PubMed] [Google Scholar]
- 15.Johnson AK, Zardetto-Smith AM & Edwards GL Integrative mechanisms and the maintenance of cardiovascular and body fluid homeostasis: the central processing of sensory input derived from the circumventricular organs of the lamina terminalis. Progress in brain research 91, 381–393 (1992). [DOI] [PubMed] [Google Scholar]
- 16.Butler A, Hoffman P, Smibert P, Papalexi E & Satija R Integrating single-cell transcriptomic data across different conditions, technologies, and species. Nature biotechnology 36, 411–420, doi: 10.1038/nbt.4096 (2018). [DOI] [PMC free article] [PubMed] [Google Scholar]
- 17.Stuart T et al. Comprehensive Integration of Single-Cell Data. Cell 177, 1888–1902 e1821, doi: 10.1016/j.cell.2019.05.031 (2019). [DOI] [PMC free article] [PubMed] [Google Scholar]
- 18.Benz F et al. Low wnt/beta-catenin signaling determines leaky vessels in the subfornical organ and affects water homeostasis in mice. Elife 8, doi: 10.7554/eLife.43818 (2019). [DOI] [PMC free article] [PubMed] [Google Scholar]
- 19.Bourque CW, Oliet SH & Richard D Osmoreceptors, osmoreception, and osmoregulation. Frontiers in neuroendocrinology 15, 231–274 (1994). [DOI] [PubMed] [Google Scholar]
- 20.Sharif-Naeini R, Ciura S, Zhang Z & Bourque CW Contribution of TRPV channels to osmosensory transduction, thirst, and vasopressin release. Kidney Int 73, 811–815, doi: 10.1038/sj.ki.5002788 (2008). [DOI] [PubMed] [Google Scholar]
- 21.Hrvatin S et al. Single-cell analysis of experience-dependent transcriptomic states in the mouse visual cortex. Nature neuroscience 21, 120-+, doi: 10.1038/s41593-017-0029-5 (2018). [DOI] [PMC free article] [PubMed] [Google Scholar]
- 22.Wu YE, Pan L, Zuo YN, Li XM & Hong WZ Detecting Activated Cell Populations Using Single-Cell RNA-Seq. Neuron 96, 313-+, doi: 10.1016/j.neuron.2017.09.026 (2017). [DOI] [PubMed] [Google Scholar]
- 23.Betley JN et al. Neurons for hunger and thirst transmit a negative-valence teaching signal. Nature 521, 180–185, doi: 10.1038/nature14416 (2015). [DOI] [PMC free article] [PubMed] [Google Scholar]
- 24.Campbell JN et al. A molecular census of arcuate hypothalamus and median eminence cell types. Nature neuroscience 20, 484–496, doi: 10.1038/nn.4495 (2017). [DOI] [PMC free article] [PubMed] [Google Scholar]
- 25.Moffitt JR et al. Molecular, spatial, and functional single-cell profiling of the hypothalamic preoptic region. Science 362, doi: 10.1126/science.aau5324 (2018). [DOI] [PMC free article] [PubMed] [Google Scholar]
- 26.Geerling JC & Loewy AD Central regulation of sodium appetite. Experimental physiology 93, 177–209, doi: 10.1113/expphysiol.2007.039891 (2008). [DOI] [PubMed] [Google Scholar]
- 27.Lee S et al. Chemosensory modulation of neural circuits for sodium appetite. Nature 568, 93–97, doi: 10.1038/s41586-019-1053-2 (2019). [DOI] [PMC free article] [PubMed] [Google Scholar]
- 28.Fitzsimons JT Angiotensin, thirst, and sodium appetite. Physiological reviews 78, 583–686, doi: 10.1152/physrev.1998.78.3.583 (1998). [DOI] [PubMed] [Google Scholar]
- 29.Gizowski C & Bourque CW The neural basis of homeostatic and anticipatory thirst. Nat Rev Nephrol 14, 11–25, doi: 10.1038/nrneph.2017.149 (2018). [DOI] [PubMed] [Google Scholar]
- 30.Hiyama TY, Watanabe E, Okado H & Noda M The subfornical organ is the primary locus of sodium-level sensing by Na(x) sodium channels for the control of salt-intake behavior. The Journal of neuroscience : the official journal of the Society for Neuroscience 24, 9276–9281 (2004). [DOI] [PMC free article] [PubMed] [Google Scholar]
- 31.Antunes-Rodrigues J, McCann SM, Rogers LC & Samson WK Atrial natriuretic factor inhibits dehydration- and angiotensin II-induced water intake in the conscious, unrestrained rat. Proceedings of the National Academy of Sciences of the United States of America 82, 8720–8723, doi: 10.1073/pnas.82.24.8720 (1985). [DOI] [PMC free article] [PubMed] [Google Scholar]
- 32.Ciura S & Bourque CW Transient receptor potential vanilloid 1 is required for intrinsic osmoreception in organum vasculosum lamina terminalis neurons and for normal thirst responses to systemic hyperosmolality. The Journal of neuroscience : the official journal of the Society for Neuroscience 26, 9069–9075, doi: 10.1523/JNEUROSCI.0877-06.2006 (2006). [DOI] [PMC free article] [PubMed] [Google Scholar]
- 33.Gizowski C, Zaelzer C & Bourque CW Clock-driven vasopressin neurotransmission mediates anticipatory thirst prior to sleep. Nature 537, 685–688, doi: 10.1038/nature19756 (2016). [DOI] [PubMed] [Google Scholar]
- 34.Kinsman B et al. Osmoregulatory thirst in mice lacking the transient receptor potential vanilloid type 1 (TRPV1) and/or type 4 (TRPV4) receptor. American journal of physiology. Regulatory, integrative and comparative physiology 307, R1092–1100, doi: 10.1152/ajpregu.00102.2014 (2014). [DOI] [PMC free article] [PubMed] [Google Scholar]
- 35.Liedtke W & Friedman JM Abnormal osmotic regulation in trpv4−/− mice. Proceedings of the National Academy of Sciences of the United States of America 100, 13698–13703, doi: 10.1073/pnas.1735416100 (2003). [DOI] [PMC free article] [PubMed] [Google Scholar]
- 36.Miller RL & Loewy AD ENaC gamma-expressing astrocytes in the circumventricular organs, white matter, and ventral medullary surface: sites for Na+ regulation by glial cells. J Chem Neuroanat 53, 72–80, doi: 10.1016/j.jchemneu.2013.10.002 (2013). [DOI] [PMC free article] [PubMed] [Google Scholar]
- 37.Miller RL, Wang MH, Gray PA, Salkoff LB & Loewy AD ENaC-expressing neurons in the sensory circumventricular organs become c-Fos activated following systemic sodium changes. American journal of physiology. Regulatory, integrative and comparative physiology 305, R1141–1152, doi: 10.1152/ajpregu.00242.2013 (2013). [DOI] [PMC free article] [PubMed] [Google Scholar]
- 38.Nomura K et al. [Na(+)] Increases in Body Fluids Sensed by Central Nax Induce Sympathetically Mediated Blood Pressure Elevations via H(+)-Dependent Activation of ASIC1a. Neuron 101, 60–75 e66, doi: 10.1016/j.neuron.2018.11.017 (2019). [DOI] [PubMed] [Google Scholar]
- 39.Samson WK et al. Central nervous system action of endothelin-3 to inhibit water drinking in the rat. Brain research 539, 347–351, doi: 10.1016/0006-8993(91)91643-f (1991). [DOI] [PubMed] [Google Scholar]
- 40.Sunn N et al. Circulating relaxin acts on subfornical organ neurons to stimulate water drinking in the rat. Proceedings of the National Academy of Sciences of the United States of America 99, 1701–1706, doi: 10.1073/pnas.022647699 (2002). [DOI] [PMC free article] [PubMed] [Google Scholar]
- 41.Tang-Christensen M et al. Central administration of GLP-1-(7–36) amide inhibits food and water intake in rats. The American journal of physiology 271, R848–856, doi: 10.1152/ajpregu.1996.271.4.R848 (1996). [DOI] [PubMed] [Google Scholar]
- 42.Watanabe E et al. Nav2/NaG channel is involved in control of salt-intake behavior in the CNS. The Journal of neuroscience : the official journal of the Society for Neuroscience 20, 7743–7751 (2000). [DOI] [PMC free article] [PubMed] [Google Scholar]
- 43.Guenthner CJ, Miyamichi K, Yang HH, Heller HC & Luo L Permanent genetic access to transiently active neurons via TRAP: targeted recombination in active populations. Neuron 78, 773–784, doi: 10.1016/j.neuron.2013.03.025 (2013). [DOI] [PMC free article] [PubMed] [Google Scholar]
- 44.Lein ES et al. Genome-wide atlas of gene expression in the adult mouse brain. Nature 445, 168–176, doi: 10.1038/nature05453 (2007). [DOI] [PubMed] [Google Scholar]
Associated Data
This section collects any data citations, data availability statements, or supplementary materials included in this article.
Supplementary Materials
Data Availability Statement
The behavioral and histology data that support the findings are available from the corresponding author upon reasonable request. Raw and fully processed scRNA-seq data is available at the NCBI Gene Expression Omnibus (GEO accession # GSE154048).


