

Abstract
No predictive biomarkers can robustly identify non-small cell lung cancer (NSCLC) patients who will benefit from immune checkpoint inhibitor (ICI) therapies. Here, in a machine learning setting, we compared changes (“delta”) in the radiomic texture (DelRADx) of computed tomography (CT) patterns both within and outside tumor nodules before and after 2–3 cycles of ICI therapy. We found that DelRADx patterns could predict response to ICI therapy and overall survival (OS) for patients with NSCLC. We retrospectively analyzed data acquired from 139 NSCLC patients at two institutions, who were divided into a discovery set (D1 = 50) and two independent validation sets (D2 = 62, D3 = 27). Intranodular and perinodular texture descriptors were extracted and the relative differences were computed. A linear discriminant analysis (LDA) classifier was trained with 8 DelRADx features to predict RECIST (response evaluation criteria in solid tumors)-derived response. Association of delta-radiomic risk-score (DRS) with OS was determined. The association of DelRADx features with tumor-infiltrating lymphocyte (TIL) density on the diagnostic biopsies (n = 36) was also evaluated. The LDA classifier yielded an area under the curve (AUC) of 0.88 ± 0.08 in distinguishing responders from nonresponders in D1, 0.85 and 0.81 in D2 and D3. DRS was associated with OS (hazard ratio: 1.64, 95% CI: 1.22 – 2.21, P = 0.0011, C-Index = 0.72). Peritumoral Gabor features were associated with the density of TILs on diagnostic biopsy samples. Our results show that DelRADx could be used to identify early functional responses in NSCLC patients.
Keywords: Delta Radiomics, Computed tomography, Lung cancer, Immunotherapy, Immune checkpoint inhibitors
Introduction
Immune checkpoint inhibitors (ICIs) targeting the PD-1/ PD-L1 axis are the standard of care for treatment of patients with advanced non-small cell lung cancer (NSCLC) without targetable genetic alterations [1]. Susceptibilities in immune checkpoint pathways allow tumor cells to escape immune surveillance, leading to tumor propagation. Monoclonal antibodies targeting these pathways reinvigorate the host immunity against tumor cells and have revolutionized the treatment of a range of malignancies due to their favorable toxicity profiles and their ability to produce durable clinical responses [2]. However, the response rates to these drugs remain modest (27% in PD-L1+ NSCLC in the first line setting [3] and 45% in PD-L1high subgroup [4], and 19% in the second line setting). In addition, optimal patient selection for therapy remains a challenge since most available biomarkers such as PD-L1 expression are insufficient to accurately classify patients. Historically, clinical efficacy of anti-cancer therapy has been evaluated by using Response Evaluation Criteria in Solid Tumors (RECIST) or World Health Organization (WHO) criteria which incorporate two dimensional measures of target lesions that are tracked over time [5]. These criteria have been used to define responses to therapy in a majority of the clinical trials that has led to subsequent drug approval for years [6, 7, 8]. As per RECIST, at least a 20% increase in the sum of the longest diameter of target lesions or development of new ones is considered disease progression. RECIST guidelines focus on changes in tumor size and do not take into account changes in tumor heterogeneity, which may be more indicative of tumor biology and evolution during therapy.
Radiomics is the science of quantifying patterns of tumor phenotypes on radiographic scans in a high throughput manner and analyzing them with bioinformatics tools to build clinically relevant models that assess tumor and microenvironment heterogeneity. Indeed, radiomic features in regions around the tumor might reflect immune response in breast and lung cancers [9, 10, 11]. In addition to intranodular heterogeneity in PD-L1 status [12, 13, 14, 15], micro-environmental factors in the peritumoral region may be contributing to treatment failure. For instance, angiogenesis, a pathological response to hypoxia, is routinely observed adjacent to the tumor. Impaired vasculature around the tumor can lead to regions of hypoxia in tumor microenvironment which diminish the efficacy of drugs [16, 17]. With this as a basis, we hypothesized that delta radiomic analysis (DelRADx) or changes in radiomic patterns from the intra and perinodular regions of the CT scan, could provide a more accurate characterization of tumor response to ICIs in advance of visually perceptible imaging changes.
In this study, we evaluate the performance of DelRADx from within and outside thoracic lesions, in predicting response to multiple ICIs in patients with advanced NSCLC. Previous studies have begun to look at the role of radiomics in the context of predicting response to immunotherapy [18]. Here we look at delta radiomic features (change in radiomic measures between pre- and post- therapy scans) to assess RECIST-derived response to ICIs and characterize survival differences. We evaluated the efficacy of DelRADx on a total of n = 139 cases collected across two different institutions which included different ICI agents (nivolumab, atezolizumab, and pembrolizumab). In order to evaluate the morphologic basis of the DelRADx features, we also investigated associations between the predictive DelRADx features and computerized estimations of density of tumor infiltrating lymphocytes (TIL) on corresponding digitized pre-treatment diagnostic H&E biopsy scans (n = 36). We also compared the efficacy of DelRADx against that of PD-L1 expression in predicting OS and response to ICIs. Our study demonstrated that dynamic textural changes, both inside and outside the nodule between baseline and post-treatment CT scans of NSCLC patients following ICI therapy, correlate with clinical benefit. These sub-visual morphologic changes could potentially be used to identify early clinical response before objective reduction in tumor burden. Since these delta radiomic features are also associated with overall survival, they could be used to identify patients who are likely to derive clinical benefit from therapy beyond functional responses. This could be valuable in the clinical decision making process for patients with long term disease stabilization or those with delayed radiographic responses due to immunotherapy.
Materials and Methods
Datasets and Patient Selection
The study was conducted in full accordance with the US Common Rule and HIPAA regulations after approval from institutional IRB (IRB 02-13-42C) at Case Western Reserve University. The IRB waived the requirements for informed consent since the study was performed on retrospective, archived specimens. A total of n = 218 patients with advanced NSCLC treated with a PD1/PD-L1 ICI therapy (nivolumab/pembrolizumab/atezolizumab) from January 2012 to August 2017 in Cleveland Clinic Foundation (CCF) and University of Pennsylvania Health System (UPHS) were identified. Samples in which the board-certified radiologist (8 years of experience) could not isolate index lesions on CT scans or the CT scans with poor image quality, not suitable for radiomic feature extraction, led to exclusion of 76 of the 188 patients from CCF and 3 of the 30 patients from UPHS. The study included the remaining 112 patients from CCF and 27 patients from UPHS, for a total of 139 patients. Digitized histology scans of baseline biopsies were available for 36 of cases from CCF. All patients underwent a baseline contrast CT imaging before starting treatment with ICI. All patients in the included study cohorts received ICI monotherapy. After 2 (for nivolumab) to 3 cycles (for atezolizumab/pembrolizumab) of ICI, a follow-up CT scan was acquired. The timeline of ICI therapy administration and corresponding CT acquisition is shown in Fig. 1.
Figure 1.
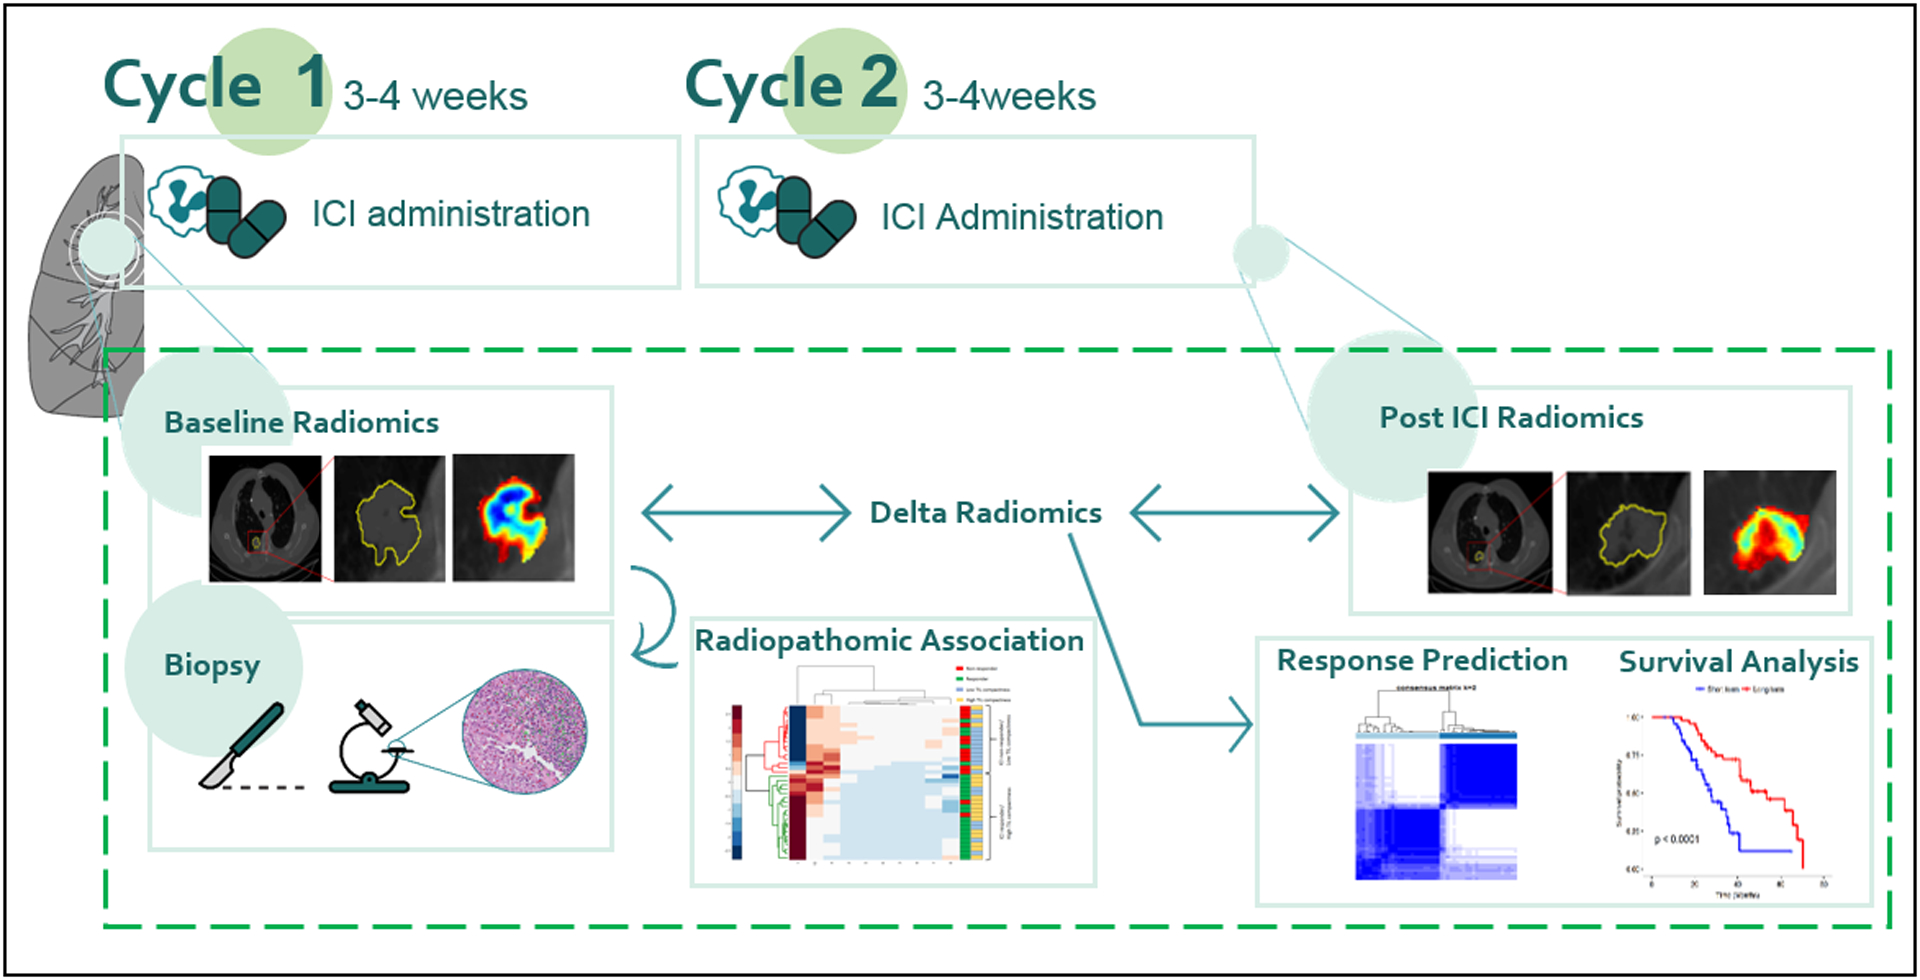
Immune checkpoint inhibitor treatment timeline and flowchart of proposed delta-radiomics machine learning framework. Note that for some agents, there were 3 cycles instead of 2.
The entire cohort of 139 patients was divided into a discovery set D1 comprising 50 patients (25 responders and 25 nonresponders) from CCF. The remaining 62 cases (42 responders and 20 nonresponders) from CCF, not used in the discovery, set were used for independent validation (D2). 27 patients from UPHS (10 responders and 17 nonresponders) were used as the second independent validation set, D3. The patients were selected in a manner that ensured an equal number of responders and nonresponders in the discovery set.
Clinical endpoints
The primary endpoint of our study was response status (responder/nonresponder), as defined by RECIST v1.1. Patients who had progressive disease after treatment (PD, defined as at least 20% increase in the sum of largest diameters of target lesions with an absolute increase of ≥ 5 mm, counting any new lesions) were classified as ‘nonresponders’, and patients who had radiographic response, including complete response, partial response or stable disease and clinical improvement were classified as ‘responders’ [5]. The secondary endpoint was overall survival (OS) that was measured from the date from the post-treatment CT scan to the date of death, and censored at the date of last follow-up for survivors.
CT Acquisition and Segmentation
CT scans were acquired from all participants at baseline and immediately after 2–3 cycles (6–8 weeks) of ICI treatment. Scans were acquired using a multi-slice (Philips Healthcare, General Electric Health Care, Siemens Healthcare) CT system with a tube voltage of 100 to 120 kVp, slice thickness (spacing) of 1 to 5 mm (mean = 2.82 mm, SD = 0.71 mm), and in-plane resolution of 0.75 × 0.75 mm. CT images were acquired with patients at inspiration breath-hold after contrast injection. All scans were acquired using the facilities’ CT chest protocol and standard image reconstruction.
Target lung nodules on pre- and post-treatment CT scans were first annotated with 3D SLICER® software by a cardiothoracic radiologist (AG, 8 years’ experience). The segmented nodules were used to compute the intranodular texture and shape features. The imaging features were computed in 2D whereas shape features were calculated as described in [10]. Tumor measurements were then reviewed to assess responses of each target lesion. The same thresholds for response and progression for the total tumor burden were applied for the lesion-based assessment. The nodule mask was then dilated out to a 30 mm perinodular radius, which was divided into 15 annular rings of 2 mm each. The choice of perinodular compartment size was determined based on National Comprehensive Cancer Network guidelines [19] that suggests a resection margin of 2 cm or greater. During the peritumoral texture analysis of the lung parenchyma, care was taken to remove air (< −900 HU) and mediastinal muscle pixels (> −100 HU) in peripheral tumor. To avoid edge artifacts that might arise during feature extraction, the ‘dead’ pixels of the CT scan were substituted with the average pixel intensity from a 9 × 9 window surrounding the pixel of interest.
Radiomic Feature Extraction
After CT acquisition and segmentation, radiomic features were extracted using MATLAB 2018b (Mathworks, Natick, MA, USA) with an in-house developed toolbox [9, 19]. Radiomic features were extracted from within and around the voxels of the segmented nodules from the CT scans. Ninety-nine texture features, from 4 feature groups (25 Laws Energy, 48 multi-scale multi-orientation Gabor, 13 Haralick, and 13 CoLlAGe features) were extracted from each region. Statistics (mean, median, SD, skewness, and kurtosis) for each feature were computed within the tumor and each perinodular annulus, resulting in 495 statistical features per region. A total of 24 shape features were also automatically extracted from the annotated nodules and investigated in the study. All of these features have been used in previous radiomic studies for discriminating cancer phenotypes [20, 21, 22, 23]. The extracted radiomic feature intensities were then normalized to adjust values to a notionally common scale between −1 and 1. In order to find which features were most distinct between responders and nonresponders, the percent change of feature statistics between baseline and post- 6–8 week scans was calculated to yield the DelRADx feature set.
Feature Selection
To construct generalizable classifiers, the features identified as predictive must be consistent across sites and scanners. In order to identify which of the predictive features identified during the feature selection step were also stable and reproducible, we evaluated the DelRADx features in the context of the test-retest RIDER lung CT dataset [24]. The RIDER dataset includes 31 patients, each patient having been scanned twice on a CT scanner with an interval of approximately 15 minutes. For each radiomic feature identified via feature selection, the intra-class correlation coefficient (ICC) was calculated to quantify reproducibility between the test-retest scans. Since ICC describes similarity of units in the same group; features with high ICC values are thus more reproducible and potentially more robust to variations in CT scanners and acquisition parameters. We used an ICC cutoff > 0.8 to identify stable and reproducible features. Within all stable features, Wilcoxon rank sum (WLCX) feature selection method was used to select predictive features.
Statistical Analysis
Classification
A Linear Discriminant analysis (LDA) classifier was employed in conjunction with the stable and discriminating DelRADx features identified during the feature selection step. Within the discovery set D1, the classifier was trained with top selected features on 70% of data and validated on the remaining 30%. The procedure was iterated over 100 runs. The performance of the DelRADx feature classifier was assessed from the receiver operating characteristic curve as area under the curve (AUC). In addition, we employed unsupervised clustering to measure the efficacy of the identified DelRADx features. A heat map clustergram was used to display unsupervised hierarchal clustering using the intranodular and perinodular DelRADx feature sets. A consensus clustering approach (Kmax clusters = 10, Pearson distance, Hierarchical clustering) was also used to determine the number and affiliation of possible clusters within the patients in the discovery set. To do this, the similarity between different nodules based on distance in the space of the top ranked features was first determined. Nodules belonging to different clusters will have lower correlation whereas nodules within a cluster are likely to have high intraclass correlation.
There may possibly be a difference in tumor texture phenotype in patients who get 2 cycles as compared to 3 cycles of therapy. To ascertain if there was a significant difference between two groups, an LDA classifier trained on the discovery set was evaluated in two validation sets, corresponding to patients who got 2 cycles (N1) and 3 cycles of therapy (N2), respectively. The number of correct and incorrect classification decisions was calculated and Fisher exact test [27] was performed to assess for any significant differences.
Because CT studies have a range of slice thicknesses (from 1 to 5 mm), the impact of slice thickness on the performance of the classifier was also evaluated.
Survival Analysis
The Kaplan–Meier survival analysis and log-rank statistical tests [28] were performed to assess the univariable discriminative ability of the features. The prognostic value of DelRADx features on OS and independent “added-value” of the imaging features over the traditional clinical factors was estimated by using the DelRADx risk score (DRS) signature. To build the multivariable DRS, Cox regression model was trained on D1 for the selected imaging variables (top eight) and the prediction by this model was validated on D2 and D3. Backward elimination feature selection was performed on selected prognostic features in multivariable analysis. Intermediate models were tested by repeated random sub-sampling based cross validation with 100 iterations on the discovery set. Once the mean concordance index (C-index) of the shrinking model dropped, a linear combination of the selected features with their corresponding coefficients was calculated as the final DRS model for predicting OS. The patients were stratified based on median DRS into high and low risk groups. A multivariable Cox proportional hazards model was employed to evaluate the ability of the DRS in predicting OS (by using survfit and coxph functions, respectively, in R, version 3.1.3). In addition, relative hazard ratios (HR) with 95% CIs were calculated using the Wald test and the G-rho rank test, respectively.
Morphologic Association with Predictive Radiomic Features
A set of context-based features that attempt to model the tumor environment and the relationships between lymphocytes and their surrounding cells (lymphocytes and non-lymphocytes) were explicitly defined. A watershed-based algorithm [25] was first applied to segment nuclei on the image. Considering that lymphocyte nuclei are generally distinguished from other cell nuclei by their smaller size, more rounded shape, and darker homogeneous staining, we classified the segmented nuclei into either lymphocytes or non-lymphocytes (mainly, tumor cells) using nuclei texture, shape, and color features [26]. Subsequently, density-related features were extracted that characterized the lymphocyte distribution in local neighborhoods. The density features included ratio between the number of TILs and the tissue area, ratio between the area covered by TILs to the total area of the corresponding region of interest, ratio between the number of TILs and the number of non-TILs within a region of interest, and a grouping value indicating how close the TILs are to each other (computed as the sum of the inverse distances between TILs). Consequently, 76 features quantifying density or compactness of TILs were extracted from the surgical specimens. To investigate the DelRADx-TIL associations, a pair-wise Spearman correlation was performed between each of the top DelRADx and TIL compactness measures.
Results
Clinico-pathologic features of the Patient Cohorts
The Eastern Cooperative Oncology Group (ECOG) performance status and TNM stage per the American Joint Committee on Cancer (AJCC) staging system [29, 30] were used in this study. Clinical tumor histology (adenocarcinoma or squamous cell carcinoma) was also performed according to Union for International Cancer Control (UICC) 7th classification. Detailed demographics and clinical characteristics for the 112 patients from CCF and 27 cases from UPHS are summarized in Tables 1A and B, respectively.
Table 1A:
Demographics and clinical characteristics for the 112 cases from CCF, categorized by responders and nonresponders.
| Characteristics | All patients (n = 112) |
Responders (n = 67) |
Non-responders (n = 45) |
P | |
|---|---|---|---|---|---|
| Sex | Male | 58 (52%) | 31 | 27 | 0.57 |
| Female | 54 (48%) | 36 | 18 | ||
| Age | Median (range) | 65 (42–83) | 65 (42–81) | 65 (46–83) | 0.27 |
| Race | White | 92 (82%) | 55 | 37 | 0.99 |
| Black | 20 (18%) | 12 | 8 | ||
| Smoking | Never | 16 (14%) | 7 | 9 | 0.18 |
| Former or current | 96 (86%) | 60 | 36 | ||
| Histology | Adenocarcinoma | 80 (71%) | 51 | 29 | 0.39 |
| Squamous cell carcinoma | 24 (22%) | 12 | 12 | ||
| Others | 8 (7%) | 4 | 4 | ||
| EGFR Mutation | Yes | 7 | 5 | 2 | 0.7 |
| No | 105 | 62 | 43 | ||
| ALK Mutation | Wild type | ||||
| TNM Staging | Distant metastasis (M1) | ||||
Table 1B:
Demographics and clinical characteristics for the 27 cases from UPHS, categorized by responders and nonresponders.
| Characteristics | All patients (n = 27) |
Responders (n = 9) |
Non-responders (n = 18) |
P | |
|---|---|---|---|---|---|
| Sex | Male | 9 (33%) | 2 | 7 | 0.67 |
| Female | 18 (67%) | 7 | 11 | ||
| Age | Median (range) | 63 (42–83) | 60 (42–80) | 64 (52–83) | |
| Race | Data Not Available. | ||||
| Smoking | Never | 6 (22%) | 2 | 4 | 0.99 |
| Former or current | 21 (78%) | 7 | 14 | ||
| Histology | Adenocarcinoma | 21 (78%) | 7 | 14 | 0.99 |
| Squamous cell carcinoma | 6 (22%) | 2 | 4 | ||
| EGFR Mutation | No EGFR mutation | ||||
| ALK Mutation | Wild type | ||||
| TNM Staging | Distant metastasis (M1) | ||||
DelRADx discrimination of responders from nonresponders after ICI therapy
The top 8 selected intranodular and annular perinodular DelRADx texture features are listed in Table 2. Figs. 2A and B illustrate the discriminability of the intranodular Haralick entropy DelRADx feature for representative nonresponder and responder patients before and after two cycles of ICI therapy. We observed an elevated expression of Haralick entropy post-therapy in the nonresponder as compared to the responder. Figs. 2C and D illustrate the discriminability of a perinodular low frequency Gabor filter DelRADx feature (24–26mm) for one nonresponder and one responder patient, before and after two cycles of ICI therapy. In the post-therapy scan, the responder showed greater feature expression than the nonresponder. This trend is also reflected in the box and whisker plots of the skewness of Haralick entropy, illustrated in Fig. 3A.
Table 2:
The most stable and discriminative DelRADx features.
| Feature Family | Descriptor | Statistic | Location | P | |
|---|---|---|---|---|---|
| 1 | Laws | W5 × L5 | Mean | Intranodular | 0.00072 |
| 2 | Haralick | Correlation | Skewness | Intranodular | 0.00072 |
| 3 | Gabor | f = 2, θ = 5π/8 | Kurtosis | Intranodular | 0.00098 |
| 4 | Haralick | Entropy | Mean | Intranodular | 0.00098 |
| 5 | Gabor | f = 2, θ = 5π/8 | Mean | Intranodular | 0.00098 |
| 6 | CoLlAGe | Sum of Var | Kurtosis | Perinodular 16–18 mm | 0.00044 |
| 7 | Gabor | f = 0, θ = π/8 | SD | Perinodular 24–26 mm | 0.00084 |
| 8 | Laws | R5 × R5 | Skewness | Perinodular 28–30 mm | 0.00072 |
Figure 2.
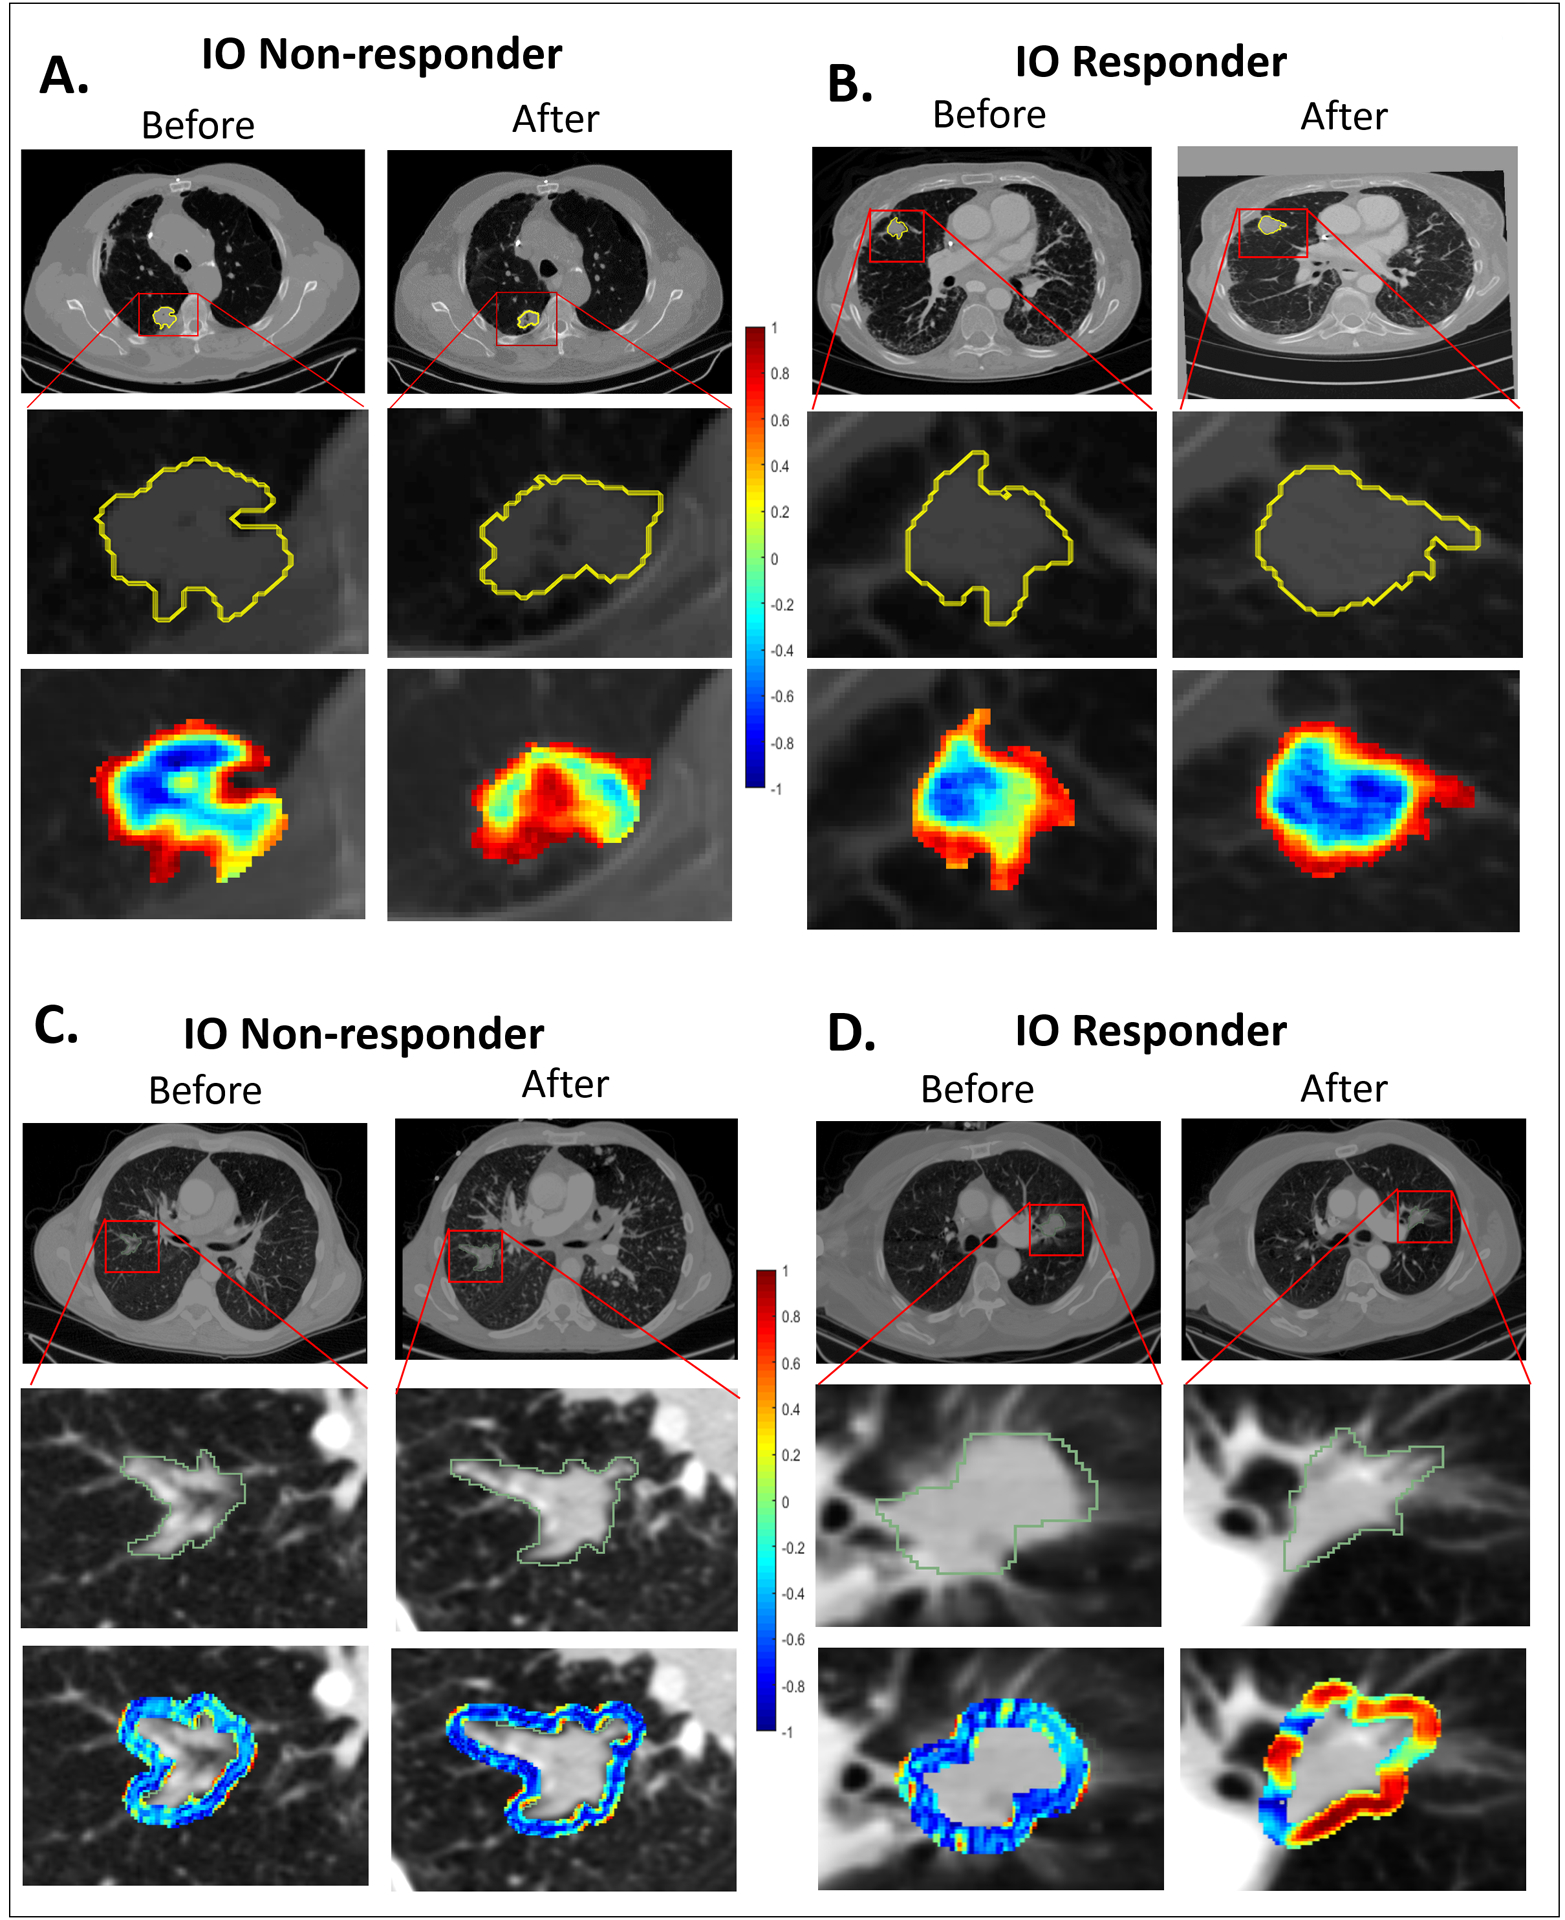
(A) Segmented tumor regions and heat map of intratumoral Haralick (entropy) feature in the pre- and post-treatment CT scans of a nonresponder. (B) Segmented tumor regions and heat map of intratumoral Haralick (entropy) feature in the pre- and post-treatment CT scans of a responder. (C) Segmented tumor regions and heat map of perinodular low frequency Gabor Filter in the pre- and post- treatment CT scans of a nonresponder. (D) Segmented tumor regions and heat map of perinodular low frequency Gabor Filter in the pre- and post- treatment CT scans of a responder.
Figure 3.
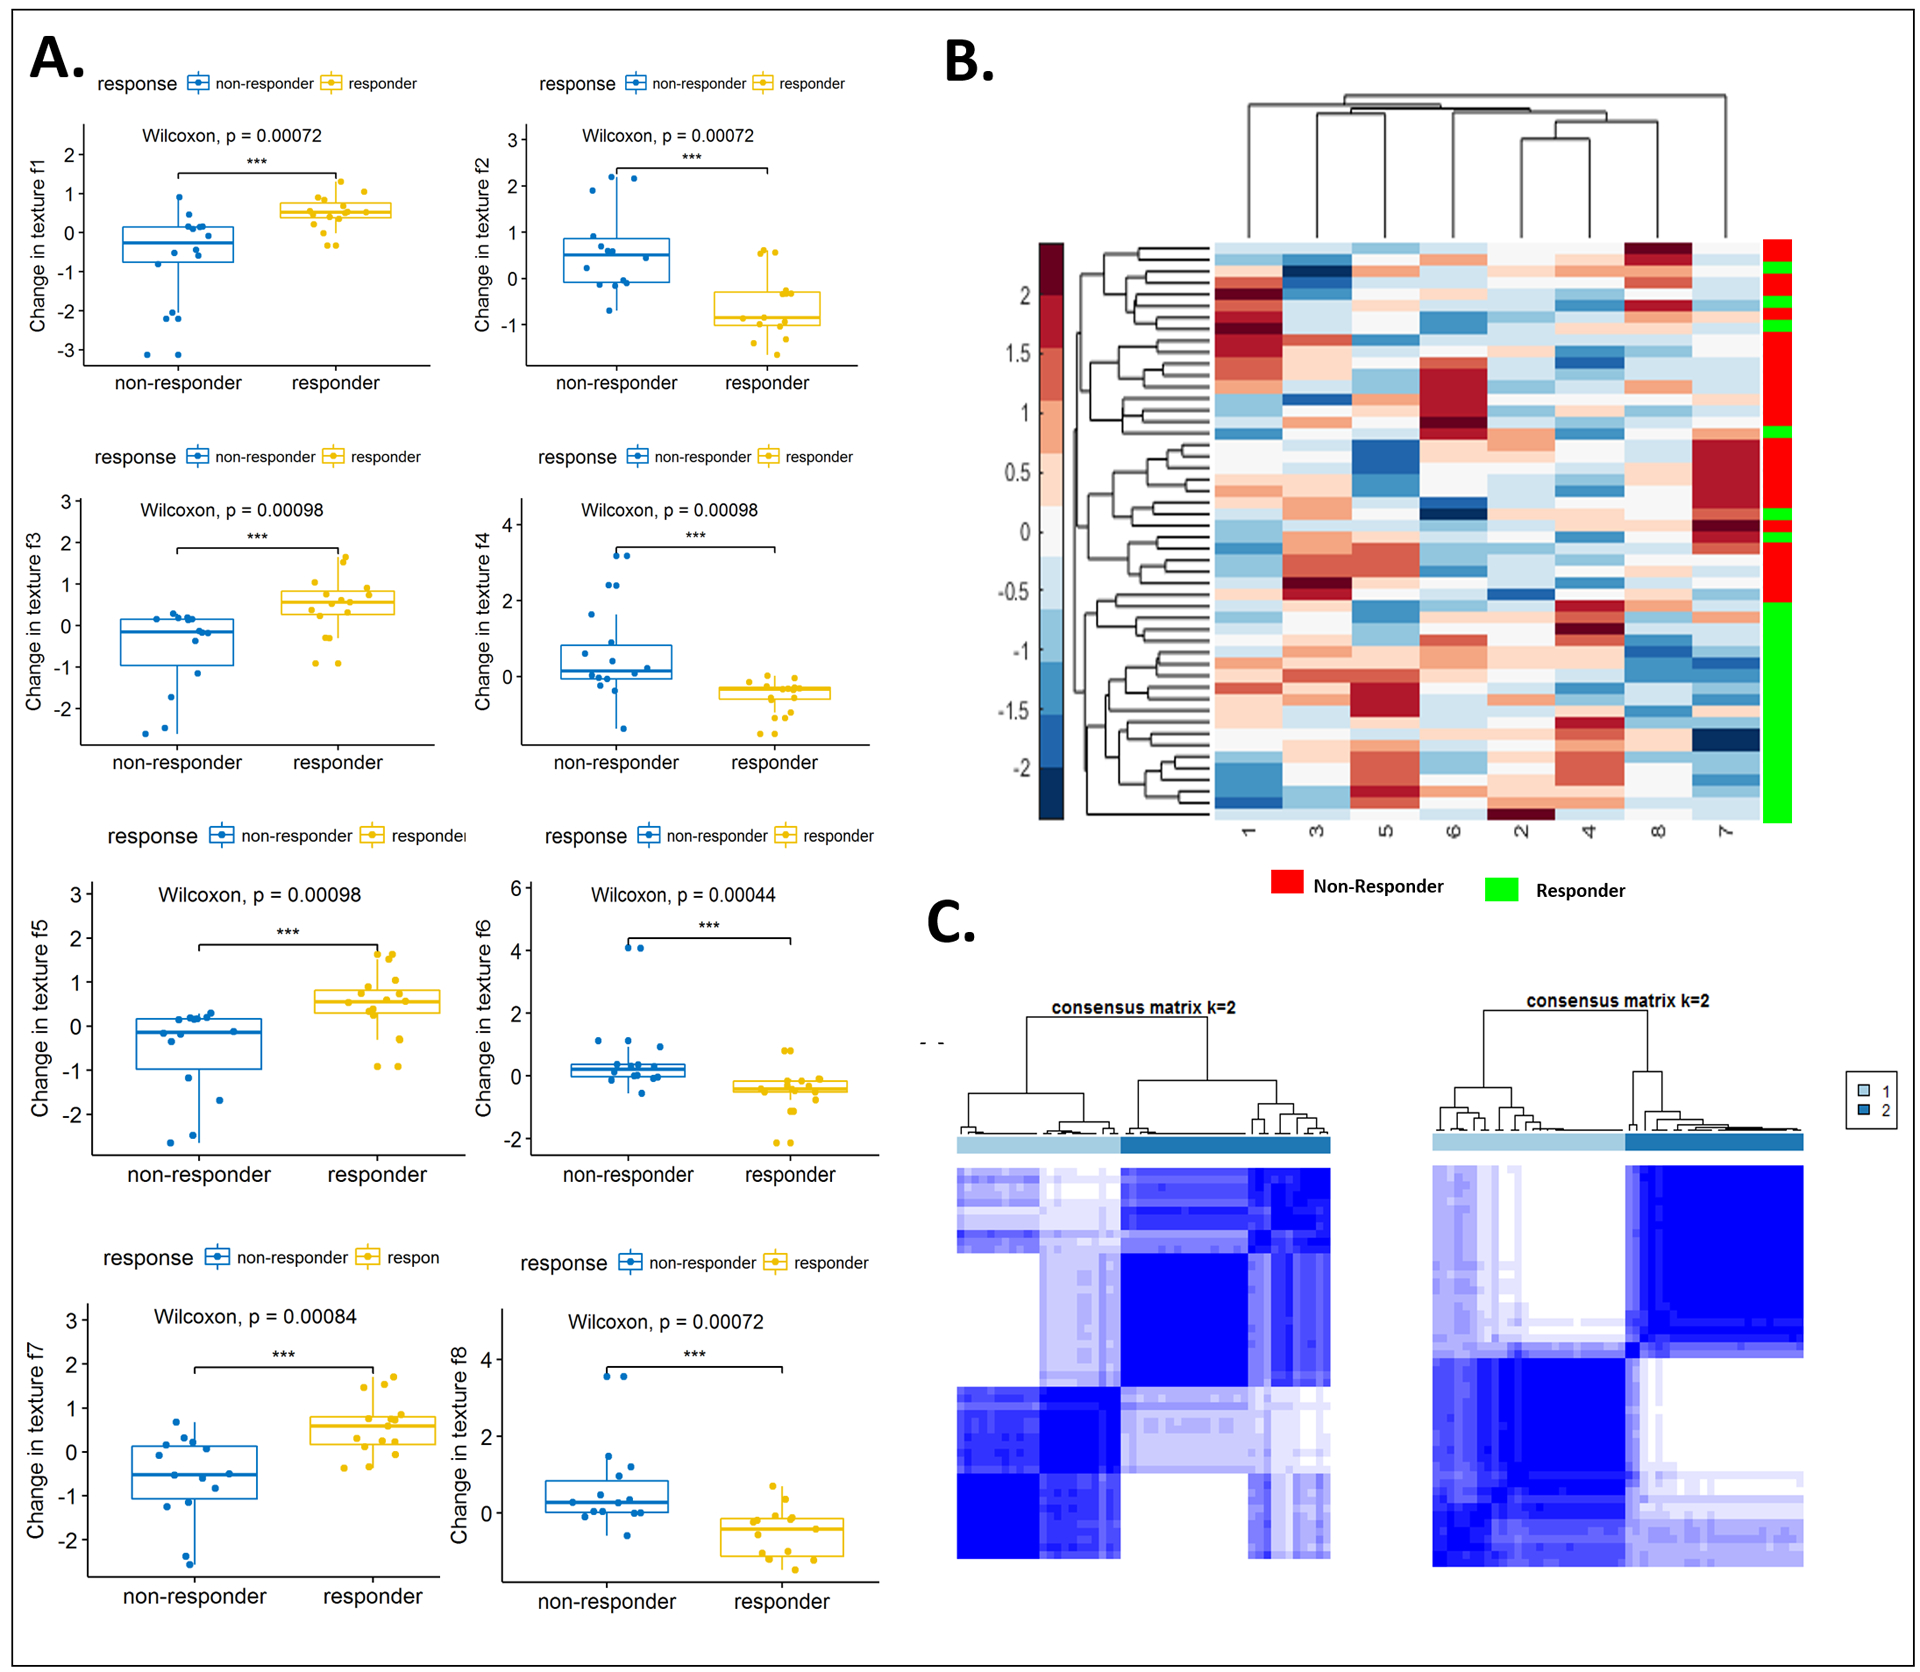
(A) Box and whisker plots for the top eight features that best distinguish IO responders from nonresponders, as identified using WLCX feature selection scheme. (B) Unsupervised hierarchical clustering of intranodular and perinodular delta radiomic features. X axis represents top selected features. Y axis represents the training set of patients (n=50). The number on X-axis corresponds to each feature in Table 2. A number of identified features showed differential expression between the responders and nonresponders for the patients in discovery set. (C) Left: Consensus clustering using combined intranodular texture and shape features. Right: Consensus clustering using combined shape, intranodular and perinodular texture features.
We also used clustering approaches to illustrate the discriminability of the identified features. Fig. 3B shows the feature expression based clustergram using the most discriminating intranodular and perinodular DelRADx features. As illustrated in Fig. 3B, a number of the texture features show differential expression between responders and nonresponders. Fig. 3C illustrates the consensus clustering plot of features identified to be both stable and discriminating of response to ICI on the discovery set. Clustering performed using only intranodular texture features yielded 73% responders and 62% nonresponders in the two dominant clusters which was less accurate in comparison to the corresponding clusters obtained via a combination of intranodular and perinodular texture features. The two clusters, using the combination of intranodular and perinodular texture features, had a preponderance of responders (75%) and nonresponders (84%), respectively, and had noticeably stronger consensus within clusters, as compared to the clusters using just intranodular texture features. The combination of top identified DelRADx features yielded an AUC of 0.88 ± 0.09 (n = 50) in the discovery set, D1. On the validation sets D2 and D3, the DelRADx classifier yielded an AUC of 0.85 (n = 62) and 0.81 (n = 27), respectively. The corresponding response prediction accuracy for the DelRADx classifier was 88%, 80%, and 69%, for patients treated with nivolumab, atezolizumab, and pembrolizumab in D2, and 75%, 70%, and 75% for patients in D3, respectively.
Supplementary Table S1 shows the performance of the model in terms of AUC mapped out as a function of slice thickness. As may be observed, the AUC of classifier for the radiomic features decreased slightly with increasing slice thickness.
DelRADx features were associated with overall survival
The median OS post therapy for D1 was 16 months (range: 1–45 months). Supplementary Table S2 shows the univariable Cox regression analysis on D1 with the top eight DelRADx features and six clinico-pathologic variables. The univariable cox regression model based on the intranodular Haralick entropy texture feature gave the highest HR amongst all other features in the discovery set (HR for survival in patients with decrease in Haralick entropy after therapy: 1.54, 95% CI: 1.19 – 2.27, P = 0.0023, C-index = 0.57). There was a statistically significant difference in survival curves for patients (in the D2 and D3 validation sets) who had Haralick entropy values below the median, as compared to those above the median (D2: p = 0.0027, D3: P = 0.0018). Also, in D2, there was no significant difference in OS with age, gender, race, smoking status, histology or EGFR mutation (age: P = 0.55, gender: P = 0.35, race: P = 0.81, smoking: P = 0.53, histology: P = 0.26 and EGFR mutation: P =1).
The DRS was associated with OS in the discovery set, D1 (HR: 1.64, 95% CI: 1.22 – 2.21, P = 0.0011, C-Index = 0.72) and yielded similar results in D2 (HR = 1.66, 95% CI = 1.25 – 2.0; P = 0.0074, C-Index = 0.69) and D3 (HR = 1.71, 95% CI = 1.36 – 2.11; P = 0.010, C-Index = 0.68), respectively. Supplementary Table S3 shows multivariable Cox regression analysis for OS in discovery set D1 and in test sets D2 and D3.
The corresponding Kaplan Meier survival curves showed a significant difference in OS between patients with low and high DRS (D2: P = 0.00039, D3: P = 0.00056). KM survival curves for D2 and D3 are shown in Figs. 4A and B, respectively.
Figure 4.

(A) Kaplan-Meier survival curves on the independent validation set D2 for different clinical variables and risk score. (B) Kaplan-Meier survival curves on the independent validation set D3 for different clinical variables and risk score.
Stratified PD-L1 expression before therapy as a predictor of OS
PD-L1 expression score was only available for 25 patients in our study cohort from CCF. We performed a subset analysis to compare the performance of our radiomic model against that of PD-L1 expression in predicting OS and response to ICIs. In the 25 patients included in this analysis, median OS post therapy was 12.5 months (range: 2–19 months). The patients were divided into high PD-L1 and low PD-L1 score categories based on the different cutoff criteria (PD-L1<1% and >1%; PD-L1<10% and >10%; PD-L1<50% and >50%) shown in Supplementary Table S4.
PD-L1 expression based on the third criteria (PD-L1<50% and >50%) could discriminate patients into two groups with different OS (P = 0.031), but no statistically significant difference in HR was observed (HR for survival in patients with low PD-L1 score: 0.35, 95% CI: 0.12 – 1.1, P = 0.065, C-index = 0.57). PD-L1 expression was also not correlated with response to treatment using Spearman correlation analysis.
When the perinodular Gabor DelRADx feature (f = 0, θ = π/8) was combined with PD-L1 score in a Cox model, the resulting PD-L1_Rad score was significantly associated with OS (HR = 0.26, 95% CI: 0.1 – 0.8, P = 0.021, C-Index = 0.80). The corresponding KM survival curves showed a significant difference in OS between patients with low and high PD-L1_Rad score (log-rank test, P = 0.0046, n = 25). The KM survival curves for this subset analysis are shown in Supplementary Fig. S1.
Predictive value for OS of volumetric changes of tumor during therapy
The median tumor volume in D1 was 4.65 ml (range: 0.137–166.83 ml) before ICI administration, and 5.58 ml (range: 0.07–370.41 ml) after 2/3 cycles of ICI. An LDA classifier trained with tumor volume change in discovery set (D1) could discriminate responders from nonresponders with an AUC of 0.70 and 0.78 in D2 and D3 respectively. The volume change was associated with OS in D1 (HR for survival in patients with less shrinkage in tumor volume after therapy: 0.58, 95% CI: 0.41 – 0.81, P = 0.0018, C-index = 0.63), with similar statistics observed in D2 (HR = 0.55, 95% CI = 0.48 – 0.78; P = 0.011, C-Index = 0.61) and D3 (HR = 0.57, 95% CI = 0.41 – 0.88; P = 0.025, C-Index = 0.60), respectively.
A multivariable Cox regression model using changes in tumor volume and DelRADx signature indicated that DelRADx signature is the only independent biomarker associated with OS in D1 (DRS: HR: 1.68, 95% CI: 1.23 – 1.98, P = 0.0001; volumetric changes: HR: 0.6, 95% CI: 0.24 – 1.63, P = 0.35; C-Index = 0.84), D2 (DRS: HR: 1.67, 95% CI: 1.12 – 1.76, P = 0.0031; volumetric changes: HR: 0.51, 95% CI: 0.31 – 1.52, P = 0.21; C-Index = 0.75), and D3 (DRS: HR: 1.74, 95% CI: 1.54 – 2.16, P = 0.0075; volumetric changes: HR: 0.58, 95% CI: 0.34 – 1.68, P = 0.43; C-Index = 0.73), respectively.
The KM curve based on percentage change in tumor volume in D2 and D3 showed that patients with high percentage shrinkage in tumor volume have a higher survival probability compared to patients with lower percentage shrinkage in tumor volume. This difference was statistically significant (p = 0.0022 for patients in D2 and 0.015 in D3). Figs. 4A and B show the KM curves for this model in D2 and D3, respectively. High and low percentage shrinkage in tumor volume was defined based on the median percentage change in tumor volume.
Morphologic Association of DelRADx features with TIL density measures
To investigate associations between the DelRADx features and density of tumor infiltrating lymphocytes (TILs), we explored a subset of 36 cases from CCF. Towards this end we employed automated nuclei detection [31] followed by density estimation of TILs in diagnostic digitized H&E images. To quantify density or compactness of TILs, 76 features were extracted from biopsied tissue specimens. A pair-wise Spearman correlation was performed between each radiomic and TIL compactness measure. The 10 DelRADx features that could best separate IO responders from nonresponders were used for unsupervised hierarchical clustering. The TIL-density feature demonstrating the highest correlation with the radiomic features was overlaid on the cluster-plot as a high/low expression based on its median value.
TIL density (TIL convex hull area/total convex hull area) was found to be significantly (ρ = −0.5, P < 0.05) correlated with a peritumoral Gabor filter DelRADx feature from the first annular ring outside the nodule. Supplementary Fig. S2A shows examples of digitized histology samples from responder and nonresponder cases, and illustrates the abundance of TILs (pink dots) in the responder, as compared to the nonresponder patient. The two hierarchical clusters that emerged using the CT radiomic features were associated with differential TIL density expressions. One cluster had a majority of responder cases (90%), whereas the other had a majority of nonresponders (69%) (Supplementary Fig. S2B). The nonresponder cluster had lower compactness (high TIL convex hull area/total convex hull area), as compared to the second cluster.
Comparison of DelRADx with baseline radiomic features
An LDA classifier trained with a combination of 2 baseline Intranodular, 6 annular ring baseline perinodular texture, and one shape feature in the discovery set yielded an AUC of 0.81 ± 0.05 and corresponding AUCs of 0.79 and 0.74 for the patients within D2 and D3 validation sets, respectively. An LDA classifier trained with baseline tumor volume in the discovery set could discriminate responders from nonresponders with an AUC of 0.64 and 0.63 in D2 and D3 respectively. However, the baseline tumor volume was not associated with OS in the discovery (HR = 1.17, 95% CI: 0.82 – 1.68, P = 0.42, C-Index = 0.56) nor the validation sets. The risk score generated by backward elimination on predictive baseline texture features was associated with OS in the discovery set (HR: 1.25, 95% CI: 1.13 – 2.56, P = 0.025, C-Index = 0.69) and yielded similar results in D2 (HR = 1.18, 95% CI = 1.1 – 2.05; P = 0.044, C-Index = 0.66). However, it was not significant in D3 (HR = 1.25, 95% CI = 0.86 – 1.94; P = 0.21, C-Index = 0.57). Supplementary Table S5 shows the differences in predicting response to treatment after 2 vs 3 cycles of ICI. The Fisher exact test yielded a p-value of 0.21 between correct and incorrect decisions by classifier, suggesting no significant differences between the two groups.
Discussion
Immune checkpoint inhibitors (ICIs) have changed the landscape of treatment for patients with advanced non-small cell lung cancer (NSCLC) without any targetable mutations [32]. Despite advances in immuno-oncology, response rates to ICI agents are modest. A problem in immuno-oncology is the lack of objective response assessment tools to characterize responses to immunotherapy. In this study, we used routinely obtained CT scans to build DelRADx, a measure of radiomic features that quantifies image changes in the tumor and peritumoral regions between the baseline and the post-therapy scans. We tested DelRADx for its value in predicting response to ICI therapy.
The most discriminating texture features for prediction of response to ICI therapy were (i) DelRADx Haralick features [33], which reflect the changes in co-occurrence intensity statistics, (ii) DelRADx Gabor features [34], which capture changes in multi-frequency gradient orientation patterns, (iii) DelRADx Laws features [35], which capture changes in wavy, ripple, and spot-like patterns, and (iv) DelRADx CoLlAGe features [36], which capture local changes in structural orientation. The Haralick entropy increment after therapy possibly arises from regions of hypoxia and acidosis [16, 17]. Acidity and hypoxia can block T-cell activation and are a barrier to the efficacy of immunotherapy drugs [37, 38, 39]. A previous study [40] has shown that Haralick features are highly associated with tumor hypoxia on FLAIR and Gd-T1w MR sequences in Glioblastoma multiforme. We observed an increase in expression of peritumoral DelRADx Gabor features after therapy. This might be reflective of higher numbers of tumor-associated inflammatory cells (TAIC) in the peritumoral compartment, similar to our previous findings in [41].
Increase in peritumoral DelRADx Laws (R5 × R5) features was associated with a decrease in OS. These features potentially capture peritumoral vascular invasion and neovascularization around the tumor, which manifest as changes in ripple patterns. This was consistent with our previous findings in NSCLC patients treated with chemotherapy, where time-to-progression in patients with elevated peritumoral Laws texture features is lower than those with decreased peritumoral Laws features [10]. Previous studies have also shown the role of blood vessels, lymphatic vessels and angiogenesis in immunotherapy response [42, 43].
We observed an association between PD-L1 expression and OS, when PD-L1 expression was stratified by 50% criteria (P = 0.031). Previous studies have shown that in patients with advanced NSCLC and PD-L1 expression on at least 50% of tumor cells, PD-1/PD-L1 targeting therapy is associated with longer progression-free and OS [44, 45, 46, 47, 48, 49, 50]. However, across a range of clinical trials, the performance of PD-L1 expression as a biomarker has been found to be suboptimal [51, 52, 53]: in clinical practice, variations in thresholds of expression, scoring systems, and the intrinsically variable nature of PD-L1 expression have conspired to reduce the value of PD-L1 as a biomarker. In fact, although only about a quarter of patients with high PD-L1 scores respond to ICI (in the first line), about the same proportion of patients have shown measurable response even with low PD-L1 expression [44, 46, 54].
Our results identified perinodular Gabor DelRADx combined with PD-L1 score as a better biomarker for OS than PD-L1 score alone. Previous study by Mazzaschi et al. [55] showed that PD-L1 amounts were not prognostic in resected NSCLC patients. However, patients with higher CD8+ lymphocytes lacking PD-1 inhibitory receptor had a longer OS. Our finding corroborates this result since perinodular Gabor DelRADx features associated with TIL density around the tumor were also prognostic of OS.
Finally, we evaluated the radio-pathomic association of TILs with predictive DelRADx features. Density of TILs is correlated with disease progression, survival outcomes, and response to therapy in a wide range of malignancies [56, 57, 58]. The presence of an immune infiltration is more likely to manifest via unique textural patterns outside the tumor [59]. In our study, TIL density was found to be correlated with a peritumoral Gabor feature from the first annular ring. Previous studies have reported an overexpression of TILs in patients who have responded to immunotherapy [60, 61, 62]. Gabor features from outside the nodule had a higher expression in adenocarcinomas as compared to granulomas: H&E images showed densely packed tumor-infiltrating lymphocytes and tumor-associated macrophages [20]. Most tumors trigger an immune response modulated by TILs. Indeed, Gabor features from the 0- to 3-mm peritumoral region in breast cancer DCE-MRI were associated with the density of tumor-infiltrating lymphocytes [41].
Previous studies have also used radiomics to predict response to ICIs [15, 24, 63, 64]. Response to immunotherapy was negatively correlated with tumor convexity and positively correlated with edge-to-core size ratio on CT scans of NSCLC patients [65]. In a study by Tang et al. [64], favorable outcome group of immune response characterized by low CT intensity and high heterogeneity exhibited low PDL1 and high CD3 infiltration, suggestive of a favorable immune activated state. Patients with immune-activated tumors had the highest 5-yr OS rate, and the patients with immune-inhibited tumors had the lowest. Radiomic signature of CD8+ cells has been shown to predict the immune phenotype of solid tumors and clinical outcomes for patients with cancer who had been treated with anti-PD-1 and PD-L1 therapies [66].
Our study differed from those previous studies in a few ways. First, in addition to radiomic features from within the confines of the nodules, we interrogated the radiomic features extracted from the annular perinodular regions. Our group has previously shown the utility of perinodular radiomic features for lung nodule diagnosis [20], predicting response to chemotherapy [10, 11, 67], and predicting OS on baseline CT in immunotherapy [68]. Second, we validated our results in two independent test sets, accrued from different sites across different immunotherapy agents. The machine classier trained with signatures obtained from cases treated with nivolumab yielded promising results when validated on cases treated with different ICI agents. Third, our study attempted to define the tissue morphology underpinning the radiomic features that were identified to be associated with response to ICI therapy. Specifically, we studied the association between the identified predictive radiomic descriptors and TIL density obtained from diagnostic biopsies. We provided a morphological rationale by determining the association of the radiomic attributes with distribution of TILs and corresponding PD-L1 expression.
We acknowledge that our study did have its limitations. The sizes of our cohorts, both for discovery and validation, were relatively small though comparable to cohort sizes from other published studies [69, 70]. Secondly, radiomic feature expressions might be sensitive to lesion annotation accuracy. In this study, nodule annotation was done by one single reader. However, because we used first-order statistics of the features within regions of interest, and not the pixel-wise feature values, we do not anticipate this impacting our findings, though further evaluation is need to ensure this. We did not consider the influence of convolution kernels, reconstruction algorithms, and slice thickness on the extracted radiomic features. Despite the limitations, our results across two sites and multiple ICI agents demonstrate the predictive value of the DelRADx features in assessing treatment response and the utility of perinodular regions in characterizing tumor microenvironment.
In conclusion, we presented an approach, DelRADx, that quantifies dynamic changes in certain textural radiomic attributes between baseline and post-treatment CT scans following ICI therapy in patients with advanced NSCLC. DelRADx features were (1) predictive of response to ICI therapy, (2) prognostic of improved overall survival, and (3) associated with TIL density on corresponding diagnostic biopsy samples. Incorporating DelRADx into personalized decision making for patients with advanced NSCLC could help characterize distinct phenotypes of the disease and serve as a non-invasive approach to identify candidates who will benefit the most from immunotherapy while sparing others of harmful side effects. Additional validation of DelRADx features is warranted to accurately define their role as predictive and prognostic biomarkers in patients treated with immunotherapy.
Supplementary Material
Financial Support
Research reported in this publication was supported by the National Cancer Institute of the National Institutes of Health under award numbers 1U24CA199374-01, R01CA202752-01A1, R01CA208236-01A1, R01CA216579-01A1 and R01CA220581-01A1. National Center for Research Resources under award number 1 C06 RR12463-01. VA Merit Review Award IBX004121A from the United States Department of Veterans Affairs Biomedical Laboratory Research and Development Service, the DOD Prostate Cancer Idea Development Award (W81XWH-15-1-0558), the DOD Lung Cancer Investigator-Initiated Translational Research Award (W81XWH-18-1-0440), the DOD Peer Reviewed Cancer Research Program (W81XWH-16-1-0329), the Ohio Third Frontier Technology Validation Fund the Wallace H. Coulter Foundation Program in the Department of Biomedical Engineering and the Clinical and Translational Science Award Program (CTSA) at Case Western Reserve University. The content is solely the responsibility of the authors and does not necessarily represent the official views of the National Institutes of Health, the U.S. Department of Veterans Affairs, the Department of Defense, or the United States Government.
Footnotes
Conflicts of interest
Vamsidhar Velcheti is a Consultant for Clovis Oncology, Genentech, Bristol-Myers Squibb, Merck, Celgene, Foundation Medicine, AstraZeneca/MedImmune and Genoptix. He has received research funding from Genentech, Trovagene, Eisai, OncoPlex Diagnostics, Alkermes, NantOmics, Genoptix, Altor BioScience, Merck, Bristol-Myers Squibb, Atreca, Heat Biologics and Leap Therapeutics. Anant Madabhushi is an equity holder in Elucid Bioimaging and in Inspirata Inc. He is also a scientific advisory consultant for Inspirata Inc and also sits on its scientific advisory board. He is also an equity holder in Inspirata Inc. Additionally his technology has been licensed to Elucid Bioimaging and Inspirata Inc. He is also involved in a NIH U24 grant with PathCore Inc. Part of his research work is sponsored by Philips.
Initial results of this work were presented at SITC 2018 and WCLC 2018.
References
- 1.Malhotra J, Jabbour SK, Aisner J. Current state of immunotherapy for non-small cell lung cancer. Translational Lung Cancer Research. 2017;6(2):196–211. doi: 10.21037/tlcr.2017.03.01. [DOI] [PMC free article] [PubMed] [Google Scholar]
- 2.Pardoll DM. The blockade of immune checkpoints in cancer immunotherapy. Nature reviews Cancer. 2012;12(4):252–264. doi: 10.1038/nrc3239. [DOI] [PMC free article] [PubMed] [Google Scholar]
- 3.Mok TSK, Wu YL, Kudaba I, Kowalski DM, et al. Pembrolizumab versus chemotherapy for previously untreated, PD-L1-expressing, locally advanced or metastatic non-small-cell lung cancer (KEYNOTE-042): a randomised, open-label, controlled, phase 3 trial. Lancet. 2019. May 4;393(10183):1819–1830. doi: 10.1016/S0140-6736(18)32409-7. [DOI] [PubMed] [Google Scholar]
- 4.Reck M, Rodríguez–Abreu D, Robinson AG, et al. Updated Analysis of KEYNOTE-024: Pembrolizumab Versus Platinum-Based Chemotherapy for Advanced Non–Small-Cell Lung Cancer With PD-L1 Tumor Proportion Score of 50% or Greater. Journal of Clinical Oncology. DOI: 10.1200/JCO.18.00149. [DOI] [PubMed] [Google Scholar]
- 5.Eisenhauera EA, Therasseb P, Bogaertsc J, Schwartzd LH, Sargente D, Fordf R, et al. New response evaluation criteria in solid tumours: Revised RECIST guideline (version 1.1). Eur J Cancer. 2009. January;45(2):228–47. doi: 10.1016/j.ejca.2008.10.026. [DOI] [PubMed] [Google Scholar]
- 6.Fojo Antonio T. and Noonan Anne. Why RECIST Works and Why It Should Stay—Counterpoint. Cancer Res; 72(20); 5151–7. DOI: 10.1158/0008-5472.CAN-12-0733 Published October 2012. [DOI] [PubMed] [Google Scholar]
- 7.Chiop VL., Burotto M. Pseudoprogression and Immune-Related Response in Solid Tumors. J Clin Oncol. 2015. November 1; 33(31): 3541–3543. [DOI] [PMC free article] [PubMed] [Google Scholar]
- 8.Wilson MK, Karakasis K, Oza AM Outcomes and endpoints in trials of cancer treatment: the past, present, and future. Lancet Oncol. 2015. January;16(1):e32–42. doi: 10.1016/S1470-2045(14)70375-4. Epub 2014 Dec 29. [DOI] [PubMed] [Google Scholar]
- 9.Braman NM, et al. , Intratumoral and peritumoral radiomics for the pretreatment prediction of pathological complete response to neoadjuvant chemotherapy based on breast DCE-MRI. Breast Cancer Res, 2017. 19(1): p. 57. [DOI] [PMC free article] [PubMed] [Google Scholar]
- 10.Khorrami M, Khunger M, Zagouras A, Combination of Peri- and Intratumoral Radiomic Features on Baseline CT Scans Predicts Response to Chemotherapy in Lung Adenocarcinoma. Radiology: Artificial IntelligenceVol. 1, No. 2 10.1148/ryai.2019180012. [DOI] [PMC free article] [PubMed] [Google Scholar]
- 11.Khorrami M, Jain P, Pingfu F, et al. Predicting pathologic response to neoadjuvant chemoradiation in resectable stage III non-small cell lung cancer patients using computed tomography radiomic features. Journal of Lung Cancer 10.1016/j.lungcan.2019.06.020. [DOI] [PMC free article] [PubMed] [Google Scholar]
- 12.Lee Won-Chul, Diao Lixia, Wang Jing, et al. Multiregion gene expression profiling reveals heterogeneity in molecular subtypes and immunotherapy response signatures in lung cancer. Modern Pathology (2018). doi: 10.1038/s41379-018-0029-3. [DOI] [PubMed] [Google Scholar]
- 13.Madore Jason, Vilain Ricardo E., Menzies Alexander M., Kakavand Hojabr. PD-L1 expression in melanoma shows marked heterogeneity within and between patients: implications for anti-PD-1/PD-L1 clinical trials. DOI: 10.1111/pcmr.12340. [DOI] [PubMed] [Google Scholar]
- 14.Munari Enrico, Zamboni Giuseppe, Marconi Marcella, et al. PD-L1 expression heterogeneity in non-small cell lung cancer: evaluation of small biopsies reliability. Published online 2017 Oct 4. doi: 10.18632/oncotarget.21485. [DOI] [PMC free article] [PubMed] [Google Scholar]
- 15.Trebeschi S, Ieva Kurilova, Călin Adriana M., Lambregts Doenja M. J., Smit Egbert F., Aerts Hugo, Radiomic biomarkers for the prediction of immunotherapy outcome in patients with metastatic non-small cell lung cancer.
- 16.Robertson-Tessi M, Gillies RJ, Gatenby RA, and Anderson ARA, “Impact of Metabolic Heterogeneity on Tumor Growth, Invasion, and Treatment Outcomes,” Cancer Research, vol. 75, no. 8, pp. 1567–1579, April 2015. [DOI] [PMC free article] [PubMed] [Google Scholar]
- 17.Gerlee P and Anderson ARA, “A hybrid cellular automaton model of clonal evolution in cancer: The emergence of the glycolytic phenotype,” Journal of Theoretical Biology, vol. 250, no. 4, pp. 705–722, February 2008. [DOI] [PMC free article] [PubMed] [Google Scholar]
- 18.Trebeschi S, Drago SG, Birkbak NJ, et al. Predicting Response to Cancer Immunotherapy using Non-invasive Radiomic Biomarkers . Annals of Oncology, mdz108, w 10.1093/annonc/mdz108. [DOI] [PMC free article] [PubMed] [Google Scholar]
- 19.Ettinger DS, Akerley W, Borghaei H, Chang AC, Cheney RT, Chirieac LR, et al. Non-small cell lung cancer, version 2.2013. J Natl Compr Canc Netw, 11 (2013), pp. 645–653. [DOI] [PubMed] [Google Scholar]
- 20.Beig N, Khorrami M, Alilou M, Perinodular and Intranodular Radiomic Features on Lung CT Images Distinguish Adenocarcinomas from Granulomas, Radiology, Vol. 290, No. 3 10.1148/radiol.2018180910. [DOI] [PMC free article] [PubMed] [Google Scholar]
- 21.Aerts HJ, Velazquez ER, Leijenaar RT, Parmar C, Grossmann P, Carvalho S, et al. Decoding tumour phenotype by noninvasive imaging using a quantitative radiomics approach. Nat Commun 2014;5:4006 doi 10.1038/ncomms5006. [DOI] [PMC free article] [PubMed] [Google Scholar]
- 22.Orooji M, Alilou M, Rakshit S, et al. “Combination of computer extracted shape and texture features enables discrimination of granulomas from adenocarcinoma on chest computed tomography,” J. Med. Imag 5(2) 024501 (18 April 2018). [DOI] [PMC free article] [PubMed] [Google Scholar]
- 23.Tiwari P, Prasanna P, Wolansky L, et al. Computer-Extracted Texture Features to Distinguish Cerebral Radionecrosis from Recurrent Brain Tumors on Multiparametric MRI: A Feasibility Study. American Journal of Neuroradiology September 2016, 10.3174/ajnr.A4931. [DOI] [PMC free article] [PubMed] [Google Scholar]
- 24.Armato S et al. The reference image database to evaluate response to therapy in lung cancer (rider) project: A resource for the development of change-analysis software. Clinical Pharmacology & Therapeutics 84, 448–456 (2008). [DOI] [PMC free article] [PubMed] [Google Scholar]
- 25.Vincent L, Soille P, Watersheds in digital spaces: an efficient algorithm based on immersion simulations. IEEE Transactions on Pattern Analysis and Machine Intelligence. Volume:13, Issue: 6, June 1991. DOI: 10.1109/34.87344. [DOI] [Google Scholar]
- 26.Xing F, Yang L. Robust Nucleus/Cell Detection and Segmentation in Digital Pathology and Microscopy Images: A Comprehensive Review. IEEE Rev Biomed Eng. 2016;9: 234–263. doi: 10.1109/RBME.2016.2515127. [DOI] [PMC free article] [PubMed] [Google Scholar]
- 27.Fisher RA (1922). “On the interpretation of χ2 from contingency tables, and the calculation of P”. Journal of the Royal Statistical Society. 85 (1): 87–94. doi: 10.2307/2340521 [DOI] [Google Scholar]
- 28.Bewick V, Cheek L, Ball J Statistics review 12: Survival analysis. Crit Care. 2004; 8(5): 389–394. Published online 2004 Sep 6. doi: 10.1186/cc2955. [DOI] [PMC free article] [PubMed] [Google Scholar]
- 29.Oken MM, Creech RH, Tormey DC, Horton J, et al. Toxicity and response criteria of the Eastern Cooperative Oncology Group. Am J Clin Oncol, 5 (1982), pp. 649–655. [PubMed] [Google Scholar]
- 30.Mirsadraee S The 7th lung cancer TNM classification and staging system: review of the changes and implications World J Radiol, 4 (2012). [DOI] [PMC free article] [PubMed] [Google Scholar]
- 31.Sornapudi S, Stanley RJ, Stoecker WV, et al. Deep Learning Nuclei Detection in Digitized Histology Images by Superpixels. J Pathol Inform. 2018;9:5 Published 2018 Mar 5. doi: 10.4103/jpi.jpi_74_17. [DOI] [PMC free article] [PubMed] [Google Scholar]
- 32.Soo RA, Lim SM, Teng R, et al. Immune checkpoint inhibitors in epidermal growth factor receptor mutant non-small cell lung cancer: Current controversies and future directions. Lung Cancer. 2018. January;115:12–20. [DOI] [PubMed] [Google Scholar]
- 33.Haralick RM, Shanmugam K, Dinstein I, Textural features for image classification. IEEEtransaction on Systems, man and cybernetics. November 1973. [Google Scholar]
- 34.Fogel I, Sagi D Gabor filters as texture discriminator. Biological Cybernetics. 61 (2). doi: 10.1007/BF00204594. ISSN 0340–1200. [DOI] [Google Scholar]
- 35.Laws K “Textured Image Segmentation”, Ph.D. Dissertation, University of Southern California, January 1980. [Google Scholar]
- 36.Prasanna P, Tiwari P, Madabhushi A Co-occurrence of Local Anisotropic Gradient Orientations (CoLlAGe): A new radiomics descriptor. Sci Rep. 2016. November 22;6:37241. doi: 10.1038/srep37241. [DOI] [PMC free article] [PubMed] [Google Scholar]
- 37.Pilon-Thomas S, Kodumudi KN, and El-Kenawi AE, “Neutralization of tumor acidity improves antitumor responses to immunotherapy,” Cancer Research, 2016. [DOI] [PMC free article] [PubMed] [Google Scholar]
- 38.Salem A, Asselin M, Reymen B, et al. Targeting Hypoxia to Improve Non–Small Cell Lung Cancer Outcome. Journal of the National Cancer Institute, Volume 110, Issue 1, 1 January 2018, Pages 14–30, 10.1093/jnci/djx160. [DOI] [PubMed] [Google Scholar]
- 39.Ganeshan B, et al. Non-small cell lung cancer: histopathologic correlates for texture parameters at CT. Radiology. 2013;266:326–336. doi: 10.1148/radiol.12112428. [DOI] [PubMed] [Google Scholar]
- 40.Beig N, Patel J, Prasanna P, Hill V, et al. Radiogenomic analysis of hypoxia pathway is predictive of overall survival in Glioblastoma. Scientific Reportsvolume 8, Article number: 7 (2018). [DOI] [PMC free article] [PubMed] [Google Scholar]
- 41.Braman N, Prasanna P, Whitney J, et al. Association of Peritumoral Radiomics With Tumor Biology and Pathologic Response to Preoperative Targeted Therapy for HER2 (ERBB2)–Positive Breast Cancer. JAMA Netw Open. 2019;2(4):e192561. doi: 10.1001/jamanetworkopen.2019.2561. [DOI] [PMC free article] [PubMed] [Google Scholar]
- 42.Hendry SA, Farnsworth RH, Solomon B, Achen MG, Stacker SA, and Fox SB, The role of the tumor vasculature in the host immune response: Implications for therapeutic strategies targeting the tumor microenvironment, Frontiers in immunology 7, 621 (2016). 10.3389/fimmu.2016.00621. [DOI] [PMC free article] [PubMed] [Google Scholar]
- 43.Alilou M, Vaidya P, Khorrami M, et al. “Quantitative vessel tortuosity radiomics on baseline non-contrast lung CT predict response to immunotherapy and are prognostic of overall survival”, Proc. SPIE 10950, Medical Imaging 2019. 10.1117/12.2513648. [DOI] [Google Scholar]
- 44.Brahmer J, Reckamp KL, Bass P, et al. Nivolumab versus Docetaxel in Advanced Squamous-Cell Non–Small-Cell Lung Cancer. N Engl J Med 2015; 373:123–135. DOI: 10.1056/NEJMoa1504627. [DOI] [PMC free article] [PubMed] [Google Scholar]
- 45.Reck M, Rodríguez-Abreu D, Robinson A>G, et al. , Pembrolizumab versus Chemotherapy for PD-L1–Positive Non–Small-Cell Lung Cancer. N Engl J Med 2016; 375:1823–1833. DOI: 10.1056/NEJMoa1606774. [DOI] [PubMed] [Google Scholar]
- 46.Herbst S, Bass P, Kim DW, et al. Pembrolizumab versus docetaxel for previously treated, PD-L1-positive, advanced non-small-cell lung cancer (KEYNOTE-010): a randomised controlled trial. Lancet. 2016. April 9;387(10027):1540–50. doi: 10.1016/S0140-6736(15)01281-7. Epub 2015 Dec 19. [DOI] [PubMed] [Google Scholar]
- 47.Khunger M, Hernandez AV, Pasupuleti V, Programmed Cell Death 1 (PD-1) Ligand (PD-L1) Expression in Solid Tumors As a Predictive Biomarker of Benefit From PD-1/PD-L1 Axis Inhibitors: A Systematic Review and Meta-Analysis. JCO May 18, 2017 DOI: 10.1200/PO.16.00030. [DOI] [PubMed] [Google Scholar]
- 48.Darvin P, Toor SM, Sasidharan Nair V, Elkord E. Immune checkpoint inhibitors: recent progress and potential biomarkers. Exp Mol Med. 2018;50(12):165 Published 2018 Dec 13. doi: 10.1038/s12276-018-0191-1. [DOI] [PMC free article] [PubMed] [Google Scholar]
- 49.Aguiar PN, De Mello RA, Barreto CMN, et al. Immune checkpoint inhibitors for advanced non-small cell lung cancer: emerging sequencing for new treatment targets ESMO Open 2017;2:e000200. doi: 10.1136/esmoopen-2017-000200. [DOI] [PMC free article] [PubMed] [Google Scholar]
- 50.Madore J, Vilain RE, Menzies AM, Kakavand H, Wilmott JS, Hyman J, Yearley JH, Kefford RF, Thompson JF, Long GV, Hersey P and Scolyer RA (2015), PD-L1 expression in melanoma shows marked heterogeneity within and between patients: implications for anti-PD-1/PD-L1 clinical trials. Pigment Cell Melanoma Res, 28: 245–253. doi: 10.1111/pcmr.12340. [DOI] [PubMed] [Google Scholar]
- 51.Aguiar PN, Santoro IL, Tadokoro H., et al. The role of PD-L1 expression as a predictive biomarker in advanced non-small-cell lung cancer: a network meta-analysis. Immunotherapy. 2016;8(4):479–88. doi: 10.2217/imt-2015-0002. [DOI] [PubMed] [Google Scholar]
- 52.Aguiar PN Jr, De Mello RA, Hall P, et al. PD-L1 expression as a predictive biomarker in advanced non-small-cell lung cancer: updated survival data. Immunotherapy. 2017. May;9(6):499–506. doi: 10.2217/imt-2016-0150. [DOI] [PubMed] [Google Scholar]
- 53.Kerr Keith M. and Nicolson Marianne C. (2016) Non–Small Cell Lung Cancer, PD-L1, and the Pathologist. Archives of Pathology & Laboratory Medicine: March 2016, Vol. 140, No. 3, pp. 249–254. [DOI] [PubMed] [Google Scholar]
- 54.Borghaei H, Paz-Ares L, Horn L et al. Nivolumab versus Docetaxel in Advanced Nonsquamous Non-SmallCell Lung Cancer. N. Engl. J. Med 2015; 373(17):1627–1639. [DOI] [PMC free article] [PubMed] [Google Scholar]
- 55.Mazzaschi G, Madeddu D, Falco A, Bocchialini G, et al. Low PD-1 Expression in Cytotoxic CD8+ Tumor-Infiltrating Lymphocytes Confers an Immune-Privileged Tissue Microenvironment in NSCLC with a Prognostic and Predictive Value. Clin Cancer Res. 2018. January 15;24(2):407–419. doi: 10.1158/1078-0432.CCR-17-2156. [DOI] [PubMed] [Google Scholar]
- 56.Zhang YL, Li J, Mo HY, et al. Different subsets of tumor infiltrating lymphocytes correlate with NPC progression in different ways. Mol Cancer. 2010;9:4 Published 2010 Jan 10. doi: 10.1186/1476-4598-9-4. [DOI] [PMC free article] [PubMed] [Google Scholar]
- 57.Berghoff AS, Fuchs E, Ricken G, et al. Density of tumor-infiltrating lymphocytes correlates with extent of brain edema and overall survival time in patients with brain metastases. Oncoimmunology. 2015;5(1): e1057388 Published 2015 Jun 9. [DOI] [PMC free article] [PubMed] [Google Scholar]
- 58.Goc Jérémy, Germain Claire, et al. Dendritic Cells in Tumor-Associated Tertiary Lymphoid Structures Signal a Th1 Cytotoxic Immune Contexture and License the Positive Prognostic Value of Infiltrating CD8+ T Cells. Cancer Res. 2014. February 1;74(3):705–15. [DOI] [PubMed] [Google Scholar]
- 59.33rd Annual Meeting & Pre-Conference Programs of the Society for Immunotherapy of Cancer (SITC 2018). J Immunother Cancer. 2018; 6(Suppl 1): 114. [DOI] [PMC free article] [PubMed] [Google Scholar]
- 60.Parra ER, et al. , Image Analysis-based Assessment of PD-L1 and Tumor-Associated Immune Cells Density Supports Distinct Intratumoral Microenvironment Groups in Non-small Cell Lung Carcinoma Patients. Clin Cancer Res, 2016. 22(24): p. 6278–6289. [DOI] [PMC free article] [PubMed] [Google Scholar]
- 61.Reynders K, De Ruysscher D. Tumor infiltrating lymphocytes in lung cancer: a new prognostic parameter. Journal of Thoracic Disease. 2016;8(8):E833–E835. doi: 10.21037/jtd.2016.07.75. [DOI] [PMC free article] [PubMed] [Google Scholar]
- 62.Zeng D-Q, Yu Y-F, Ou Q-Y, et al. Prognostic and predictive value of tumor-infiltrating lymphocytes for clinical therapeutic research in patients with non-small cell lung cancer. Oncotarget. 2016;7(12):13765–13781. doi: 10.18632/oncotarget.7282. [DOI] [PMC free article] [PubMed] [Google Scholar]
- 63.Tunali Ilke, Gray Jhanelle, et al. P1.01–041 Quantitative Imaging Features Predict Response of Immunotherapy in Non-Small Cell Lung Cancer Patients 10.1016/j.jtho.2016.11.565. [DOI] [Google Scholar]
- 64.Tang C, Brian Hobbs, et al. Development of an Immune-Pathology Informed Radiomics Model for Non-Small Cell Lung Cancer, Scientific Reportsvolume 8, Article number: 1922 (2018). doi: 10.1038/s41598-018-20471-5. [DOI] [PMC free article] [PubMed] [Google Scholar]
- 65.Saeed-Vafa D, Bravo R, Dean JA, et al. Combining radiomics and mathematical modeling to elucidate mechanisms of resistance to immune checkpoint blockade in non-small cell lung cancer. 10.1101/190561. [DOI] [Google Scholar]
- 66.Sun R, Limkin EJ, Vakalopoulou M, et al. A radiomics approach to assess tumour-infiltrating CD8 cells and response to anti-PD-1 or anti-PD-L1 immunotherapy: an imaging biomarker, retrospective multicohort study. The Lancet. Oncology (2018): 1180–1191. 10.1016/S1470-2045(18)30413-3. [DOI] [PubMed] [Google Scholar]
- 67.Madabhushi A, Khorrami M, Velcheti V Predicting disease recurrence following trimodality therapy in non-small cell lung cancer using computed tomography derived radiomic features and clinico-patholigic features. US Patent App. 16/236,675, 2019.
- 68.Khorrami M, Alilou M, Prasanna P, et al. A combination of intra- and peritumoral features on baseline CT scans is associated with overall survival in non-small cell lung cancer patients treated with immune checkpoint inhibitors: a multi-agent multi-site study. 10.1117/12.2513001. [DOI] [Google Scholar]
- 69.Nishino M, Dahlberg SE, Adeni AE, et al. Tumor Response Dynamics of Advanced Non–small cell Lung Cancer Patients Treated with PD-1 Inhibitors: Imaging Markers for Treatment Outcome. Clin Cancer Res. 2017. doi: 10.1158/1078-0432.CCR-17-1434. [DOI] [PMC free article] [PubMed] [Google Scholar]
- 70.Nishino M, Ramaiya NH, Chambers ES, et al. Immune-related response assessment during PD-1 inhibitor therapy in advanced non-small-cell lung cancer patients. Journal for ImmunoTherapy of Cancer 20164:84. [DOI] [PMC free article] [PubMed] [Google Scholar]
Associated Data
This section collects any data citations, data availability statements, or supplementary materials included in this article.