Abstract
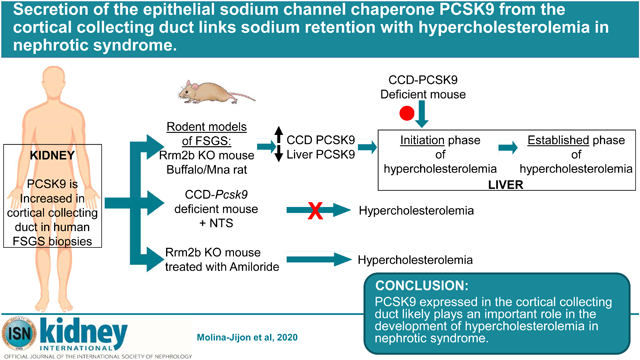
The proprotein PCSK9 functions as a chaperone for the epithelial sodium channel in the cortical collecting duct (CCD), is highly expressed in the liver, and plays a significant role in the pathogenesis of hypercholesterolemia. Lower levels of PCSK9 expression also occur in the normal kidney and intestine. Here, we found increased PCSK9 expression in the CCD of biopsies of patients with primary glomerular disease and explored a possible relationship with hypercholesterolemia of nephrotic syndrome. Significantly elevated serum PCSK9 and cholesterol levels were noted in two models of focal and segmental glomerulosclerosis, the Rrm2b−/− mouse and the Buffalo/Mna rat. Increased expression of PCSK9 in the kidney occurred when liver expression was reduced in both models. The impact of reduced or increased PCSK9 in the CCD on hypercholesterolemia in nephrotic syndrome was next studied. Mice with selective deficiency of PCSK9 expression in the collecting duct failed to develop hypercholesterolemia after injection of nephrotoxic serum. Blocking epithelial sodium channel activity with Amiloride in Rrm2b−/− mice resulted in increased expression of its chaperone PCSK9 in the CCD, followed by elevated plasma levels and worsening hypercholesterolemia. Thus, our data suggest that PCSK9 in the kidney plays a role in the initiation of hypercholesterolemia in nephrotic syndrome and make a case for depletion of PCSK9 early in patients with nephrotic syndrome to prevent the development of hypercholesterolemia.
Keywords: PCSK9, cortical collecting duct, nephrotic syndrome, hypercholesterolemia
Graphical Abstract
INTRODUCTION
Patients with primary glomerular diseases often present with nephrotic syndrome, a phenomenon characterized by heavy proteinuria, hypoalbuminemia, edema, and hyperlipidemia (hypertriglyceridemia and hypercholesterolemia)1. In nephrotic syndrome, hypertriglyceridemia was shown to be linked with proteinuria via albumin-bound free fatty acids and Angiopoietin-like 42. Studies on the mechanism of hypercholesterolemia have largely focused on the liver during the established nephrotic syndrome, and early changes preceding these molecular events have not been explored.
For several decades, the main drug used to lower Low Density Lipoprotein-cholesterol (LDL-c) have been 3-hydroxy-3-methyl-glutaryl-CoA reductase (HMG-CoA reductase) inhibitors. Another drug, ezetimibe, lowers LDL-c by blocking cholesterol absorption from the gut. In 2015, FDA approved injectable monoclonal antibodies against Proprotein convertase subtilisin/kexin 9 (PCSK9) to be used in patients with familial hypercholesterolemia, who are intolerant to statins, and in patients whose LDL-c is poorly controlled by drugs.
PCSK9 belongs to the proprotein convertases that generate active peptide/proteins by cleaving their original inactive precursors3,4. PCSK9 is highly expressed in the adult liver, and to a lesser extent in the small intestine, kidney, and adult cerebellum5. PCSK9 is synthetized in the endoplasmic reticulum as a ~ 74 kDa precursor (proPCSK9). It undergoes an autocatalytic cleavage of its inhibitory prodomain in the endoplasmic reticulum, resulting in a 14 kDa prosegment and a mature 63 kDa protein5,6, that is proteolytically inactive7. These two subunits are tightly associated to form a heterodimer that is secreted out of the endoplasmic reticulum, traffics though the Golgi apparatus and is secreted within minutes8,6. Some activated PCSK9 is processed at the N-terminal of the active protein by the enzyme furin. This action cleaves a 7 kDa peptide leaving a 53 kDa inactive PCSK99,10. Recent mass spectrometry evidence revealed that up to 40% of circulating PCSK9 is furin-inactivated11. PCSK9 regulates cholesterol homeostasis by enabling low density lipoprotein receptor (LDLR) degradation in lysosome, that increases circulating LDL-c levels, resulting in hypercholesterolemia12,5,13–16. The active form of PCSK9, and to a lesser extent its inactive form, can bind the LDLR. Patients with chronic kidney disease exhibit higher liver expression and circulating levels of PCSK917.
PCSK9 has been extensively studied in the liver, but the function of endogenous kidney PCSK9 in the setting of kidney disease is still unknown. We studied expression and localization of PCSK9 in the kidney in two animal models of severe focal and segmental glomerulosclerosis (FSGS)-related nephrotic syndrome, the Rrm2b knockout mouse (Rrm2b−/−)18 and Buffalo/Mna rats2. This paper describes the role of kidney PCSK9 in initiating hypercholesterolemia in nephrotic syndrome in rodents.
RESULTS
Expression of PCSK9 in human cortical collecting duct (CCD)
We used confocal imaging to assess for expression of PCSK9 protein in human kidney disease biopsies, using normal adult age and sex matched pre-implantation biopsies as control (Supplementary Figure 1). In control pre-implantation biopsies, we showed co-localization of PCSK9 with Aquaporin-2 (AQP2), a marker of renal CCD (Figure 1a). In FSGS patients, we showed significant increased expression of PCSK9 in CCD compared to control kidney biopsy (Figure 1b,c).
Figure 1: Increased PCSK9 expression in the kidney cortical collecting duct of FSGS patients.
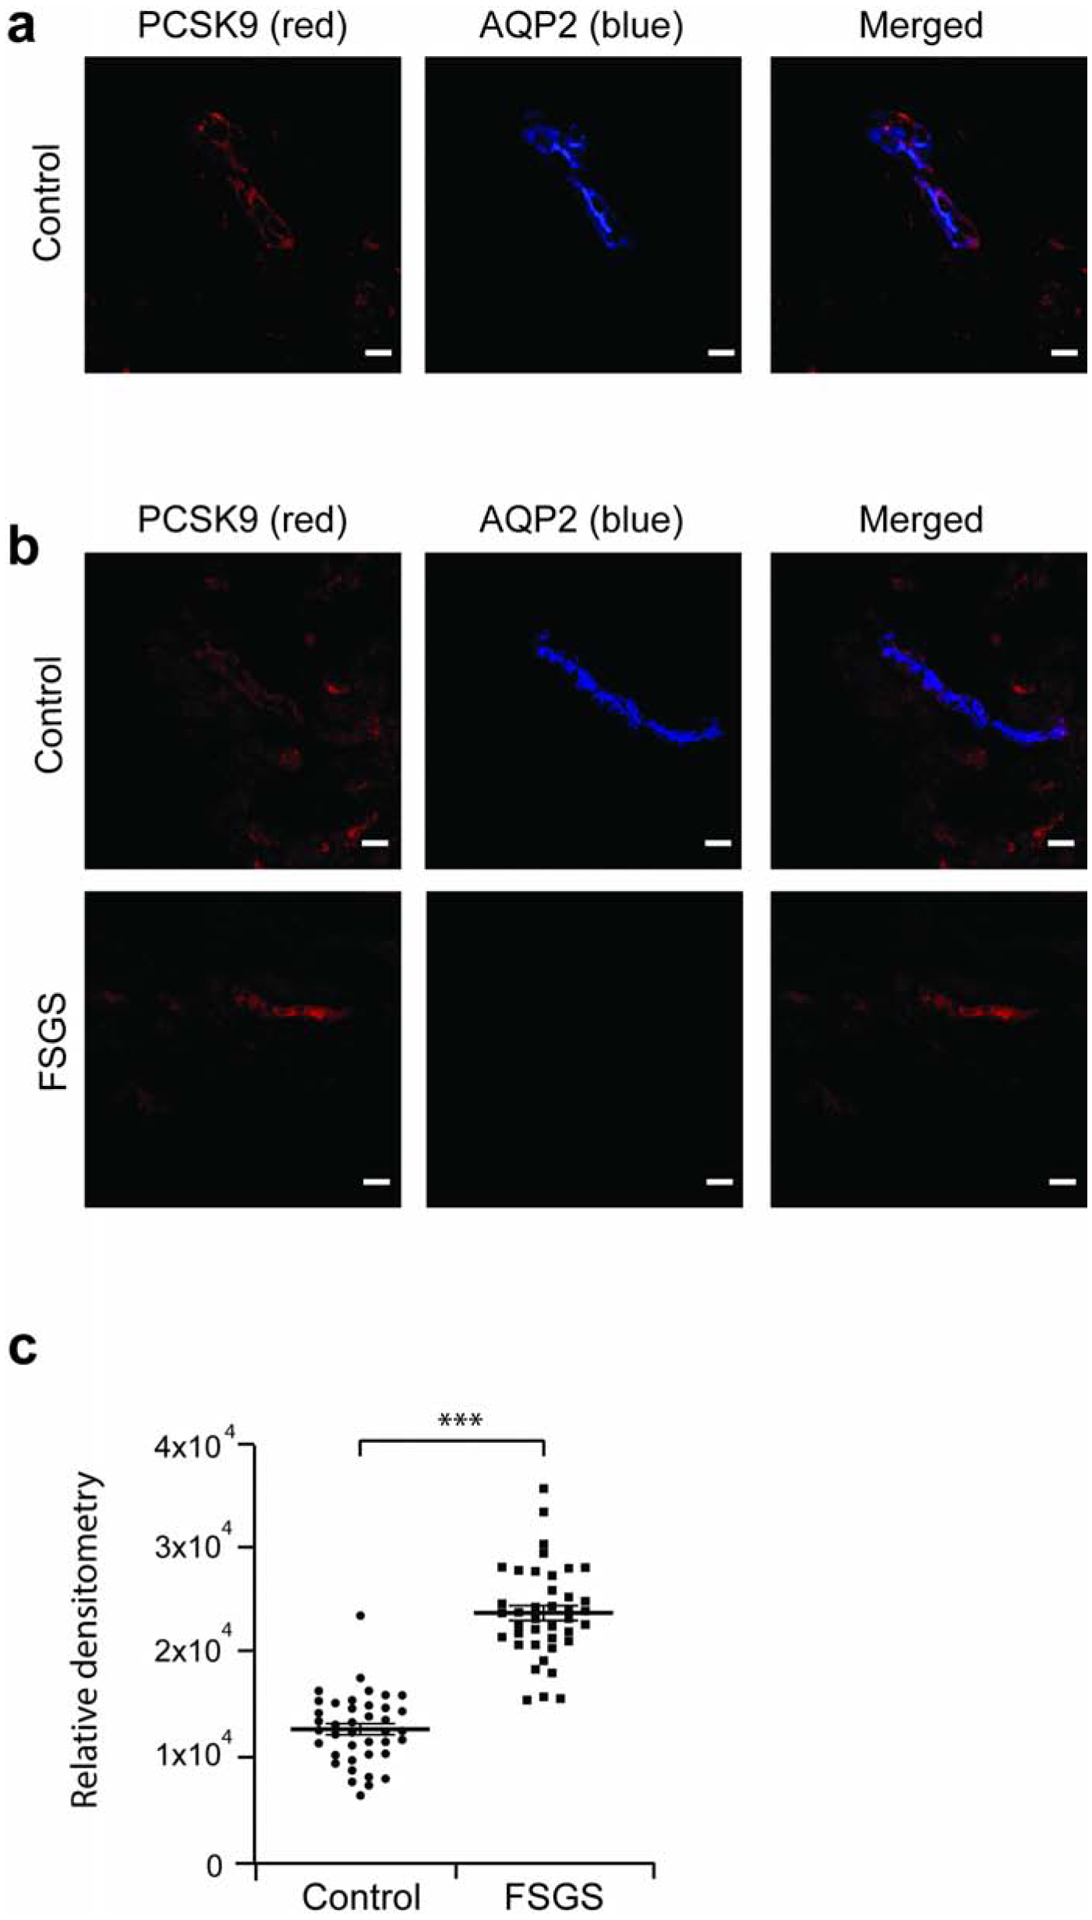
FSGS patient and control pre-implantation kidney biopsies were assessed for PCSK9 expression. (a) Co-localization of PCSK9 (red) with Aquoporin-2 (blue), marker of the collecting duct, in a control biopsy by confocal imaging. (b) PCSK9 expression is increased in FSGS patients compared to controls. (c) Relative densitometry chart of PCSK9 expression in FSGS and control pre-implantation kidney biopsy specimens in panel b. Scale bar, 20 μm. *** P<0.001.
Localization of PCSK9 in mouse and rat kidney by confocal imaging
We noted co-localization of PCSK9 with the CCD marker Aquaporin-2 in Rrm2b+/+ mouse (Figure 2a) and Buffalo/Mna rat kidney (Figure 3a). PCSK9 did not co-localize with the proximal tubule marker Aquaporin-1 (data not shown). Level of PCSK9 expression was relatively unchanged between age 5 and 11 weeks in Rrm2b+/+ mouse (data not shown).
Figure 2: PCSK9 expression is increased in kidney cortical collecting duct in Rrm2b knockout mouse.
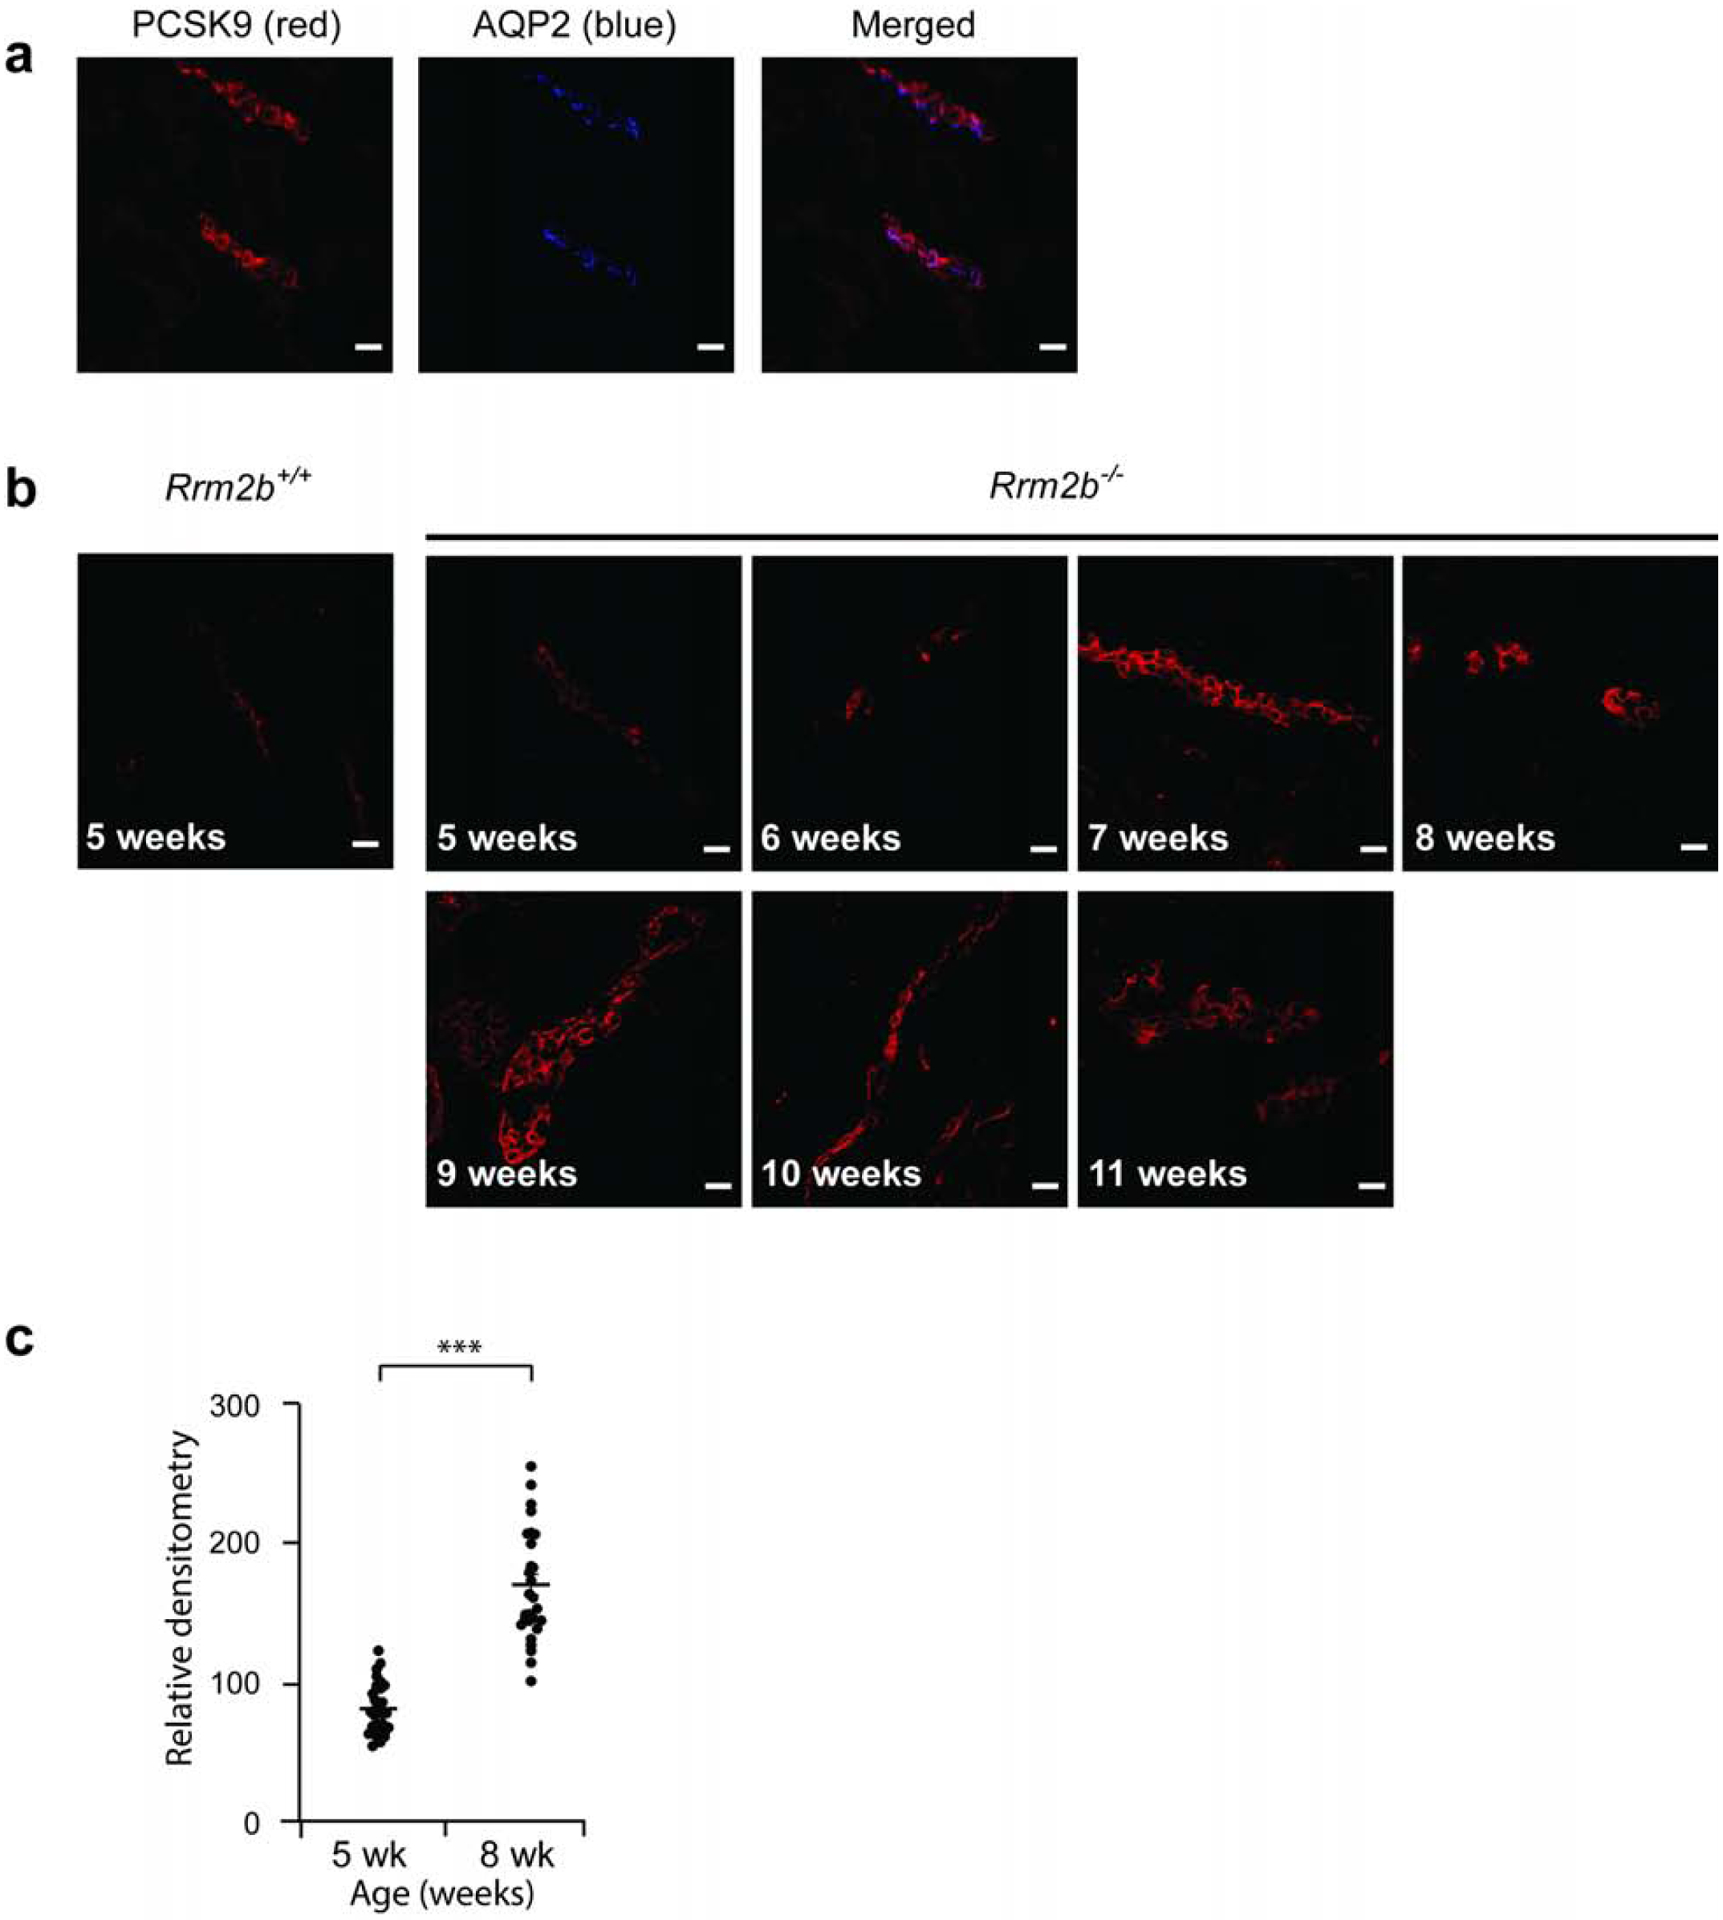
Control (Rrm2b+/+, n = 5 mice) and Rrm2b knockout (Rrm2b−/−, n = 5 mice) mice were assessed weekly, between age 5 and 11 weeks by confocal imaging. (a) In 5 week-old Rrm2b+/+ mice, PCSK9 (red) co-localize with Aquoporin-2 (blue), marker of the collecting duct, indicating expression of PCSK9 in the collecting duct. (b) Representative PCSK9 protein expression in Rrm2b+/+ and Rrm2b−/− mice from age 5 to 11 weeks. (c) Densitometry of PCSK9 from confocal images in b. Scale bar, 20 μm. *** P<0.001
Figure 3: PCSK9 expression is increased in kidney cortical collecting duct in Buffalo/Mna rats.
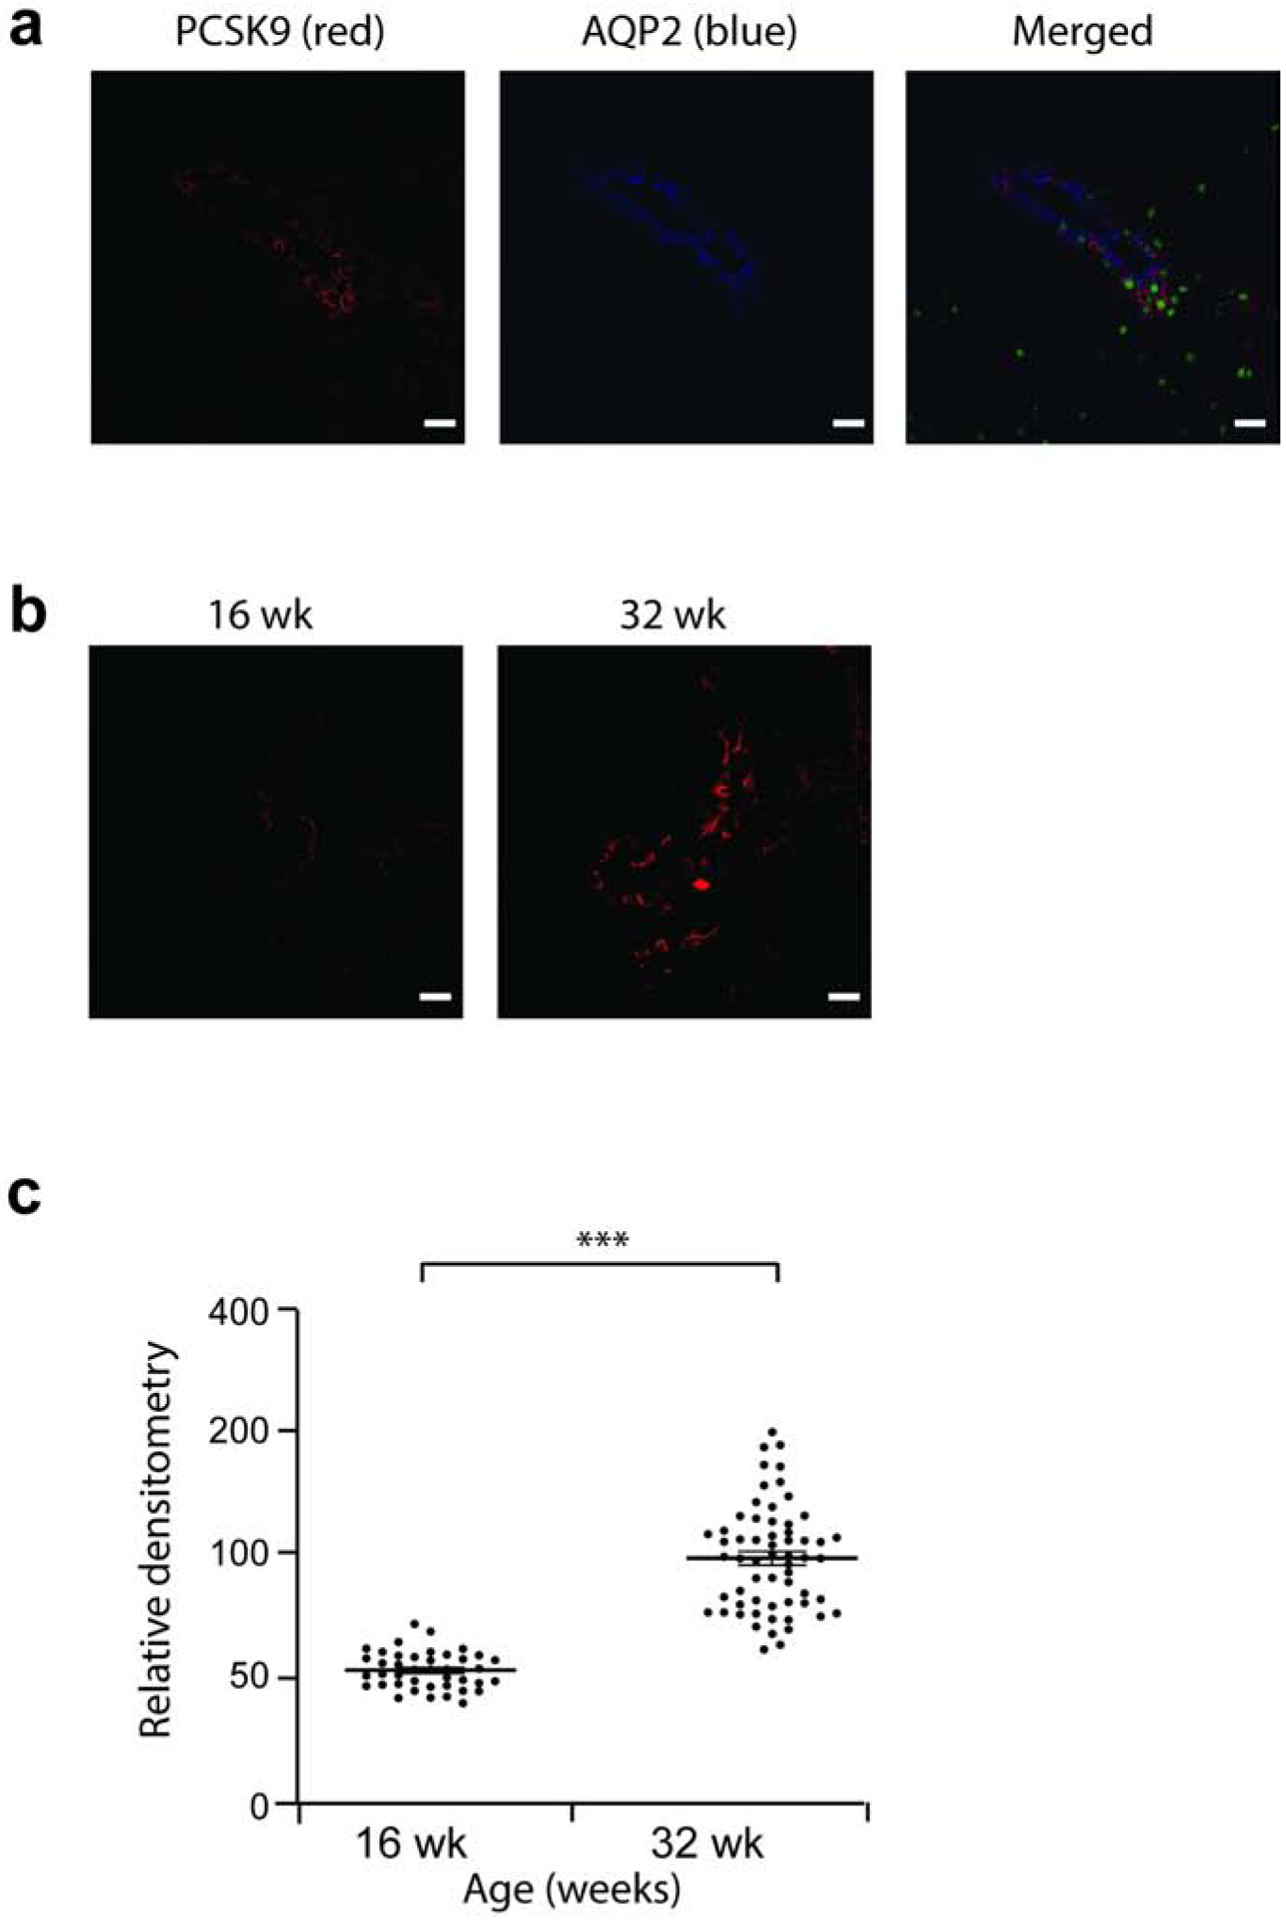
Buffalo/Mna males rats (n = 3) were assessed at age 16 and 32 weeks, by confocal imaging. (a) In 16 week-old Buffalo/Mna rat, PCSK9 (red) co-localize with Aquoporin-2 (blue), marker of the collecting duct, indicating expression of PCSK9 in the collecting duct. (b) Representative PCSK9 protein expression in Buffalo/Mna rats at age 16 and 32 weeks. (c) Densitometry of PCSK9 from confocal images in b. Scale bar, 20 μm. *** P<0.001
Increase PCSK9 expression in rodent models of FSGS and nephrotic syndrome.
Rrm2b−/− mice18 appeared normal at weaning and developed albuminuria from age 7 weeks onwards (Figure 4a, Supplementary Figure 2a), with a peak albuminuria of about 780 fold increase at age 10 weeks compared to age 7 weeks, and they develop hypercholesterolemia from age 8 weeks (Figure 4b). Serum PCSK9 levels increase in Rrm2b−/− mice from age 8 weeks but stay stable in Rrmb2+/+ mice (Figure 4c, Supplementary Figure 2b). Light microscopy study shows development of capillary loop collapse from age 10 weeks in Rrm2b−/− mice (Figure 4d).
Figure 4: Biological characteristics of the male Rrm2b knockout mouse model.
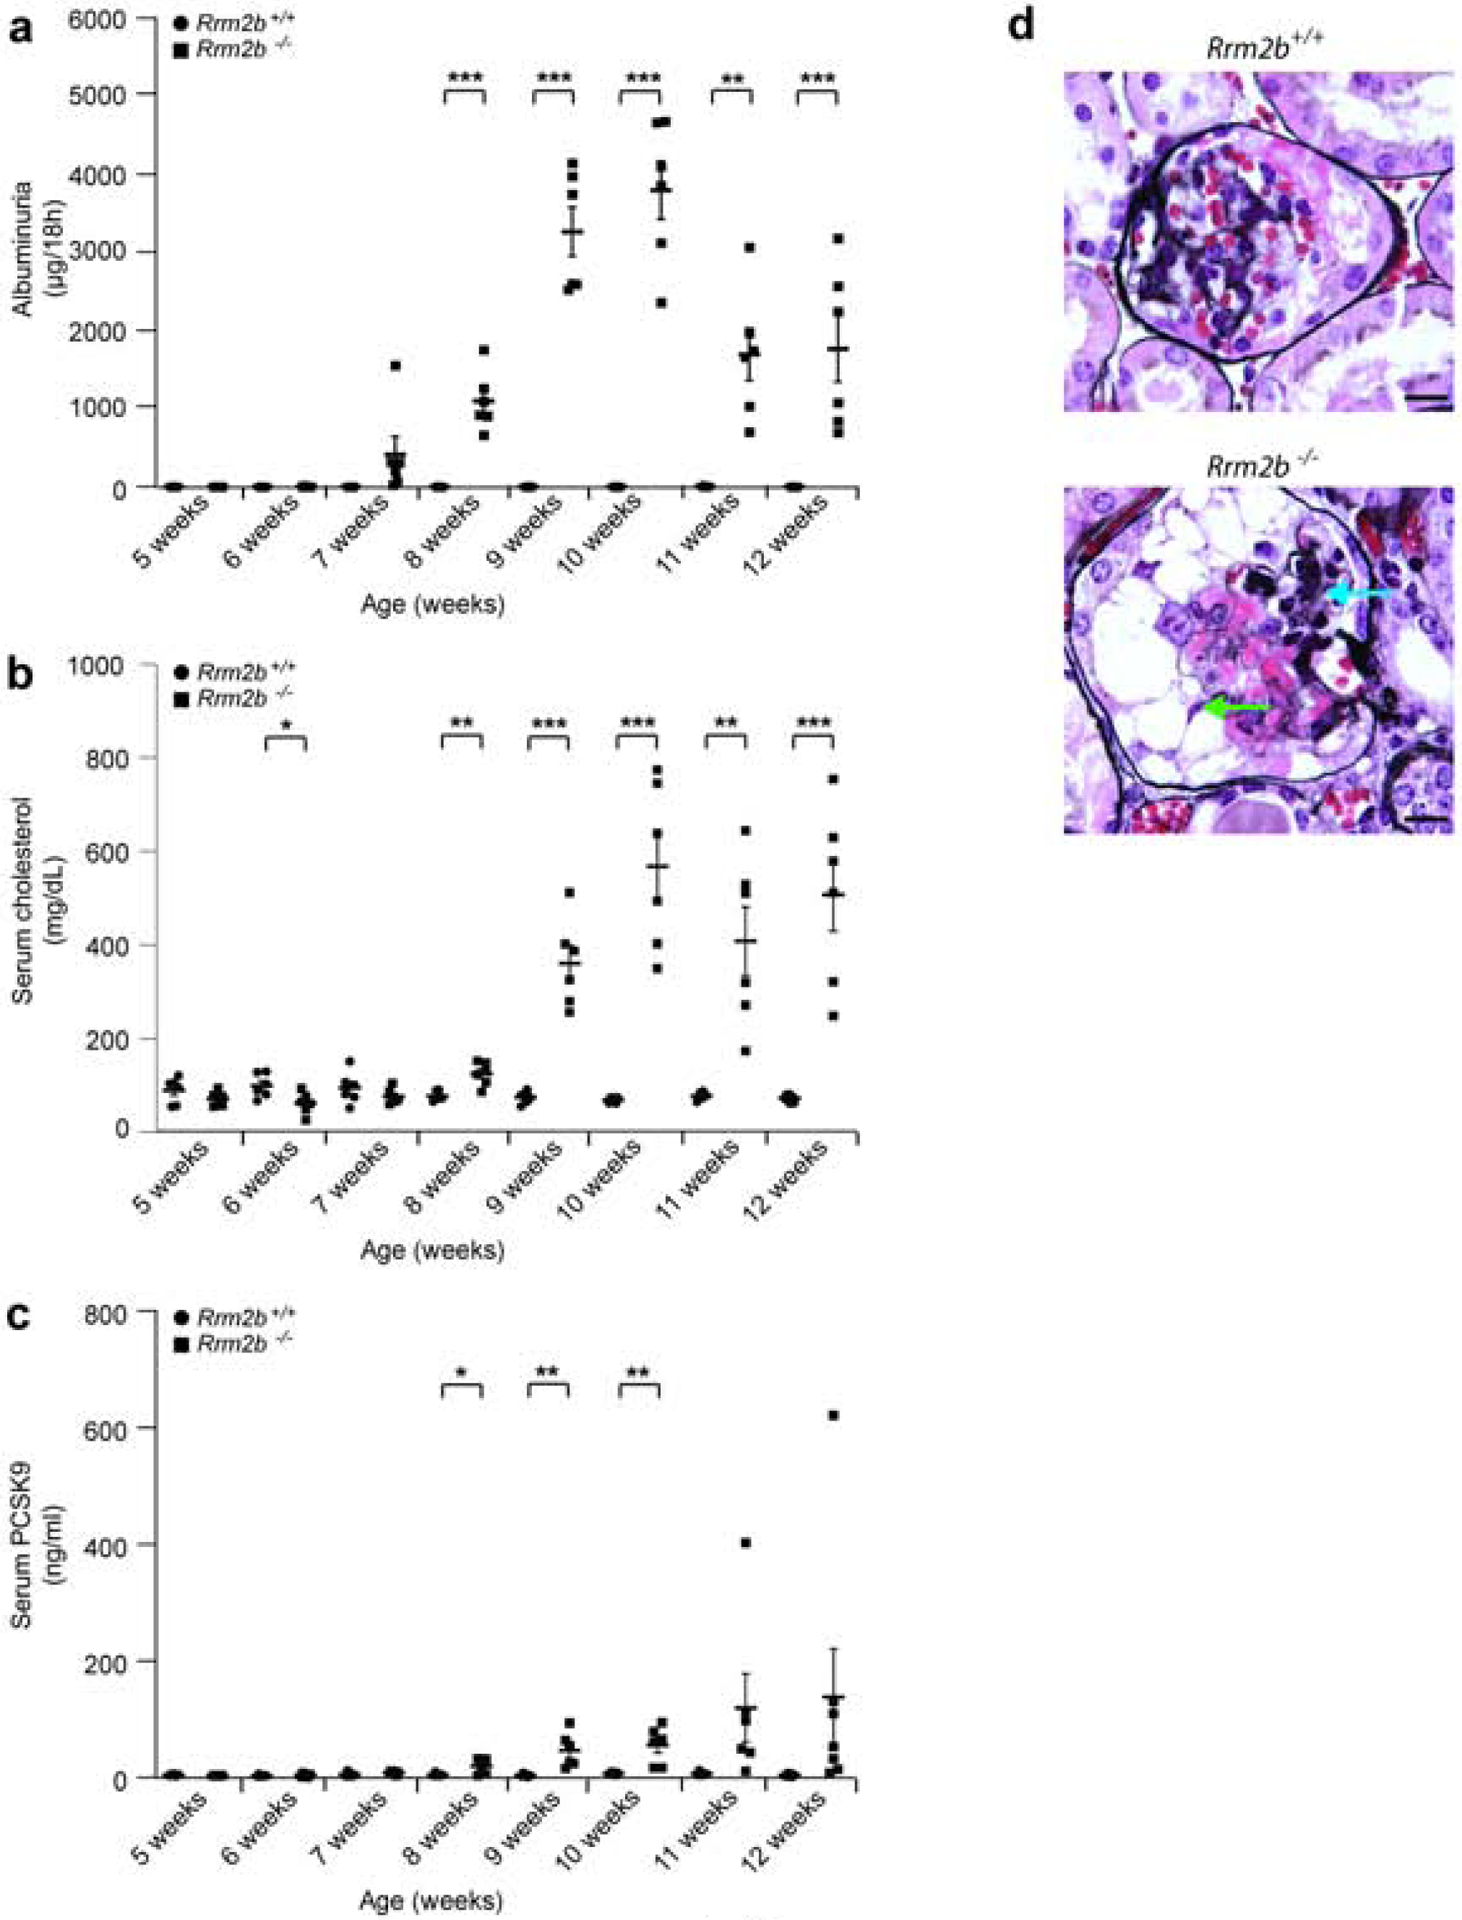
Control (Rrm2b+/+, n = 6 mice) and Rrm2b knockout (Rrm2b−/−, n = 6 mice) male mice were assessed weekly between age 5 and 12 weeks. (a) ELISA for albuminuria in Rrm2b+/+ and Rrm2b−/− mice. (b) Serum total cholesterol levels in Rrm2b+/+ and Rrm2b−/− mice. (c) ELISA for serum PCSK9 levels in Rrm2b+/+ and Rrm2b−/− mice. (d) Ten week-old Rrm2b+/+ (upper image) and Rrm2b−/− (lower image) mice silver stained kidney sections showing capillary loop collapse (blue arrows) and some proliferating vacuolated epithelial cells (green arrows) in Rrm2b−/− mice. Scale bars = 10 μm. * P<0.05; ** P<0.01; *** P<0.001; comparison between same age Rrm2b+/+ and Rrm2b−/− mice.
At age five weeks, Rrm2b+/+ and Rrm2b−/− mice show similar expression of PCSK9 by confocal imaging (Figure2b,c). Rrm2b−/− mice had increased expression of PCSK9 from age 6–7 weeks (Figure 2b,c, Supplementary Figure 3). The expression is still increased at age 11 weeks in these mice. These mice die of nephrotic syndrome and kidney failure between age 12 to 13 weeks.
In Buffalo/Mna rats, a model of FSGS and nephrotic syndrome19,20, mild proteinuria is noted as early as 8 weeks of age, and heavy proteinuria (Figure 5a) and sclerotic glomeruli from age 28 weeks onwards (Supplementary Figure 4). These rats develop hypoalbuminemia (Figure 5b), hypercholesterolemia (Figure 5c) and high levels of serum PCSK9 (Figure 5d) after the age 24 weeks.At age 32 weeks, after development of hypercholesterolemia, Buffalo/Mna rats show increased expression of PCSK9 by confocal imaging compared to 16 weeks of age when cholesterol levels are normal (Figure 3b,c).
Figure 5: Biological characteristics of Buffalo/Mna rats.
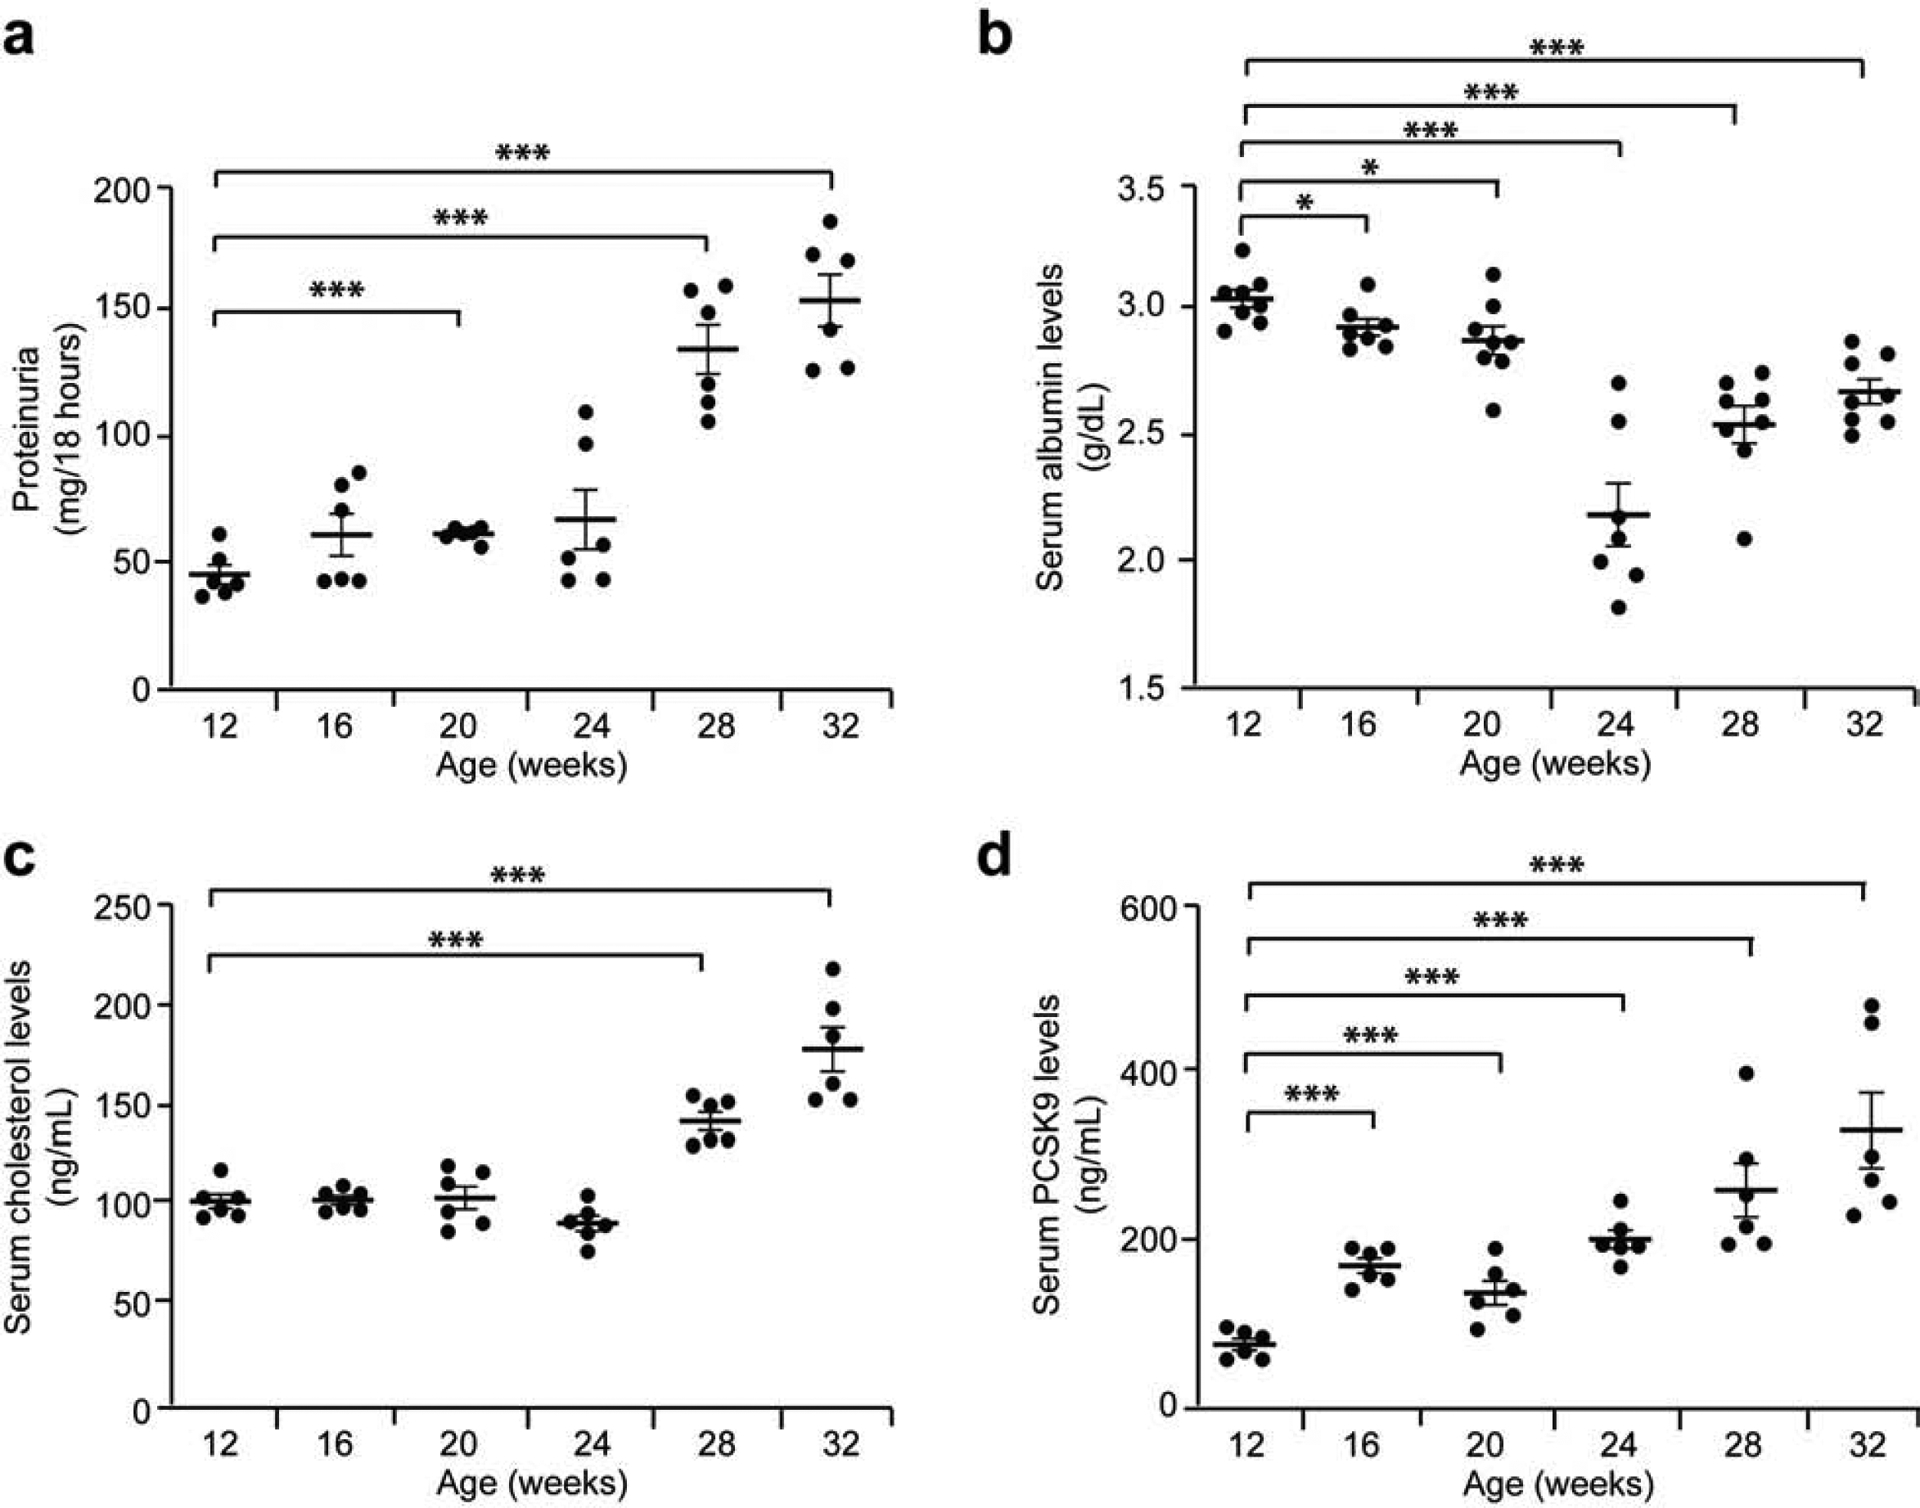
Buffalo/Mna rats (n = 6 per group) were assessed every 4 weeks, between age 12 and 32 weeks. (a) Proteinuria in Buffalo/Mna rats from age 12 weeks to 32 weeks. (b) Serum albumin levels in Buffalo/Mna rats from age 12 weeks to 32 weeks. (c) Serum total cholesterol levels in Buffalo/Mna rats from age 12 weeks to 32 weeks. (d) ELISA for serum PCSK9 levels in Buffalo/Mna rats from age 12 weeks to 32 weeks. * P<0.05; *** P<0.001.
Reciprocal changes in liver and kidney PCSK9 expression in rodent nephrotic syndrome
To determine the source of circulating PCSK9, we studied its expression in kidney cortex and liver from Rrm2b+/+ and Rrm2b−/− mice by Western blot. Expression of PCSK9 in Rrm2b+/+ mice does not change with age in the kidney (Figure 6a, left blot and chart)21,22. In Rrm2b−/− mice, expression of PCSK9 is stable until age 8 weeks, after which it increases (Figure 6b, left blot and chart). In the liver, PCSK9 expression was unchanged with age in Rrm2b+/+ mice (Figure 6a, right blot and chart) but reduced from age 7–8 weeks onwards in Rrm2b−/− mice (Figure 6b, right blot and chart).
Figure 6: Differential expression of PCSK9 in kidney and liver of Rrm2b knockout mice.
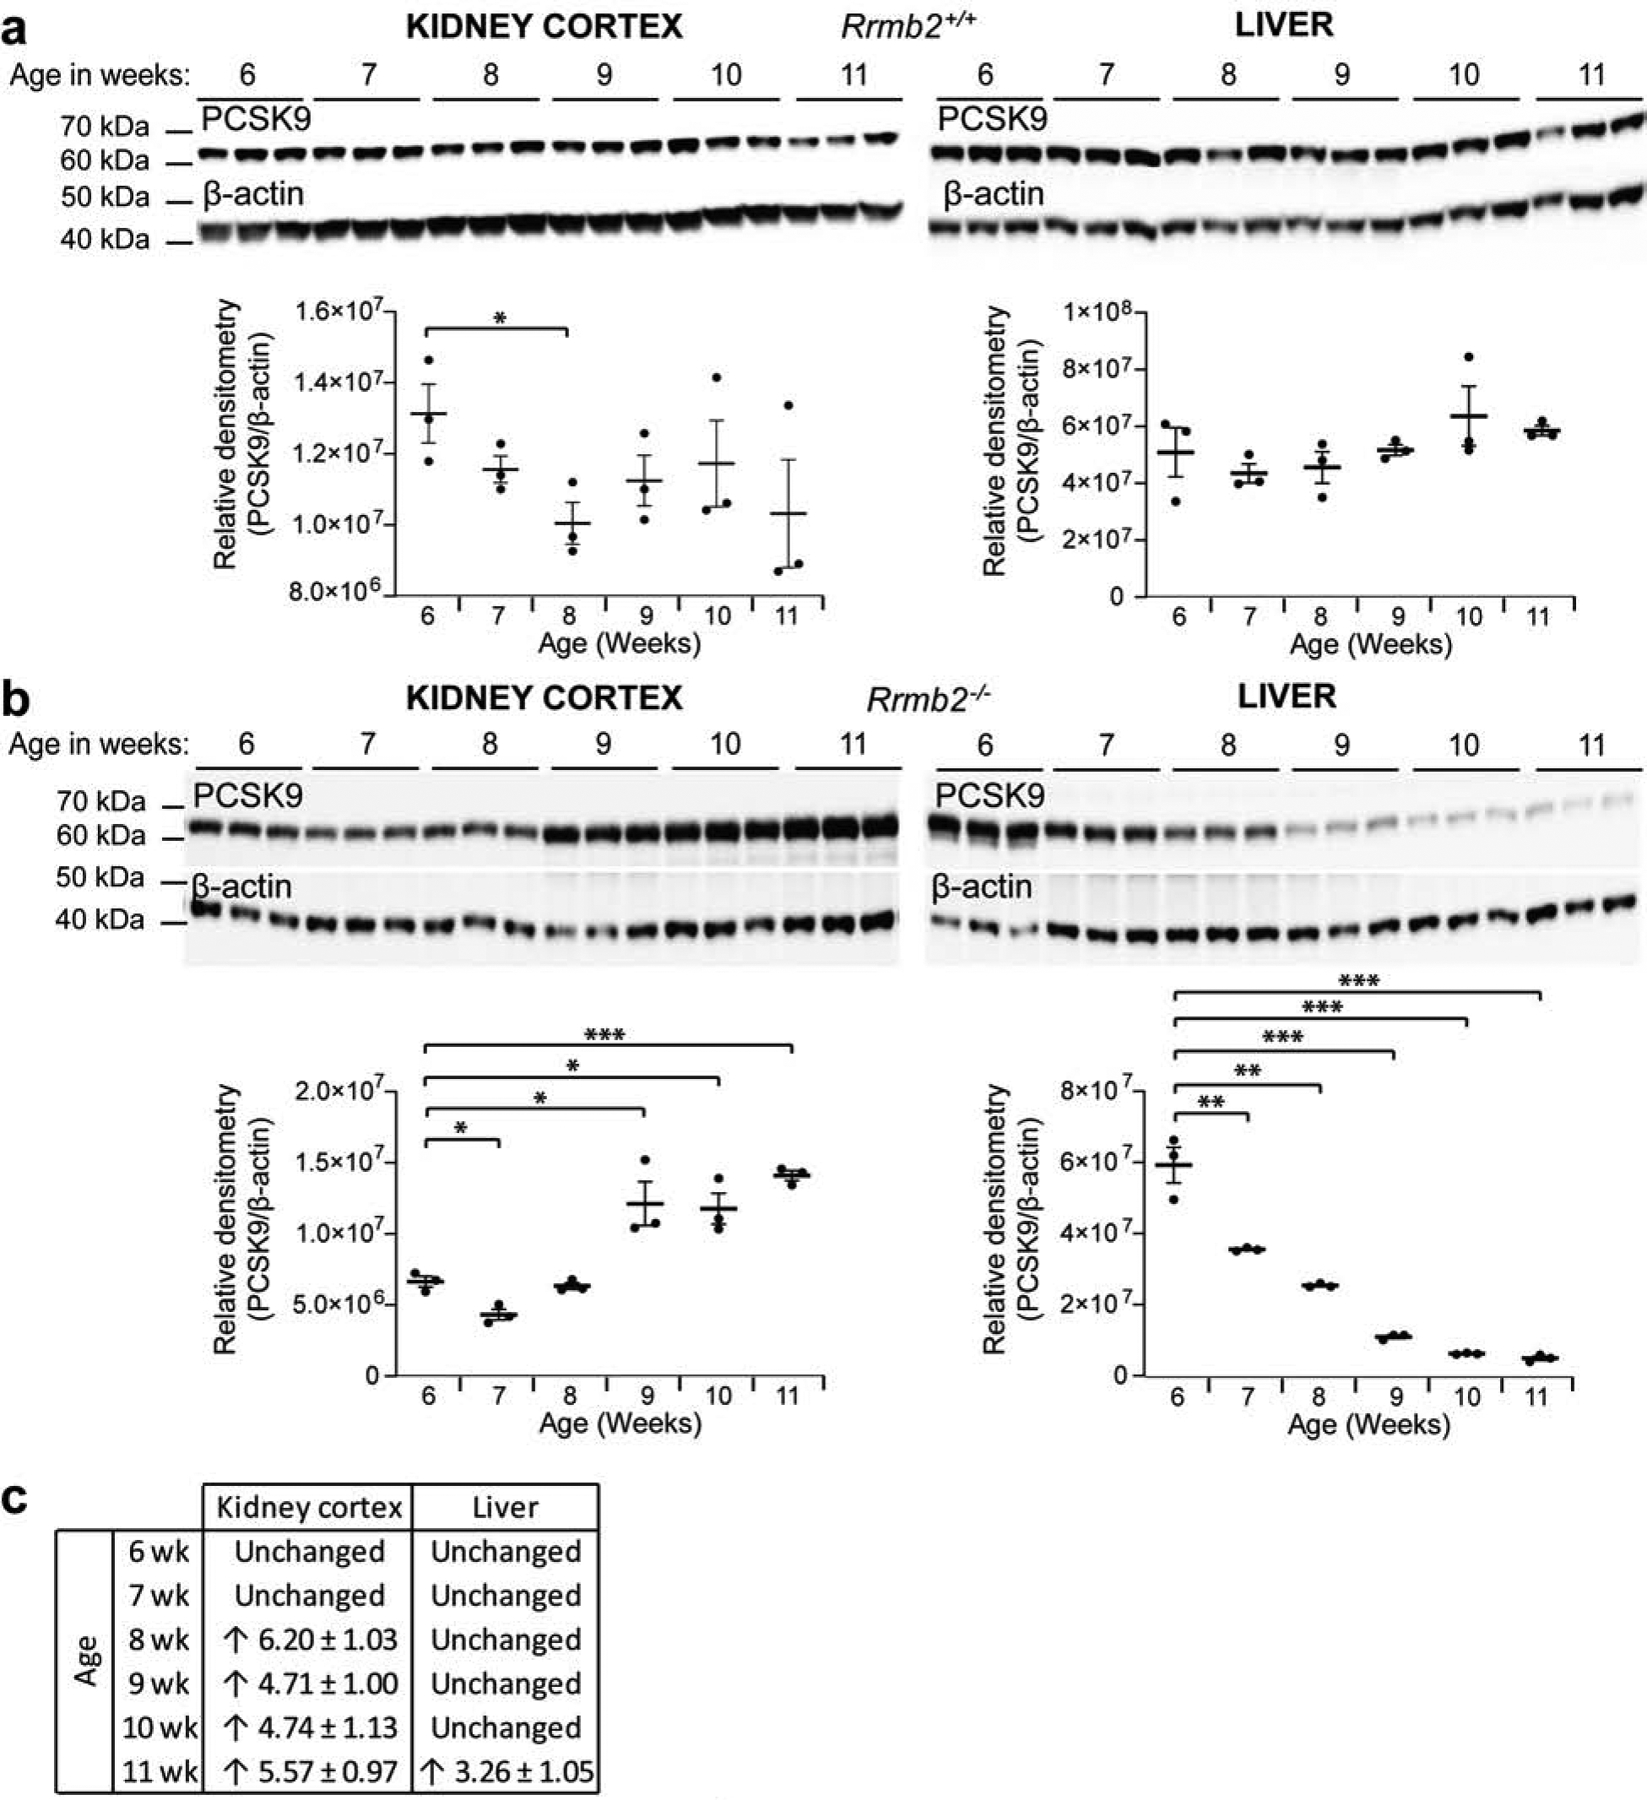
Control (Rrm2b+/+, n = 6 mice) and Rrm2b knockout (Rrm2b−/−, n = 6 mice) male mice were assessed weekly, between age 6 and 11 weeks. (a) Western blot PCSK9 in the kidney cortex (left panel) and liver (right panel), in Rrm2b+/+ mice. Densitometry shown under blots. (b) Western blot PCSK9 in the kidney cortex (left panel) and liver (right panel), in Rrm2b−/− mice. Densitometry shown under blots. (c) Pcsk9 mRNA expression in the kidney cortex and liver in Rrm2b−/− mice vs Rrm2b+/+ mice. Threshold of 3-fold and above was taken as significant21,22. * P<0.05; ** P<0.01; *** P<0.001.
We assessed mRNA expression of PCSK9 in kidney cortex from Rrm2b mice and showed increased mRNA from age 8 weeks onwards (Figure 6c). In liver, mRNA expression of PCSK9 was unchanged until age 11 weeks, when it increased.
In Buffalo/Mna rats, PCSK9 expression was increased in kidney cortex, and reduced in the liver, at age 28 weeks, when rats are hypercholesterolemic, compared to age 20 weeks when rats present normal levels of cholesterol (Figure 7a,b).
Figure 7: Differential expression of PCSK9 in kidney and liver of Buffalo/Mna rats.
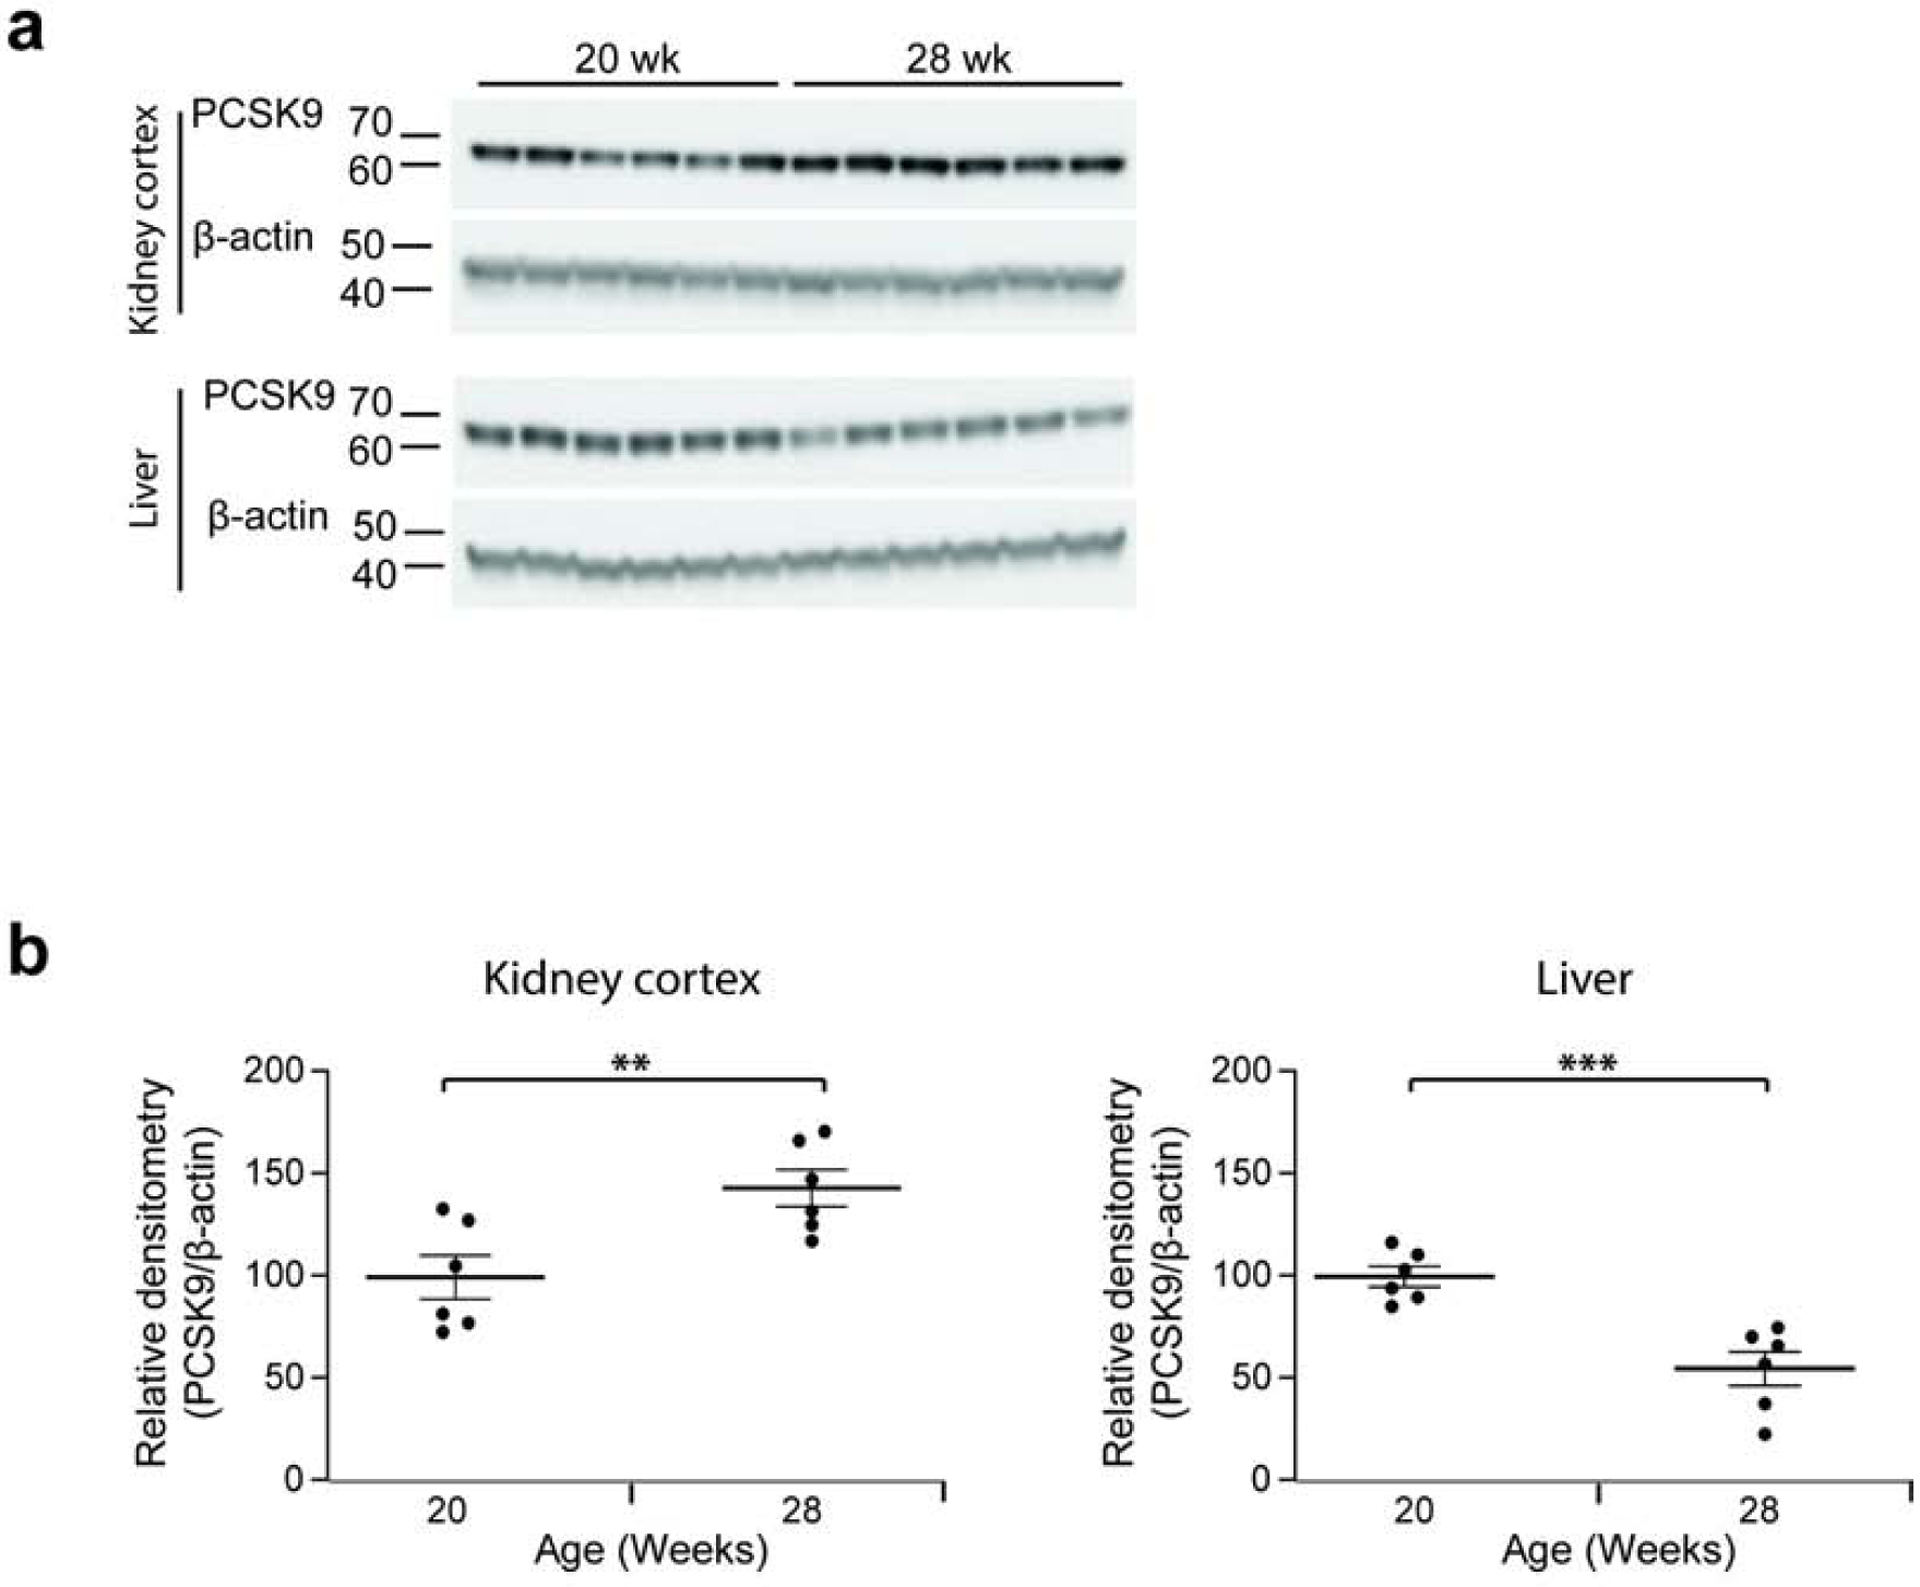
Buffalo/Mna rats (n = 6 per group) were assessed before (age 20 weeks) and after (age 28 weeks) development of hypercholesterolemia. Each band shows tissue from a separate rat. (a) Western blot PCSK9 and β-actin in the kidney cortex (upper blots) and liver (lower blots), in Buffalo/Mna rats at age 20 and 28 weeks. (b) Densitometry of blots shown in a. ** P<0.01; *** P<0.001.
Effect of the CCD-Pcsk9-deficient state on the development of hypercholesterolemia in mice
To study the role of kidney PCSK9 in the initiation of hypercholesterolemia, we generated PCSK9flox/flox;AQP2-Cre mice, designated as CCD-Pcsk9 deficient mice. The expression of PCSK9 in kidney cortex is reduced by almost 34% in CCD-Pcsk9 deficient mice compared to control mice (Figure 8a, upper blot). We confirmed that the depletion occurs specifically in the kidney cortex, as the expression of PCSK9 is not modified in the liver (Figure 8a, lower blot).
Figure 8: Reduced expression of PCSK9 in cortical collecting duct prevents development of nephrotic syndrome-related hypercholesterolemia in mice.
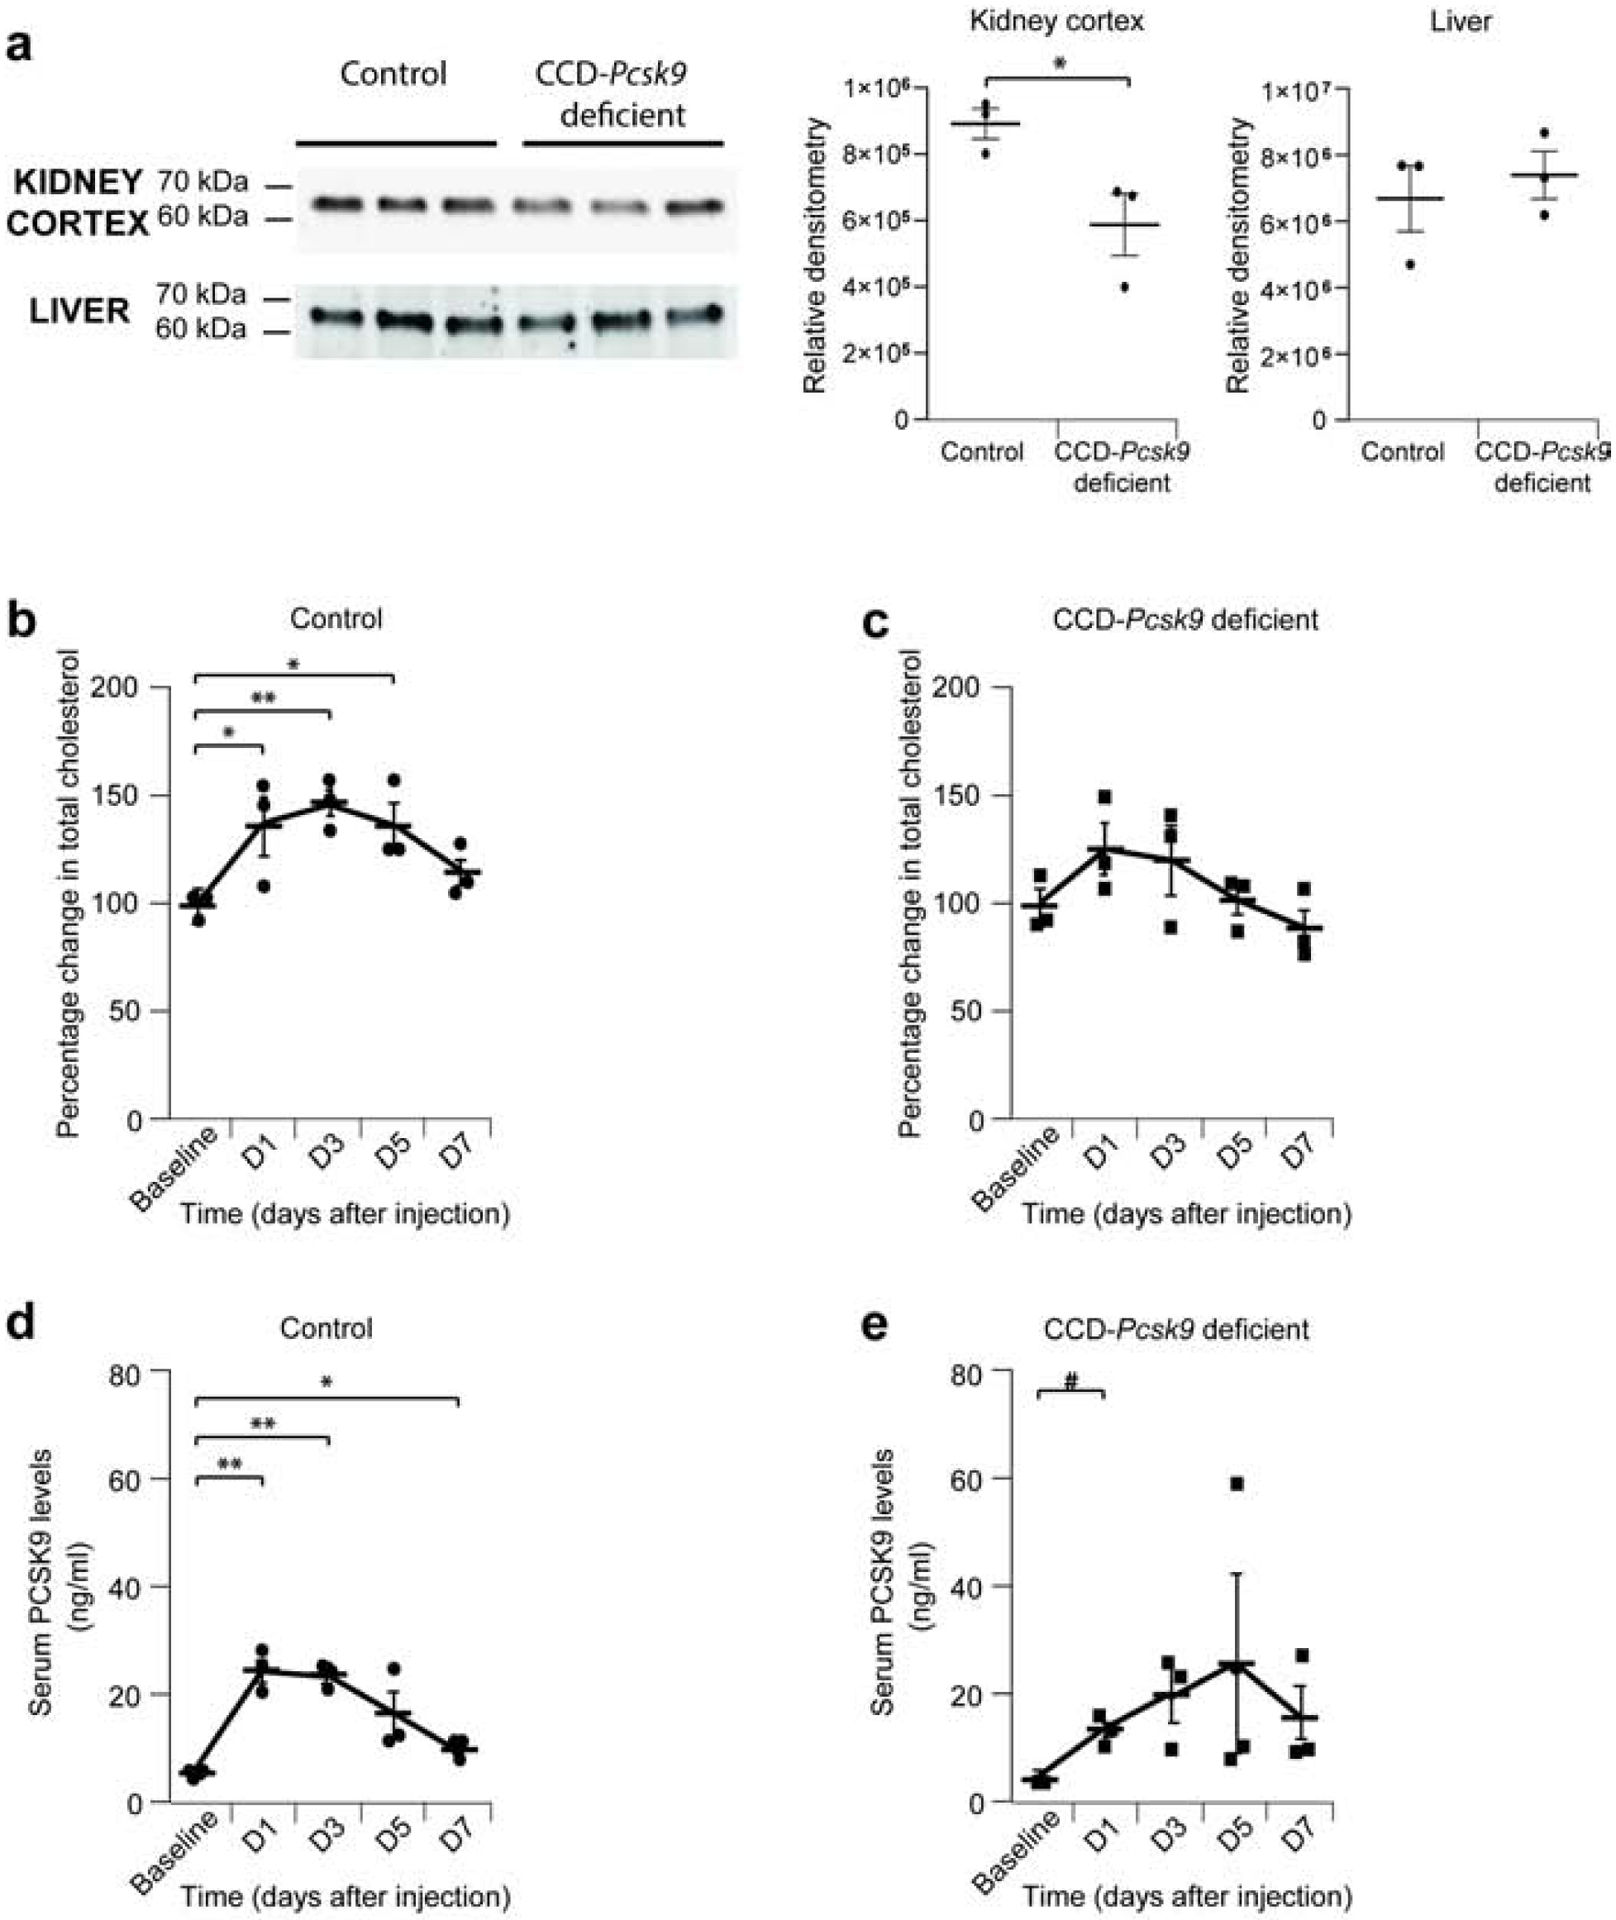
Control (Pcsk9-Lox, n = 3 mice) and CCD-Pcsk9 deficient (n= 3 mice) mice were used. (a) Western blot of kidney cortex and liver from Control or Pcsk9-CCD deficient mice. Densitometry of blots is presented on the right. (b) Percentage change in total cholesterol in Control mice after injection of γ2-NTS. (c) Percentage change in total cholesterol in CCD-Psck9 deficient mice after injection of γ2-NTS. (d) Serum PCSK9 levels in Control mice after injection of γ2-NTS. (e) Serum PCSK9 levels in CCD-Pcsk9 deficient mice after injection of γ2-NTS. * or # P<0.05; ** P<0.01. * compared to baseline Control mice, # compared to baseline CCD-Pcsk9 deficient mice.
Because CCD-Pcsk9 deficient mice do not have baseline albuminuria, we induced nephrotic syndrome in control and CCD-Pcsk9 deficient mice by injecting γ2-nephrotoxic serum (NTS)23. Both groups of mice develop albuminuria (Supplementary Figure 5a), but only control mice develop hypercholesterolemia (Figure 8b,c).
Control and CCD-Pcsk9 deficient mice had similar levels of serum PCSK9 at baseline (Figure 8d,e). After injection of γ2-NTS, the increase of PCSK9 levels was delayed in CCD-Pcsk9 deficient mice (Figure 8e).
CCD-Pcsk9 deficient mice has morphological changes after induction of nephrotic syndrome (Supplementary Figure 5b). Periodic acid-Schiff staining of kidney sections show microvacuolation of tubular cytoplasm, Tamm-Horshall protein was noted in distal tubules along with frequent regenerative changes, and distal mitosis.
Effect of increasing of CCD-PCSK9 expression using Amiloride on hypercholesterolemia
Because PCSK9 is a chaperone protein for the epithelial sodium channel (ENaC) in the collecting duct24, we used Amiloride to block ENaC activity in nephrotic Rrm2b−/− mice in order to stimulate CCD-PCSK9 production to transport more ENaC to the cell surface. Amiloride was administrated to mice in drinking water, and concentration was adjusted according to drunk water in order to deliver a target dose of 2 mg/kg/day (Supplementary Figure 6a). As expected, Amiloride increased urinary Na+ excretion (Supplementary Figure 6b), and induced a 5-fold increase in serum PCSK9 and significantly high cholesterol levels by day 9 (Figures 9a and 9b).
Figure 9: Increased serum levels of PCSK9 and cholesterol in Rrm2b knockout mice treated with Amiloride.
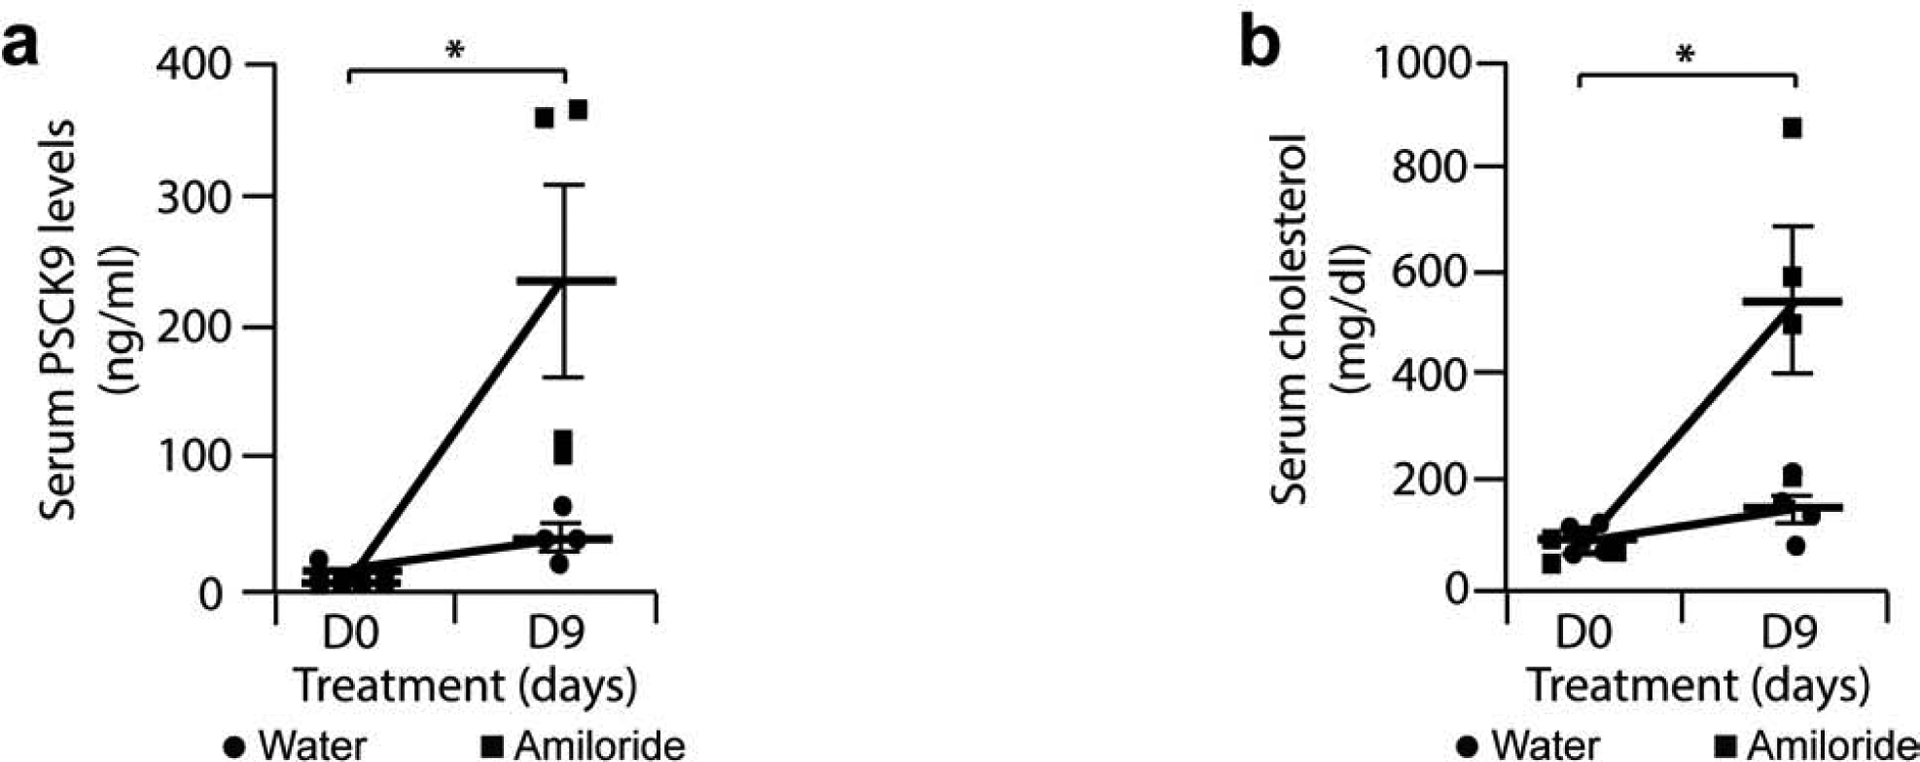
8 week-old female Rrm2b−/− were given tap water (Control, n = 4 mice) or tap water and Amiloride 2 mg/kg/day (Amiloride, n = 4 mice) for 9 days. (a) ELISA for serum PCSK9 in Rrm2b−/− mice treated with Amiloride or with plain tap water. (b) Serum cholesterol levels in Rrm2b−/− mice treated with Amiloride or plain tap water. * P<0.05.
DISCUSSION
Since its discovery in 2003, most of published studies on PCSK9 have been focusing on its expression and regulation in the liver. This led to the approval by the FDA of anti-PCSK9 antibodies for use to treat hypercholesterolemia in selected cases. Studies on expression and role of PCSK9 in other organs are very limited.
This study describes the localization and expression of PCSK9 in human and two rodent FSGS models. In 2016, Haas et al.25 showed that plasma PCSK9 was derived almost exclusively from the liver in a control mouse. They also showed that NTS-induced nephrotic syndrome produced a 3-fold increase in plasma PCSK9 in mice with liver-specific knockout of PCSK9, so PCSK9 originated from another tissue. By in situ hybridization, they showed that PCSK9 was present in a limited subset of tubules. Using confocal microscopy and co-localization with Aquaporin-2, we showed PCSK9 expression to be predominantly in renal collecting duct. Both rodent models of FSGS-related nephrotic syndrome developed increased cholesterol, increased CCD-PCSK9 expression, decreased liver-PCSK9 expression and increased plasma PCSK9 levels as the disease progresses. Liu and Vaziri in 201426 showed that Pcsk9 mRNA levels were increased in liver of rats injected twice with puromycin aminonucleoside to reproduce human FSGS, but they did not study PCSK9 protein expression. Increased circulating PCSK9 is probably due, at least in part, to secretion of the protein from the kidney.
Our hypothesis was that kidney PCSK9 expression increases as nephrotic syndrome develops, and increased circulating PCSK9 could bind LDLR on the liver to initiate hypercholesterolemia (Figure 10)28–38. To verify this hypothesis, we used the Cre-Lox technology to generate mice with a deficiency in PCSK9 expression specifically in CCD. Western blots showed decreased expression of PCSK9 in kidney and no modification of PCSK9 expression in the liver. These mice do not present any significant phenotype. When injected with γ2-NTS to induce nephrotic syndrome, they develop albuminuria as expected but no hypercholesterolemia.
Figure 10: Mechanism of kidney PCSK9 initiation of hypercholesterolemia in nephrotic syndrome.
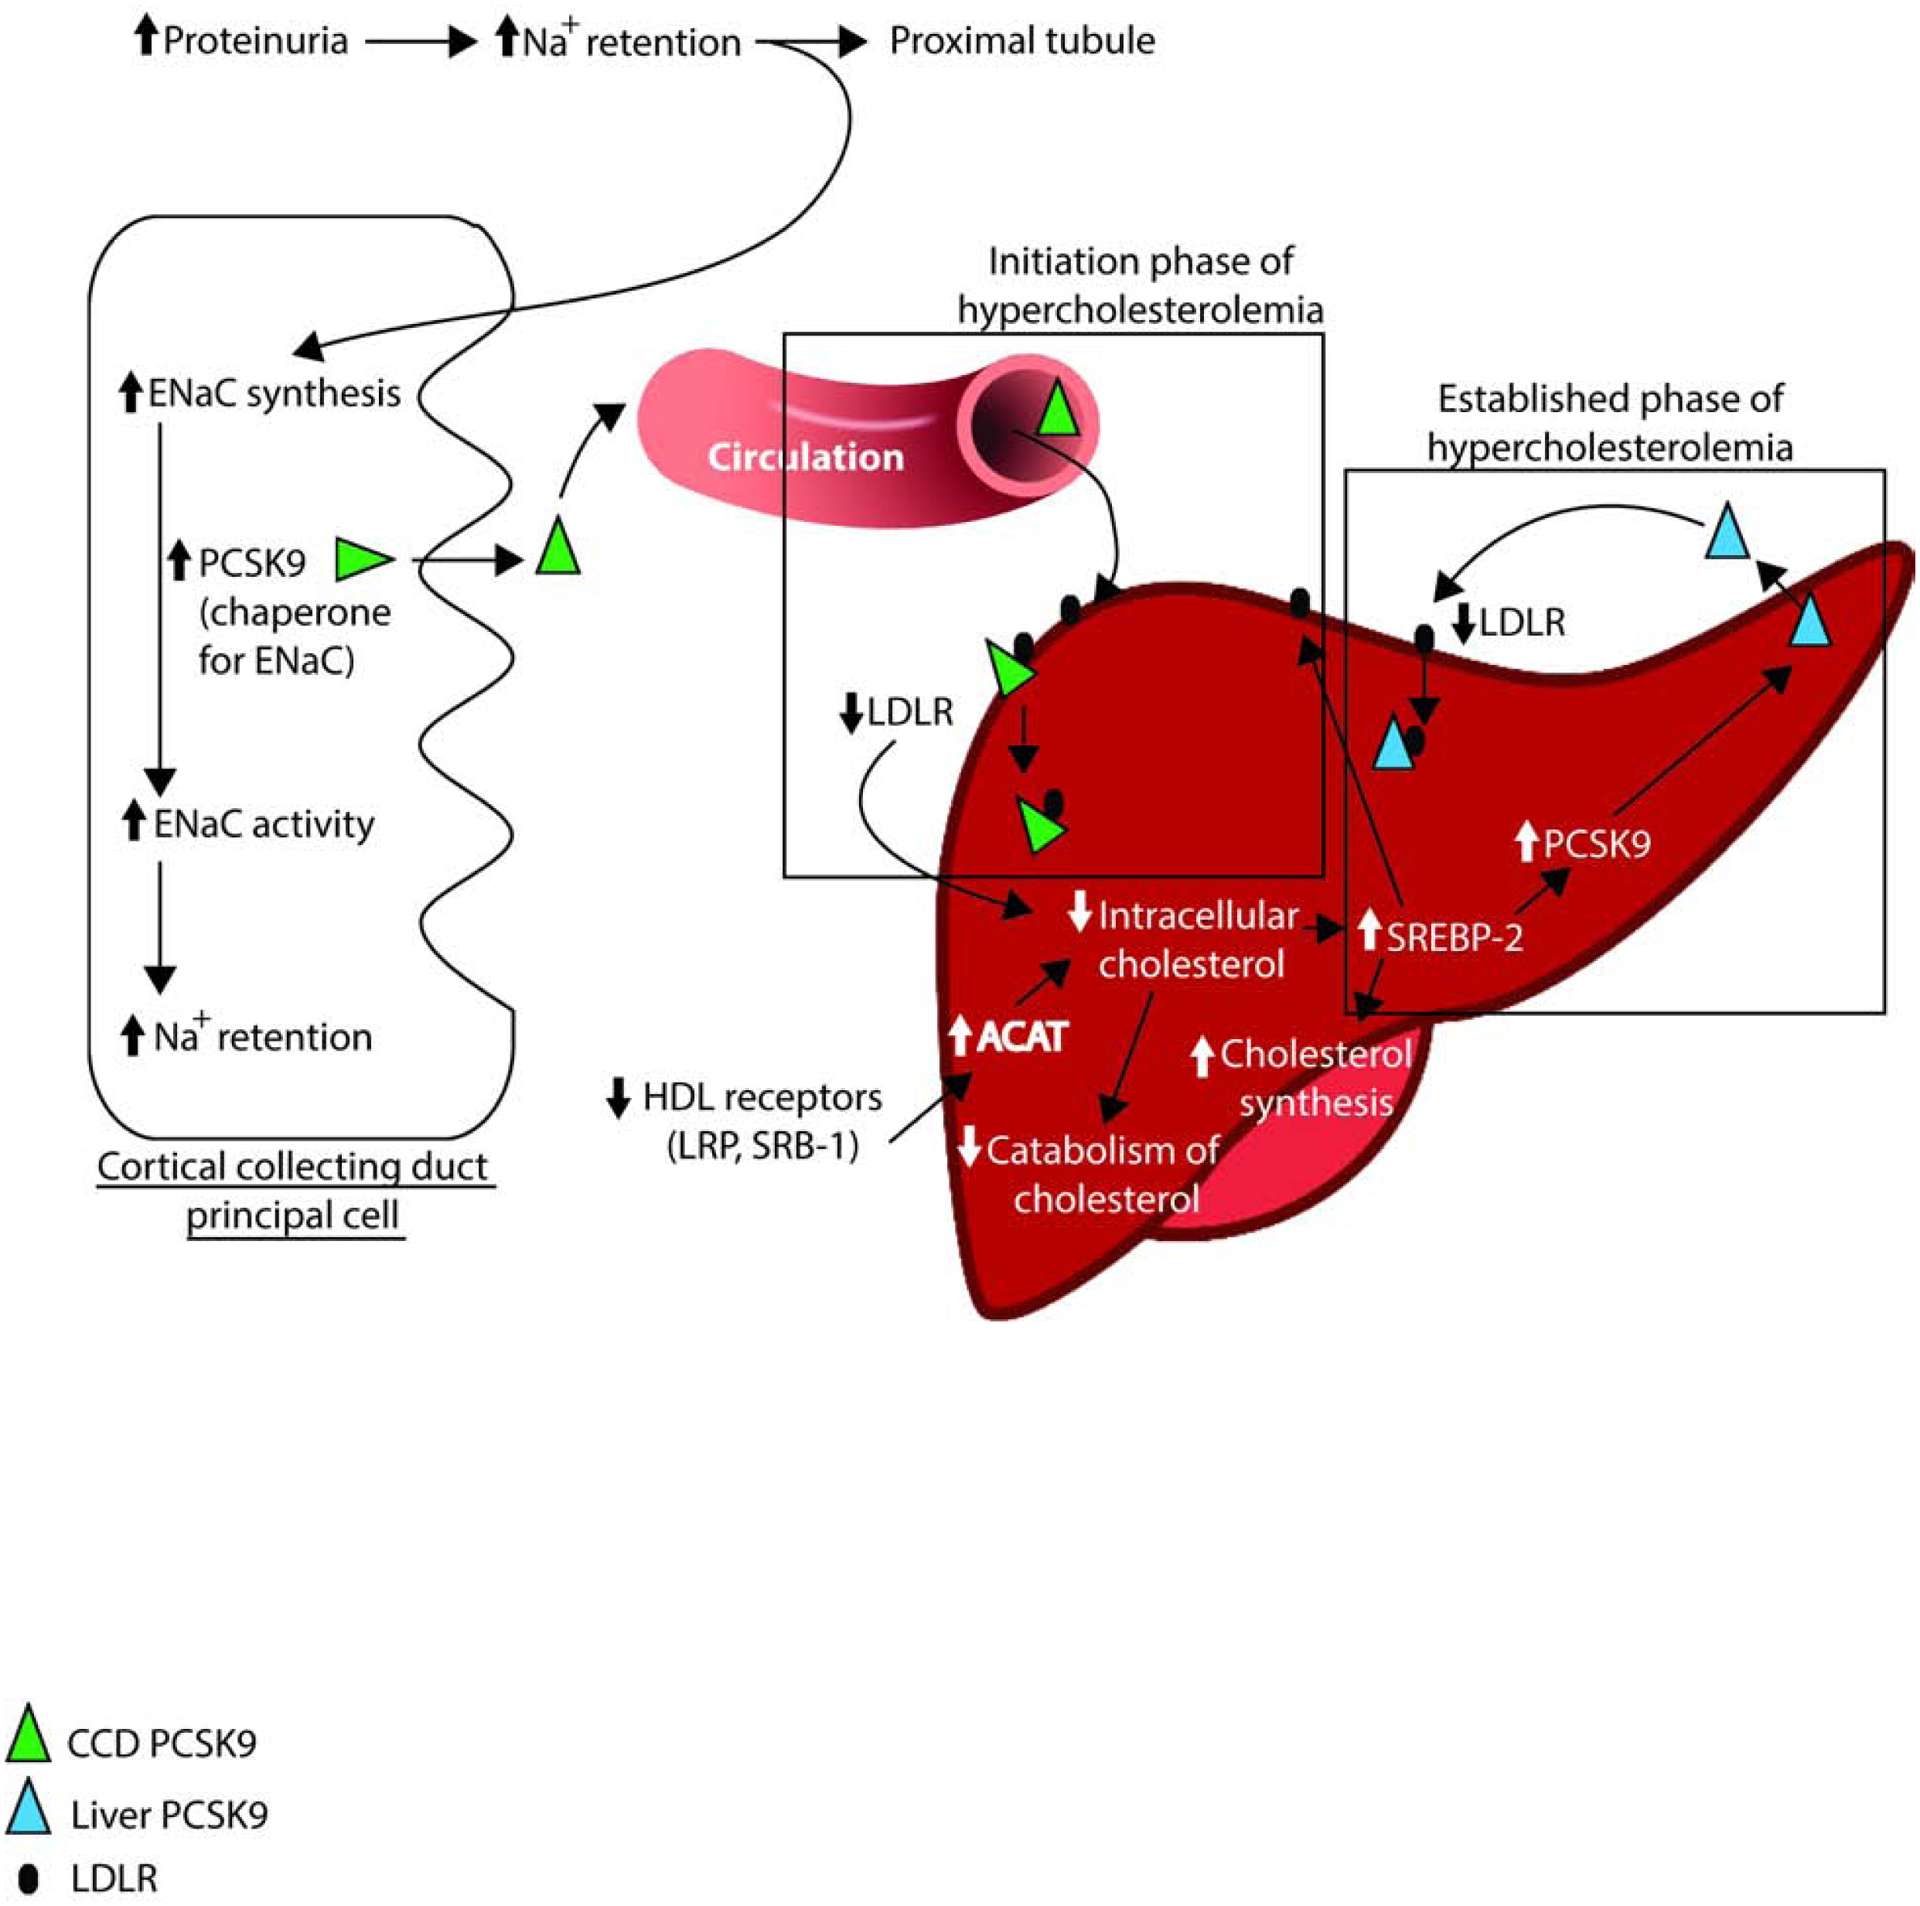
Simplified liver molecular mechanisms of hypercholesterolemia in nephrotic syndrome adapted from literature28–38.
ACAT = Acyl-CoA:cholesterol Acyltransferase; LDLR = LDL receptor; LRP = LDL receptor-related protein; SRB-1 = HDL receptor; ENaC = epithelium sodium channel; SREBP-2 = Sterol regulatory element-binding receptor; PCSK9 = Proprotein convertase subtilisin/kexin type9.
To prove that kidney PCSK9 can trigger initiation of hypercholesterolemia, we induced increased expression of PCSK9 specifically in the collecting duct using Amiloride. Amiloride is an inhibitor of the sodium channel ENaC in the collecting duct, and PCSK9 is its chaperone protein. We hypothesize that Amiloride blocked ENaC activity in the collecting duct and induced increased expression of PCSK9 to transport more ENaC channels to the cell membrane. This increased kidney PCSK9 spills into the blood stream to bind the LDLR in the liver and initiate hypercholesterolemia. This Amiloride-induced hypercholesterolemia is not caused by hemoconcentration as we noted a supraphysiological increase of cholesterol, so it is probably induced by increased expression of PCSK9.
Corresponding to the increase in kidney PCSK9 expression, liver PCSK9 protein expression was reduced in Rrm2b−/− mice and Buffalo/Mna rats. Since its mRNA expression was not reduced at that time, it would suggest a post-translational mechanism for regulating PCSK9 in the liver.
In summary, our data show that PCSK9 expressed in the CCD likely plays an important role in the development of hypercholesterolemia in nephrotic syndrome. These data raise the possibility that FDA-approved PCSK9 inhibitors may be used at early stage of nephrotic syndrome to reduce and/or delay the development of hypercholesterolemia and decrease its negative effect on promoting the progression of kidney damage.
MATERIALS AND METHODS
Animal studies
All animal studies conducted were approved by the IACUC at the University of Alabama at Birmingham or Rush University. Mouse models were obtained from the following sources: Rrm2b+/− mice (Lexicon)18, mouse sperm with the floxed Pcsk9 construct C57BL/6N-Pcsk9tm2a(EUCOMM)Hmgu/Ieg from Helmholtz Zentrum, Germany, AQP2-Cre mice (B6.Cg-Tg(Aqp2-Cre)1Dek/J) from Jackson Laboratory. Pcsk9 floxed mice were generated at the University of Alabama at Birmingham Kaul Center for Genetics. Briefly, oocytes from FLP mice (Jackson Laboratories) were incubated with mouse PCSK9 sperm to generate Pcsk9-Lox mice. Offspring were bred together and genotyped by PCR as recommended. Cortical collecting duct specific Pcsk9 deficient mice (PCSK9flox/flox;AQP2-Cre), designated as CCD-Pcsk9 deficient mice, were generated by breeding the PCSK9flox/flox mice with AQP2-Cre mice. PCSK9 protein expression was characterized by Western blot of kidney cortex and confocal imaging of kidney sections. Unless otherwise specified, male mice were used for all studies.
Mice were genotyped using DNA isolated from tail segments obtained during weaning. Tail segments were digested in 50 mM Tris-HCl, pH 7.5, containing 100 mM EDTA, 1% SDS, 100 mM NaCl, and 0.6 mg/ml proteinase K. Extracts were centrifuged, and the DNA-containing supernatant were precipitated using isopropanol. Resulting pellets were then washed with 70% ethanol and allowed to air-dry. Dried pellets were hydrated with 10 mM Tris-HCl buffer, pH 7.5, containing 0.1 mM EDTA, incubated at 65°C for 2 hours, and the DNA concentration was determined by UV spectrophotometry (Biotek Synergy HT multi-mode plate reader with Take3 plate).
Buffalo/Mna rats were obtained from Dr. M. Mitsuyama (Kyoto University).
Rats were studied every 4 weeks between 12 weeks and 32 weeks of age, and Rrm2b mice were studied every week between 5 weeks and 11 weeks of age. We collected 18-hour urine22 and blood sample, assessed urine albumin by ELISA (Bethyl laboratories), proteinuria by BCA protein assay (Pierce), serum albumin by analyzer (Beckman Coulter AU 480), serum total cholesterol by fluorometric assay (Cayman) and serum PCSK9 levels by ELISA (MBL International), on a Biotek Synergy HT multi-mode plate reader.
Light microscopy staining of both rodent models was performed, analyzed and interpreted by Dr. Carmen Avila-Casado27.
Antibodies used
The following primary antibodies were purchased: mouse anti-AQP2 (Santa Cruz); goat anti-PCSK9 (Santa Cruz), rabbit anti-PCSK9 (Abcam), rabbit anti-PCSK9 (Cayman). All secondary antibodies were purchased from Jackson ImmunoResearch Laboratories (West Grove, PA).
Western blot
Kidney cortex and liver extracted proteins were fractionated by SDS-PAGE and transferred to a nitrocellulose membrane using a Trans-Blot Turbo transfer apparatus according to the manufacturer’s protocols (Bio-Rad). After incubation with 5% nonfat milk in TBST (77 mM Tris, pH 7.5, 280 mM NaCl, 0.2% Tween 20) for 2 hours, the membranes were incubated with primary antibodies at 4°C overnight. Membranes were washed three times with TBST and incubated with horseradish peroxidase-conjugated anti-rabbit or anti-goat antibodies for 2 hours. Blots were washed with TBST three times and developed with the Clarity system (Bio-Rad) on a Chemi-Doc imager (Bio-Rad) according to the manufacturer’s protocols. The relative amounts of protein were determined by densitometry quantification over total loaded protein (Stain Free technology, Bio-Rad) or by ratio PCSK9 over beta-actin with Image Lab software (Bio-Rad).
Injection of NTS into CCD-Pcsk9 deficient mice
13 week-old male Pcsk9-Lox mice (Control) and Pcsk9-Cre-Lox mice (CCD-Pcsk9 deficient group) (n = 3 mice / group) were injected with γ2-NTS (sheep anti-rat glomerular NTS, γ2 fraction, gift from David Salant, 0.75 mg by retro-orbital injection). Serum and 18-hour urine were collected at baseline and periodically during the study. Serum samples were assayed for total cholesterol and PCSK9 levels, and urine for albuminuria as specified in the characterization of Rrm2b mice.
Treatment of Rrm2b−/− with Amiloride
8 week-old Rrm2b−/− female mice were given Amiloride (2 mg/kg/day in the drinking tap water) or plain drinking water for nine days. Amiloride solution was prepared fresh every day in drinking water, and delivered dose was calculated every three days to adjust Amiloride concentration in order for mice to get intended Amiloride dose. Urine and serum were collected at baseline and after nine days of treatment. Serum was assayed for total cholesterol and PCSK9 levels, and 18-hour urine collection was assayed for sodium excretion using an autoanalyzer.
Confocal imaging
Immunofluorescence staining of tissue section was conducted as described previously2. Confocal images were acquired in multichannel mode using a Zeiss Pascal 5 confocal laser microscope using the following laser and filter combinations: 488nm argon laser and BP 505–530nm filter; 543nm helium-neon laser and BP 560–615nm filter; and 633nm helium-neon laser and LP 650nm filter.
Control immunostaining with pre-immune serum or normal IgG of the same species as the primary antibody were performed for each experiment.
Human kidney biopsy specimens were embedded in OCT, 4 μm frozen sections were cut in a Cryostar 50 cryostat, and staining was performed using antibodies against PCSK9 (Cayman Chemical) and Aquaporin-2 (Santa Cruz).
Densitometry analysis
Confocal microscopy images were used to assess densitometry using ImageJ software version 1.52a (NIH). Briefly, kidney sections were stained for PCSK9 and collecting duct marker aquaporin-2. For human sections, areas of collecting duct aquaporin-2 staining were selected with a square tool of 100 by 100 pixels and integrated intensity was measured for PCSK9 staining. The same method was applied to measure three different background intensities. We then calculated the corrected total fluorescence (CTCF) of the selected area using the following formula (CTCF = Integrated Density – (Area of selected cell X Mean fluorescence of background readings)). The square was used 10 times on each of 4 different immunofluorescence images per group, measurements were pooled and statistics were done using Student’s t-test.
Densitometry for Buffalo-Mna rats and Rrm2b mice confocal images was performed as for human images but with smaller square tool. At least 10 measurement were performed per image, and images from at least 3 different animals were used.
Sources of human kidney biopsy specimens
Human kidney biopsy specimens (n = 3 biopsy specimens for control, n = 5 biopsy specimens for FSGS) for immunostaining and confocal imaging were obtained from the Instituto Nacional De Cardiologia in Mexico City via IRB approved protocols CONACYT 34751M, CONACYT 11–05, and DPAGA-UNAM IN-201902. Control kidney biopsy specimens used for these studies were age, sex and race matched protocol pretransplant biopsy specimen.
Gene expression analysis
Total RNA was extracted using Trizol (Life Technologies). Two μg RNA were used to synthesize each cDNA template using SuperScript IV (Life Technologies). Gene expression of Pcsk9 was assessed by Real-Time PCR (ABI 7500) using TaqMan FAM-MGB probe (Life Technologies; forward primer 5’- ACTGCCACCAGAAGGACCAT-3’, reverse primer 5’- GCATTGGCCAGGTTGATGTC-3’). Relative levels of mRNA expression were normalized to Gapdh (FAM-MGB) obtained from Life Technologies. Details of real-time PCR and establishment of cutoff of significance of a threefold change are described in a recent study2. Each value for change in expression in a study group is relative to the expression of a control group at the same time point.
Statistical analysis
Values in all graphs are mean ± s. e. m. For difference in proteinuria, albuminuria or gene expression, and confocal images densitometry involving 2 groups, we used the unpaired Student’s t test in Microsoft Excel 2016.
Supplementary Material
Supplementary Figure 1: Human pre-implantation and FSGS biopsy specimens studied.
Supplementary Figure 2: Biological characteristics of the female Rrm2b knockout mouse model. Control (Rrm2b+/+, n = 6 mice) and Rrm2b knockout (Rrm2b−/−, n = 6 mice) female mice were assessed weekly between age 5 and 12 weeks. (a) ELISA for albuminuria in Rrm2b+/+ and Rrm2b−/− mice. (b) ELISA for serum PCSK9 levels in Rrm2b+/+ and Rrm2b−/− mice. * P<0.05; ** P<0.01; *** P<0.001; comparison between same age Rrm2b+/+ and Rrm2b−/− mice.
Supplementary Figure 3: PCSK9 expression is increased in kidney cortical collecting duct in Rrm2b knockout mouse. Confocal images from four additional Rrm2b−/− mice showing expression of PCSK9 at each time point. Scale bar, 20 μm.
Supplementary Figure 4: Histology of Buffalo/Mna rats. Thirty two week-old Buffalo/Mna rats (n = 4) were used for Silver stained kidney sections. Light microscopy examination shows interstitial fibrosis (2 images on the left) and focal and segmental glomerulosclerosis (2 images on the right). Scale bars = 650 μm (first image), 130 μm (second image), 20 μm (2 last images).
Supplementary Figure 5: CCD-Pcsk9 deficiency and renal phenotypic changes after induction of nephrotic syndrome in mice. Control (n=3 mice) and CCD-Pcsk9 deficient (n=3 mice) mice assessed at baseline and at days 1, 3, 5 and 7 after injection of γ2-NTS. (a) In both mice groups, albuminuria peaks at day 1. (b) PAS images of control (left image) and CCD-Pcsk9 deficient mice (center and right images) 9 days after injection of γ2-NTS. Blue and yellow arrows indicate microvacuolation of proximal tubules cytoplasm and of distal tubules, respectively, and red stars indicate Tamm-Horshall protein in distal tubules. Scale bars = 20 μm. * or # P<0.05, * and # are comparisons to baseline, determined by two tails Student’s t-test.
Supplementary Figure 6: Peak urinary sodium excretion and delivered dose of Amiloride in Rrm2b−/− mice treated with Amiloride or water. 8 week-old female Rrm2b−/− mice were given plain tap water (Control, n = 4 mice) or Amiloride 2 mg/kg/day in tap water (Amiloride, n = 4 mice) for 9 days. (a) Intended (2 mg/kg/day, dashed line) and delivered dose of Amiloride in Rrm2b−/− mice. (b) 18-hour urinary sodium excretion in mice given tap water or Amiloride in tap water.* P<0.05.
TRANSLATIONAL STATEMENT.
The role of PCSK9 in the renal collecting duct is not well understood. In this study, we show that collecting duct PCSK9 expression is increased in FSGS patient biopsy specimens and two rodent models of nephrotic syndrome. Reduced PCSK9 expression in the mouse collecting duct abolishes development of nephrotic syndrome related hypercholesterolemia. Targeting PCSK9 protein secreted from the collecting duct may represent a future therapeutic strategy to reduce or delay the development of hypercholesterolemia in nephrotic syndrome.
ACKNOWLEDGEMENTS
Supported by NIH grant K01DK096127 to LCC, and AHA Scientist Development Grant 16SDG27500017 to CM. LCC thanks Sumant S. Chugh for useful discussions on the manuscript and reading the revised manuscript.
ABBREVIATIONS
- PCSK9
proprotein convertase subtilisin kexin type- 9
- LDL-c
LDL-cholesterol
- LDLR
low density lipoprotein receptor
- CCD
cortical collecting duct
- NTS
nephrotoxic serum
Footnotes
Publisher's Disclaimer: This is a PDF file of an unedited manuscript that has been accepted for publication. As a service to our customers we are providing this early version of the manuscript. The manuscript will undergo copyediting, typesetting, and review of the resulting proof before it is published in its final form. Please note that during the production process errors may be discovered which could affect the content, and all legal disclaimers that apply to the journal pertain.
DISCLOSURE
All authors declare no competing interest.
REFERENCES
- 1.Chugh SS, Clement LC, Macé C. New insights into human minimal change disease: lessons from animal models. Am J Kidney Dis. 2012;59(2):284–292. [DOI] [PMC free article] [PubMed] [Google Scholar]
- 2.Clement LC, Macé C, Avila-Casado C, et al. Circulating angiopoietin-like 4 links proteinuria with hypertriglyceridemia in nephrotic syndrome. Nat Med. 2014;20(1):37–46. [DOI] [PMC free article] [PubMed] [Google Scholar]
- 3.Chrétien M, Li CH. Isolation, purification, and characterization of gamma-lipotropic hormone from sheep pituitary glands. Can J Biochem. 1967;45(7):1163–74. [DOI] [PubMed] [Google Scholar]
- 4.Steiner DF, Cunningham D, Spigelman L, et al. Insulin biosynthesis: evidence for a precursor. Science. 1967;157(3789):697–700. [DOI] [PubMed] [Google Scholar]
- 5.Seidah NG, Benjannet S, Wickham L, et al. The secretory proprotein convertase neural apoptosis-regulated convertase 1 (NARC-1): liver regeneration and neuronal differentiation. Proc Natl Acad Sci U S A. 2003;100(3):928–33. [DOI] [PMC free article] [PubMed] [Google Scholar]
- 6.Benjannet S, Rhainds D, Essalmani R, et al. NARC-1/PCSK9 and its natural mutants: zymogen cleavage and effects on the low density lipoprotein (LDL) receptor and LDL cholesterol. J Biol Chem. 2004;279(47):48865–75. [DOI] [PubMed] [Google Scholar]
- 7.Seidah NG, Mayer G, Zaid A, et al. The activation and physiological functions of the proprotein convertases. Int J Biochem Cell Biol. 2008;40(6–7):1111–25. [DOI] [PubMed] [Google Scholar]
- 8.Cunnigham D, Danley DE, Geoghegan KF, et al. Structural and biophysical studies of PCSK9 and its mutants linked to familial hypercholesterolemia. Nat Struct Mol Biol. 2007;14(5):413–9. [DOI] [PubMed] [Google Scholar]
- 9.Essalmani R, Susan-Resiga D, Chamberland A, et al. In vivo evidence that furin from hepatocytes inactivates PCSK9. J Biol Chem. 2011;286(6):4257–63. [DOI] [PMC free article] [PubMed] [Google Scholar]
- 10.Benjannet S, Rhainds D, Hamelin J, et al. The Proprotein Convertase (PC) PCSK9 Is Inactivated by Furin and/or PC5/6A: functional consequences of natural mutations and post-translational modifications. J Biol Chem. 2006;281(41):30561–72. [DOI] [PubMed] [Google Scholar]
- 11.Han B, Eacho PI, Knierman MD, et al. Isolation and characterization of the circulating truncated form of PCSK9. J Lipid Res. 2014;55(7):1505–14. [DOI] [PMC free article] [PubMed] [Google Scholar]
- 12.Abifadel M, Varret M, Rabès JP, et al. Mutations in PCSK9 cause autosomal dominant hypercholesterolemia. Nat Genet. 2003;34(2):154–6. [DOI] [PubMed] [Google Scholar]
- 13.Zhang DW, Lagace TA, Garuti R, et al. Binding of proprotein convertase subtilisin/kexin type 9 to epidermal growth factor-like repeat A of low density lipoprotein receptor decreases receptor recycling and increases degradation. J Biol Chem. 2007;282(25):18602–12. [DOI] [PubMed] [Google Scholar]
- 14.Maxwell KN, Breslow JL. Adenoviral-mediated expression of Pcsk9 in mice results in a low-density lipoprotein receptor knockout phenotype. Proc Natl Acad Sci U S A. 2004;101(18):7100–5. [DOI] [PMC free article] [PubMed] [Google Scholar]
- 15.Lagace TA, Curtis DE, Garuti R, et al. Secreted PCSK9 decreases the number of LDL receptors in hepatocytes and in livers of parabiotic mice. J Clin Invest. 2006;116:2995–3005. [DOI] [PMC free article] [PubMed] [Google Scholar]
- 16.Qian YW, Schmidt RJ, Zhang Y, et al. Secreted PCSK9 downregulates low density lipoprotein receptor through receptor-mediated endocytosis. J Lipid Res. 2007;48:1488–1498. [DOI] [PubMed] [Google Scholar]
- 17.Konarzewski M, Szolkiewicz M, Sucajtys-Szulc E, et al. Elevated circulating PCSK-9 concentration in renal failure patients is corrected by renal replacement therapy. Am J Nephrol. 2014;40(2):157–63. [DOI] [PubMed] [Google Scholar]
- 18.Powell DR, Desai U, Sparks MJ, et al. Rapid development of glomerular injury and renal failure in mice lacking p53R2. Pediatr Nephrol. 2005;20:432–440. [DOI] [PubMed] [Google Scholar]
- 19.Le Berre L, Godfrin Y, Günther E, et al. Extrarenal Effects on the Pathogenesis and Relapse of Idiopathic Nephrotic Syndrome in Buffalo/Mna Rats. J Clin Invest 2002;109(4), 491–8. [DOI] [PMC free article] [PubMed] [Google Scholar]
- 20.Nakamura T, Oite T, Shimizu F, et al. Sclerotic Lesions in the Glomeruli of Buffalo/Mna Rats. Nephron 1986;43:50–55 [DOI] [PubMed] [Google Scholar]
- 21.Liu G, Clement L, Kanwar YS, et al. ZHX proteins regulate podocyte gene expression during the development of nephrotic syndrome. J Biol Chem. 2006;281:39681–39692. [DOI] [PubMed] [Google Scholar]
- 22.Clement LC, Avila-Casado C, Macé C, et al. Podocyte-secreted angiopoietin-like-4 mediates proteinuria in glucocorticoid-sensitive nephrotic syndrome. Nat Med. 2011;17(1):117–22. [DOI] [PMC free article] [PubMed] [Google Scholar]
- 23.Chugh S, Yuan H, Topham PS, et al. Aminopeptidase A: a nephritogenic target antigen of nephrotoxic serum. Kidney Int. 2001;59(2):601–13. [DOI] [PubMed] [Google Scholar]
- 24.Sharotri V, Collier DM, Olson DR, et al. Regulation of epithelial sodium channel trafficking by proprotein convertase subtilisin/kexin type 9 (PCSK9). J Biol Chem. 2012;287(23):19266–74. [DOI] [PMC free article] [PubMed] [Google Scholar]
- 25.Haas ME, Levenson AE, Sun X, et al. The Role of Proprotein Convertase Subtilisin/Kexin Type 9 in Nephrotic Syndrome-Associated Hypercholesterolemia. Circulation. 2016;134(1):61–72. [DOI] [PMC free article] [PubMed] [Google Scholar]
- 26.Liu S, Vaziri ND. Role of PCSK9 and IDOL in the pathogenesis of acquired LDL receptor deficiency and hypercholesterolemia in nephrotic syndrome. Nephrol Dial Transplant. 2014;29(3):538–43. [DOI] [PubMed] [Google Scholar]
- 27.Macé C, Del Nogal Avila M, Marshall CB, et al. The zinc fingers and homeoboxes 2 protein ZHX2 and its interacting proteins regulate upstream pathways in podocyte diseases. Kidney Int. 2020;97(4):753–764. [DOI] [PMC free article] [PubMed] [Google Scholar]
- 28.Jin k, Park BS, Kim YW, Vaziri ND. Plasma PCSK9 in Nephrotic Syndrome and in Peritoneal Dialysis: A Cross-sectional Study. Am J Kidney Dis 2014;63(4):584–9. [DOI] [PubMed] [Google Scholar]
- 29.Vaziri ND, Liang KH. Hepatic HMG-CoA reductase gene expression during the course of puromycin-induced nephrosis. Kidney Int 1995;48(6):1979–85. [DOI] [PubMed] [Google Scholar]
- 30.Vaziri ND, Liang K. Effects of HMG-CoA Reductase Inhibition on Hepatic Expression of Key Cholesterol-Regulatory Enzymes and Receptors in Nephrotic Syndrome. Am J Nephrol 2004;24(6):606–13. [DOI] [PubMed] [Google Scholar]
- 31.Vaziri ND, Gollapudi P, Han S, et al. Nephrotic Syndrome Causes Upregulation of HDL Endocytic Receptor and PDZK-1-dependent Downregulation of HDL Docking Receptor. Nephrol Dial Transplant 2011;26(10):3118–23. [DOI] [PubMed] [Google Scholar]
- 32.Liang K, Vaziri ND. Down-regulation of Hepatic High-Density Lipoprotein Receptor, SR-B1, in Nephrotic Syndrome. Kidney Int 1999;56(2):621–6. [DOI] [PubMed] [Google Scholar]
- 33.Vaziri ND, Liang K, Parks JS. Acquired Lecithin-Cholesterol Acyltransferase Deficiency in Nephrotic Syndrome. Am J Physiol Renal Physiol 2001;280(5):F823–8. [DOI] [PubMed] [Google Scholar]
- 34.Vaziri ND, Liang K. Up-regulation of Acyl-Coenzyme A:cholesterol Acyltransferase (ACAT) in Nephrotic Syndrome. Kidney Int 2002;61(5):1769–75. [DOI] [PubMed] [Google Scholar]
- 35.Vaziri ND, Liang KH. Acyl-coenzyme A:cholesterol Acyltransferase Inhibition Ameliorates Proteinuria, Hyperlipidemia, Lecithin-Cholesterol Acyltransferase, SRB-1, and Low-Denisty Lipoprotein Receptor Deficiencies in Nephrotic Syndrome. Circulation 2004;110(4):419–25. [DOI] [PubMed] [Google Scholar]
- 36.Kim S, Kim CH, Vaziri ND. Upregulation of Hepatic LDL Receptor-Related Protein in Nephrotic Syndrome: Response to Statin Therapy. Am J Physiol Endocrinol Metab 2005;288(4):E813–7. [DOI] [PubMed] [Google Scholar]
- 37.Kim HJ, Vaziri ND. Sterol Regulatory Element-Binding Proteins, Liver X Receptor, ABCA1 Transporter, CD36, Scavenger Receptors A1 and B1 in Nephrotic Kidney. Am J Nephrol 2009;29(6):607–14. [DOI] [PubMed] [Google Scholar]
- 38.Kim CH, Kim HJ, Mitsuhashi M, et al. Hepatic Tissue Sterol Regulatory Element Binding Protein 2 and Low-Density Lipoprotein Receptor in Nephrotic Syndrome. Metabolism 2007;56(10):1377–82. [DOI] [PubMed] [Google Scholar]
Associated Data
This section collects any data citations, data availability statements, or supplementary materials included in this article.
Supplementary Materials
Supplementary Figure 1: Human pre-implantation and FSGS biopsy specimens studied.
Supplementary Figure 2: Biological characteristics of the female Rrm2b knockout mouse model. Control (Rrm2b+/+, n = 6 mice) and Rrm2b knockout (Rrm2b−/−, n = 6 mice) female mice were assessed weekly between age 5 and 12 weeks. (a) ELISA for albuminuria in Rrm2b+/+ and Rrm2b−/− mice. (b) ELISA for serum PCSK9 levels in Rrm2b+/+ and Rrm2b−/− mice. * P<0.05; ** P<0.01; *** P<0.001; comparison between same age Rrm2b+/+ and Rrm2b−/− mice.
Supplementary Figure 3: PCSK9 expression is increased in kidney cortical collecting duct in Rrm2b knockout mouse. Confocal images from four additional Rrm2b−/− mice showing expression of PCSK9 at each time point. Scale bar, 20 μm.
Supplementary Figure 4: Histology of Buffalo/Mna rats. Thirty two week-old Buffalo/Mna rats (n = 4) were used for Silver stained kidney sections. Light microscopy examination shows interstitial fibrosis (2 images on the left) and focal and segmental glomerulosclerosis (2 images on the right). Scale bars = 650 μm (first image), 130 μm (second image), 20 μm (2 last images).
Supplementary Figure 5: CCD-Pcsk9 deficiency and renal phenotypic changes after induction of nephrotic syndrome in mice. Control (n=3 mice) and CCD-Pcsk9 deficient (n=3 mice) mice assessed at baseline and at days 1, 3, 5 and 7 after injection of γ2-NTS. (a) In both mice groups, albuminuria peaks at day 1. (b) PAS images of control (left image) and CCD-Pcsk9 deficient mice (center and right images) 9 days after injection of γ2-NTS. Blue and yellow arrows indicate microvacuolation of proximal tubules cytoplasm and of distal tubules, respectively, and red stars indicate Tamm-Horshall protein in distal tubules. Scale bars = 20 μm. * or # P<0.05, * and # are comparisons to baseline, determined by two tails Student’s t-test.
Supplementary Figure 6: Peak urinary sodium excretion and delivered dose of Amiloride in Rrm2b−/− mice treated with Amiloride or water. 8 week-old female Rrm2b−/− mice were given plain tap water (Control, n = 4 mice) or Amiloride 2 mg/kg/day in tap water (Amiloride, n = 4 mice) for 9 days. (a) Intended (2 mg/kg/day, dashed line) and delivered dose of Amiloride in Rrm2b−/− mice. (b) 18-hour urinary sodium excretion in mice given tap water or Amiloride in tap water.* P<0.05.


