

ABSTRACT
Heterochromatin, a densely packed chromatin state that is transcriptionally silent, is a critical regulator of gene expression. However, it is unclear how the repressive histone modification H4K20me3 or the histone methyltransferase SUV420H2 regulates embryonic stem (ES) cell fate by patterning the epigenetic landscape. Here, we report that depletion of SUV420H2 leads to a near-complete loss of H4K20me3 genome wide, dysregulated gene expression and delayed ES cell differentiation. SUV420H2-bound regions are enriched with repetitive DNA elements, which are de-repressed in SUV420H2 knockout ES cells. Moreover, SUV420H2 regulation of H4K20me3-marked heterochromatin controls chromatin architecture, including fine-scale chromatin interactions in pluripotent ES cells. Our results indicate that SUV420H2 plays a crucial role in stabilizing the three-dimensional chromatin landscape of ES cells, as loss of SUV420H2 resulted in A/B compartment switching, perturbed chromatin insulation, and altered chromatin interactions of pericentric heterochromatin and surrounding regions, indicative of localized decondensation. In addition, depletion of SUV420H2 resulted in compromised interactions between H4K20me3 and gene-regulatory regions. Together, these findings describe a new role for SUV420H2 in regulating the chromatin landscape of ES cells.
KEY WORDS: Embryonic stem cells, 3D genome, Chromatin architecture, Pluripotent, Epigenetics, Chromatin, ChIP-Seq, SUV420H2, H4K20me3
Summary: SUV420H2 regulation of H4K20me3-marked heterochromatin controls the chromatin structure of embryonic stem cells, where loss of SUV420H2 results in dysregulated gene expression and differentiation, altered 3D chromatin interactions, compartment switching and perturbed chromatin insulation.
INTRODUCTION
To maintain self-renewal or undergo differentiation, embryonic stem (ES) cells must be able to respond to external or intrinsic signals to remodel chromatin in a way that permits transcriptional activity of genes specific to their lineage or to repress genes of alternative lineages. The demarcation of chromatin into two classes of euchromatin, which is open and largely transcriptionally active, and heterochromatin, which is compact and refractory to transcription (Grewal and Moazed, 2003), is an integral regulator of gene expression. The chromatin landscape of pluripotent ES cells is organized in a three-dimensional (3D) structure in the nucleus into topologically associated domains (TADs) and A/B compartments (Dekker and Heard, 2015; Denker and de Laat, 2016; Dixon et al., 2016), in which the A compartment is open and transcriptionally active and the B compartment is compact and generally transcriptionally repressed. These large-scale TADs and compartments, together with fine-scale interactions between regulatory elements and promoters, control gene expression programs. Genomic regions that are important for maintaining genome stability, including centromeres and telomeres, and repetitive DNA elements and noncoding regions, are stably heterochromatized in a condensed state called constitutive heterochromatin (Grewal and Jia, 2007; Kent et al., 2002; Martens et al., 2005; Talbert and Henikoff, 2006; Trojer and Reinberg, 2007), while protein-coding regions that are actively transcribed are localized in euchromatin regions. Heterochromatin, which exhibits reduced transcriptional activity relative to euchromatin regions, stabilizes DNA repeats by inhibiting recombination between homologous DNA repeats, thus promoting genome integrity (Guarente, 2000). Heterochromatin is typically marked with repressive histone modifications such as H4K20me3 (Kidder et al., 2017a,b) and H3K9me3. These marks have also been shown to colocalize with activating histone modifications, such as H3K4me3 (Xu and Kidder, 2018), and can be found in genic regions of actively transcribed genes (Blahnik et al., 2011; Riddle et al., 2012; Vakoc et al., 2005). Heterochromatin regions exhibit the ability to respond to signals to adopt an open conformational state, suggesting dynamic interplay between chromatin-associated proteins and histone modifications. H4K20 methylation plays a role in several cellular processes such as chromatin compaction, chromatin condensation (Beck et al., 2012), transcriptional repression and activation (Karachentsev et al., 2005), genome integrity (Kidder et al., 2017a; Oda et al., 2009), DNA repair (Botuyan et al., 2006) and DNA replication. H4K20 methylation is mediated by SUV420H1 or SUV420H2 enzymes, which catalyze H4K20me3 and promote heterochromatin formation at pericentromeric regions (Schotta et al., 2008). Although exploration of the 3D chromatin environment of ES cells has shed light on its chromatin architecture, the role of SUV420H2 in controlling gene expression and regulating the 3D chromatin landscape in ES cells is largely unknown.
Here, we show that SUV420H2 knockout (KO) ES cells exhibit widespread loss of global H4K20me3 levels and delayed differentiation. Moreover, we demonstrate that SUV420H2 binds repetitive DNA elements, which are de-repressed in SUV420H2-depleted ES cells. We also found that depletion of SUV420H2 results in altered chromatin architecture, including altered interactions between H4K20me3 and gene-regulatory regions.
RESULTS
SUV420H2 regulates ES cell identity
To study the role of the H4K20me3 methyltransferases, SUV420H1 and SUV420H2, in ES cell self-renewal and differentiation, we used wild-type (WT), SUV420H2 KO and SUV420H1/H2 double knockout (DKO) ES cells (Schotta et al., 2008). SUV420H2 KO and SUV420H DKO ES cell colonies were more flat than WT ES cells and exhibited scattering at the colony periphery (Fig. 1A,B), suggesting reduced integrity of colony morphology. Using RNA sequencing (RNA-Seq), we identified 3710 genes differentially expressed (DE) at least 1.5-fold between WT and SUV420H2 KO ES cells, including 2154 upregulated genes, such as the pluripotency regulator Nanog, and 1556 downregulated genes, such as Zfp42, Nr5a2 and Gbx2 (Fig. 1C). These findings suggest that depletion of SUV420H2 leads to a greater number of upregulated genes relative to downregulated genes. We also identified 5706 DE genes between WT and SUV420H DKO ES cells, including 2812 upregulated genes and 2894 downregulated genes. Genes downregulated in SUV420H2 KO or SUV420H DKO ES cells were expressed at a relatively high level in WT ES cells, whereas genes that were upregulated were expressed at a lower level in WT ES cells (Fig. S1A). To investigate the expression state of these DE genes, we compared their expression with transcriptome data from undifferentiated ES cells and embryoid body (EB)-differentiated cells (Kidder et al., 2013), which represent a model for early embryo development (Kurosawa, 2007), using gene set enrichment analysis (GSEA) (Subramanian et al., 2005). Our findings demonstrate that genes downregulated in SUV420H2 KO ES cells are enriched in undifferentiated ES cells, while upregulated genes are expressed in ES cells or differentiated cells (Fig. 1D). In addition, genes downregulated in SUV420H DKO ES cells are enriched in ES cells, while upregulated genes are enriched in differentiated cells (Fig. S1B). DAVID (Dennis et al., 2003) gene ontology (GO) analysis revealed developmental GO terms enriched in DE genes from SUV420H2 KO and SUV420H1/H2 DKO ES cells (Fig. S1C,D). Moreover, Network2canvas (Tan et al., 2013) demonstrated that upregulated DE genes are expressed in differentiated lineages (Fig. S2A,B), suggesting that expression of lineage genes and ES cell regulators is altered in SUV420H2 KO and SUV420H DKO ES cells. Combined, these results suggest that SUV420H enzymes repress lineage-specific genes in ES cells.
Fig. 1.

Delayed differentiation of SUV420H2 KO and SUV420H1/H2 DKO ES cells. (A) Bright-field microscopy of wild-type (WT), SUV420H2 knockout (KO) and SUV420H1/H2 double knockout (DKO) ES cells. (B) ES cell colonies were scored by morphology. The percentage of colonies with a compact and round ES cell (ESC)-like morphology versus a flattened morphology are represented as mean±s.e.m. P-value calculations were performed using unpaired Student's t-tests (three independent experiments). (C) RNA-Seq transcriptome analysis of control, SUV420H2 KO and SUV420H1/H2 DKO ES cells. Scatter plots of RNA-Seq data show log2-adjusted differentially expressed (DE) genes between WT and SUV420H2 KO ES cells (left) and WT and SUV420H1/H2 DKO ES cells (right). DE genes with a fold change>1.5, RPKM>1 and FDR<0.001 are shown in black. (D) Gene set enrichment analysis (GSEA) of downregulated (top) and upregulated (bottom) genes in SUV420H2 KO ES cells relative to ES cells and differentiated embryoid bodies (EBs). (E) EB formation highlights altered differentiation of SUV420H2 and SUV420H1/H2 DKO ES cells. ES cells were cultured in leukemia inhibitory factor (LIF)-independent medium on low-binding dishes for 12 days. WT ES cells form a mixture of cavitated/cystic and solid EBs, while SUV420H2 KO and SUV420H1/H2 DKO ES cells predominantly form solid EBs. (F) RNA-Seq analysis of WT, SUV420H2 KO and SUV420H1/H2 DKO ES cells differentiated for 8 days in the absence of LIF. Scatter plots show log2-adjusted DE genes between WT and SUV420H2 KO day 8 EBs (left) and between WT and SUV420H1/H2 DKO day 8 EBs (right) (fold change>1.5, RPKM>1 and FDR<0.001). (G) Custom UCSC genome browser tracks of RNA-Seq data for undifferentiated and differentiated WT, SUV420H2 KO, SUV420H1/H2 DKO ES cells and EBs. (H) K-means clustering analysis of RNA-Seq data from WT, SUV420H2 KO, SUV420H1/H2 DKO ES cells and EBs differentiated over a time course of 12 days. DE genes (>2-fold; RPKM>1) clustered according to k-means. (I) Principal component analysis (PCA) of DE genes in ES cells and during EB differentiation of WT, SUV420H2 KO and SUV420H1/H2 DKO ES cells. (J) Schematic describing the calculation used to determine the differentiation index (DI). The DI is calculated from the ratio of the RPKM expression of genes associated with the GO terms ‘development’ or ‘differentiation’ in differentiated EBs to the RPKM expression of a gene in undifferentiated ES cells (top). Empirical cumulative distribution function (ECDF) for the DI of genes in WT (black) and SUV420H2 KO (red) day 8 EBs (left), and WT (black) and SUV420H1/H2 DKO (red) day 8 EBs (right) (bottom). The y-axis shows the percentage of regions that exhibit a DI less than the value specified by the x-axis. A line shifted to the left means a systematic decrease in the DI. For all, P<2.2×10⁻¹⁶ (Kolmogorov–Smirnov test). Note the decreased DI for genes in SUV420H2 KO and SUV420H1/H2 DKO day 8 EBs. (K) GSEA of upregulated (left) and downregulated (right) DE genes in SUV420H2 KO day 8 EBs relative to undifferentiated ES cells and differentiated EBs.
Dysregulated differentiation of SUV420H2 KO ES cells
To interrogate the function of SUV420H enzymes during ES cell differentiation, we induced EB formation by culturing WT, SUV420H2 KO and SUV420H DKO ES cells on low-attachment dishes in the absence of leukemia inhibitory factor (LIF) over a time course of 12 days. Whereas WT ES cells formed typical 3D EB structures, including a mixture of solid and cavitated EBs (Fig. 1E), SUV420H2 KO and SUV420H DKO EBs were smaller and displayed decreased cavitation (Fig. 1E), indicative of delayed differentiation. Next, to identify gene expression changes during EB differentiation, we surveyed DE genes using RNA-Seq. We found 6916 DE genes (at least 1.5-fold differential expression) between WT and SUV420H2 KO day 8 EBs, 4618 DE genes between WT and SUV420H DKO day 8 EBs (Fig. 1F), 5512 DE genes between WT and SUV420H2 KO day 12 EBs, and 6079 DE genes between WT and SUV420H DKO day 12 EBs (Fig. S3A). We observed delayed deactivation of pluripotency-related genes such as Nanog (Fig. 1G) and delayed upregulation of lineage-specific genes such as Col1a1. K-means clustering (k=10) identified patterns of gene expression variability (Fig. 1H). Specifically, we observed clusters of lineage genes upregulated in WT EBs that were expressed at lower levels in SUV420H2 KO and SUV420H DKO EBs. Principal component analysis (PCA) showed that SUV420H2 KO and SUV420H DKO ES cells and EBs exhibit an altered trajectory through the 3D space relative to WT ES cells and EBs (Fig. 1I). To further explore the rate of differentiation, we quantified the relative ratio of RNA-Seq expression [reads per kilobase of transcript per million mapped reads (RPKM); see Materials and Methods] of genes associated with the GO terms ‘development’ or ‘differentiation’ in differentiated EBs relative to undifferentiated ES cells, which we have termed the differentiation index (DI) (Fig. 1J, top). Using this calculation, we observed a decrease in the DI for SUV420H2 and SUV420H DKO day 8 (Fig. 1J, bottom) and day 12 EBs (Fig. S3B). We further compared the expression of DE genes between WT and SUV420H-deficient EBs in ES cells and differentiated EBs, using GSEA. The results showed that upregulated genes in SUV420H KO and SUV420H DKO day 8 (Fig. 1K) and day 12 (Fig. S3C) EBs are enriched in ES cells, whereas downregulated genes are enriched in EBs, further demonstrating that SUV420H-deficient cells exhibit delayed differentiation. In addition, DAVID GO analysis revealed enrichment of developmental GO terms in downregulated genes from SUV420H2 KO and SUV420H DKO EBs (Fig. S3D). Altogether, these results describe a role for SUV420H enzymes in regulating ES cell differentiation.
SUV420H2 regulates H4K20me3 at repetitive DNA elements
Because SUV420H1 and SUV420H2 mediate H4K20me3, we interrogated the genome-wide distribution of H4K20me3 in WT, SUV420H2 KO and SUV420H1/H2 DKO ES cells using ChIP-Seq. We found that the 31,044 islands exhibited decreased H4K20me3 levels in SUV420H2 KO ES cells (Fig. 2A), while 30,759 islands showed decreased H4K20me3 levels in SUV420H DKO ES cells [see Materials and Methods; false discovery rate (FDR)<0.001, fold change>1.5]. A comparison of average profiles around H4K20me3 peaks (Fig. 2B), a boxplot (Fig. 2C), heat maps (Fig. 2D) and University of California Santa Cruz (UCSC) genome browser tracks (Fig. 2E) also revealed a near-complete genome-wide loss of H4K20me3 in SUV420H2 KO and SUV420H2 DKO ES cells (Kolmogorov–Smirnov test; P<2.2×10⁻¹⁶). A survey of SUV420H2 genome-wide binding in ES cells using chromatin immunoprecipitation with DNA sequencing (ChIP-Seq; see Materials and Methods) showed that the majority of SUV420H2 peaks overlap with H4K20me3 marks (96%), where H4K20me3 is enriched at SUV420H2-occupied regions (Fig. 2F).
Fig. 2.

Loss of SUV420H2 leads to global decreases in H4K20me3 and de-repression of repetitive DNA elements. (A) Genome-wide depletion of H4K20me3 in SUV420H2 KO and SUV420H1/H2 DKO ES cells. (B-D) Average ChIP-Seq tag density profile (B), boxplot (C) and heat maps (D) of H4K20me3 in WT, SUV420H2 KO and SUV420H1/H2 DKO ES cells. (E) UCSC genome browser view depicting altered H4K20me3 at distinct genomic regions. (F) Average density profile of SUV420H2 binding (left) and H4K20me3 occupancy (right) at SUV420H2 regions in WT ES cells. (G) Long-terminal repeat (LTR) and long interspersed nuclear element (LINE) repetitive DNA elements are enriched in regions occupied by SUV420H2. A comparison of SUV420H2-enriched genomic sequences with annotated repetitive sequences. The percentage of ChIP-enriched regions with at least 60% repeat length is shown. (H) ECDF for the percentage coverage of LINE (left) or LTR repeat (right) class members across all SUV420H2-bound regions relative to random genomic regions (black). The y-axis shows the percentage of regions that exhibit a percentage repeat length less than the value specified by the x-axis. A line shifted to the right means a systematic increase in the percentage coverage of a repeat element in SUV420H2 peaks relative to random genomic sequences. For all, P<2.2×10⁻¹⁶ (Kolmogorov–Smirnov test). (I) H4K20me3 density at LTR (left) and LINE (right) regions in WT and SUV420H2 KO ES cells. Boxplots indicate the 25th and 75th percentiles, and the median. (J) A representative full-length LTR retrotransposon/endogenous retrovirus with internal features in the mouse genome identified using LTRharvest and annotated using LTRdigest. (K) Fold change in RNA-Seq expression of LTR regions and internal features in WT and SUV420H2 KO ES cells (SUV420H2 KO/WT).
Because H4K20me3-occupied DNA sequences are enriched with long-terminal repeat (LTR) and long interspersed nuclear element (LINE) repetitive elements (Kidder et al., 2017a,b; Mikkelsen et al., 2007), and SUV420H2-occupied regions are enriched with H4K20me3, we investigated whether SUV420H2-occupied DNA sequences are similarly enriched with these repetitive elements. To this end, we evaluated the percentage coverage of SUV420H2 peaks that overlap a repeat element, and observed enrichment of LINE and LTR elements in sequences occupied by SUV420H2 relative to random genomic sequences (Fig. 2G). We also investigated the percentage coverage of LTR and LINE sequences for all SUV420H2-occupied regions and observed enrichment of LINE and LTR sequences in SUV420H2-bound regions relative to random DNA sequences (Fig. 2H). In addition, we observed decreased levels of H4K20me3 at LTR and LINE repeats (Fig. 2I), suggesting that SUV420H enzymes regulate H4K20me3 at these repetitive elements.
To investigate whether SUV420H2 deposition of H4K20me3 mediates silencing of full-length LTR retrotransposons and endogenous retroviruses (ERVs) in ES cells, we surveyed the expression of these elements in WT and SUV420H2 KO ES cells. We previously identified full-length LTR retrotransposons and ERVs in the mouse genome using LTRharvest (Ellinghaus et al., 2008), and annotated internal LTR regions using LTRdigest (Steinbiss et al., 2009) (Fig. 2J). Next, we evaluated the expression of LTR regions and annotated features, and observed upregulation of LTR/ERV sequences in SUV420H2 KO ES cells (Fig. 2K). These findings are consistent with previous studies that identified a correlation between decreased H4K20me3 levels and de-repression of LTR and LINE sequences (Kidder et al., 2017a,b).
To determine whether loss of SUV420H2-mediated silencing of LTR/ERV elements leads to upregulation of nearby genes, we calculated the number of upregulated genes in SUV420H2 KO ES cells that contain LTR/ERV sequences near their transcriptional start site (TSS) (Fig. S4A). GREAT GO (McLean et al., 2010) annotation of LTR sequences demonstrated that they are located in intergenic and intron regions (Fig. S4B). Moreover, we evaluated the expression of upregulated genes near LTR elements marked with H4K20me3 (Fig. S4C), and observed decreased H4K20me3 at these regions in SUV420H2 KO ES cells relative to WT cells (Fig. S4D). These results suggest that SUV420H2 influences the expression of nearby genes by silencing LTRs/ERVs marked with H4K20me3.
SUV420H2 regulates organization of chromatin domains and loops
To study the role of SUV420H2 in chromosome organization we generated genome-wide high-resolution chromatin interaction data from WT and SUV420H2 KO ES cells using Hi-C (Rao et al., 2014) (see Materials and Methods). Hi-C datasets from biological replicates were analyzed using Juicer (Durand et al., 2016b). Collectively, we analyzed >572 million read pairs for each sample, resulting in 1.19 billion total read pairs and ∼300 million unique Hi-C contacts for each sample (WT and SUV420H2 KO). In addition, we observed a high fraction of cis contacts (∼90%), where ∼60% of cis Hi-C contacts were long-range (>20 kb) intra-chromosomal contacts (Table S1). Combined, these results demonstrate high-quality Hi-C data. Juicer was used to annotate structural features such as chromosome loops and contact domains. Juicer Arrowhead (Durand et al., 2016b) was used to identify chromatin domains, and loop domains were identified using the Juicer implementation of the HiCCUPS algorithm (Rao et al., 2014). Visualization of Hi-C data using Juicebox (Durand et al., 2016a) showed altered boundaries of a contact domain between WT and SUV420H2 KO ES cells (Fig. 3A). Mapping of chromatin interactions at 250 kb and 5 kb resolution using Juicebox revealed altered chromatin domain topography at a subset of genomic regions in SUV420H2 KO ES cells (Fig. 3A). We also compared chromatin interactions for each chromosome in WT and SUV420H2 KO ES cells (Fig. S5).
Fig. 3.

Identification of altered chromatin contacts in SUV420H2 KO ES cells. (A) Contact matrices showing observed normalized Hi-C signal from WT and SUV420H2 KO ES cells from the entire chromosome 6 at 250 kb resolution (top row) and 5 kb resolution (bottom row) as evaluated using Juicer and Juicebox. In the bottom row, all contact domains identified are shown in yellow. Juicer Arrowhead was used to identify chromatin domains. Pixel intensity represents the normalized number of contacts between two loci. The maximum intensity is shown in each panel. (B) Size of domains in WT and SUV420H2 KO ES cells. (C) Venn diagram showing overlap between domains in WT and SUV420H2 KO ES cells. (D,E) Boxplot (D) and average profile (E) of H4K20me3 density near WT domain boundaries (within 100 kb) in WT and SUV420H2 KO ES cells. (F) Aggregate pile-up analyses over all WT ES cell domains (left), SUV420H2 KO ES cell enriched domains (middle) and WT ES cell enriched domains (right). Pile-up analyses were performed using coolpup.py (Flyamer et al., 2020). (G,H) Boxplots depicting the size (G) and number (H) of loop domains in WT and SUV420H2 KO ES cells. Boxplots indicate the 25th and 75th percentiles, and the median. (I) Aggregate pile-up analyses over all WT ES cell loops (left), WT ES cell enriched loops (middle) and SUV420H2 KO ES cell enriched loops (right). Pile-up analyses were performed using coolpup.py (Flyamer et al., 2020).
To gain insight into principles of chromatin organization controlled by SUV420H2, we explored domain and loop structures in SUV420H2 KO ES cells relative to WT ES cells. Our Hi-C maps reveal extensive alterations in ectopic contacts at the chromatin domain level. We observed a decrease in domain size in SUV420H2 KO ES cells (220 kb) relative to WT ES cells (240 kb) (Fig. 3B), an increase in the overall number of contact domains in SUV420H2 KO ES cells (3550) relative to WT ES cells (3088), and 2737 overlapping contact domains (Fig. 3C). We also investigated whether loss of SUV420H2-dependent regulation of H4K20me3 leads to altered contact domain boundaries. To this end, we evaluated H4K20me3 levels at domain boundaries (within 100 kb) and observed decreased H4K20me3 in SUV420H2 KO ES cells (Fig. 3D,E). Next, we performed differential analysis of Juicer Arrowhead domain boundaries using TADCompare (Cresswell and Dozmorov, 2020) to identify differential domain boundaries between WT and SUV420H2 KO ES cells. We then explored the expression profile of genes near differential domain boundaries (within 10 kb) by integrating RNA-Seq data. For genes associated with WT ES cell enriched domains, SUV420H2 KO ES cell enriched domains, or all WT or KO domains, boxplots revealed that the expression level of genes that were upregulated in SUV420H2 KO ES cells was lower in WT ES cells relative to the expression level of genes that were downregulated in SUV420H2 KO ES cells (Fig. S6A). Moreover, to evaluate the biological significance of boundary changes, we annotated GO terms of genes near differential boundaries (within 10 kb) using DAVID. GO annotation of genes associated with altered domain boundaries revealed enrichment of multiple GO terms including ‘development’, ‘gene expression’, ‘transport’ and ‘morphogenesis’ (Fig. S6B). Genes upregulated in SUV420H2 KO ES cells and associated with decreased domain boundary strength were enriched with the GO term ‘gene expression’, while downregulated genes were enriched with the GO term ‘transport’. In addition, genes downregulated in SUV420H2 KO ES cells and associated with increased domain boundary strength were enriched with the GO terms ‘development’ and ‘morphogenesis’ (Fig. S6B). These findings suggest that alterations in domain boundaries are associated with dysregulated expression of genes enriched with multiple GO terms in SUV420H2 KO ES cells.
We also performed aggregate pile-up analysis of domains in WT and SUV420H2 KO ES cells using coolpup.py (Flyamer et al., 2020), which is based on a variation of this aggregate domain analysis approach (Flyamer et al., 2017) (Fig. 3F, left). These results revealed overall consistent domain strengths between WT and SUV420H2 ES cell datasets. We used TADCompare to identify differential domain boundaries of Juicer Arrowhead-called domains between WT and SUV420H2 KO ES cells, and subsequently performed pile-up domain analysis using coolpup.py. Using this approach, we observed increased domain strength at SUV420H2 KO ES cell enriched domains (Fig. 3F, middle) and minor decreases in domain strength at WT ES cell enriched domains (Fig. 3F, right) in SUV420H2 KO ES cells. These findings are consistent with the results described in Fig. 3C, which demonstrate that although most contact domains overlap between WT and SUV420H2 KO ES cells, a subset of domains is enriched in WT or SUV420H2 KO ES cells.
We further explored the structure of loop domains genome wide using our Hi-C dataset. Loss of SUV420H2 resulted in a decrease in loop size in ES cells (175 kb) relative to WT ES cells (200 kb) (Fig. 3G), and an overall increase in the number of loops in SUV420H2 KO ES cells (7472) relative to WT ES cells (6036) (Fig. 3H). These findings suggest that SUV420H2 instructs chromatin domains and loops in ES cells, where loss of SUV420H2 leads to decreased integrity of chromatin domain and loop folding. Moreover, the decrease in domain and loop size and increase in domain and loop number indicate that SUV420H2 and H4K20me3 play a broad role in demarcating active and inactive chromatin regions. To evaluate loop strengths between WT and SUV420H2 KO ES cells, we performed aggregate pile-up analysis of loops using coolpup.py, which revealed consistent loop strengths for all loops in WT and SUV420H2 KO ES cells (Fig. 3I, left). We also performed pile-up analysis of differential loop domains identified between WT and SUV420H2 KO ES cells using Juicer HiCCUPSDiff. These results highlight increased loop strength of WT enriched loops in WT ES cells (Fig. 3I, middle) and SUV420H2 KO ES cell enriched loops in SUV420H2 KO ES cells (Fig. 3I, right). These results demonstrate that although overall loop strengths are consistent between WT and SUV420H2 KO ES cells, a subset of loops is enriched in WT or SUV420H2 KO ES cells.
Identification of differential interactions between WT and SUV420H2 KO ES cells
To study the changes in chromatin interactions between WT and SUV420H2 ES cells we used diffHic (see Materials and Methods) (Lun and Smyth, 2015). Paired-end reads aligned to the mm9 reference genome were processed into interaction counts in bin pairs, which were filtered for low abundance and normalized for library-specific biases. Counts for bin pairs were subsequently modeled using edgeR (Lun and Smyth, 2015; Robinson et al., 2009). Using this approach, we identified 6564 differential anchor points, where anchor points are defined as genomic regions in which chromatin interactions are present (Lun and Smyth, 2015), including 3235 differential anchor points that exhibited decreased interactions, and 3323 differential anchor points that exhibited increased interactions, in SUV420H2 KO ES cells relative to WT ES cells (Fig. 4A,B). We also found that 100% of differential anchor points with increased interactions overlap H4K20me3 chromatin immunoprecipitation (ChIP)-enriched peaks, while 80% of differential anchor points with decreased interactions overlap H4K20me3 peaks (Fig. 4C), further suggesting that depletion of SUV420H2 and loss of H4K20me3 are associated with dysregulated chromatin interactions. We next sought to investigate whether loss of H4K20me3 in SUV420H2 KO ES cells is associated with differential anchor points. A comparison of H4K20me3 levels at differential anchor points in WT and SUV420H2 KO ES cells demonstrated that H4K20me3 levels decrease at differentiation anchor points with increased or decreased chromatin interactions (Fig. 4D). We also found that several GO terms of DE genes between WT and SUV420H2 KO ES cells were strongly enriched around differential anchor points (within 10 kb). DAVID GO annotation of upregulated or downregulated genes located around differential anchor points in SUV420H2 KO ES cells found the genes to be associated with GO terms such as ‘development’, ‘differentiation’ and ‘morphogenesis’ (Fig. 4E). A representative region of differential chromatin interactions and decreased H4K20me3 in SUV420H2 KO ES cells is shown in Fig. 4F.
Fig. 4.
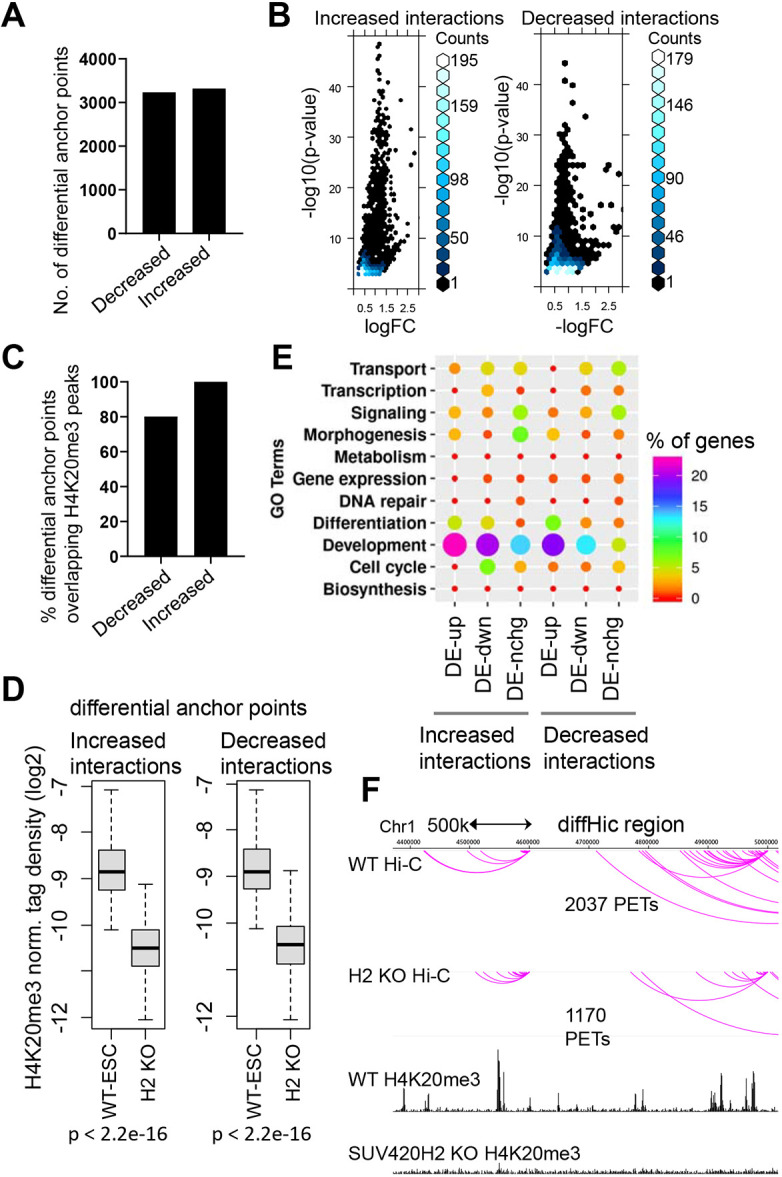
Identification of differential chromatin interactions in SUV420H2 KO ES cells. (A) Differential chromatin interactions between WT and SUV420H2 KO ES cells were identified using diffHic. The number of differential anchor points with decreased or increased chromatin interactions in SUV420H2 KO ES cells relative to WT ES cells is shown. (B) Scatter plot showing the log fold change (logFC) and P-value (–log10) of differential chromatin interactions between WT and SUV420H2 KO ES cells. (C) Overlap between H4K20me3 ChIP-enriched peaks and differential anchor points. The percentage of anchor points with increased or decreased chromatin interactions that overlap H4K20me3 ChIP-enriched peaks is shown. (D) Boxplots of H4K20me3 density near differential anchor points with increased (left) or decreased (right) chromatin interactions in SUV420H2 KO ES cells relative to WT ES cells. Boxplots indicate the 25th and 75th percentiles, and the median. (E) DAVID GO functional annotation of upregulated genes (DE-up), downregulated genes (DE-dwn) or genes with no expression change (DE-nchg) near differential achor points (within 10 kb) in SUV420H2 KO ES cells. (F) Browser view of the arc plot depicting differential chromatin interactions at H4K20me3-marked regions in SUV420H2 KO ES cells.
Altered compartmentalization and insulation in SUV420H2-depleted ES cells
To explore the relationship between decreased H4K20me3 and alterations in chromatin accessibility in SUV420H2 KO ES cells, we quantitated and visualized compartment strength by plotting interaction frequencies along the first eigenvector (PC1) to generate compartmentalization saddle plots (Fig. 5A), which have been described previously (Flyamer et al., 2017). The upper-left quadrant of the saddle plots in Fig. 5A represents B-B interactions and the lower-right corner represents A-A interactions. These results reveal variation in the strength of interactions as a function of the compartment vector between WT and SUV420H2 KO ES cells, where strength of B-B interactions was somewhat decreased in SUV420H2 KO ES cells. To further compare variation in compartment strength, we generated a saddle plot by calculating the ratio of interaction frequencies as a function of the compartment vector between SUV420H2 KO and WT ES cells (Fig. 5B). These results further highlight alterations in B-B interactions in SUV420H2 KO ES cells relative to WT ES cells.
Fig. 5.

Disruption of chromatin insulation in SUV420H2-deficient ES cells. (A) Compartmentalization saddle plots of Hi-C data for WT and SUV420H2 KO ES cells. Saddle plots were calculated using cooltools (Gibcus et al., 2018). Average intra-chromosomal interaction frequencies were normalized by expected interaction frequency and distance. Bins were sorted by eigenvector PC1 values. B-B interactions are located in the upper-left corner of saddle plots and A-A interactions are located in the lower-right corner. (B) Compartmentalization saddle plot of the ratio of average distance-normalized intra-chromosomal interaction frequencies between SUV420H2 KO and WT ES cells. (C) Scatter plot showing flipped A/B compartment scores in WT and SUV420H2 KO ES cells. (D) WashU browser view of compartment A/B PC1 patterning in chromosome 6. Compartment A/B patterns are shown at 50 kb resolution. Positive PC1 values correspond to compartment A; negative values correspond to compartment B. (E) GREAT gene ontology (GO) analysis of regions with flipped compartment values in SUV420H2 KO ES cells. CNA, copy number alterations. (F) Comparison of insulation scores near all WT domains (within 10 kb) in WT and SUV420H2 KO ES cells. Scatter plot shows log2 insulation scores. (G,H) Boxplot (G) and average profile (H) showing density of H4K20me3 at WT domain boundaries (within 10 kb) with flipped insulation scores in SUV420H2 KO ES cells. (I) Comparison of insulation scores near WT loop boundaries. Scatter plot shows log2 insulation scores. (J) WashU Epigenome browser view of a representative region of altered insulation and decreased H4K20me3 in SUV420H2 KO ES cells, and CTCF binding in ES cells. (K) Boxplot showing CTCF density at regions of flipped insulation scores between WT and SUV420H2 KO ES cells. (L) Boxplot showing CTCF density at differential domain boundaries (WT-decrKO, domains enriched in WT ES cells but decreased in SUV420H2 KO ES cells; KO-decrWT, domains enriched in SUV420H2 KO ES cells but decreased in WT ES cells). Boxplots indicate the 25th and 75th percentiles, and the median.
We also observed compartment A/B switching at a subset of genomic sites (Fig. 5C), suggesting that SUV420H2 depletion-mediated loss of H4K20me3 leads to variable chromatin configurations. A representative genomic region with switched A/B compartments is shown in Fig. 5D. Functional annotation of regions with flipped compartment scores using GREAT revealed enrichment of GO terms such as ‘regulation of epithelial cell differentiation’, ‘metabolic processes’ and ‘sensory perception of taste’. We also found that genes near flipped A/B compartments in SUV420H2 KO ES cells were upregulated in multiple cancers, and were identified in a copy number alterations study of 191 breast tumor samples (Fig. 5E), suggesting that SUV420H2-mediated regulation of A/B compartments might safeguard the integrity of the expression of genes involved in development and cancer formation.
We next sought to investigate whether loss of H4K20me3 disrupted insulation of chromatin boundaries in SUV420H2 KO ES cells, as contact maps and compartment signals indicated that genomic arrangement of A/B compartments is perturbed upon loss of SUV420H2 and H4K20me3. An evaluation of genome-wide insulation scores at domain boundaries (within 10 kb) revealed regions of altered insulation (Fig. 5F). In addition, we observed decreased H4K20me3 levels at these regions in SUV420H2 KO ES cells (Fig. 5G,H). H4K20me3 levels were similarly depleted at regions of altered insulation in SUV420H2 KO ES cells relative to genome-wide levels of H4K20me3 in SUV420H2 KO ES cells (Fig. 2C). Moreover, 72% of WT domains were enriched with H4K20me3 at boundary regions in WT ES cells. These results demonstrate that depletion of SUV420H2 is associated with dysregulated insulation in a subset of regions with decreased H4K20me3. We further explored the role of SUV420H2 in regulating insulation of chromatin loops, and similarly observed alterations in genome-wide chromatin insulation (Fig. 5I).
We also evaluated the length of regions with positive or negative insulation scores in WT and SUV420H2 KO ES cells. Results from these analyses show that the average length of regions with positive insulation scores in WT and SUV420H2 KO ES cells is 389 kb and 342 kb, respectively, while the average length of regions with negative insulation scores in WT and SUV420H2 KO ES cells is 359 kb and 315 kb, respectively (P=6.3×10⁻⁶) (Fig. S7A,B).
Moreover, we evaluated binding of the chromatin insulator, CTCF, which is required for insulation of TAD domains (Nora et al., 2017) and frequently demarcates TAD boundaries (Dixon et al., 2012). Inspection of a WashU Epigenome browser view showed enrichment of CTCF and H4K20me3 near regions of decreased insulation in SUV420H2 KO ES cells (Fig. 5J). To investigate a correlation between domain boundaries demarcated by CTCF and gained or lost insulation, we evaluated CTCF binding (Chen et al., 2008) in regions with flipped insulation in WT and SUV420H2 KO ES cells. We observed that, in SUV420H2 KO ES cells, CTCF binding was higher in regions with decreased insulation than in regions with increased insulation (Fig. 5K). We also evaluated CTCF occupancy at differential domain boundaries, identified using TADCompare, with gained or lost insulation (flipped insulation scores) in WT and SUV420H2 KO ES cells. In SUV420H2 KO ES cells, CTCF binding was higher in regions with increased enrichment of domain boundaries than in regions with decreased enrichment of domain boundaries (Fig. 5L). Combined, these results suggest that cis interactions between proximal H4K20me3-interacting regions might serve as a chromatin insulator, where loss of SUV420H2 leads to reduced H4K20me3 and altered insulation. Moreover, decreased chromatin interactions at regions of reduced insulation might reflect localized decondensation without a gain in cis interactions.
Loss of H4K20me3 causes changes in chromatin interactions
To evaluate whether loss of H4K20me3 in SUV420H2 KO ES cells leads to changes in interactions between local and distal chromatin regions across entire chromosomes, we calculated the frequency of distal and intrachromosomal interactions (external) with local (internal) contacts, which has been named the open chromatin index (OCI) (Chandra et al., 2015) (Fig. 6A). We calculated the ratio of these interactions in windows across the genome, which were normalized for each chromosome by subtracting the median chromosome value from each window, and then smoothed the values across a moving 20 Mb window. The OCI metric provides insight into the tendency for a region to interact with local or distal regions. We observed genome-wide changes in OCI values in SU420H2 KO ES cells relative to WT ES cells. To investigate whether regions with increased OCI values in SUV420H2 KO ES cells is associated with chromatin accessibility, we correlated OCI and DNase I accessibility values (Fig. 6B, top). These results suggest that regions with relatively lower OCI values, which exhibit more condensed chromatin with elevated local interactions and lower DNase I accessibility, experience increased interactions in SUV420H2 KO ES cells. We also evaluated whether underlying DNA sequence composition is correlated with altered OCI values. To this end, we correlated GC content and OCI scores across all windows in the genome. Results from this analysis demonstrated a strong correlation between regions gaining external contacts and with low GC content in SUV420H2 KO ES cells (Fig. 6B, bottom). These results demonstrate that regions with increased OCI values in SUV420H2 KO ES cells have lower GC content, further suggesting localized decondensation of chromatin in SUV420H2-depleted ES cells. Visualization of OCI calculations revealed increased OCI values near pericentric regions and surrounding regions for multiple chromosomes in SUV420H2 KO ES cells (Fig. 6C), suggesting decreased local interactions resulting from chromatin decondensation and increased long-range contacts. In addition, we observed decreased H4K20me3 levels at flipped OCI regions in SUV420H2 KO ES cells (Fig. 6D). We also observed elevated levels of H4K20me3 in WT ES cells in regions that exhibit flipped OCI scores in SUV420H2 KO ES cells (Fig. 6D), demonstrating a correlation between decreased H4K20me3 and altered OCI values. Because we observed increased OCI values near centromere regions for multiple chromosomes in SUV420H2 KO ES cells (Fig. 6C), we investigated the relationship between changes in OCI values and distance from centromere regions. Plotting the change in OCI values in SUV420H2 KO ES cells relative to WT ES cells showed that sequences near centromere regions exhibited greater increases in OCI values relative to more distal sequences (Fig. 6E). Moreover, GREAT functional annotation of regions with flipped OCI values in SUV420H2 KO ES cells revealed that genes within these regions were identified in a copy number alterations study of 191 breast tumor samples (Fig. 6F), indicating a role for SUV420H2 in the transcription silencing of genes for which expression and copy number are correlated with human cancers.
Fig. 6.

Evaluation of changes in local and distal interactions reveal altered chromatin contacts near centromeres. (A) Schematic (top) of the open chromatin index (OCI), which describes the ratio of chromatin contacts between local and to distal regions. (B) Scatter plots comparing global OCI values in WT and SUV420H2 KO ES cells. Points are colored by DNase I accessibility (top; norm. tag density) and GC content (bottom). (C) Browser view of OCI calculations near centromere and flanking regions in WT and SUV420H2 KO ES cells. (D) Boxplots of H4K20me3 densities (log2) at regions with flipped OCI values in SUV420H2 KO ES cells (left) and at all regions (right). Boxplots indicate the 25th and 75th percentiles and the median. (E) Relationship between change in OCI in SUV420H2 KO versus WT ES cells and distance from chromosome start (Mb). Note that pericentromeric and surrounding regions exhibit an increased OCI in SUV420H2 KO ES cells. (F) GREAT GO analysis of regions with altered OCI values in SUV420H2 KO ES cells.
Disrupted connectivity between H4K20me3 and gene-regulatory elements in SUV420H2-depleted ES cells
To investigate whether connectivity between H4K20me3-marked chromatin regions and proximal or distal H4K20me3 regions, or gene-regulatory regions, is perturbed in SUV420H2 KO ES cells, we calculated the number of interacting paired-end tags (PETs) between intrachromosomal H4K20me3-H4K20me3-marked regions, between H4K20me3 and enhancers (enhancer-H4K20me3), and between H4K20me3 and promoter (promoter-H4K20me3) regions. An evaluation of inter-H4K20me3 domain connectivity (H4K20me3-H4K20me3) revealed 2373 interactions with decreased connectivity and 613 interactions with increased connectivity (Fig. 7A,B), suggesting that SUV420H2-mediated depletion of H4K20me3 leads to a loss of local contacts. Moreover, the decrease in connectivity was correlated with decreased H4K20me3 levels (Fig. 7C). We also observed decreased connectivity between enhancers and H4K20me3-marked regions. Enhancers were defined by intergenic regions occupied by P300 (Ep300) (Visel et al., 2009), previously reported as proxies for enhancers, and H3K27ac, which marks active enhancers. Our findings show that 1130 interactions had decreased connectivity and only 91 interactions had increased connectivity (Fig. 7D,E). Also, the decrease in connectivity was correlated with decreased H4K20me3 levels (Fig. 7F). These findings suggest that H4K20me3 might block interactions between enhancers and nearby genes. Likewise, our results reveal decreased connectivity between promoters and H4K20me3-marked regions: we observed 1510 interactions with decreased connectivity but only 148 interactions with increased connectivity (Fig. 7G,H). Consistent with our results on inter-H4K20me3 and enhancer-H4K20me3 connectivity, we observed a correlation between decreased connectivity and decreased H4K20me3 levels (Fig. 7I). Next, we investigated a correlation between decreased promoter-H4K20me3 connectivity and dysregulated gene expression in SUV420H2 KO ES cells. We observed downregulation of a subset of relatively highly expressed genes with decreased connectivity in SUV420H2 KO ES cells (Fig. 7J), and upregulation of a subset of genes with lower expression. DAVID functional annotation showed that upregulated genes were enriched with GO terms such as ‘metabolic processes’, ‘regulation of transcription’ and ‘regulation of gene expression’, whereas downregulated genes were enriched with GO terms such as ‘organ formation’, ‘metabolic processes’, ‘development’ and ‘regulation of transcription’. These findings indicate a role for SUV420H2 and H4K20me3 in the silencing or dampening of gene expression by looping of compact chromatin. These findings also suggest a potentially new role for H4K20me3 as a transcriptional activator in a subset of genes.
Fig. 7.

Disruption of interactions between H4K20me3 and gene-regulatory elements in SUV420H2 KO ES cells. (A) Number of increased or decreased H4K20me3-H4K20me3 interactions in SUV420H2 KO ES cells [>10 interacting paired-end tags (PETs), fold change>2]. (B) ECDF function of PET density at regions with decreased (left) or increased (right) H4K20me3-H4K20me3 interactions. P-values were calculated using the Kolmogorov–Smirnov test. (C) Boxplots showing the relationship between fold change in H4K20me3 densities (left) and fold change in H4K20me3-H4K20me3-interacting PET densities (right) in SUV420H2 KO ES cells relative to WT ES cells. (D) Number of increased or decreased enhancer-H4K20me3 interactions in SUV420H2 KO ES cells. (E) ECDF function of PET density at regions with decreased (left) or increased (right) enhancer-H4K20me3 interactions. (F) Boxplots showing the relationship between fold change in H4K20me3 densities (left) and fold change in enhancer-H4K20me3-interacting PET densities (right). (G) Number of increased or decreased promoter-H4K20me3 interactions in SUV420H2 KO ES cells. (H) ECDF function of PET density at regions with decreased (left) or increased (right) promoter-H4K20me3 interactions. (I) Boxplots showing the relationship between fold change in H4K20me3 densities (left) and fold-change in promoter-H4K20me3 interacting PET densities (right). (J) Boxplots showing the expression of downregulated (left) and upregulated (right) genes in SUV420H2 KO ES cells with decreased promoter-H4K20me3 interactions. Boxplots indicate the 25th and 75th percentiles and the median. (K) Venn diagram showing overlap between H4K20me3 and OCT4 occupancy in ES cells. (L) PE-SCAn analysis showing long-range intrachromosomal Hi-C contacts (>5 Mb) correlated with OCT4 binding sites clusters (more than five sites in a 50 kb window) in WT and SUV420H2 KO ES cells.
Pluripotent ES cells have unique connectivity profiles (de Wit et al., 2013; Krijger et al., 2016), which include long-range cis contacts between clusters of the core pluripotency transcription factors OCT4 (POU5F1), NANOG and SOX2. To investigate whether H4K20me3 is enriched at OCT4 binding sites, we compared ChIP-Seq regions occupied by H4K20me3 and OCT4, and observed that 14% of H4K20me3 sites were co-occupied by OCT4 (Fig. 7K). To investigate whether depletion of SUV420H2 leads to a disruption of these interactions, we performed paired-end spatial chromatin analysis (PE-SCAn) (de Wit et al., 2013), which integrates ChIP-Seq and Hi-C data. PE-SCAn evaluation of OCT4-enriched regions revealed minor decreases in long-range interactions (Fig. 7L), suggesting that depletion of SUV420H2 and loss of H4K20me3 does not fully collapse chromatin folding of clusters of pluripotency factor binding sites.
DISCUSSION
SUV420H enzymes regulate ES cell differentiation
Here, we have investigated the role of the H4K20 methyltransferase SUV420H2 in regulating ES cell differentiation, gene expression and chromatin interactions in ES cells. H4K20me3 is implicated in controlling heterochromatin formation (Schotta et al., 2004, 2008), and is enriched at genomic sequences containing endogenous retroelements (Kidder et al., 2017b). Our results identify specific roles for SUV420H2 in regulating ES cell differentiation and patterning the epigenetic landscape. We found that SUV420H2-deficient ES cells exhibited a near-complete loss of global H4K20me3 distributions. Moreover, depletion of SUV420H2 resulted in alterations in gene expression, accompanied by delayed differentiation. An examination of WT, SUV420H2 KO and SUV420H1/H2 DKO ES cell transcriptomes revealed genes with enriched expression in undifferentiated ES cells. However, we did not observe a full collapse of the pluripotent transcriptional network in SUV420H2 KO or SUV420H1/H2 DKO ES cells, as an evaluation of RNA-Seq data using PCA demonstrated that SUV420H2 KO or SUV420H1/H2 DKO ES cells clustered closer to WT ES cells than to differentiated ES cells (Fig. 1I). Our results describing an important role for SUV420H2 in differentiation is in alignment with a previous study that demonstrated that SUV420H2 regulates developmental circuits in Xenopus embryos (Nicetto et al., 2013). Moreover, the delayed differentiation of SUV420H2 KO and SUV420H1/H2 DKO ES cells is consistent with another previous study, which found that loss of SUV420H1 or SUV420H1/H2 in mice leads to smaller litter sizes and delayed development, but does not lead to complete lethality (Schotta et al., 2008). Together, our results suggest that SUV420H2 is a key regulator of H4K20me3 during ES cell differentiation, where SUV420H2 acts to reset the transcriptional landscape during differentiation. In support of this model, we established a metric to quantify the relative differentiation of SUV420H2 KO and SUV420H1/H2 DKO ES cells by evaluating expression in undifferentiated versus differentiated ES cells. Results from these analyses demonstrate that SUV420H2 KO and SUV420H1/H2 DKO ES cells exhibit dysregulated differentiation relative to WT cells. These findings suggest that SUV420H enzymes play a crucial role in facilitating expression programs that promote differentiation and deactivation of pluripotency networks.
SUV420H2 silences endogenous retroelements in ES cells
Our results also demonstrate that SUV420H2 and H4K20me3 are enriched at DNA sequences containing endogenous retroelements, and depletion of SUV420H2 leads to de-repression of these elements. Perturbation of the repressive histone modification, H4K20me3, and the chromatin constituent SUV420H2, might induce localized decondensation of chromatin and de-repressed transcription of the associated underlying repetitive DNA sequences. Along this line, we observed decreased H4K20me3 levels at LTR and LINE repetitive elements in SUV420H2 KO and SUV420H1/H2 DKO ES cells (Fig. 2I), which was accompanied by upregulated expression of LTR and LINE elements (Fig. 2K). Previous reports have also demonstrated a role for repressive histone modifications and chromatin constituents in silencing ERVs in ES cells (Karimi et al., 2011; Kidder et al., 2017b; Macfarlan et al., 2012; Maksakova et al., 2013). Our model suggests that repetitive DNA elements recruit SUV420H2 to keep them silenced, and depletion of SUV420H2 relieves the silencing of these genes and thus induces differentiation. SUV420H2-dependent silencing of ERVs could also prevent their activation during early development.
SUV420H2 regulates chromatin architecture in ES cells
In addition, we describe a mechanism whereby SUV420H2 regulation of H4K20me3 controls chromatin architecture in ES cells. Using Hi-C, we generated a comprehensive 3D chromatin landscape map of genome-wide spatial changes in SUV420H2 KO ES cells relative to WT ES cells. Although SUV420H2 and H4K20me3 are both associated with heterochromatin, we have uncovered new H4K20me3 interactions between gene-regulatory regions in ES cells. We also identified changes in A/B compartment status in SUV420H2-deficient ES cells. The conversion from an inactive B to an active A compartment occurred at regions enriched with H4K20me3 in WT ES cells, but depleted in SUV420H2 KO ES cells. These findings suggest that H4K20me3 plays an active role in demarcating active and inactive chromatin. Our results also suggest that the maintenance of heterochromatin domains in ES cells is reinforced by deposition of the repressive histone modification H4K20me3. In addition, we observed alterations in chromatin insulation in SUV420H2-depleted ES cells. Results from our analyses demonstrate that the length of regions with negative and positive insulation scores decreases in SUV420H2 KO ES cells (Fig. S7). These findings are consistent with the results shown in Fig. 3C, which demonstrate an increase in the number of contact domains in SUV420H2 KO ES cells relative to WT ES cells. As the insulation score is calculated from the average of interaction frequencies crossing over it (within a genomic range), where the local minimum is used to determine insulation regions and domain boundaries (Lajoie et al., 2015), a decrease in the length of regions with positive/negative insulation scores is consistent with an increased number of domains and insulators. The increased number of insulators and domains might interfere with or reduce long-range interactions, and lead to dysregulated insulation at domain boundaries.
Moreover, localized changes in chromatin interactions between H4K20me3 and gene-regulatory regions might reflect alterations in chromatin accessibility, or a combination of alterations in condensation-level and long-range cis chromatin contacts. Compact chromatin domains may appear as enrichment of localized chromatin contacts in WT ES cells, while decondensation of these regions might lead to increased or decreased local chromatin contacts in SUV420H2-depleted ES cells. Increased chromatin contacts may represent a gain of interactions with gene-regulatory regions, whereas decreased contacts may indicate decondensation in the absence of additional interactions with surrounding gene-regulatory regions. The latter scenario could represent a two-step process in which heterochromatin decondensation is followed by localized programming of de novo chromatin interactions. Our results demonstrate that depletion of SUV420H2 leads to an increase in connectivity in pericentromeric and surrounding regions. These results are consistent with SUV420H2-mediated deposition of H4K20me3 in pericentromeric regions (Sanders et al., 2004; Schotta et al., 2008). Our results also uncover new chromatin interactions resulting from the depletion of SUV420H2 in ES cells.
Conclusions
In summary, our findings demonstrate an important role for SUV420H2 in regulating ES cell differentiation, silencing of retroelements and chromatin interactions. We propose that concerted genome-wide patterning of H4K20me3 by SUV420H2 reinforces heterochromatin domains by establishing an epigenetic barrier, thus preventing spurious chromatin interactions between gene-regulatory regions.
MATERIALS AND METHODS
ES cell culture
WT genetically matched, SUV420H2 KO and SUV420H1/H2 DKO mouse ES cells were kindly provided by Dr Gunnar Schotta (LMU Munich, Germany) and subsequently cultured on irradiated mouse embryonic fibroblasts in Dulbecco's modified Eagle medium (DMEM) containing 15% fetal bovine serum (FBS), LIF (ESGRO), non-essential amino acids, glutamine, penicillin/streptomycin and 2-mercaptoethanol (1×, cell culture grade) at 37°C with 5% CO2. For Hi-C experiments, ES cells were cultured on gelatin-coated dishes in ES cell medium containing 1.5 µM CHIR9901 (GSK3 inhibitor) for several passages to remove feeder cells. ES cells were passed by washing with PBS, and dissociating with trypsin using serological pipettes (sc-200279 and sc-200281, Santa Cruz Biotechnology). For EB differentiation, ES cells were cultured on low-binding dishes to induce 3D formation in LIF-independent ES cell medium.
RNA-Seq analysis
Total RNA was prepared from ES cells and subjected to RNA-Seq as previously described, with minor modifications (He and Kidder, 2017; Kidder et al., 2017a,b, 2013, 2014). Briefly, total RNA was prepared from ES cells and differentiated EBs using a Qiagen RNeasy kit. RNA-Seq libraries were prepared using the NEBNext Ultra II RNA Library Prep Kit for Illumina and sequenced on an Illumina platform by Novogene. The RPKM measure as described previously (Mortazavi et al., 2008) was used to quantitate mRNA expression levels of genes from the RNA-Seq data. DE genes were identified using EdgeR (FDR<0.001, fold change>1.5) (Robinson et al., 2009). The UCSC genome browser was used to visualize RNA-Seq data. For calculation of the DI, we quantified the relative ratio of RNA-Seq expression (RPKM) of genes associated with the GO terms ‘development’ or ‘differentiation’, and with expression upregulated >1.5-fold in WT EBs (day 8 or day 12) relative to WT ES cells, in differentiated EBs relative to undifferentiated ES cells.
ChIP-Seq
ChIP-Seq analysis was performed as described previously (He and Kidder, 2017; Kidder et al., 2013, 2011, 2014). The polyclonal H4K20me3 antibody (07-463) was obtained from Millipore and the polyclonal GFP antibody (ab290) was obtained from Abcam. Briefly, ES cells were fixed with 1% formaldehyde in 10% FBS/DMEM for 10 min at 37°C, sonicated, and ChIP was performed using an antibody directed against H4K20me3 or GFP (SUV420H2-GFP). ChIP-enriched DNA was subjected to end repair using the End-It DNA End-Repair kit (Epicentre). Next, sequencing libraries were prepared by addition of a single A nucleotide, ligation of adapters, and PCR using Phusion High Fidelity PCR master mix. ChIP libraries were sequenced on an Illumina HiSeq platform. Sequence reads were mapped to the mouse genome (mm9) using bowtie2 (Langmead and Salzberg, 2012). ChIP-enriched peaks were identified relative to Input DNA (sonicated chromatin) as described previously (He and Kidder, 2017; Kidder et al., 2014; Xu et al., 2014; Zang et al., 2009). Briefly, ChIP-enriched peaks were identified using ‘Spatial Clustering for Identification of ChIP-Enriched Regions’ (SICER) (Zang et al., 2009) with a window size setting of 200 bps, a gap setting of 400 bps and an FDR setting of 0.001. For a comparison of ChIP enrichment between samples, a fold change threshold of 1.5 and an FDR setting of 0.001 were used. The read per base per million reads (RPBM) measure was used to quantitate the density of histone modification and Input DNA at specific genomic regions from ChIP-Seq datasets. We applied the Kolmogorov–Smirnov test to obtain P-value statistics and compare densities at genomic regions.
Hi-C analysis
In situ Hi-C was performed for biological replicates of WT and SUV420H2 KO ES cells using the Arima-HiC kit (Arima Genomics Inc) as described by the manufacturer. Hi-C libraries were subsequently subjected to Illumina paired-end sequencing. Next, Juicer was utilized to convert the raw sequencing data to a hic file containing normalized Hi-C contact matrices (Durand et al., 2016b). Briefly, Hi-C sequencing data were processed using Juicer (Durand et al., 2016b), which utilizes a pipeline consisting of BWA-MEM (Burrows-Wheeler Alignment Tool) (Li, 2013 preprint; Li and Durbin, 2010) to map each read separately to the mm9 reference genome. Redundant duplicates and reads that map to the same fragment were removed as well. Reads are assigned a restriction fragment based on 4 bp cutters used in the Arima HiC kit (^GATC, G^ANTC). Mate pairs were then sorted and merged into a large file with duplicates removed.
Hi-C domain analysis
Contact matrices were generated at a resolution of 5 kb. Arrowhead matrix transformation (Durand et al., 2016b; Rao et al., 2014) was used to annotate global contact domains, and a Juicebox-loadable file was generated to visualize contact domains in Juicebox. Loop domains were identified using the Juicer (Durand et al., 2016b) implementation of the HiCCUPS algorithm (Rao et al., 2014). Differential loops were identified using Juicer HiCCUPSDiff. Aggregate pile-up analysis of domains and loops was performed using coolpup.py (Flyamer et al., 2020), which is a variation of the aggregate domain analysis approach described previously (Flyamer et al., 2017). Pile-up analysis of domains and loops was performed at 10 kb and 5 kb resolution of the contact matrix, respectively, using coverage normalization.
Hi-C compartment analysis
A/B compartments were identified at a resolution of 50 kb using Juicer (Durand et al., 2016b). The Knight-Ruiz (KR)-normalized eigenvector was used to determine A/B compartments. We defined compartment flipping as an A-to-B or B-to-A flip event. Genes associated with flipped compartments were defined by an overlap of the gene body with a genomic region containing a flipped genomic region. Genes were annotated using GREAT (McLean et al., 2010).
Saddle plots were generated using cooltools (https://cooltools.readthedocs.io/en/latest/notebooks/04_saddle-plots.html). The compartment strength was quantitated using the average intra-chromosomal interaction frequencies within genomic bins of 250 kb normalized by genomic distance (observed/expected HiC maps). Next, interaction bins that were distance corrected and sorted by eigenvector PC1 value in ascending order. All intra-chromosomal interactions with similar PC1 values were combined to generate compartmentalization saddle plots. In saddle plots, B-B interactions are located in the upper-left corner and A-A interactions are located in the lower-right corner.
Identification of differential interactions using diffHic
Differential interactions between WT and SUV420H2 KO ES cells were evaluated using the Bioconductor diffHic R package (Lun and Smyth, 2015), which uses the generalized linear model (GLM) functionality of edgeR (Robinson et al., 2009) and performs normalization for library-specific biases. Paired-end reads were mapped to the mm9 genome, resolution of WT and SUV420H2 KO ES cell datasets were matched by re-sampling to the same resolution, low-abundance reads were removed, and normalization of trended or copy number variation-driven biases was performed. DiffHic uses the GLM functionality of edgeR (Robinson et al., 2009) to model biological variability and to interrogate statistically significant differences in chromatin interactions.
Hi-C insulation score analysis
Genome-wide insulation scores were calculated at 25 kb resolution using insulation_score.R from GENome Organisation Visual Analytics (GENOVA) (https://github.com/deWitLab/GENOVA). We defined insulation switching as a positive-to-negative or a negative-to-positive insulation score flip event.
Calculation of the OCI
The OCI was calculated as described previously (Chandra et al., 2015). Briefly, OCI values were calculated using SeqMonk (https://www.bioinformatics.babraham.ac.uk/projects/seqmonk/). First, moving windows were generated across the genome, and raw Hi-C PET counts were calculated for each window and the cis/trans quantitation method was applied. Next, the chromosomal median values were subtracted from all windows, and the smoothing subtraction quantitation was applied using a 20 Mb window to normalize bias across the chromosome.
Percentage GC content and DNase I hypersensitivity plots
The percentage GC content of genomic windows for OCI analyses was calculated using bedtools (https://bedtools.readthedocs.io/en/latest/). GC content was used to color OCI scatter plot points. DNase I hypersensitivity data from ES cells were downloaded from NCBI Gene Expression Omnibus (GEO) (GSM1014154) and aligned to the mm9 reference genome using bowtie2. The RPBM measure was used to quantify DNase I densities at specific genomic regions. DNase I hypersensitivity was used to color OCI scatter plots.
Counting interacting PETs
We quantified the number of PETs between interacting regions using a custom script available on request.
Alignment of Hi-C data to ChIP-Seq peaks (PE-SCAn)
Cis intrachromosomal Hi-C interactions spanning greater than 5 Mb were aligned to ChIP-Seq data as described previously (de Wit et al., 2013; Krijger et al., 2016). Briefly, GENOVA (https://github.com/deWitLab/GENOVA) was used to perform the PE-SCAn. OCT4 data from ES cells (Whyte et al., 2013) (GSM1082340) were used for the analysis.
WashU Epigenome Browser
Visualization of Hi-C interaction matrix data and PETs was performed using a local installation of the WashU Epigenome Browser (Zhou et al., 2013). Visualization of interactions between gene-regulatory regions was facilitated using arc plots and density plots in the WashU browser.
Supplementary Material
Acknowledgements
This work utilized the Wayne State University High Performance Computing Grid for computational resources (https://tech.wayne.edu/hpc). The New York University Langone Medical Center Genome Technology Center assisted with this work. We thank Lijin Gopi for assistance with some computational analyses and Dr Anthony Schmitt for helpful discussions.
Footnotes
Competing interests
The authors declare no competing or financial interests.
Author contributions
Conceptualization: B.L.K.; Methodology: Z.H., W.J., B.L.K.; Software: Z.H., W.J.; Validation: B.L.K.; Formal analysis: J.T.K., B.L.K.; Investigation: B.L.K.; Resources: B.L.K.; Data curation: B.L.K.; Writing - original draft: B.L.K.; Writing - review & editing: B.L.K.; Visualization: B.L.K.; Supervision: W.J., B.L.K.; Project administration: B.L.K.; Funding acquisition: B.L.K.
Funding
This work was supported by Wayne State University, Karmanos Cancer Institute and the National Heart, Lung, and Blood Institute (1K22HL126842-01A1 awarded to B.L.K.). Deposited in PMC for release after 12 months.
Data availability
The sequencing data from this study are available at NCBI GEO (http://www.ncbi.nlm.nih.gov/geo) under accession number GSE130723.
Supplementary information
Supplementary information available online at https://dev.biologists.org/lookup/doi/10.1242/dev.188516.supplemental
Peer review history
The peer review history is available online at https://dev.biologists.org/lookup/doi/10.1242/dev.188516.reviewer-comments.pdf
References
- Beck D. B., Oda H., Shen S. S. and Reinberg D. (2012). PR-Set7 and H4K20me1: at the crossroads of genome integrity, cell cycle, chromosome condensation, and transcription. Genes Dev. 26, 325-337. 10.1101/gad.177444.111 [DOI] [PMC free article] [PubMed] [Google Scholar]
- Blahnik K. R., Dou L., Echipare L., Iyengar S., O'Geen H., Sanchez E., Zhao Y., Marra M. A., Hirst M., Costello J. F. et al. (2011). Characterization of the contradictory chromatin signatures at the 3′ exons of zinc finger genes. PLoS ONE 6, e17121 10.1371/journal.pone.0017121 [DOI] [PMC free article] [PubMed] [Google Scholar]
- Botuyan M. V., Lee J., Ward I. M., Kim J.-E., Thompson J. R., Chen J. and Mer G. (2006). Structural basis for the methylation state-specific recognition of histone H4-K20 by 53BP1 and Crb2 in DNA repair. Cell 127, 1361-1373. 10.1016/j.cell.2006.10.043 [DOI] [PMC free article] [PubMed] [Google Scholar]
- Chandra T., Ewels P. A., Schoenfelder S., Furlan-Magaril M., Wingett S. W., Kirschner K., Thuret J.-Y., Andrews S., Fraser P. and Reik W. (2015). Global reorganization of the nuclear landscape in senescent cells. Cell Rep. 10, 471-483. 10.1016/j.celrep.2014.12.055 [DOI] [PMC free article] [PubMed] [Google Scholar]
- Chen X., Xu H., Yuan P., Fang F., Huss M., Vega V. B., Wong E., Orlov Y. L., Zhang W., Jiang J. et al. (2008). Integration of external signaling pathways with the core transcriptional network in embryonic stem cells. Cell 133, 1106-1117. 10.1016/j.cell.2008.04.043 [DOI] [PubMed] [Google Scholar]
- Cresswell K. G. and Dozmorov M. G. (2020). TADCompare: an R package for differential and temporal analysis of topologically associated domains. Front. Genet. 11, 158 10.3389/fgene.2020.00158 [DOI] [PMC free article] [PubMed] [Google Scholar]
- de Wit E., Bouwman B. A. M., Zhu Y., Klous P., Splinter E., Verstegen M. J. A. M., Krijger P. H. L., Festuccia N., Nora E. P., Welling M. et al. (2013). The pluripotent genome in three dimensions is shaped around pluripotency factors. Nature 501, 227-231. 10.1038/nature12420 [DOI] [PubMed] [Google Scholar]
- Dekker J. and Heard E. (2015). Structural and functional diversity of Topologically Associating Domains. FEBS Lett. 589, 2877-2884. 10.1016/j.febslet.2015.08.044 [DOI] [PMC free article] [PubMed] [Google Scholar]
- Denker A. and de Laat W. (2016). The second decade of 3C technologies: detailed insights into nuclear organization. Genes Dev. 30, 1357-1382. 10.1101/gad.281964.116 [DOI] [PMC free article] [PubMed] [Google Scholar]
- Dennis G. Jr, Sherman B. T., Hosack D. A., Yang J., Gao W., Lane H. C. and Lempicki R. A. (2003). DAVID: Database for Annotation, Visualization, and Integrated Discovery. Genome Biol. 4, P3 10.1186/gb-2003-4-5-p3 [DOI] [PubMed] [Google Scholar]
- Dixon J. R., Selvaraj S., Yue F., Kim A., Li Y., Shen Y., Hu M., Liu J. S. and Ren B. (2012). Topological domains in mammalian genomes identified by analysis of chromatin interactions. Nature 485, 376-380. 10.1038/nature11082 [DOI] [PMC free article] [PubMed] [Google Scholar]
- Dixon J. R., Gorkin D. U. and Ren B. (2016). Chromatin domains: the unit of chromosome organization. Mol. Cell 62, 668-680. 10.1016/j.molcel.2016.05.018 [DOI] [PMC free article] [PubMed] [Google Scholar]
- Durand N. C., Robinson J. T., Shamim M. S., Machol I., Mesirov J. P., Lander E. S. and Aiden E. L. (2016a). Juicebox provides a visualization system for Hi-C contact maps with unlimited zoom. Cell Syst. 3, 99-101. 10.1016/j.cels.2015.07.012 [DOI] [PMC free article] [PubMed] [Google Scholar]
- Durand N. C., Shamim M. S., Machol I., Rao S. S. P., Huntley M. H., Lander E. S. and Aiden E. L. (2016b). Juicer provides a one-click system for analyzing loop-resolution Hi-C experiments. Cell Syst. 3, 95-98. 10.1016/j.cels.2016.07.002 [DOI] [PMC free article] [PubMed] [Google Scholar]
- Ellinghaus D., Kurtz S. and Willhoeft U. (2008). LTRharvest, an efficient and flexible software for de novo detection of LTR retrotransposons. BMC Bioinformatics 9, 18 10.1186/1471-2105-9-18 [DOI] [PMC free article] [PubMed] [Google Scholar]
- Flyamer I. M., Gassler J., Imakaev M., Brandão H. B., Ulianov S. V., Abdennur N., Razin S. V., Mirny L. A. and Tachibana-Konwalski K. (2017). Single-nucleus Hi-C reveals unique chromatin reorganization at oocyte-to-zygote transition. Nature 544, 110-114. 10.1038/nature21711 [DOI] [PMC free article] [PubMed] [Google Scholar]
- Flyamer I. M., Illingworth R. S. and Bickmore W. A. (2020). Coolpup.py: versatile pile-up analysis of Hi-C data. Bioinformatics 36, 2980-2985. 10.1093/bioinformatics/btaa073 [DOI] [PMC free article] [PubMed] [Google Scholar]
- Gibcus J. H., Samejima K., Goloborodko A., Samejima I., Naumova N., Nuebler J., Kanemaki M. T., Xie L., Paulson J. R., Earnshaw W. C. et al. (2018). A pathway for mitotic chromosome formation. Science 359, eaao6135 10.1126/science.aao6135 [DOI] [PMC free article] [PubMed] [Google Scholar]
- Grewal S. I. S. and Jia S. (2007). Heterochromatin revisited. Nat. Rev. Genet. 8, 35-46. 10.1038/nrg2008 [DOI] [PubMed] [Google Scholar]
- Grewal S. I. S. and Moazed D. (2003). Heterochromatin and epigenetic control of gene expression. Science 301, 798-802. 10.1126/science.1086887 [DOI] [PubMed] [Google Scholar]
- Guarente L. (2000). Sir2 links chromatin silencing, metabolism, and aging. Genes Dev. 14, 1021-1026. [PubMed] [Google Scholar]
- He R. and Kidder B. L. (2017). H3K4 demethylase KDM5B regulates global dynamics of transcription elongation and alternative splicing in embryonic stem cells. Nucleic Acids Res. 45, 6427-6441. 10.1093/nar/gkx251 [DOI] [PMC free article] [PubMed] [Google Scholar]
- Karachentsev D., Sarma K., Reinberg D. and Steward R. (2005). PR-Set7-dependent methylation of histone H4 Lys 20 functions in repression of gene expression and is essential for mitosis. Genes Dev. 19, 431-435. 10.1101/gad.1263005 [DOI] [PMC free article] [PubMed] [Google Scholar]
- Karimi M. M., Goyal P., Maksakova I. A., Bilenky M., Leung D., Tang J. X., Shinkai Y., Mager D. L., Jones S., Hirst M. et al. (2011). DNA methylation and SETDB1/H3K9me3 regulate predominantly distinct sets of genes, retroelements, and chimeric transcripts in mESCs. Cell Stem Cell 8, 676-687. 10.1016/j.stem.2011.04.004 [DOI] [PMC free article] [PubMed] [Google Scholar]
- Kent W. J., Sugnet C. W., Furey T. S., Roskin K. M., Pringle T. H., Zahler A. M. and Haussler D. (2002). The human genome browser at UCSC. Genome Res. 12, 996-1006. 10.1101/gr.229102 [DOI] [PMC free article] [PubMed] [Google Scholar]
- Kidder B. L., Hu G. and Zhao K. (2011). ChIP-Seq: technical considerations for obtaining high-quality data. Nat. Immunol. 12, 918-922. 10.1038/ni.2117 [DOI] [PMC free article] [PubMed] [Google Scholar]
- Kidder B. L., Hu G., Yu Z.-X., Liu C. and Zhao K. (2013). Extended self-renewal and accelerated reprogramming in the absence of Kdm5b. Mol. Cell. Biol. 33, 4793-4810. 10.1128/MCB.00692-13 [DOI] [PMC free article] [PubMed] [Google Scholar]
- Kidder B. L., Hu G. and Zhao K. (2014). KDM5B focuses H3K4 methylation near promoters and enhancers during embryonic stem cell self-renewal and differentiation. Genome Biol. 15, R32 10.1186/gb-2014-15-2-r32 [DOI] [PMC free article] [PubMed] [Google Scholar]
- Kidder B. L., He R., Wangsa D., Padilla-Nash H. M., Bernardo M. M., Sheng S., Ried T. and Zhao K. (2017a). SMYD5 controls heterochromatin and chromosome integrity during embryonic stem cell differentiation. Cancer Res. 77, 6729-6745. 10.1158/0008-5472.CAN-17-0828 [DOI] [PMC free article] [PubMed] [Google Scholar]
- Kidder B. L., Hu G., Cui K. and Zhao K. (2017b). SMYD5 regulates H4K20me3-marked heterochromatin to safeguard ES cell self-renewal and prevent spurious differentiation. Epigenet. Chromatin 10, 8 10.1186/s13072-017-0115-7 [DOI] [PMC free article] [PubMed] [Google Scholar]
- Krijger P. H. L., Di Stefano B., de Wit E., Limone F., van Oevelen C., de Laat W. and Graf T. (2016). Cell-of-origin-specific 3D genome structure acquired during somatic cell reprogramming. Cell Stem Cell 18, 597-610. 10.1016/j.stem.2016.01.007 [DOI] [PMC free article] [PubMed] [Google Scholar]
- Kurosawa H. (2007). Methods for inducing embryoid body formation: in vitro differentiation system of embryonic stem cells. J. Biosci. Bioeng. 103, 389-398. 10.1263/jbb.103.389 [DOI] [PubMed] [Google Scholar]
- Lajoie B. R., Dekker J. and Kaplan N. (2015). The Hitchhiker's guide to Hi-C analysis: practical guidelines. Methods 72, 65-75. 10.1016/j.ymeth.2014.10.031 [DOI] [PMC free article] [PubMed] [Google Scholar]
- Langmead B. and Salzberg S. L. (2012). Fast gapped-read alignment with Bowtie 2. Nat. Methods 9, 357-359. 10.1038/nmeth.1923 [DOI] [PMC free article] [PubMed] [Google Scholar]
- Li H. (2013). Aligning sequence reads, clone sequences and assembly contigs with BWA-MEM. arXiv:1303.3997v1 [q-bio.GN]. [Google Scholar]
- Li H. and Durbin R. (2010). Fast and accurate long-read alignment with Burrows-Wheeler transform. Bioinformatics 26, 589-595. 10.1093/bioinformatics/btp698 [DOI] [PMC free article] [PubMed] [Google Scholar]
- Lun A. T. L. and Smyth G. K. (2015). diffHic: a Bioconductor package to detect differential genomic interactions in Hi-C data. BMC Bioinformatics 16, 289 10.1186/s12859-015-0683-0 [DOI] [PMC free article] [PubMed] [Google Scholar]
- Macfarlan T. S., Gifford W. D., Driscoll S., Lettieri K., Rowe H. M., Bonanomi D., Firth A., Singer O., Trono D. and Pfaff S. L. (2012). Embryonic stem cell potency fluctuates with endogenous retrovirus activity. Nature 487, 57-63. 10.1038/nature11244 [DOI] [PMC free article] [PubMed] [Google Scholar]
- Maksakova I. A., Thompson P. J., Goyal P., Jones S. J. M., Singh P. B., Karimi M. M. and Lorincz M. C. (2013). Distinct roles of KAP1, HP1 and G9a/GLP in silencing of the two-cell-specific retrotransposon MERVL in mouse ES cells. Epigenet. Chromatin 6, 15 10.1186/1756-8935-6-15 [DOI] [PMC free article] [PubMed] [Google Scholar]
- Martens J. H. A., O'Sullivan R. J., Braunschweig U., Opravil S., Radolf M., Steinlein P. and Jenuwein T. (2005). The profile of repeat-associated histone lysine methylation states in the mouse epigenome. EMBO J. 24, 800-812. 10.1038/sj.emboj.7600545 [DOI] [PMC free article] [PubMed] [Google Scholar]
- McLean C. Y., Bristor D., Hiller M., Clarke S. L., Schaar B. T., Lowe C. B., Wenger A. M. and Bejerano G. (2010). GREAT improves functional interpretation of cis-regulatory regions. Nat. Biotechnol. 28, 495-501. 10.1038/nbt.1630 [DOI] [PMC free article] [PubMed] [Google Scholar]
- Mikkelsen T. S., Ku M., Jaffe D. B., Issac B., Lieberman E., Giannoukos G., Alvarez P., Brockman W., Kim T.-K., Koche R. P. et al. (2007). Genome-wide maps of chromatin state in pluripotent and lineage-committed cells. Nature 448, 553-560. 10.1038/nature06008 [DOI] [PMC free article] [PubMed] [Google Scholar]
- Mortazavi A., Williams B. A., McCue K., Schaeffer L. and Wold B. (2008). Mapping and quantifying mammalian transcriptomes by RNA-Seq. Nat. Methods 5, 621-628. 10.1038/nmeth.1226 [DOI] [PubMed] [Google Scholar]
- Nicetto D., Hahn M., Jung J., Schneider T. D., Straub T., David R., Schotta G. and Rupp R. A. W. (2013). Suv4-20h histone methyltransferases promote neuroectodermal differentiation by silencing the pluripotency-associated Oct-25 gene. PLoS Genet. 9, e1003188 10.1371/journal.pgen.1003188 [DOI] [PMC free article] [PubMed] [Google Scholar]
- Nora E. P., Goloborodko A., Valton A.-L., Gibcus J. H., Uebersohn A., Abdennur N., Dekker J., Mirny L. A. and Bruneau B. G. (2017). Targeted degradation of CTCF decouples local insulation of chromosome domains from genomic compartmentalization. Cell 169, 930-944.e922. 10.1016/j.cell.2017.05.004 [DOI] [PMC free article] [PubMed] [Google Scholar]
- Oda H., Okamoto I., Murphy N., Chu J., Price S. M., Shen M. M., Torres-Padilla M. E., Heard E. and Reinberg D. (2009). Monomethylation of histone H4-lysine 20 is involved in chromosome structure and stability and is essential for mouse development. Mol. Cell. Biol. 29, 2278-2295. 10.1128/MCB.01768-08 [DOI] [PMC free article] [PubMed] [Google Scholar]
- Rao S. S. P., Huntley M. H., Durand N. C., Stamenova E. K., Bochkov I. D., Robinson J. T., Sanborn A. L., Machol I., Omer A. D., Lander E. S. et al. (2014). A 3D map of the human genome at kilobase resolution reveals principles of chromatin looping. Cell 159, 1665-1680. 10.1016/j.cell.2014.11.021 [DOI] [PMC free article] [PubMed] [Google Scholar]
- Riddle N. C., Jung Y. L., Gu T., Alekseyenko A. A., Asker D., Gui H., Kharchenko P. V., Minoda A., Plachetka A., Schwartz Y. B. et al. (2012). Enrichment of HP1a on Drosophila chromosome 4 genes creates an alternate chromatin structure critical for regulation in this heterochromatic domain. PLoS Genet. 8, e1002954 10.1371/journal.pgen.1002954 [DOI] [PMC free article] [PubMed] [Google Scholar]
- Robinson M. D., McCarthy D. J. and Smyth G. K. (2009). edgeR: a Bioconductor package for differential expression analysis of digital gene expression data. Bioinformatics 26, 139-140. 10.1093/bioinformatics/btp616 [DOI] [PMC free article] [PubMed] [Google Scholar]
- Sanders S. L., Portoso M., Mata J., Bähler J., Allshire R. C. and Kouzarides T. (2004). Methylation of histone H4 lysine 20 controls recruitment of Crb2 to sites of DNA damage. Cell 119, 603-614. 10.1016/j.cell.2004.11.009 [DOI] [PubMed] [Google Scholar]
- Schotta G., Lachner M., Sarma K., Ebert A., Sengupta R., Reuter G., Reinberg D. and Jenuwein T. (2004). A silencing pathway to induce H3-K9 and H4-K20 trimethylation at constitutive heterochromatin. Genes Dev. 18, 1251-1262. 10.1101/gad.300704 [DOI] [PMC free article] [PubMed] [Google Scholar]
- Schotta G., Sengupta R., Kubicek S., Malin S., Kauer M., Callen E., Celeste A., Pagani M., Opravil S., De La Rosa-Velazquez I. A. et al. (2008). A chromatin-wide transition to H4K20 monomethylation impairs genome integrity and programmed DNA rearrangements in the mouse. Genes Dev. 22, 2048-2061. 10.1101/gad.476008 [DOI] [PMC free article] [PubMed] [Google Scholar]
- Steinbiss S., Willhoeft U., Gremme G. and Kurtz S. (2009). Fine-grained annotation and classification of de novo predicted LTR retrotransposons. Nucleic Acids Res. 37, 7002-7013. 10.1093/nar/gkp759 [DOI] [PMC free article] [PubMed] [Google Scholar]
- Subramanian A., Tamayo P., Mootha V. K., Mukherjee S., Ebert B. L., Gillette M. A., Paulovich A., Pomeroy S. L., Golub T. R., Lander E. S. et al. (2005). Gene set enrichment analysis: a knowledge-based approach for interpreting genome-wide expression profiles. Proc. Natl. Acad. Sci. USA 102, 15545-15550. 10.1073/pnas.0506580102 [DOI] [PMC free article] [PubMed] [Google Scholar]
- Talbert P. B. and Henikoff S. (2006). Spreading of silent chromatin: inaction at a distance. Nat. Rev. Genet. 7, 793-803. 10.1038/nrg1920 [DOI] [PubMed] [Google Scholar]
- Tan C. M., Chen E. Y., Dannenfelser R., Clark N. R. and Ma'ayan A. (2013). Network2Canvas: network visualization on a canvas with enrichment analysis. Bioinformatics 29, 1872-1878. 10.1093/bioinformatics/btt319 [DOI] [PMC free article] [PubMed] [Google Scholar]
- Trojer P. and Reinberg D. (2007). Facultative heterochromatin: is there a distinctive molecular signature? Mol. Cell 28, 1-13. 10.1016/j.molcel.2007.09.011 [DOI] [PubMed] [Google Scholar]
- Vakoc C. R., Mandat S. A., Olenchock B. A. and Blobel G. A. (2005). Histone H3 lysine 9 methylation and HP1γ are associated with transcription elongation through mammalian chromatin. Mol. Cell 19, 381-391. 10.1016/j.molcel.2005.06.011 [DOI] [PubMed] [Google Scholar]
- Visel A., Blow M. J., Li Z., Zhang T., Akiyama J. A., Holt A., Plajzer-Frick I., Shoukry M., Wright C., Chen F. et al. (2009). ChIP-seq accurately predicts tissue-specific activity of enhancers. Nature 457, 854-858. 10.1038/nature07730 [DOI] [PMC free article] [PubMed] [Google Scholar]
- Whyte W. A., Orlando D. A., Hnisz D., Abraham B. J., Lin C. Y., Kagey M. H., Rahl P. B., Lee T. I. and Young R. A. (2013). Master transcription factors and mediator establish super-enhancers at key cell identity genes. Cell 153, 307-319. 10.1016/j.cell.2013.03.035 [DOI] [PMC free article] [PubMed] [Google Scholar]
- Xu J. and Kidder B. L. (2018). H4K20me3 co-localizes with activating histone modifications at transcriptionally dynamic regions in embryonic stem cells. BMC Genomics 19, 514 10.1186/s12864-018-4886-4 [DOI] [PMC free article] [PubMed] [Google Scholar]
- Xu S., Grullon S., Ge K. and Peng W. (2014). Spatial clustering for identification of ChIP-enriched regions (SICER) to map regions of histone methylation patterns in embryonic stem cells. Methods Mol. Biol. 1150, 97-111. 10.1007/978-1-4939-0512-6_5 [DOI] [PMC free article] [PubMed] [Google Scholar]
- Zang C., Schones D. E., Zeng C., Cui K., Zhao K. and Peng W. (2009). A clustering approach for identification of enriched domains from histone modification ChIP-Seq data. Bioinformatics 25, 1952-1958. 10.1093/bioinformatics/btp340 [DOI] [PMC free article] [PubMed] [Google Scholar]
- Zhou X., Lowdon R. F., Li D., Lawson H. A., Madden P. A. F., Costello J. F. and Wang T. (2013). Exploring long-range genome interactions using the WashU Epigenome Browser. Nat. Methods 10, 375-376. 10.1038/nmeth.2440 [DOI] [PMC free article] [PubMed] [Google Scholar]
Associated Data
This section collects any data citations, data availability statements, or supplementary materials included in this article.