

Key Points
Question
In patients in the intensive care unit (ICU) who received invasive ventilation for reasons other than acute respiratory distress syndrome, is a ventilation strategy with lower positive end-expiratory pressure (PEEP) noninferior to a strategy using higher PEEP with respect to the number of ventilator-free days at day 28?
Findings
In this randomized clinical trial that included 980 ICU patients receiving invasive ventilation and who were expected not to be extubated within 24 hours of randomization, a ventilation strategy using lower PEEP compared with a strategy using higher PEEP resulted in 18 vs 17 ventilator-free days at day 28, a difference that did not exceed the noninferiority margin of −10%.
Meaning
Among patients in the ICU receiving invasive ventilation, a strategy with lower PEEP was noninferior to a strategy using higher PEEP.
Abstract
Importance
It is uncertain whether invasive ventilation can use lower positive end-expiratory pressure (PEEP) in critically ill patients without acute respiratory distress syndrome (ARDS).
Objective
To determine whether a lower PEEP strategy is noninferior to a higher PEEP strategy regarding duration of mechanical ventilation at 28 days.
Design, Setting, and Participants
Noninferiority randomized clinical trial conducted from October 26, 2017, through December 17, 2019, in 8 intensive care units (ICUs) in the Netherlands among 980 patients without ARDS expected not to be extubated within 24 hours after start of ventilation. Final follow-up was conducted in March 2020.
Interventions
Participants were randomized to receive invasive ventilation using either lower PEEP, consisting of the lowest PEEP level between 0 and 5 cm H2O (n = 476), or higher PEEP, consisting of a PEEP level of 8 cm H2O (n = 493).
Main Outcomes and Measures
The primary outcome was the number of ventilator-free days at day 28, with a noninferiority margin for the difference in ventilator-free days at day 28 of −10%. Secondary outcomes included ICU and hospital lengths of stay; ICU, hospital, and 28- and 90-day mortality; development of ARDS, pneumonia, pneumothorax, severe atelectasis, severe hypoxemia, or need for rescue therapies for hypoxemia; and days with use of vasopressors or sedation.
Results
Among 980 patients who were randomized, 969 (99%) completed the trial (median age, 66 [interquartile range {IQR}, 56-74] years; 246 [36%] women). At day 28, 476 patients in the lower PEEP group had a median of 18 ventilator-free days (IQR, 0-27 days) and 493 patients in the higher PEEP group had a median of 17 ventilator-free days (IQR, 0-27 days) (mean ratio, 1.04; 95% CI, 0.95-∞; P = .007 for noninferiority), and the lower boundary of the 95% CI was within the noninferiority margin. Occurrence of severe hypoxemia was 20.6% vs 17.6% (risk ratio, 1.17; 95% CI, 0.90-1.51; P = .99) and need for rescue strategy was 19.7% vs 14.6% (risk ratio, 1.35; 95% CI, 1.02-1.79; adjusted P = .54) in patients in the lower and higher PEEP groups, respectively. Mortality at 28 days was 38.4% vs 42.0% (hazard ratio, 0.89; 95% CI, 0.73-1.09; P = .99) in patients in the lower and higher PEEP groups, respectively. There were no statistically significant differences in other secondary outcomes.
Conclusions and Relevance
Among patients in the ICU without ARDS who were expected not to be extubated within 24 hours, a lower PEEP strategy was noninferior to a higher PEEP strategy with regard to the number of ventilator-free days at day 28. These findings support the use of lower PEEP in patients without ARDS.
Trial Registration
ClinicalTrials.gov Identifier: NCT03167580
This noninferiority trial compares the effects of lower (0-5 cm H2O) vs higher (8 cm H2O) positive end-expiratory pressure (PEEP) on ventilator-free days at day 28 among critically ill patients without acute respiratory distress syndrome (ARDS).
Introduction
Invasive ventilation, one of the most frequently applied strategies in the intensive care unit (ICU), is recognized as a potentially harmful intervention.1 Although the protective role of low tidal volume is well defined, there is much uncertainty regarding the role of higher positive end-expiratory pressure (PEEP). In one meta-analysis, in patients with moderate to severe acute respiratory distress syndrome (ARDS), higher PEEP led to a benefit regarding mortality but prolonged the time to wean from invasive ventilation in patients with mild ARDS.2 There has been a gradual and noticeable increase in use of higher PEEP in patients without ARDS in ICUs worldwide.3,4,5,6 An increment in PEEP, from a mean of 5 cm H2O in 1998 to 7 cm H2O in 2016, was recently demonstrated6 despite absence of evidence for benefit or harm.5
In patients without ARDS, ventilation with higher PEEP could lead to a better distribution of lung aeration, which improves oxygenation.5 Ventilation with higher PEEP may even prevent ARDS5 and has been suggested to reduce the development of ventilator-associated pneumonia (VAP).7 However, in healthy animals, ventilation with higher PEEP may also worsen existing or cause new lung injuries.8,9,10,11 It was shown that ventilation with higher PEEP impaired hemodynamics and increased the need for additional fluid administration or vasopressors during surgery.12,13 Because it is common practice to extubate at lower PEEP,14 use of higher PEEP at least in theory could also delay weaning in some settings.
The Restricted vs Liberal Positive End-Expiratory Pressure in Patients Without ARDS (RELAx) study was conducted to test whether a ventilation strategy using lower PEEP is noninferior to a ventilation strategy using higher PEEP with respect to the number of ventilator-free days at day 28 in patients without ARDS.
Methods
Study Design and Oversight
This was a randomized clinical trial conducted at the ICUs of 8 hospitals in the Netherlands. The protocol has been published,15 and the final protocol is available in Supplement 1. An updated statistical analysis plan was written before closing the database; the final plan and a table describing the changes to the original study design are available in Supplement 2. The institutional review boards of all participating centers approved the study, and written deferred informed consent was obtained from patient representatives. No interim analyses were performed. An independent committee oversaw conduct of the trial and adverse events while remaining blind to the primary end point at 3 predefined time points, and recommended the trial be continued.
Patients
The trial enrolled patients who received invasive ventilation shortly before or after admission to the ICU and who were expected not to be extubated within 24 hours of randomization. Patients were to be randomized within 1 hour of initiation of ventilation in the ICU. One main exclusion criterion was presence of ARDS, according to the current definition.16 Another key exclusion criterion was invasive ventilation that had lasted longer than 12 hours before ICU admission. Other exclusion criteria are presented in eAppendix 2 in Supplement 3.
Randomization and Masking
Patients were randomized in a 1:1 ratio to a lower or higher PEEP strategy group. The local investigators performed randomization using a central, dedicated, password-protected, encrypted, web-based automated randomization system (SSL-encrypted website with ALEA software, TenALEA Consortium). Randomization was conducted using random block sizes with a maximum of 8 patients.
Interventions
The PEEP ventilation strategies are shown in eFigure 1 in Supplement 3. Briefly, patients randomized to the lower PEEP strategy started with PEEP at 5 cm H2O and an inspired oxygen fraction (Fio2) between 0.21 and 0.6. After intubation and start of ventilation, every 15 minutes PEEP was down-titrated by 1 cm H2O to a minimum of 0 cm H2O, as long as pulse oximetry–measured oxygen saturation (Spo2) was greater than 92% or Pao2 was greater than 60 mm Hg. Thereafter, ventilation continued with the lowest PEEP according to this target, while using an Fio2 of between 0.21 and 0.6. Spo2 was allowed to decrease to less than 92% or Pao2 to less than 60 mm Hg for brief periods (up to 5 minutes) without the need for any intervention. Then, Fio2 was increased to a maximal 0.6 before PEEP was increased in steps of 1 cm H2O up to 5 cm H2O. In the case of severe hypoxemia, defined as a decrease in Spo2 to less than 88% or Pao2 to less than 55 mm Hg, common causes such as a mucus plug requiring pulmonary toilet were considered and treated. As a rescue, Fio2 could be increased to a maximal 1.0 and PEEP to 5 cm H2O or more, according to the attending physician. Development of atelectasis diagnosed by chest imaging was to be accepted unless Spo2 decreased to less than 92% or Pao2 to less than 60 mm Hg and did not respond to an increase of Fio2 to a maximal 0.6. In the case of hemodynamic instability, evidenced by increased need for vasopressors, PEEP could be set at 5 cm H2O for 1 to 2 hours. Down-titration of PEEP was resumed after stabilization or after the decrease in Spo2 or Pao2 was resolved.
Patients randomized to the higher PEEP strategy started with PEEP at 8 cm H2O and Fio2 between 0.21 and 0.6. The goal was to maintain PEEP at 8 cm H2O. Brief periods (up to 5 minutes) could be tolerated of an Spo2 decrease to less than 92% or a Pao2 decrease to less than 60 mm Hg. Then, Fio2 was increased to a maximal 0.6 before PEEP was increased. If Spo2 decreased to less than 88% or Pao2 to less than 55 mm Hg, similar steps were taken as in the low PEEP group. In the case of hemodynamic instability, PEEP was set at 5 cm H2O for 1 to 2 hours. After stabilization, PEEP was set back to 8 cm H2O.
Oxygenation Targets
In both groups, oxygenation targets for Spo2 were 92% to 96% and for Pao2 were 60 to 85 mm Hg.17,18,19 The oxygenation target was primarily assessed by pulse oximetry and, in the case of unreliable readings, by arterial blood gas analysis. For patients in whom the risk of potentially dangerous hypoxemia could become unacceptable (eFigure 1 in Supplement 3), oxygenation targets could be increased to Spo2 of 94% to 96% and Pao2 of 68 to 85 mm Hg.
Standard Care and Weaning From the Ventilator
Standard care and weaning from the ventilator followed strict protocol,20 as described in eAppendix 2 in Supplement 3.
Outcomes
The primary outcome was the number of ventilator-free days at day 28, defined as the number of days that a patient was alive and free of invasive ventilation, calculated from the moment of randomization, if the period of unassisted breathing lasted at least 24 consecutive hours.21 Patients who died or received invasive ventilation for more than 28 days were considered to have 0 ventilator-free days.
Secondary outcomes included ICU and hospital lengths of stay; ICU, hospital, and 28- and 90-day mortality; duration of ventilation among survivors; and pulmonary complications, including development of ARDS,16 VAP, severe atelectasis, severe hypoxemia, and pneumothorax. Mortality at day 28 and duration of ventilation among survivors were not included as secondary outcomes in the original protocol but were added in the updated statistical analysis plan.21 Other secondary outcomes were need for rescue therapies for severe hypoxemia or severe atelectasis, including recruitment maneuvers, prone positioning, and bronchoscopy for opening atelectasis; days with use of vasopressors; and days with use of sedation (see full definitions in eTable 1 in Supplement 3).
Other Study Parameters
It was difficult to collect complete and reliable data for 2 secondary outcomes, the Therapeutic Intervention Scoring System score and the Nursing Activities Score; therefore, these findings are not reported. An analysis of health care–related costs is planned. Substudies investigating cardiac performance, lung aeration, and systemic inflammation, as assessed by ultrasound and plasma biomarkers, respectively, were performed in a subset of patients enrolled in the Amsterdam University Medical Center. The results of these 4 substudies will be reported elsewhere.
Statistical Analysis
The trial was designed to last until 980 patients were enrolled. This number of patients was expected to be sufficient to show noninferiority of the lower PEEP strategy compared with the higher PEEP strategy with a noninferiority margin of −10%, assuming no difference in the number of ventilator-free days in both groups, with a mean of 16 (SD, 10) days.20,22 A 1-sided α = .05, a power of 80%, a 1:1 ratio of patient randomization, and correction for 10% of dropouts was considered. The choice of a noninferiority margin of −10%, representing 0.5 days of ventilation or 1.6 ventilator-free days, was motivated by what could be considered acceptable from a clinical point of view. Practically, this margin meant that a difference of less than 12 hours in duration of ventilation or 1.6 ventilator-free days with lower PEEP was considered noninferior to higher PEEP.
Categorical variables are reported as numbers and percentages and continuous variables as medians and interquartile ranges (IQRs). In all analyses, patients were analyzed according to their randomization group, with the exception of those who withdrew informed consent or were lost to follow-up in the first 28 days. No imputation was used for any missing value, since there was less than 1% missing values for the primary outcome. In addition, a per-protocol analysis was conducted that included only patients who completed PEEP titrations according to the study protocol. Patients in the lower PEEP strategy were excluded if, during the first 2 days of ventilation, they received in at least 2 of the 4 measurements per day a PEEP greater than 5 cm H2O and an Fio2 of 0.6 or less or an Spo2 greater than 92%. Patients randomized to the higher PEEP strategy were excluded if, during the first 2 days of ventilation, they received in at least 2 of the 4 measurements per day a PEEP less than 8 cm H2O without any documented hemodynamic instability.
The effect of a lower PEEP strategy compared with a higher PEEP strategy on the primary outcome was calculated as a mean ratio, tested for noninferiority considering a margin of 10% with a 1-sided 95% CI. Thus, noninferiority would be established if the lower boundary of the 1-sided 95% CI was higher than 0.90. The mean ratio was estimated using a generalized additive model for location scale and shape, considering a zero-inflated β distribution and using the delta method to estimate the 95% CI. A 1-sided P value for noninferiority was calculated. If noninferiority was confirmed, superiority of lower PEEP was tested considering a 95% CI following a hierarchical closed testing procedure.
All analyses of the secondary outcomes were 2-sided and assessed superiority. The effect of the intervention on binary outcomes was assessed with risk ratios and 95% CIs calculated with a Wald likelihood ratio approximation test and with χ2 hypothesis testing. The duration of ventilation among survivors, ICU and hospital lengths of stay, and 28- and 90-day mortality were compared using Kaplan-Meier curves and hazard ratios with 95% CIs calculated with Cox proportional hazard models. The proportional hazard assumption was assessed through inspection of Schoenfeld residuals. Days with use of vasopressors and sedation were compared as mean differences between the groups from an independent t test.
The homogeneity of treatment effects on the primary outcome across prespecified subgroups was examined via a test for treatment × subgroup interaction in the generalized additive model for location scale and shape considering a zero-inflated β distribution. In addition to the unadjusted P values for secondary outcomes, a Holm-Bonferroni procedure was applied to control for multiple testing. As a sensitivity analysis, primary and secondary outcomes were reassessed in mixed-effects models considering further adjustments by age, sex, and Acute Physiology and Chronic Health Evaluation (APACHE) IV score and including centers as random effects. In addition, the duration of ventilation among survivors and the times to ICU and hospital discharge were reassessed in a competing risk model with death before extubation, ICU discharge, or hospital discharge, respectively, treated as a competing risk and reported as subdistribution hazard ratios with 95% CIs estimated from a Fine-Gray model.
All analyses were performed with R software, version 3.6.3 (R Core Team). Additional details regarding the statistical analysis are provided in the statistical analysis plan in Supplement 2.
Results
Patients
From October 26, 2017, to December 17, 2019, 2869 patients were screened. Final follow-up was completed on March 16, 2020. A total of 1889 patients were not enrolled, of whom 942 (49.8%) met exclusion criteria and 947 (50.2%) were eligible but not enrolled for other reasons (Figure 1). Of the 980 randomized patients enrolled in the study, 484 were randomized to the lower PEEP strategy and 496 to the higher PEEP strategy. Representatives of 3 patients withdrew consent to use study data. Follow-up to day 28 was incomplete for 8 patients. Thus, data for 969 patients (476 randomized to the lower PEEP strategy and 493 to the higher PEEP strategy) were used in the final analysis (Figure 1).
Figure 1. Flow of Participants in the Restricted vs Liberal Positive End-Expiratory Pressure in Patients Without ARDS Trial.

In all analyses, patients were analyzed according to their randomization group, with the exception of those who withdrew informed consent or were lost to follow-up in the first 28 days. PEEP indicates positive end-expiratory pressure.
aPatients could have more than 1 reason for exclusion; the main reason for exclusion is presented.
bIncludes chronic obstructive pulmonary disease (COPD) stages III and IV in the Global Initiative for COPD (GOLD) classification and restrictive pulmonary disease. GOLD stage III COPD is defined as severe obstruction of the airways, with the ratio of forced expiratory volume in the first second to forced vital capacity (FEV1/FVC) less than 70% and FEV1 between 30% and 50% of predicted values. GOLD stage IV COPD is defined as very severe obstruction of the airways, with FEV1/FVC less than 70% and FEV1 less than 30% of predicted values.
cIncludes ongoing cardiac ischemia due to cardiac infarction and failed revascularization, uncontrollable intracranial pressure, delayed cerebral ischemia after subarachnoid hemorrhage, necrotizing fasciitis, and severe untreated anemia.
dIncludes Guillain-Barré syndrome, high spinal cord lesion, amyotrophic lateral sclerosis, multiple sclerosis, or myasthenia gravis.
Baseline characteristics are presented in Table 1. Among the enrolled patients, 79.4% were admitted to the ICU for a nonsurgical reason. The most frequent reason for invasive ventilation was respiratory failure (30.2%).
Table 1. Baseline Participant Characteristics.
| Characteristics | Lower PEEP (n = 476)a | Higher PEEP (n = 493)a |
|---|---|---|
| Age, median (IQR), y | 65.5 (56.0-74.0) | 66.0 (57.0-74.0) |
| Sex, No. (%) | ||
| Female | 164 (34.5) | 182 (36.9) |
| Male | 312 (65.5) | 311 (63.1) |
| BMI, median (IQR) | 25.8 (23.1-28.4) | 26.1 (23.5-29.8) |
| APACHE score, median (IQR) | ||
| APACHE IVb | 83.5 (59.8-103.2) [n = 376] | 90.0 (67.0-111.2) [n = 388] |
| APACHE IIc | 23.0 (18.0-29.0) [n = 321] | 24.0 (19.0-30.0) [n = 322] |
| SAPS II, median (IQR)d | 56.0 (43.2-67.0) [n = 254] | 58.0 (43.0-68.0) [n = 270] |
| LIPS, median (IQR)e | 3.0 (1.5-5.1) | 3.0 (1.5-5.0) |
| Patients at risk of ARDS, No. (%) | 206 (43.3) | 197 (40.0) |
| SOFA score, median (IQR)f | 9.0 (7.0-12.0) [n = 290] | 10.0 (8.0-12.0) [n = 283] |
| Septic shock, No./total (%) | 42/448 (9.4) | 48/465 (10.3) |
| Smoking, No./total (%) | ||
| Never | 107/295 (36.3) | 128/305 (42.0) |
| Current | 104/295 (35.3) | 104/305 (34.1) |
| Former | 84/295 (28.5) | 73/305 (23.9) |
| Reason for ICU admission, No. (%) | ||
| Medical | 371 (77.9) | 398 (80.7) |
| Urgent surgery | 88 (18.5) | 76 (15.4) |
| Elective surgery | 17 (3.6) | 19 (3.9) |
| Reason for intubation, No. (%) | ||
| Respiratory failure | 146 (30.7) | 147 (29.8) |
| Cardiac arrestg | 123 (25.8) | 142 (28.8) |
| Depressed level of consciousness | 74 (15.5) | 81 (16.4) |
| Planned postoperative ventilation | 78 (16.4) | 59 (12.0) |
| Airway protection | 38 (8.0) | 52 (10.5) |
| Other | 17 (3.6) | 12 (2.4) |
| Time with ventilation before randomization, median (IQR), h | 0.6 (0.2-1.1) | 0.6 (0.2-1.1) |
| Physiological features and support | ||
| Ventilatory mode, No./total (%) | ||
| Pressure controlled | 312/429 (72.7) | 310/429 (72.3) |
| Volume controlled | 73/429 (17.0) | 71/429 (16.6) |
| Pressure support | 35/429 (8.2) | 35/429 (8.2) |
| Other | 9/429 (2.1) | 13/429 (3.1) |
| Respiratory and physiological measures, median (IQR) | ||
| Tidal volume, mL/kg PBW | 7.0 (6.1-8.0) | 6.9 (6.1-8.0) |
| Plateau pressure, cm H2O | 19.9 (16.0-24.0) | 20.0 (17.0-24.0) |
| Total respiratory rate, /min | 19.0 (16.0-22.0) | 19.0 (15.0-22.0) |
| PEEP, cm H2O | 5.0 (5.0-8.0) | 7.0 (5.0-8.0) |
| Driving pressure, cm H2O | 14.0 (11.0-17.0) | 13.0 (11.0-16.0) |
| Fio2 | 0.50 (0.40-0.65) | 0.50 (0.40-0.70) |
| Pao2/Fio2, mm Hg | 210.0 (128.5-342.8) | 209.5 (132.1-334.4) |
| Paco2, mm Hg | 42.8 (37.5-51.8) | 44.3 (37.5-51.0) |
| Arterial pH | 7.29 (7.20-7.38) | 7.30 (7.21-7.36) |
| Spo2, % | 98.0 (95.0-100.0) | 98.0 (95.0-100.0) |
| Spo2/Fio2, mm Hg | 192.0 (150.0-242.5) | 192.0 (138.6-245.0) |
| Heart rate, /min | 94.0 (77.0-111.0) | 93.0 (75.0-114.0) |
| Mean arterial pressure, mm Hg | 80.0 (68.0-93.0) | 81.0 (69.0-95.0) |
Abbreviations: APACHE, Acute Physiology and Chronic Health Evaluation; ARDS, acute respiratory distress syndrome; BMI, body mass index, calculated as weight in kilograms divided by height in meters squared; Fio2, fraction of inspired oxygen; ICU, intensive care unit; IQR, interquartile range; LIPS, Lung Injury Prediction Score; PBW, predicted body weight; PEEP, positive end-expiratory pressure; SAPS, Simplified Acute Physiology Score; SOFA, sequential organ failure assessment; Spo2, oxygen saturation as measured by pulse oximetry.
SI conversion factor: to convert Paco2 and Spo2/Fio2 to kilopascals, divide by 7.5.
Percentages may not total 100% because of rounding.
The APACHE IV score ranges from 0 to 286, with higher scores indicating more severe disease and a higher risk of death; eg, an APACHE IV score of 90 indicates a 34% probability of mortality in a medical patient admitted for a respiratory condition.
The APACHE II score ranges from 0 to 71, with higher scores indicating more severe disease and a higher risk of death; eg, an APACHE II score of 24 indicates a 40% probability of mortality in a medical patient admitted for a respiratory condition.
The SAPS II score ranges from 0 to 163, with higher scores indicating a more severe condition; eg, a SAPS II score of 55 indicates a 55% probability of mortality.
The LIPS score ranges from 0 to 32.5, with higher scores indicating a more severe condition and a higher risk of ARDS; eg, scores ≥4 are considered high risk for ARDS.
The SOFA score ranges from 0 to 24, with higher scores indicating a more severe condition; eg, a SOFA score of 10 indicates a 40% probability of mortality.
Patients who had cardiac arrest were treated with targeted normothermia management.
Intervention
The median time between start of ventilation in the ICU and randomization was 0.6 hours (IQR, 0.2-1.1 hours). Mean PEEP values from postrandomization through day 5 were significantly lower in the lower PEEP group than in the higher PEEP group (Figure 2). Driving pressure was significantly higher and plateau pressure was significantly lower in the lower PEEP group than in the higher PEEP group. During the first 5 days of ventilation, Fio2, Spo2, and Pao2/Fio2 differed significantly between groups (Figure 2; eTables 2-4 and eFigures 2-14 in Supplement 3). There was no statistically significant difference in sedation level, heart rate, mean arterial pressure, administered fluids, transfusions, vasopressor support, and sequential organ failure assessment score between the groups (eTables 2 and 3 and eFigure 7 in Supplement 3). There was a statistically significant interaction for time and PEEP group regarding the cumulative fluid balance within the first 5 days (eFigure 15 in Supplement 3).
Figure 2. PEEP and Fio2 Measures From Baseline Through Day 5.
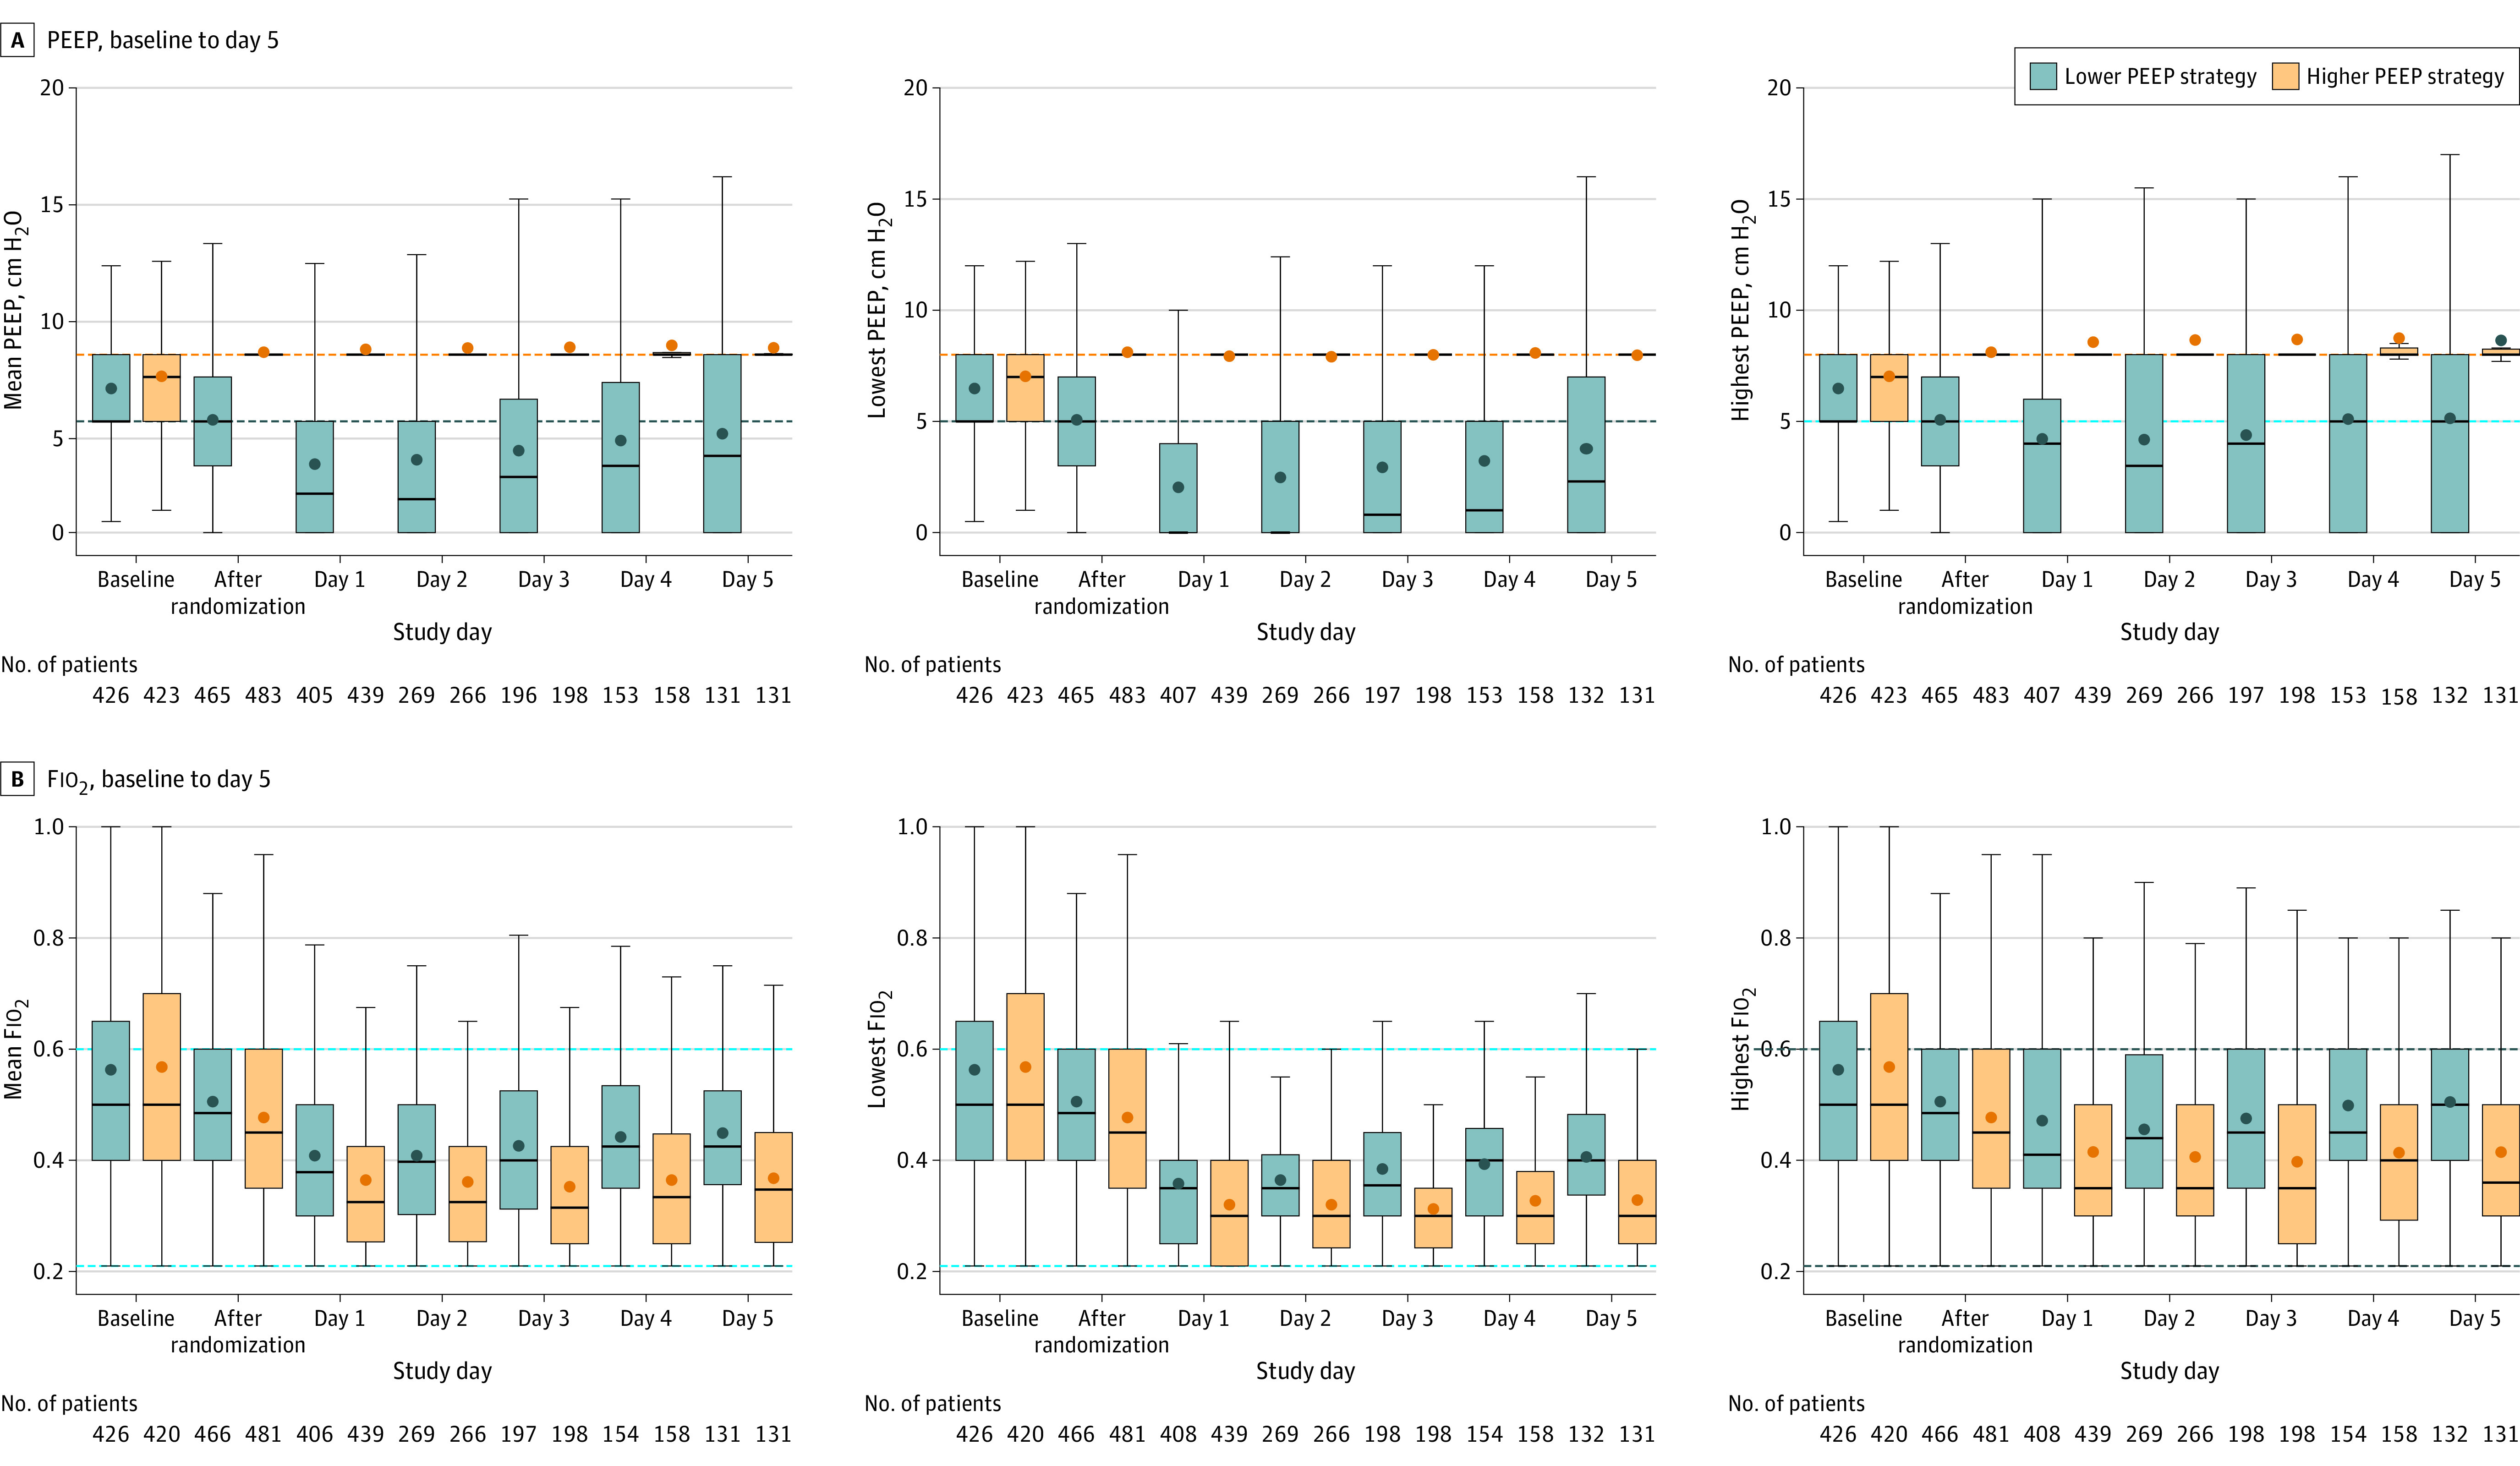
Fio2 indicates fraction of inspired oxygen; PEEP, positive end-expiratory pressure. The figure shows the mean, lowest, and highest PEEP and Fio2 values recorded from measurements taken every 6 hours while patients were undergoing invasive mechanical ventilation. Horizontal bars inside boxes represent medians; box tops and bottoms, interquartile ranges. Whiskers extend to 1.5 times the interquartile range beyond the first and third quartiles per the conventional Tukey method. Circles represent means. Dashed lines represent the limits imposed by the protocol in each group. Data labeled “after randomization” were recorded 1 hour after randomization (on day 0). The number of participants with available data decreases over successive study days because of deaths and discontinuation of invasive mechanical ventilation.
Outcomes
Twenty-eight days after randomization, patients randomized to the lower PEEP strategy had a median of 18 ventilator-free days (IQR, 0-27 days) and patients randomized to the higher PEEP strategy had a median of 17 ventilator-free days (IQR, 0-27 days) (mean ratio, 1.04; 1-sided 95% CI, 0.95-∞; P = .007 for noninferiority); the lower boundary of the 95% CI was within the noninferiority margin of −10% (Figure 3). The superiority analysis showed no statistically significant difference between the randomization groups (P = .22). The results of the per-protocol analysis and the sensitivity analysis adjusted by baseline factors and including centers as random effects confirmed the results of the primary analysis (eTables 5 and 6 in Supplement 3). There was no statistically significant difference in the duration of ventilation or ICU or hospital lengths of stay in the competing risk analysis (eFigures 16 and 17 in Supplement 3). Median ICU and hospital lengths of stay and ICU-, hospital-, and 28- and 90-day mortality were not significantly different between the groups (Table 2 and Figure 4; eFigure 18 in Supplement 3).
Figure 3. Noninferiority Analysis of the Primary Outcome in the Overall Cohort and in Subgroup Analyses.
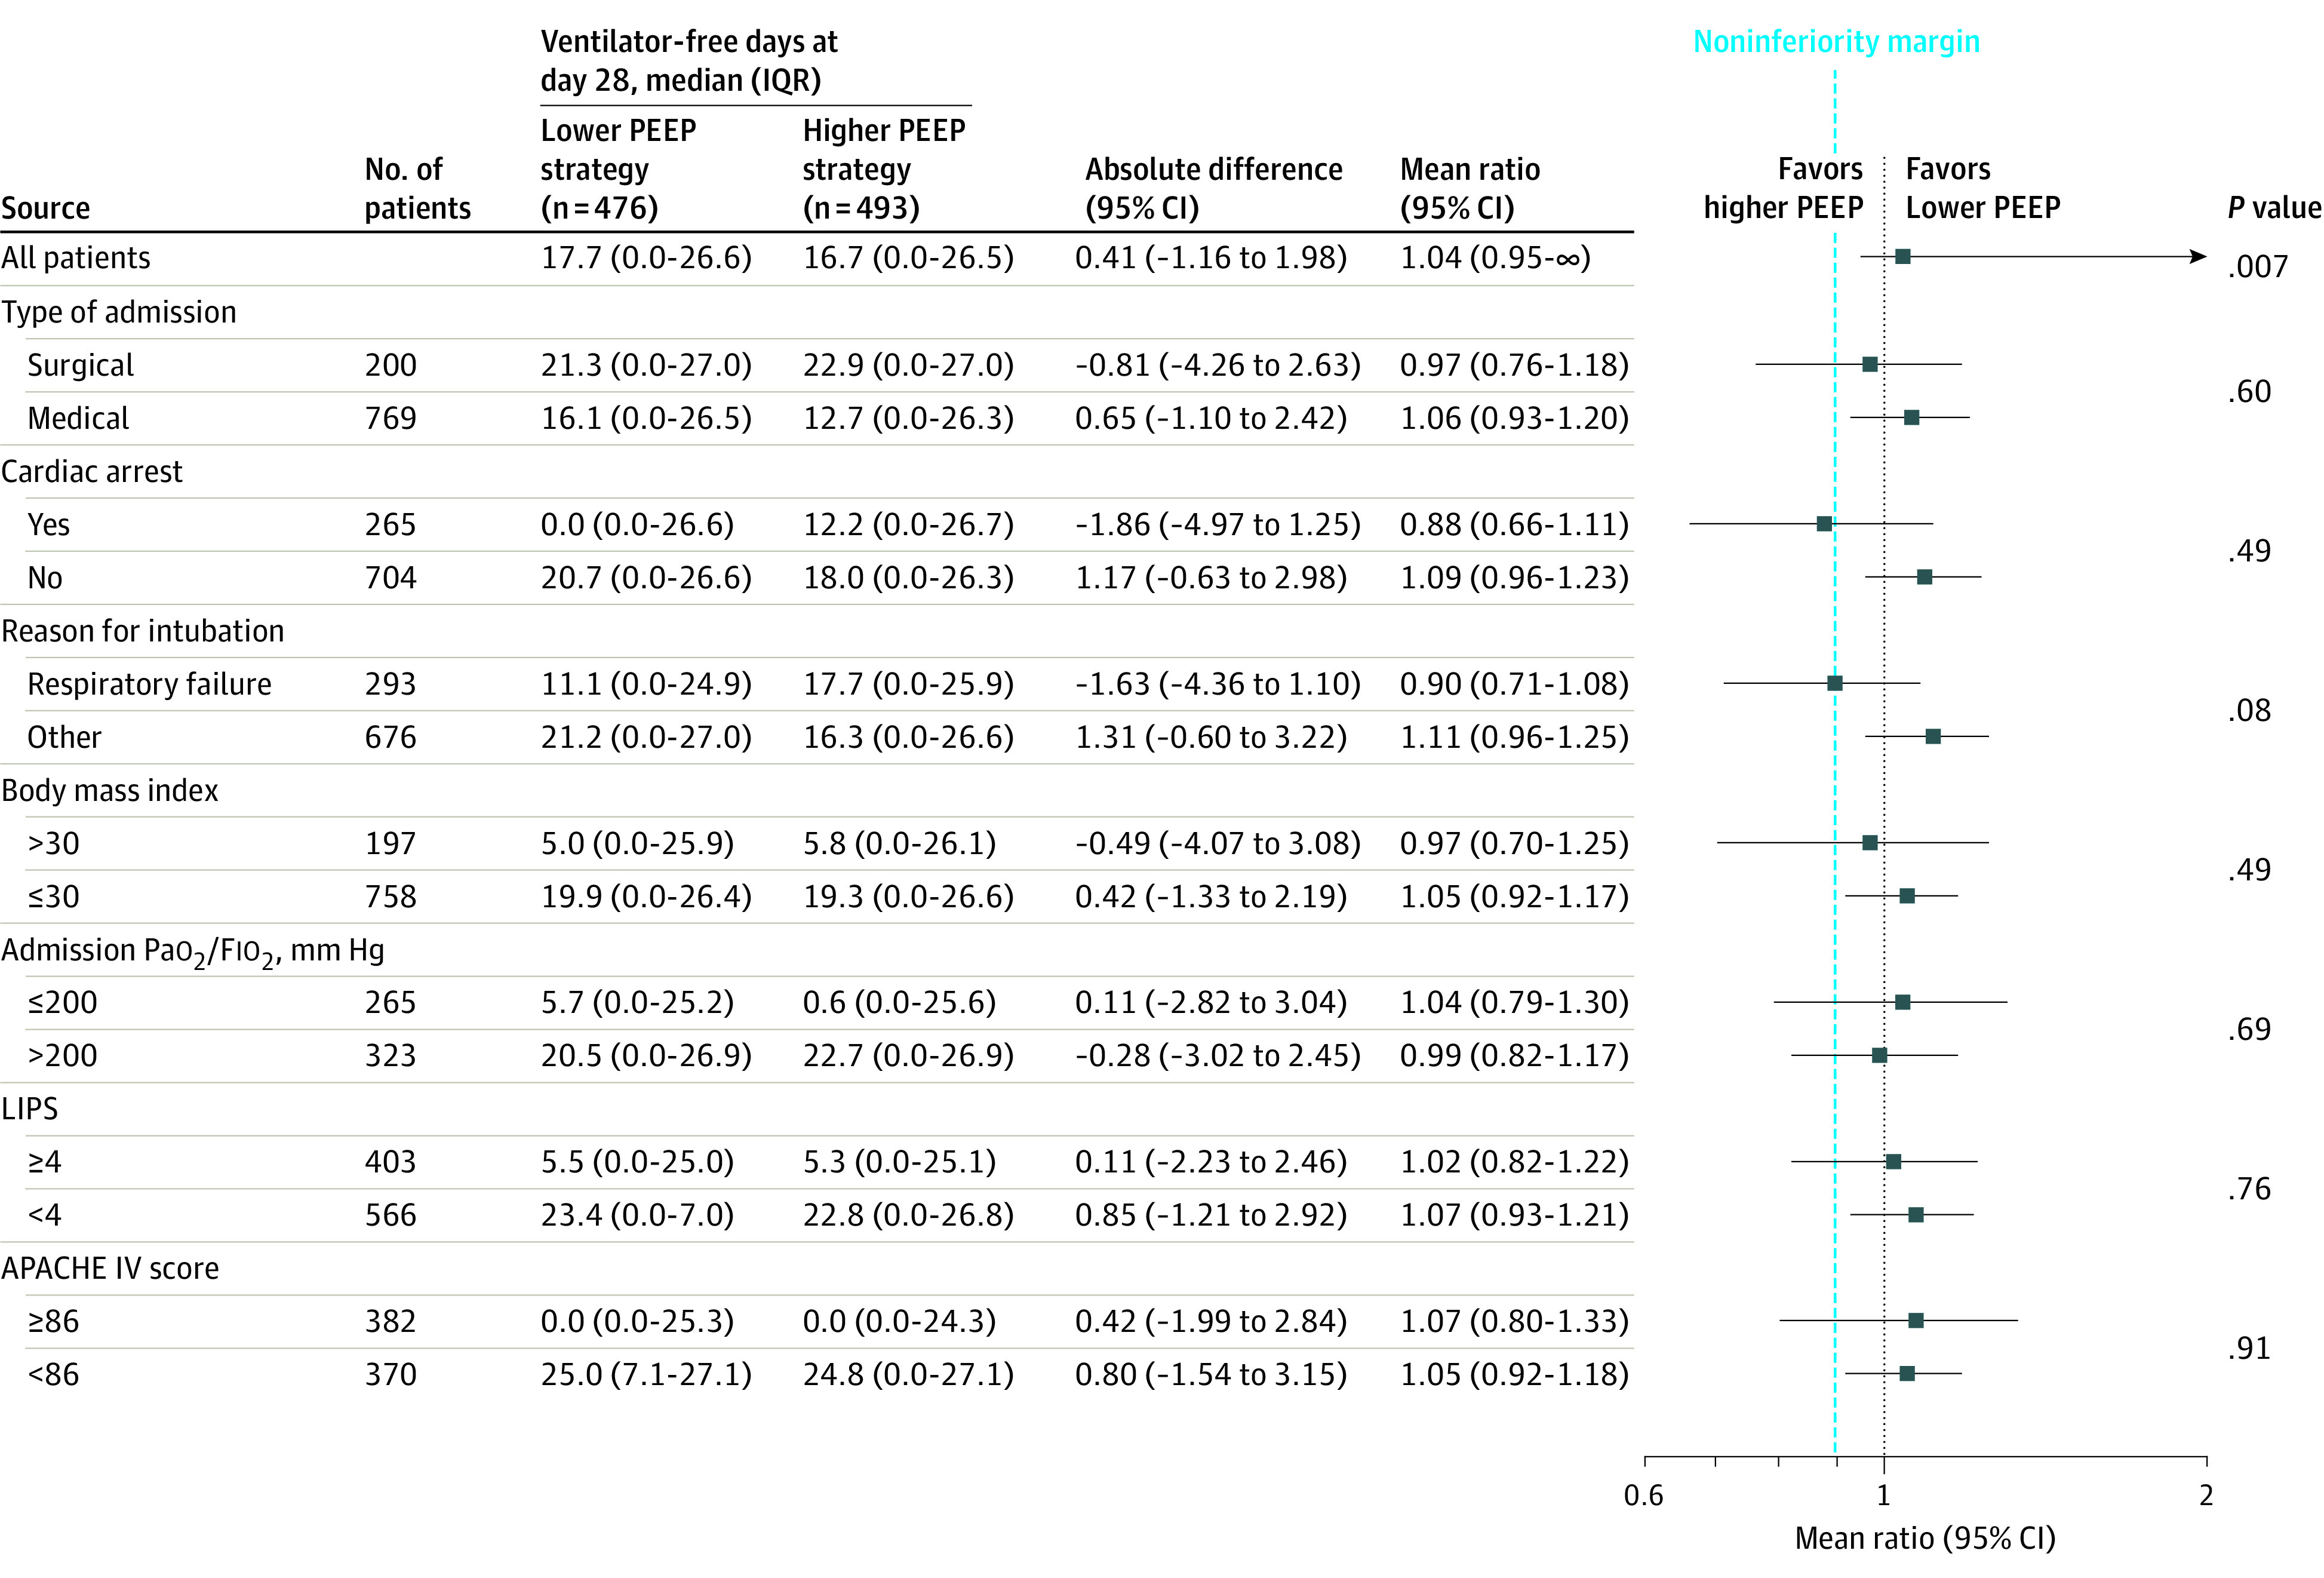
APACHE indicates Acute Physiology and Chronic Health Evaluation (range, 0-286; higher scores indicate more severe disease and higher risk of death); Fio2, fraction of inspired oxygen; IQR, interquartile range; LIPS, Lung Injury Protection Score (range, 0-32.5; higher scores indicate more severe condition and higher risk of acute respiratory distress syndrome); PEEP, positive end-expiratory pressure. Body mass index is calculated as weight in kilograms divided by height in meters squared. The primary outcome is the mean ratio (with 1-sided 95% CI) for the comparison of ventilator-free days at day 28 between the lower and higher PEEP groups, with the noninferiority margin set at 0.90. Absolute differences are mean differences. P values shown are from the β-binomial part of the model. P values for interaction for the binary logistic regression for 0 ventilator-free days at 28 days are P = .62 for type of admission, P = .14 for cardiac arrest, P = .22 for reason for intubation, P = .74 for body mass index, P = .66 for Pao2/Fio2, P = .65 for LIPS, and P = .74 for APACHE IV score.
Table 2. Secondary Outcomes.
| Outcomes | Lower PEEP (n = 476)a | Higher PEEP (n = 493)a | Absolute difference (95% CI) | Effect estimate (95% CI) | P valueb |
|---|---|---|---|---|---|
| Duration of ventilation among survivors, d | 0.67 (−0.47 to 1.81)c | 0.93 (0.79 to 1.09)d | .99 | ||
| Mean (SD) | 5.5 (7.4) | 4.8 (6.6) | |||
| Median (IQR) | 2.0 (0.8-6.8) | 2.0 (1.0-5.7) | |||
| ARDS, No. (%) | 13 (2.7) | 5 (1.0) | 1.72 (0.04 to 3.60)e | 2.70 (0.97 to 7.49)f | .86 |
| Ventilator-associated pneumonia, No. (%) | |||||
| Suspected | 10 (2.1) | 10 (2.0) | 0.07 (−1.78 to 1.95)e | 1.03 (0.43 to 2.46)f | .99 |
| Confirmed | 6 (1.3) | 7 (1.4) | −0.16 (−1.70 to 1.38)e | 0.89 (0.30 to 2.62)f | .99 |
| Severe atelectasis, No. (%) | 20 (4.2) | 15 (3.0) | 1.16 (−1.21 to 3.61)e | 1.38 (0.71 to 2.66)f | .99 |
| Severe hypoxemia, No. (%) | 98 (20.6) | 87 (17.6) | 2.94 (−2.01 to 7.91)e | 1.17 (0.90 to 1.51)f | .99 |
| Pneumothorax, No. (%) | 19 (4.0) | 12 (2.4) | 1.56 (−0.66 to 3.89)e | 1.64 (0.81 to 3.34)f | .99 |
| Need for rescue therapy, No. (%) | 94 (19.7) | 72 (14.6) | 5.14 (0.40 to 9.91)e | 1.35 (1.02 to 1.79)f | .54 |
| Recruitment maneuvers | 62 (13.0) | 39 (7.9) | 5.11 (1.28 to 9.02)e | 1.64 (1.12 to 2.41)f | NRg |
| Prone positioning | 25 (5.3) | 29 (5.9) | −0.63 (−3.56 to 2.29)e | 0.89 (0.53 to 1.50)f | NRg |
| Bronchoscopy for atelectasis | 30 (6.3) | 26 (5.3) | 1.03 (−1.93 to 4.03)e | 1.19 (0.72 to 1.99)f | NRg |
| Days with continuous use of vasopressors | 0.05 (−0.41 to 0.51)c | 0.05 (−0.41 to 0.51)h | .99 | ||
| Mean (SD) | 3.1 (3.7) | 3.1 (3.5) | |||
| Median (IQR) | 2.0 (1.0-4.0) | 2.0 (1.0-3.0) | |||
| Days with continuous use of sedation | 0.22 (−0.27 to 0.71)c | 0.22 (−0.27 to 0.71)h | .99 | ||
| Mean (SD) | 3.5 (3.9) | 3.3 (3.8) | |||
| Median (IQR) | 2.0 (1.0-4.0) | 2.0 (1.0-4.0) | |||
| Length of stay | |||||
| Intensive care unit | 0.81 (−0.57 to 2.18)c | 0.97 (0.83 to 1.13)d | .99 | ||
| Mean (SD) | 8.1 (11.5) | 7.2 (10.3) | |||
| Median (IQR) | 4.0 (2.0-10.0) | 4.0 (2.0-8.0) | |||
| Hospital | 0.94 (−1.81 to 3.70)c | 1.01 (0.86 to 1.20)d | .99 | ||
| Mean (SD) | 19.9 (22.1) | 19.0 (21.4) | |||
| Median (IQR) | 12.0 (5.0-26.2) | 12.0 (4.0-24.0) | |||
| Mortality, No./total (%) | |||||
| Intensive care unit | 163/476 (34.2) | 185/492 (37.6) | −3.36 (−9.38 to 2.69)e | 0.91 (0.77 to 1.08)f | .99 |
| Hospital | 185/472 (39.2) | 208/489 (42.5) | −3.34 (−9.54 to 2.88)e | 0.92 (0.79 to 1.07)f | .99 |
| 28 d | 183 (38.4) | 207 (42.0) | −3.54 (−9.70 to 2.63)e | 0.89 (0.73 to 1.09)d | .99 |
| 90 d | 196/471 (41.6) | 218/492 (44.3) | −2.70 (−8.93 to 3.56)e | 0.92 (0.76 to 1.11)d | .99 |
Abbreviations: ARDS, acute respiratory distress syndrome; IQR, interquartile range; PEEP, positive end-expiratory pressure.
Percentages may not total 100% because of rounding.
Adjusted P values using Holm-Bonferroni procedure for multiple statistical tests controlling for the 16 comparisons. Unadjusted P values are shown in eTable 7 in Supplement 3.
Absolute difference is mean difference.
Effect estimate is hazard ratio (2-sided 95% CI) from a Cox proportional hazard model. P values for Schoenfeld residuals are P = .14 for duration of ventilation among survivors, P = .85 for intensive care unit length of stay, P = .91 for hospital length of stay, P = .90 for 28-day mortality, and P = .89 for 90-day mortality.
Absolute difference is risk difference.
Effect estimate is risk ratio (2-sided 95% CI) by Wald likelihood ratio approximation test and with χ2 hypothesis tests.
Not reported (NR) because it is not a secondary outcome but is a component of the need for rescue therapy.
Effect estimate is mean difference (2-sided 95% CI) from a generalized linear model with Gaussian distribution.
Figure 4. Kaplan-Meier Estimates for Patients in the Lower PEEP and Higher PEEP Groups.
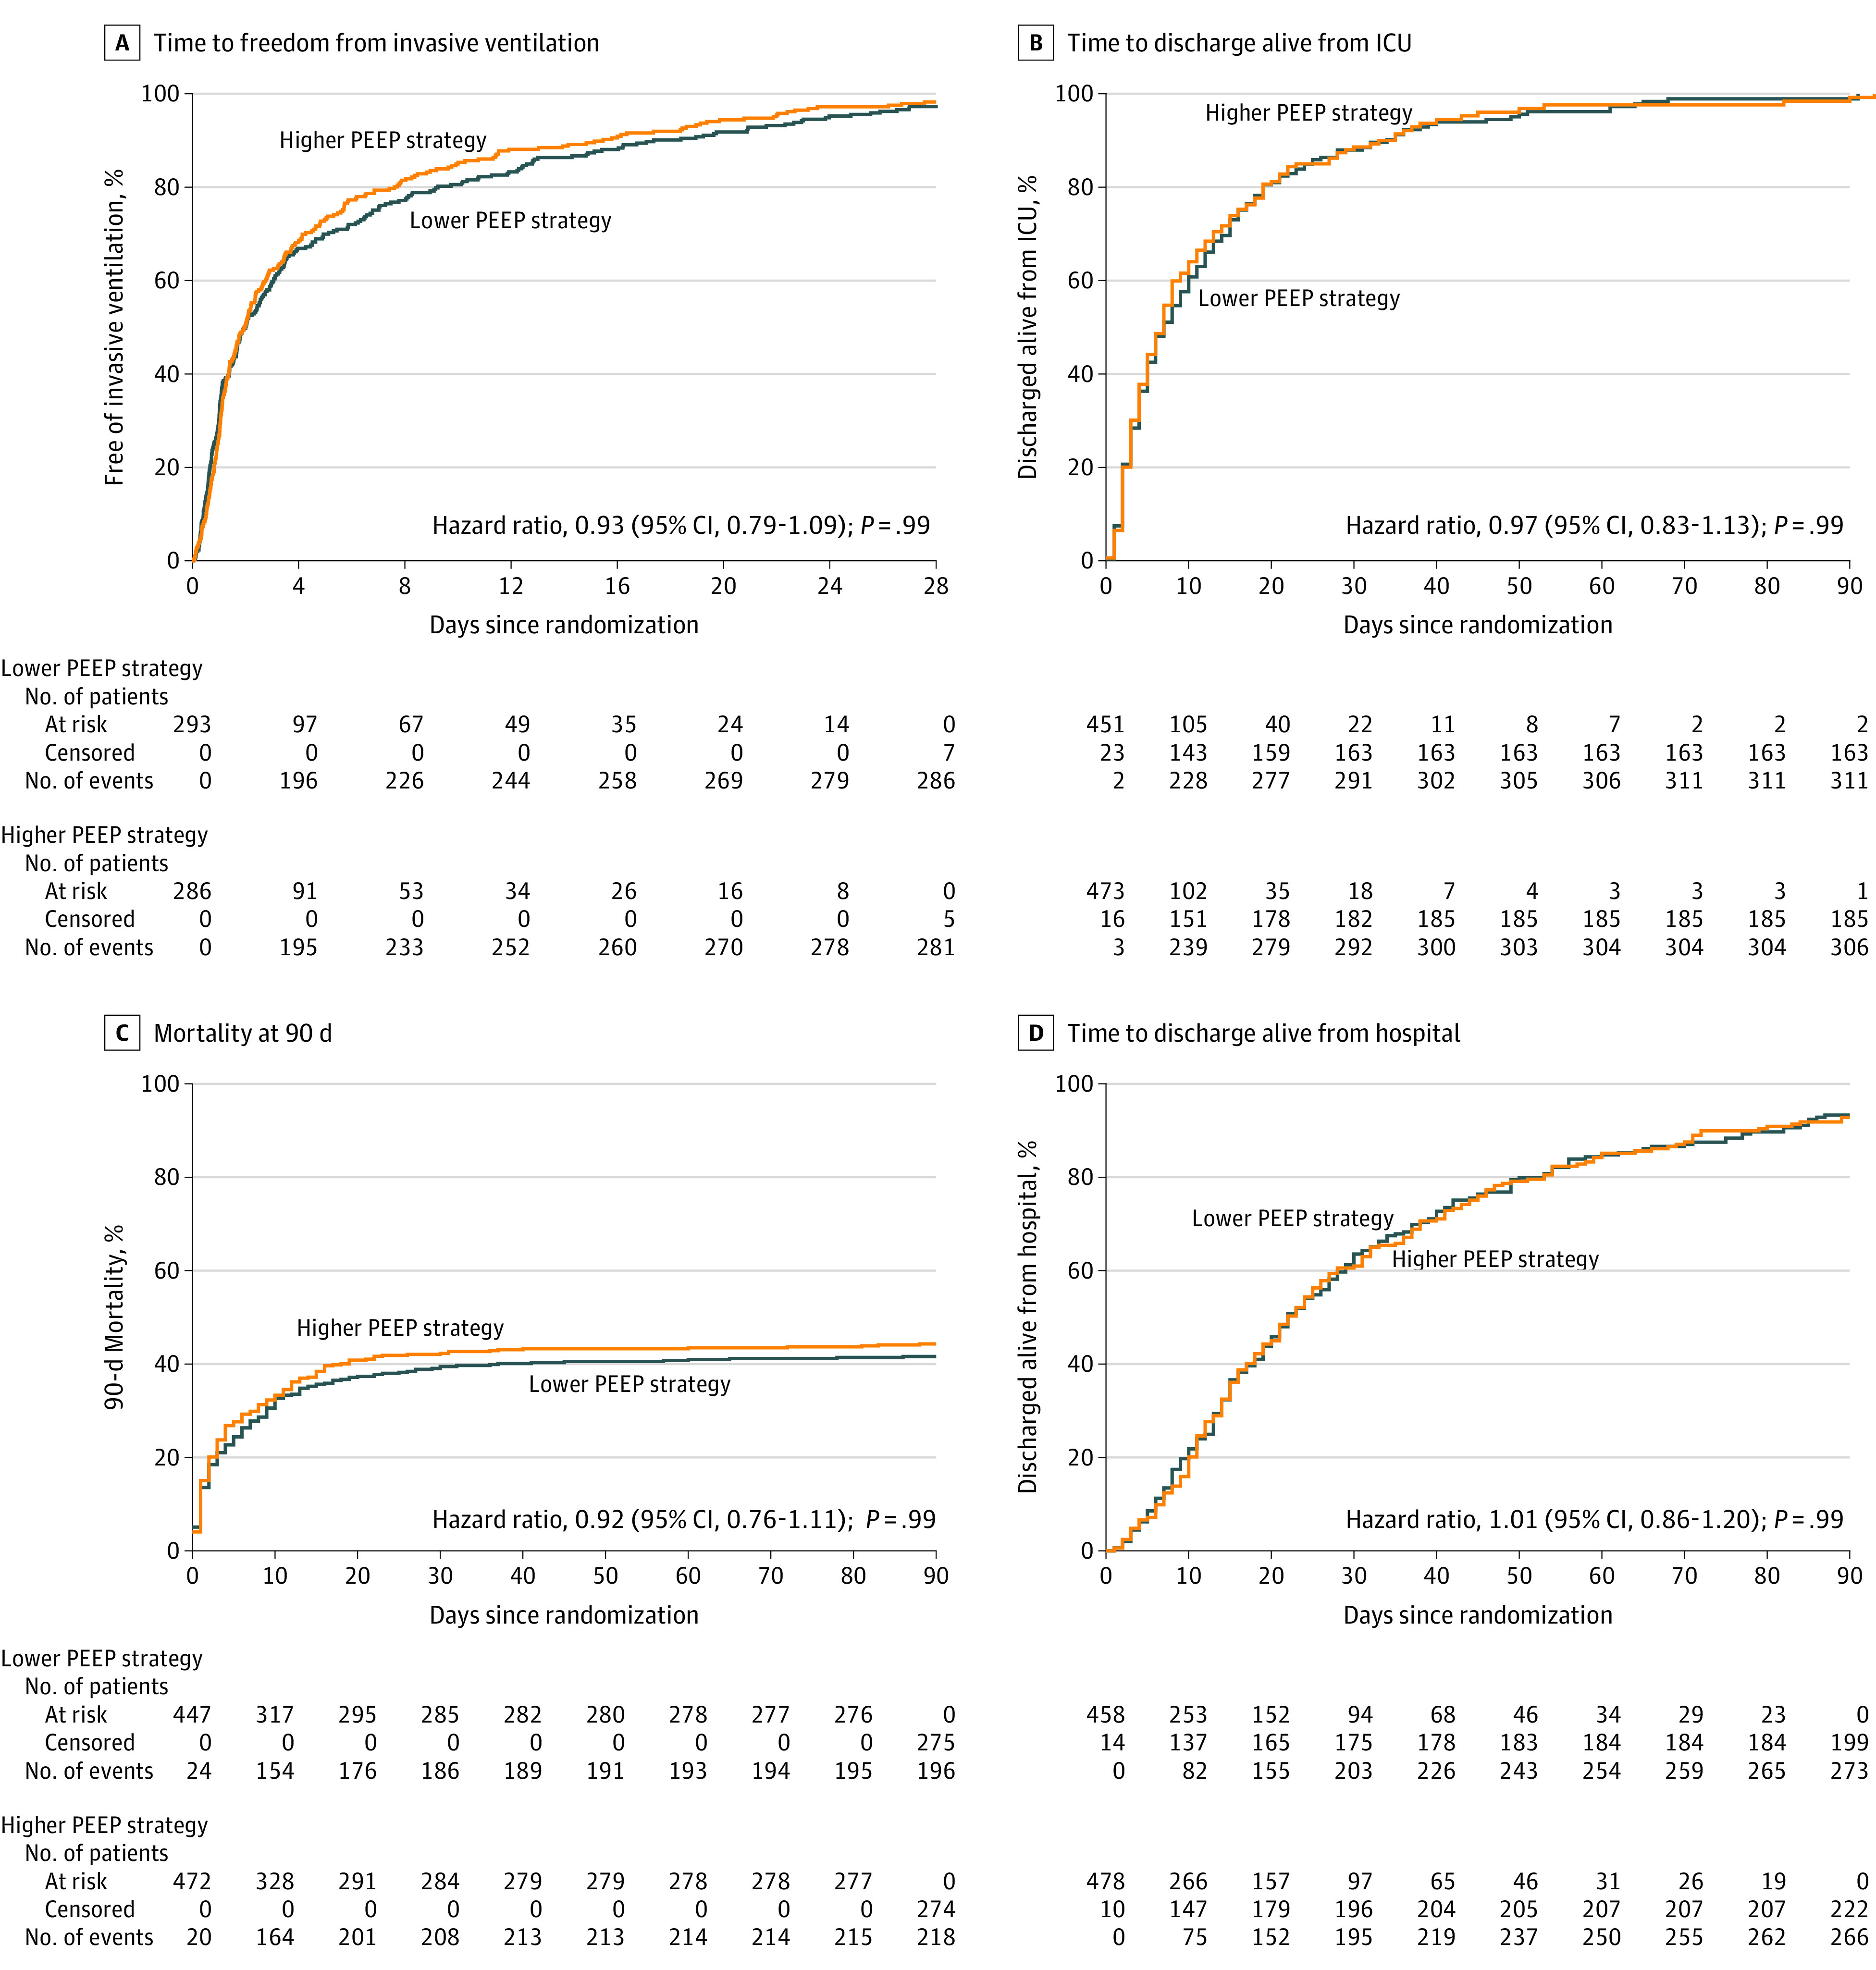
ICU, intensive care unit; IQR, interquartile range; PEEP, positive end-expiratory pressure. For each panel, an unadjusted hazard ratio and 95% CI calculated from a Cox proportional hazard model is presented. A, The median observation period for time to freedom from invasive ventilation was 2.0 (IQR, 1.7-2.6) days for the lower PEEP group and 2.0 (IQR, 1.6-2.4) days for the higher PEEP group; P = .14 for Schoenfeld residuals. B, The median observation period for time to discharge alive from the ICU was 7.0 (IQR, 6.0-9.0) days for the lower PEEP group and 7.0 (IQR, 6.0-8.0) days for the higher PEEP group; P = .85 for Schoenfeld residuals. C, The median observation time for 90-day mortality was not computed because the minimum observed value was 0.44 days; P = .89 for Schoenfeld residuals. D, The median observation period for time to discharge alive from the hospital was 22.0 (IQR, 20.0-27.0) days for the lower PEEP group and 22.0 (IQR, 20.0-25.0) for the higher PEEP group; P = .91 for Schoenfeld residuals.
There was no statistically significant difference in the occurrence of ARDS, VAP, pneumothorax, or severe atelectasis or in days with use of vasopressors or sedatives between groups (Table 2; eTable 7 in Supplement 3). Occurrence of severe hypoxemia was 20.6% vs 17.6% (risk ratio, 1.17; 95% CI, 0.90-1.51; P = .99) and need for rescue strategy was 19.7% vs 14.6% (risk ratio, 1.35; 95% CI, 1.02-1.79; adjusted P = .54) among patients in the lower and higher PEEP groups, respectively (Table 2).
There was no significant interaction in the effect of PEEP on the primary outcome according to prespecified subgroups (Figure 3).
Discussion
In this trial of adult patients in the ICU without ARDS who received invasive ventilation and were expected not to be extubated within 24 hours, a ventilation strategy using lower PEEP was noninferior to a strategy using higher PEEP with respect to the number of ventilator-free days at day 28. In addition, there was no statistically significant difference in ICU and hospital lengths of stay, mortality rate, or occurrence of pulmonary complications between the groups. There was also no statistically significant difference in use of vasopressors or sedatives.
To our knowledge, this is the largest randomized clinical trial addressing whether a ventilation strategy using lower PEEP is noninferior to a ventilation strategy using higher PEEP in patients without ARDS using a relevant patient-centered outcome. The composite end point was chosen because it reflects duration of ventilation among surviving patients as well as 28-day mortality.21,23 A noninferiority design was chosen because higher levels of PEEP have been increasingly used in ICUs in recent years3,4,5,6,24 despite lack of evidence for benefit or harm.5 It may not be better to use a lower PEEP strategy, but it could be as good as higher PEEP. Thus, in this study we did not test the superiority of lower PEEP but, rather, whether lower PEEP is noninferior to higher PEEP.
This study has several strengths. It was designed to minimize bias by using concealed allocation and by analyzing patients according to their randomized group following a clear protocol that was strictly adhered to. Furthermore, loss to follow-up was minimal and both academic and nonacademic centers participated, contributing to its generalizability. To minimize a possible carryover effect, randomization was performed within 1 hour after start of ventilation in the ICU. Patients were enrolled over a period of 2 years, during which standardized care did not change.
This study adds information to previous studies. With the use of higher PEEP, oxygenation improved and driving pressure decreased in the first days, as found in meta-analyses of patients with and without ARDS.2,5,25 In patients with moderate to severe ARDS, 1 meta-analysis suggested mortality benefit with higher PEEP, but a recent randomized clinical trial showed harm.26
In a meta-analysis of patients with mild ARDS, higher PEEP did not improve survival and even prolonged the duration of weaning.2 In a meta-analysis of patients without ARDS, higher PEEP resulted in decreased incidence of ARDS and hypoxemia.5 However, the overall quality of evidence in that meta-analysis was low. In the present study, which enrolled patients who did not have ARDS but who potentially had lung injury, a strategy using lower PEEP was noninferior to a strategy using higher PEEP with regard to 1 important patient-centered outcome.
In contrast to results from a Spanish randomized clinical trial,7 the present study did not find a reduction in VAP during ventilation with higher PEEP compared with lower PEEP. The incidence of VAP reported in this study was 1.3%, much lower than previously reported. Factors that could explain this finding include that nurses in the participating centers performed standard airway care and that all centers used infection prevention strategies against VAP, including selective digestive decontamination.27
The finding of a lower Fio2 and higher oxygenation in patients with higher PEEP could be explained by better aeration.28 However, incidence of severe atelectasis was similar between the groups. It is possible that in some patients, a benefit of higher PEEP with respect to less atelectasis was nullified by coinciding overdistension. This was also suggested in studies comparing lower PEEP with higher PEEP during intraoperative ventilation.12,13 There were no statistically significant differences in development of ARDS, and after adjustment for multiple comparisons, there was no statistically significant difference in the need for rescue strategies between the groups. However, the point estimate for the percentage requiring rescue strategies was greater in the lower PEEP group, and the study may have been underpowered to detect a statistically significant difference.
Limitations
This study has several limitations. First, blinding was not possible because of the nature of the intervention. However, there were no differences in local guidelines for respiratory care, rescue therapies, or sedation practices, and local health care workers did not show specific interest in the trial or its primary outcome. Second, some patients were missed because of screening failures, possibly because of the very short time between start of invasive ventilation and randomization. Third, although the protocol foresaw randomization within 1 hour after start of ventilation in the ICU, this was not always possible. However, the majority of patients were randomized within 1 hour, which is a relatively short period compared with the duration of ventilation after randomization. Fourth, a heterogeneous group of patients without ARDS was included, but subgroup analyses did not reveal any interaction. Fifth, although the other disease severity scores were comparable between the 2 groups, APACHE IV scores were higher in the higher PEEP group. However, an analysis adjusted for APACHE IV scores showed results similar to the primary analysis. Sixth, this study compared a ventilation strategy using lower PEEP with one using a PEEP of 8 cm H2O. Although a PEEP of 8 cm H2O may not be standard care, it is increasingly used in ICU patients without ARDS, as shown in several observational studies3,4,5,6,24 and recent clinical trials.20,22
Conclusions
Among patients in the ICU without ARDS who were expected not to be extubated within 24 hours, a lower PEEP strategy was noninferior to a higher PEEP strategy with regard to the number of ventilator-free days at day 28. These findings support the use of lower PEEP in patients without ARDS.
Trial Protocol
Statistical Analysis Plan
eAppendix 1. List of Committees, Investigators, and Study Sites
eAppendix 2. Supplementary Methods
eTable 1. Definitions of Secondary Outcomes
eTable 2. Daily Ventilatory Variables, Arterial Blood Gases and Vital Signs in the First Three Days after Randomization
eTable 3. Daily Sedation, Fluids, Transfusion and Vasopressors
eTable 4. Adherence to the Protocol With Respect to PEEP, FiO2 and SpO2 in the First Five Days
eTable 5. Per-Protocol Analysis of the Primary Outcome
eTable 6. Adjusted Analyses for the Primary and Secondary Outcomes
eTable 7. Significance Levels for Secondary Outcomes in Table 2 of Paper After Correction for Multiple Comparisons
eFigure 1. Flowchart of Ventilator Settings in the Two Ventilation Strategies
eFigure 2. Mean, Highest and Lowest PEEP in the First Five Days According to the Allocation Group
eFigure 3. Mean, Highest and Lowest FiO2 in the First Five Days According to the Allocation Group
eFigure 4. Mean, Highest and Lowest SpO2 in the First Five Days According to the Allocation Group
eFigure 5. Mean, Highest and Lowest SpO2/FiO2 in the First Five Days According to the Allocation Group
eFigure 6. Mean Tidal Volume, Driving Pressure, PaO2/FiO2 and PaCO2 in the First Five Days According to the Allocation Group
eFigure 7. Mean Heart Rate and Mean Arterial Pressure in the First Five Days According to the Allocation Group
eFigure 8. Cumulative Distribution of PEEP in the First Three Days According to the Allocation Group
eFigure 9. Cumulative Distribution of FiO2 in the First Three Days According to the Allocation Group
eFigure 10. Cumulative Distribution of SpO2 in the First Three Days According to the Allocation Group
eFigure 11. Ventilatory Modes in the First Five Days According to the Allocation Group
eFigure 12. Percentage of Patients in Each Group of PEEP in the First Three Days According to the Allocation Group
eFigure 13. Percentage of Patients in Each Group of SpO2 in the First Three Days According to the Allocation Group
eFigure 14. Percentage of Patients in Each Group of FiO2 in the First Three Days According to the Allocation Group
eFigure 15. Cumulative Fluid Balance in the First Five Days According to the Allocation Group
eFigure 16. Patients Who Survived and Were Extubated During the First 28 Days After Randomization
eFigure 17. Patients Who Survived and Were Discharged Alive From the ICU and Hospital During the First 28 Days After Randomization
eFigure 18. Kaplan-Meier Estimates for Patients in the Lower and Higher PEEP Groups
eReferences
Data Sharing Statement
Section Editor: Christopher Seymour, MD, Associate Editor, JAMA (christopher.seymour@jamanetwork.org).
References
- 1.Slutsky AS, Ranieri VM. Ventilator-induced lung injury. N Engl J Med. 2014;370(10):980-980. doi: 10.1056/NEJMc1400293 [DOI] [PubMed] [Google Scholar]
- 2.Briel M, Meade M, Mercat A, et al. Higher vs lower positive end-expiratory pressure in patients with acute lung injury and acute respiratory distress syndrome: systematic review and meta-analysis. JAMA. 2010;303(9):865-873. doi: 10.1001/jama.2010.218 [DOI] [PubMed] [Google Scholar]
- 3.Esteban A, Frutos-Vivar F, Muriel A, et al. Evolution of mortality over time in patients receiving mechanical ventilation. Am J Respir Crit Care Med. 2013;188(2):220-230. doi: 10.1164/rccm.201212-2169OC [DOI] [PubMed] [Google Scholar]
- 4.Neto AS, Barbas CSV, Simonis FD, et al. ; PRoVENT and PROVE Network Investigators . Epidemiological characteristics, practice of ventilation, and clinical outcome in patients at risk of acute respiratory distress syndrome in intensive care units from 16 countries (PRoVENT): an international, multicentre, prospective study. Lancet Respir Med. 2016;4(11):882-893. doi: 10.1016/S2213-2600(16)30305-8 [DOI] [PubMed] [Google Scholar]
- 5.Serpa Neto A, Filho RR, Cherpanath T, et al. ; PROVE Network Investigators . Associations between positive end-expiratory pressure and outcome of patients without ARDS at onset of ventilation: a systematic review and meta-analysis of randomized controlled trials. Ann Intensive Care. 2016;6(1):109. doi: 10.1186/s13613-016-0208-7 [DOI] [PMC free article] [PubMed] [Google Scholar]
- 6.Peñuelas O, Muriel A, Abraira V, et al. Inter-country variability over time in the mortality of mechanically ventilated patients. Intensive Care Med. 2020;46(3):444-453. doi: 10.1007/s00134-019-05867-9 [DOI] [PMC free article] [PubMed] [Google Scholar]
- 7.Manzano F, Fernández-Mondéjar E, Colmenero M, et al. Positive-end expiratory pressure reduces incidence of ventilator-associated pneumonia in nonhypoxemic patients. Crit Care Med. 2008;36(8):2225-2231. doi: 10.1097/CCM.0b013e31817b8a92 [DOI] [PubMed] [Google Scholar]
- 8.Vreugdenhil HA, Heijnen CJ, Plötz FB, et al. Mechanical ventilation of healthy rats suppresses peripheral immune function. Eur Respir J. 2004;23(1):122-128. doi: 10.1183/09031936.03.00035003 [DOI] [PubMed] [Google Scholar]
- 9.Carvalho ARS, Jandre FC, Pino AV, et al. Effects of descending positive end-expiratory pressure on lung mechanics and aeration in healthy anaesthetized piglets. Crit Care. 2006;10(4):R122-R128. doi: 10.1186/cc5030 [DOI] [PMC free article] [PubMed] [Google Scholar]
- 10.Villar J, Herrera-Abreu MT, Valladares F, et al. Experimental ventilator-induced lung injury: exacerbation by positive end-expiratory pressure. Anesthesiology. 2009;110(6):1341-1347. doi: 10.1097/ALN.0b013e31819fcba9 [DOI] [PubMed] [Google Scholar]
- 11.Collino F, Rapetti F, Vasques F, et al. Positive end-expiratory pressure and mechanical power. Anesthesiology. 2019;130(1):119-130. doi: 10.1097/ALN.0000000000002458 [DOI] [PubMed] [Google Scholar]
- 12.Hemmes SN, Gama de Abreu M, Pelosi P, Schultz MJ; PROVE Network Investigators for the Clinical Trial Network of the European Society of Anaesthesiology . High versus low positive end-expiratory pressure during general anaesthesia for open abdominal surgery (PROVHILO trial): a multicentre randomised controlled trial. Lancet. 2014;384(9942):495-503. doi: 10.1016/S0140-6736(14)60416-5 [DOI] [PMC free article] [PubMed] [Google Scholar]
- 13.Gama de Abreu M, Schultz M, Pelosi P; Writing Committee for the PROBESE Collaborative Group . Intraoperative ventilation strategies to reduce pulmonary complications in obese patients [letter reply]. JAMA. 2019;322(18):1829. doi: 10.1001/jama.2019.14400 [DOI] [PubMed] [Google Scholar]
- 14.Blackwood B, Alderdice F, Burns K, Cardwell C, Lavery G, O’Halloran P. Use of weaning protocols for reducing duration of mechanical ventilation in critically ill adult patients: Cochrane systematic review and meta-analysis. BMJ. 2011;342:c7237-c7237. doi: 10.1136/bmj.c7237 [DOI] [PMC free article] [PubMed] [Google Scholar]
- 15.Algera AG, Pisani L, Bergmans DCJ, et al. ; RELAx Investigators and PROVE Network Investigators . RELAx—Restricted Versus Liberal Positive End-Expiratory Pressure in Patients Without ARDS: protocol for a randomized controlled trial. Trials. 2018;19(1):272. doi: 10.1186/s13063-018-2640-5 [DOI] [PMC free article] [PubMed] [Google Scholar]
- 16.Ranieri VM, Rubenfeld GD, Thompson BT, et al. ; ARDS Definition Task Force . Acute respiratory distress syndrome: the Berlin definition. JAMA. 2012;307(23):2526-2533. doi: 10.1001/jama.2012.5669 [DOI] [PubMed] [Google Scholar]
- 17.Suzuki S, Eastwood GM, Glassford NJ, et al. Conservative oxygen therapy in mechanically ventilated patients: a pilot before-and-after trial. Crit Care Med. 2014;42(6):1414-1422. doi: 10.1097/CCM.0000000000000219 [DOI] [PubMed] [Google Scholar]
- 18.Panwar R, Hardie M, Bellomo R, et al. ; CLOSE Study Investigators; ANZICS Clinical Trials Group . Conservative versus liberal oxygenation targets for mechanically ventilated patients. a pilot multicenter randomized controlled trial. Am J Respir Crit Care Med. 2016;193(1):43-51. doi: 10.1164/rccm.201505-1019OC [DOI] [PubMed] [Google Scholar]
- 19.Girardis M, Busani S, Damiani E, et al. Effect of conservative vs conventional oxygen therapy on mortality among patients in an intensive care unit: the Oxygen-ICU randomized clinical trial. JAMA. 2016;316(15):1583-1589. doi: 10.1001/jama.2016.11993 [DOI] [PubMed] [Google Scholar]
- 20.Simonis FD, Serpa Neto A, Binnekade JM, et al. ; Writing Group for the PReVENT Investigators . Effect of a low vs intermediate tidal volume strategy on ventilator-free days in intensive care unit patients without ARDS: a randomized clinical trial. JAMA. 2018;320(18):1872-1880. doi: 10.1001/jama.2018.14280 [DOI] [PMC free article] [PubMed] [Google Scholar]
- 21.Yehya N, Harhay MO, Curley MAQ, Schoenfeld DA, Reeder RW. Reappraisal of ventilator-free days in critical care research. Am J Respir Crit Care Med. 2019;200(7):828-836. doi: 10.1164/rccm.201810-2050CP [DOI] [PMC free article] [PubMed] [Google Scholar]
- 22.van Meenen DMP, van der Hoeven SM, Binnekade JM, et al. Effect of on-demand vs routine nebulization of acetylcysteine with salbutamol on ventilator-free days in intensive care unit patients receiving invasive ventilation: a randomized clinical trial. JAMA. 2018;319(10):993-1001. doi: 10.1001/jama.2018.0949 [DOI] [PMC free article] [PubMed] [Google Scholar]
- 23.Schoenfeld DA, Bernard GR; ARDS Network . Statistical evaluation of ventilator-free days as an efficacy measure in clinical trials of treatments for acute respiratory distress syndrome. Crit Care Med. 2002;30(8):1772-1777. doi: 10.1097/00003246-200208000-00016 [DOI] [PubMed] [Google Scholar]
- 24.Schaefer MS, Serpa Neto A, Pelosi P, et al. Temporal changes in ventilator settings in patients with uninjured lungs: a systematic review. Anesth Analg. 2019;129(1):129-140. doi: 10.1213/ANE.0000000000003758 [DOI] [PubMed] [Google Scholar]
- 25.Amato MBP, Meade MO, Slutsky AS, et al. Driving pressure and survival in the acute respiratory distress syndrome. N Engl J Med. 2015;372(8):747-755. doi: 10.1056/NEJMsa1410639 [DOI] [PubMed] [Google Scholar]
- 26.Cavalcanti AB, Suzumura ÉA, Laranjeira LN, et al. ; Writing Group for the Alveolar Recruitment for Acute Respiratory Distress Syndrome Trial Investigators . Effect of lung recruitment and titrated positive end-expiratory pressure (PEEP) vs low peep on mortality in patients with acute respiratory distress syndrome: a randomized clinical trial. JAMA. 2017;318(14):1335-1345. doi: 10.1001/jama.2017.14171 [DOI] [PMC free article] [PubMed] [Google Scholar]
- 27.Bos LD, Stips C, Schouten LR, et al. Selective decontamination of the digestive tract halves the prevalence of ventilator-associated pneumonia compared to selective oral decontamination. Intensive Care Med. 2017;43(10):1535-1537. doi: 10.1007/s00134-017-4838-5 [DOI] [PubMed] [Google Scholar]
- 28.Carvalho AR, Spieth PM, Pelosi P, et al. Ability of dynamic airway pressure curve profile and elastance for positive end-expiratory pressure titration. Intensive Care Med. 2008;34(12):2291-2299. doi: 10.1007/s00134-008-1301-7 [DOI] [PMC free article] [PubMed] [Google Scholar]
Associated Data
This section collects any data citations, data availability statements, or supplementary materials included in this article.
Supplementary Materials
Trial Protocol
Statistical Analysis Plan
eAppendix 1. List of Committees, Investigators, and Study Sites
eAppendix 2. Supplementary Methods
eTable 1. Definitions of Secondary Outcomes
eTable 2. Daily Ventilatory Variables, Arterial Blood Gases and Vital Signs in the First Three Days after Randomization
eTable 3. Daily Sedation, Fluids, Transfusion and Vasopressors
eTable 4. Adherence to the Protocol With Respect to PEEP, FiO2 and SpO2 in the First Five Days
eTable 5. Per-Protocol Analysis of the Primary Outcome
eTable 6. Adjusted Analyses for the Primary and Secondary Outcomes
eTable 7. Significance Levels for Secondary Outcomes in Table 2 of Paper After Correction for Multiple Comparisons
eFigure 1. Flowchart of Ventilator Settings in the Two Ventilation Strategies
eFigure 2. Mean, Highest and Lowest PEEP in the First Five Days According to the Allocation Group
eFigure 3. Mean, Highest and Lowest FiO2 in the First Five Days According to the Allocation Group
eFigure 4. Mean, Highest and Lowest SpO2 in the First Five Days According to the Allocation Group
eFigure 5. Mean, Highest and Lowest SpO2/FiO2 in the First Five Days According to the Allocation Group
eFigure 6. Mean Tidal Volume, Driving Pressure, PaO2/FiO2 and PaCO2 in the First Five Days According to the Allocation Group
eFigure 7. Mean Heart Rate and Mean Arterial Pressure in the First Five Days According to the Allocation Group
eFigure 8. Cumulative Distribution of PEEP in the First Three Days According to the Allocation Group
eFigure 9. Cumulative Distribution of FiO2 in the First Three Days According to the Allocation Group
eFigure 10. Cumulative Distribution of SpO2 in the First Three Days According to the Allocation Group
eFigure 11. Ventilatory Modes in the First Five Days According to the Allocation Group
eFigure 12. Percentage of Patients in Each Group of PEEP in the First Three Days According to the Allocation Group
eFigure 13. Percentage of Patients in Each Group of SpO2 in the First Three Days According to the Allocation Group
eFigure 14. Percentage of Patients in Each Group of FiO2 in the First Three Days According to the Allocation Group
eFigure 15. Cumulative Fluid Balance in the First Five Days According to the Allocation Group
eFigure 16. Patients Who Survived and Were Extubated During the First 28 Days After Randomization
eFigure 17. Patients Who Survived and Were Discharged Alive From the ICU and Hospital During the First 28 Days After Randomization
eFigure 18. Kaplan-Meier Estimates for Patients in the Lower and Higher PEEP Groups
eReferences
Data Sharing Statement